1. Introduction
Global projections indicate that, in 2050, there will be approximately 9 billion people who will need a significant volume of resources, especially food, on earth conditioned by global warming [
1]. In this sense, given the pressing situation and the significant impact that economic activity generates on the environment, we are witnessing a gradual change from a linear economic pattern towards a circular economy model [
2,
3].
This ecological transition aims to stop numerous environmental problems such as pollution and climate change; the depletion of non-renewable resources that, at the end of the useful life of the product in which they are integrated, accumulate as unused waste; exploitation above the replacement rate of renewable resources with the consequent deforestation, destruction of habitats and loss of biodiversity, etc. [
4]. To this end, the circular model, being restorative and regenerative, promotes (i) a commitment to renewable energy sources vs. fossil fuels and reused or recycled materials vs. disposable materials; (ii) greater efficiency in the use of materials, water resources, and energy with the consequent reduction in emissions, spills, waste, etc.; and (iii) the prolongation of the use of the products and their recirculation, generating less waste and proper use of the same [
5,
6].
Its adoption in the agricultural and livestock sector is unquestionable, not only because of the positive externalities from an environmental point of view but also because of the economic impacts that the circular economy entails concerning the savings in inputs used and the reduction in risks and price volatility [
7]. In this sense, climate change poses a significant threat to the functioning of agricultural production systems by impoverishing the soil, reducing and even destroying crops, among others, leading in parallel to problems in access to certain foods and increases in the price of these, all of which translate into changes in eating habits towards less healthy diets, malnutrition, and other negative effects on social well-being [
1,
8].
In this framework, the objectives of this work focus on analyzing the degree of ecological transition of agri-food companies concerning the basic principles of the circular economy related to (1) rethinking processes to avoid waste and pollution and (2) prolonging the use of products and materials: avoiding the introduction of elements and substances that damage ecosystems. Additionally, we will analyze whether the degree of circular transition is associated with the company’s investment capacity and the territorial initiatives determined by the geographical area of activity.
In this sense, research such as that of Ref. [
9] indicates that the circular transition of agricultural and livestock companies in the European context is determined by the implementation of circular initiatives aimed at aspects such as energy production and recovery, evaluation of the life cycle of agricultural production, and the use of materials in a cascade type, responding to the basic principles of circular economy for the agricultural and livestock sector [
5]. The achievement of these general initiatives of the circular model is determined by the degree of implementation of specific initiatives, such as the use of green technologies and energy recovery systems [
2,
10,
11], the development of systems for monitoring or monitoring of greenhouse gas (GHG, hereinafter) and carbon dioxide (CO
2, hereinafter) emissions [
9,
12], the development of eco-innovations and eco-designs in processes and products [
13,
14], obtaining of environmental quality and animal welfare certifications [
12], the mitigation of polluting emissions to water sources [
6,
15,
16], the use of waste of animal origin [
14], the preservation of forests and biodiversity [
6,
12] and recycling of materials [
12].
Additionally, the results of Ref. [
7] indicate that the investment and recovery time of the investment in energy recovery initiatives from waste management are adequate for companies in the agricultural and livestock sector in the transition towards a circular negotiated model. Also, Ref. [
17] considered a self-financing investment scheme for the development of energy self-sufficiency projects in wine plantations, finding a satisfactory return on investment and identifying an alternative to obtaining income from the sale of the energy surplus obtained for agricultural and livestock companies. Furthermore, the empirical evidence from Ref. [
14] indicates that economic investment in circular innovation initiatives or micro projects within agricultural and livestock companies generates a substantial return on investment for entrepreneurs.
In addition to the above, Refs. [
9,
18] show that government support or initiatives are an important pillar for the establishment of circular initiatives in companies with a presence in the EU; thus, the establishment of government policies is an accelerating factor in the degree of advancement of the corporate agricultural and livestock transition towards circularity.
In this sense, based on a sample of the 84 largest Spanish agricultural and livestock companies, we analyze general and specific circular initiatives based on the basic principles of the circular economy related to non-polluting energy; eco-design and eco-innovation, protection of water resources, and waste management and care of ecosystems. Investing capacity is associated with investment in capital and intangible assets of the company, access to public funds through obtaining subsidies, and financial autonomy.
Regarding the considerations of the Spanish territory, it is a consequence of the importance of the primary sector, both from an economic, social, and environmental point of view at a global level. This sector represents 2.7% of GDP. Spanish agricultural and livestock farms are productions with a high export character. More specifically, Spain, with a figure of EUR 68,018 million and an export share of 9.9%, remained the fourth-largest exporter of agri-food and fishing goods in the EU27 in 2022 [
19]. Additionally, from the point of view of export location, in Spain, there are 17 autonomous communities (CCAA) with different weights in this sector (i.e., in 7 of them, their weight is less than 2%) and, as a consequence, with initiatives and policies that lead to the promotion of this sector as strategic due to its added impact on the creation of jobs and the curb on rural depopulation.
The use of multivariate methods is very useful in this field, as shown by works such as those of Ref. [
20]. In this sense, the ordinal logistic biplot has proven to be very useful for categorical data in works such as those of Refs. [
21,
22] and has been compared with multiple correspondence analysis (MCA), one of the most widespread techniques in the treatment of categorical data, which shows that it is capable of providing information as valuable as that of the MCA; however, it eliminates superfluous information from the graph, places the category points in the prediction regions, better-classifies individuals according to the profile they present in the data, and abstracts from interpretations based on average profiles since the reading of the final graph is based on the proximity between its elements. The results of this method allow a representation of multivariate data in a factorial plane, whose calculations lead to a simple graphic representation, in which only those categories that are predicted probabilistically are visible, whose interpretation is based on Euclidean distances between points and on which projections are not necessary. Thus, this method will allow us, in a language accessible to researchers in the field of circular economy and by prioritizing visual results, to analyze the degree of circular transition of agricultural and livestock companies in Spain.
The contributions of our findings to the previous literature are several, concerning the paper addresses several gaps related to the ecological transition of the primary sector, adopting a unique theoretical approach based on the basic principles of the circular economy in the agricultural and livestock crops and using a graphical methodology that allows identifying the particularities of each analyzed firms, obtaining evidence at a micro level with a higher potential impact on both the academic and practical fronts.
Firstly, for the economic and business fields, we provide an overview of the current state and the challenges that remain to be addressed in the transition towards a circular economic model of a primary sector for human subsistence, such as farming. In this vein, our results serve as a reference for academics to improve the current knowledge and the theoretical advancement of the circular economic model in the primary sector. More specifically, we have identified the different circular initiatives in the production of agricultural and livestock crops relating to the basic principles of the circular economy related to rethinking processes and prolonging the use of products and materials, protecting ecosystems. In addition, we observe the association of the degree of circular transition with the company’s investment capacity and with territorial initiatives, explaining the conditions and drivers of the development experienced in the adoption of circular models.
Secondly, under the approach of an economic model whose basis is the care and preservation of finite natural resources and endemic species, the results of the circular transition of the Spanish agricultural and livestock sector can serve as a reference for environmentalists interested in the promotion of appropriate sectoral practices. In this sense, our evidence contributes to delving deeper into the implementation of circular models and transition strategies to guarantee the sustainability of agricultural and livestock activities in the different stages of their life cycle in a context that requires richness and diversity of analytical approaches to achieve an adequate circular transition and industrial strengthening. Moreover, we provide an economic model based on the care and preservation of natural resources, where we identify business initiatives that respond punctually to the conservation and protection of physical and living components of the natural environment, such as climate, surface and underground waters, soil, fauna, and flora from a reflective perspective of business activities with the purpose that they continue to grow and contribute to the integral development of the territories and their inhabitants.
Additionally, we highlight potential broader implications for policy and practice in the primary sector. In this vein, we have observed a relevant investment in circular initiatives associated with the use of non-polluting energy, eco-design, eco-innovation, management, and care of ecosystems. In contrast, firms need to improve their commitment to protecting water resources, and in this vein, it is advisable to promote public policies and research that advances efficient water management.
Finally, for the statistical field, we demonstrate the usefulness that multivariate methods have in decision-making processes by allowing an individualized and detailed analysis of the variables analyzed and the relationships between them. In the economic and sustainable fields, the empirical analyses are strongly related to the regression approach. Models that explain the relationship between several variables with a global approach that does not allow the identification of the particularities of each analyzed firm or organization. In this vein, these multivariate approaches favor the knowledge of the relationship and the different situations of the variables and companies. So, our research demonstrates the utility of multivariate graphical methodologies in the study of economic and sustainable decision making for academics. In addition, these techniques increase the knowledge of the firms relating to the position of its competitors and favor that the politicians of the Spanish region develop strategies to improve the sustainable investment of the main firms of these geographic zones.
2. Method: Materials and Methodology
2.1. Sample
To determine the sample of analysis, we use two criteria. The first is income, one of the accounting items utilized to determine the size of the firms due to measuring the volume of its economic activities [
8,
20]. The second criterion is the consideration of the highest 100 companies. The top 100 corresponds to a common approach in international comparative rankings (Examples: Best Global Brands 2023 of Interbrand (
https://interbrand.com/best-brands/, accessed on 5 January 2024) or the Global Top 100 companies by market capitalization of PWC (
https://www.pwc.es/es/auditoria/assets/pwc-global-top-100-companies-2021.pdf, 5 January 2024) due to it allows us to know the practices of the most valuable firms.
So, the initial sample is made up of the 100 companies with the highest income in the primary sector in Spain, of which 16 do not have information on their website. In this way, the final sample is made up of 84 companies from 10 different autonomous communities (CCAAs). In this sense, from the academic and practical point of view, the top Spanish agricultural and livestock firms correspond with the companies with higher economic activity and, in consequence, a greater environmental impact. So, the knowledge about its circular transition is especially relevant to guarantee adequate production without compromising the availability of natural resources for new generations.
Figure 1 shows the sample distribution by autonomous community, identifying that the majority of the companies are located in Murcia, Aragon, Catalonia, and Castilla y León.
The information for the analysis has been extracted from the Iberian Balance Sheet Analysis System (SABI database) with financial and economic items of companies in Spain. The researchers also used their data elaboration from a content analysis of the information available on the corporate website of each company.
The primary sector has great economic and social relevance throughout the European Union, and, especially in Spain. From an economic point of view, in Spain, it generates approximately 700,000 full-time equivalent jobs [
23]. The gross value added of the primary sector reached 32,875 million euros in 2021, representing 2.7% of GDP. Likewise, the primary sector contributes to the trade balance, with exports exceeding 68,000 million euros [
19]. On the social level, in addition to guaranteeing the food security of the population, it allows correcting the demographic imbalances and territorial depopulation suffered by some territories. Therefore, innovation and progress in this sector represent great potential for excellence that can contribute to economic development and the well-being of citizens.
This sector is the second emitting sector of GHG, mainly generated by the use of fertilizers and soil management in the case of agriculture and by enteric fermentation and manure management in livestock farming. Additionally, it has the particularity of being the only sector capable of producing emissions (derived from the use of fossil fuels, soil management and the use of fertilizers, the burning of agricultural waste, livestock, rice fields, liming of soils, and the use of urea), but it is also capable of acting as a CO2 sink through the capacity of the soil and woody crops to capture CO2.
In this sense, public administrations and Spanish farmers and ranchers are strongly committed to the ecological transition. Thus, Spain is the country with the largest area dedicated to organic agriculture in the European Union and occupies the fourth position worldwide. Most of the organic farming area in Spain is destined for permanent pastures. Of the rest of the crops (permanent crops and arable land), grain cereals represent 10% of the total, and olive groves, representing 9%, are the crops with the largest ecological surface area. In terms of production, in Spain, the organic crops of fresh vegetables, grapes, olives, cereals for the production of grain, and citrus fruits, among others, stand out.
Concerning livestock, Spain is the leading European producer of sheep meat, the second of pork and poultry, and the fourth of beef. This sector plays an important social and environmental role, especially extensive livestock farming, which preserves the landscape and the ecosystem, with 165 cataloged native breeds (about 20 originating from Castilla y León, although nearly 60 native breeds are present in its territory), which gives an idea of the richness of biodiversity. The development of a differentiated model of sustainable and quality livestock production requires having an important genetic heritage.
2.2. Environmental and Segmentation Variables
The level of transition towards a circular agricultural and livestock model has been associated with a set of general and specific initiatives based on the basic principles of the circular economy. In this sense,
Figure 2 reflects the interrelationship between the principles and the initiatives selected for analysis.
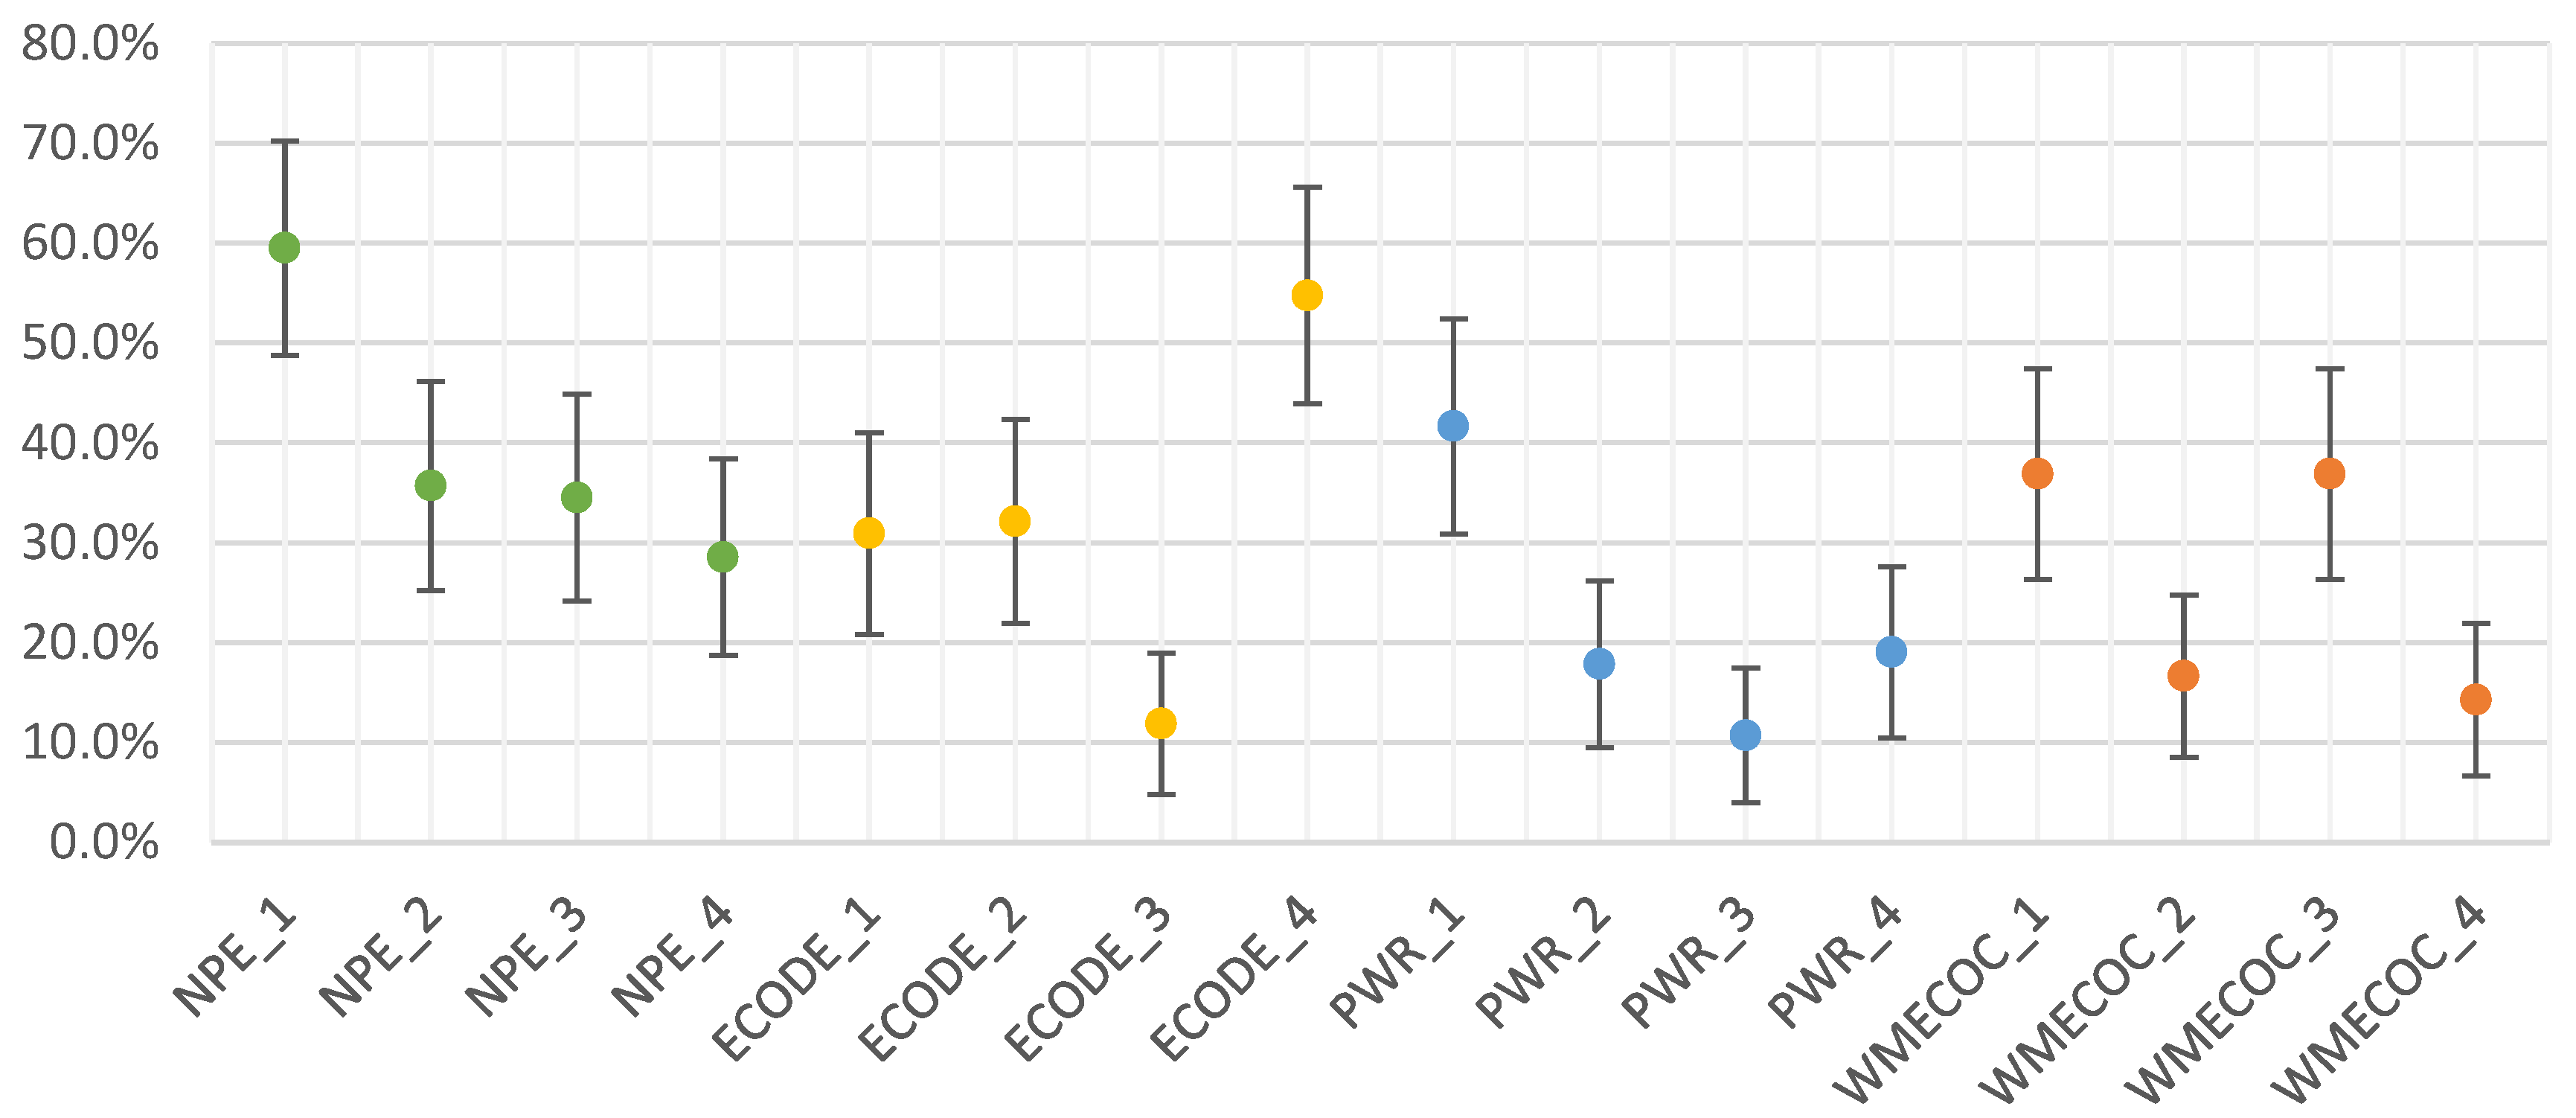
In relation to the variables from general circular initiatives, for this research, we have four variables that take values between 0 and 4, depending on whether the company carries out or implements different aspects of dealing with “Non-polluting energy (NPE)” pollution; eco-innovative aspects “Eco-design and eco-innovation (ECODE)”; aspects for protecting water “Source water protection (PWR)”; and aspects in waste management and ecosystem care “Waste management and ecosystem care (WMECOC)”. For example, the variable “Non-polluting energy (NPE)” is broken down into four specific initiatives: “NPE_1”, “NPE_2”, “NPE_3”, and “NPE_4”, so that the company receives the value 0 if it does not comply with any of these initiatives and a value from 1 to 4 depending on the number of initiatives carried out.
Table 1 describes the general information of the four general initiative variables and the specific initiatives of each of them. Likewise, we have four variables for segmented analyses. The CCAA variable determines the geographical area of activity according to the autonomous community in which the company operates, and the three other quantitative variables refer to the investment capacity of the companies, such as INVESTMENT, SUBSIDIES, and AUTONOMY. All of them are described in
Table 1.
2.3. Methodology: Ordinal Logistic Biplot
Biplot methods [
24,
25] are techniques for the simultaneous representation of variables and individuals in a quantitative data matrix and are capable of jointly displaying the rows and J columns in reduced dimensions. In these techniques, individuals are represented as points on a factorial plane, while variables are represented as vectors on the same plane, showing the measurements corresponding to each column. In the same way that a scatter plot shows the joint distribution of two variables, a biplot represents three or more variables. Biplots can be obtained through a factor analysis (FA) or a principal component analysis (PCA), which seeks to maximize the total variability. They can also be obtained through regressions and alternative calibrations [
26].
Other types of biplots have been developed for data that are not continuous, such as qualitative variables or binary data. Ref. [
27] proposes a linear biplot based on logistic responses, which they call “Logistic Biplot”. This article studies the geometry of this type of biplot and uses a slightly different estimation procedure than Gabriel’s method [
24]. In the article by Ref. [
28], a practical version of the process is explained for data matrices in which individual scores are determined by an external method, such as principal coordinate analysis. This technique is known as an “External Logistic Biplot”. On the other hand, Ref. [
29] suggests a biplot representation for nominal data based on convex prediction regions for each category of a nominal variable.
When dealing with ordinal data, logistic, linear, binary, or nominal biplots are not appropriate. Instead, it is recommended to use techniques such as item response theory (IRT) or categorical principal component analysis (CATPCA) for ordinal items. Ref. [
21] proposes a technique called “Ordinal Logistic Biplot”, which uses ordinal logistic scores for the rows and logistic response parameters for the columns. These parameters, to create a linear biplot, produce logistic response surfaces that are projected onto the space of the row scores. In item response theory, a proportional odds model called the graded response model is used. The way this model is represented graphically is analyzed, and computer algorithms are created to calculate the parameters and prediction directions. Ordinal logistic biplots are a graphical representation extension similar to the CATPCA biplot for IRT. The development of the method, the geometric properties, the goodness of fit, and the interpretation are explained extensively in [
22], as well as its implementation in an R package (version 4.3.1) called “OrdinalLogisticBiplot”.
Mathematically, the ordinal logistic biplot is specified as follows: let be a data matrix with information of ordinal variables with ordered categories, measured for individuals, and be the indicator matrix, with columns. The dimension-indicator matrix for each categorical variable contains, for each category, the binary indicators, being . For each column of , add , and for each row of , add 1. Therefore, is, for each category of each variable, the matrix of observed probabilities.
Let us consider
as the cumulative (expected) probability that individual
has a value equal to or smaller than
in the
ordinal variable, and
be the cumulative (expected) probability that individual
takes the
value of the
ordinal variable. So
and
(with
. A multidimensional latent response logistic model can be written for these cumulative probabilities as follows, being (
):
where
is the vector of latent response scores for the
individual, and
and
the parameters for each item or variables. This procedure establishes, one for each category, a set of binary logistic models, where there is now an independent term for each but a common set of slopes for all. This is known as the
Graded Response Model or Semejima Model within the framework of item response theory (IRT) [
30]. For the scores
, it is possible to represent them in a scatter diagram to search for groupings or clusters of individuals that have similarities, as in multidimensional scaling, and the parameters
can be represented as directions in the space of the scores that best predict the probabilities and their use allows the search for the variables responsible for the differences between individuals.
On a logit scale, the model can be written as follows:
This expression defines a binary logistic biplot for the accumulated categories. In matrix form, we have
where
) is the size matrix
of cumulative (expected) probabilities;
is a vector of ones;
, with
, is the vector that contains the thresholds;
, with
, is the matrix
, which contains the scores of the individuals; and
, with
and
, is the matrix of
, which contains the slopes for all variables. This determines a biplot for the odds known as the “
Ordinal Logistic Biplot”.
The expected probability that individual
responds to category
of variable
, with
, which we denote by
will be obtained by subtracting the accumulated probabilities:
so, we have
The geometry of the ordinal logistic biplot represents the elements of the matrix in a factorial plane, the ordinal qualitative variables as straight lines, and the individuals as points. Each line has as many segments as there are categories in the variable
, and these are separated by
points at which the probabilities of two adjacent categories are equal. A perpendicular for each point separates the different categories of the variable. In
Figure 3, we can see an example of a variable with 4 categories; the 3 parallel lines divide the approximation space into 4 regions, each of which predicts a category of the variable.
We can find an extensive description of the classical linear biplot, the logistic biplot of binary variables, the nominal logistic biplot, and the ordinal logistic biplot in [
22]. In this document, we will find everything necessary to understand each of the models, equations, geometric properties, parameter estimation, goodness of fit, and interpretation of results. In addition, its packages are available in R (
NominalLogisticBiplot and
OrdinalLogisticBiplot) (
http://cran.nexr.com/web/packages/OrdinalLogisticBiplot/, accessed on 6 December 2023).
4. Results II: Degree of Progress of the Circular Transition Segmented by Autonomous Community
In this section, we group the companies according to the geographical area or autonomous community in which they carry out the activity. The objective is to know the influence that the policies of these communities have on the degree of progress of the transition towards a circular agricultural and livestock business model. To achieve this, we obtain the average score of the group of companies by autonomous community, and, to apply the ordinal logistic biplot, we proceed to categorization by quartiles because the sum of the specific circular initiatives would not be adequate due to the sample differences between autonomous communities. In this way, the new data matrix contains 10 rows (the 10 autonomous communities to which the 84 companies belong) and 4 columns (variables or general circular initiatives with an interval between 0 and 4).
The ordinal logistic biplot by autonomous community can be seen in
Figure 10, in which the positions of each variable are shown on the dimensions of the biplot, as well as the characteristic points of the cut of the curves for those categories that are not hidden.
Table 4 shows the indicators resulting from the estimation of the model parameters with the alternating algorithm in a two-dimensional space. All variables are significant in the model (
p-value < 0.01), and the percentages of correct classifications (PCC) are very high for all variables (above 70%) and present high Nagelkerke pseudo-R2 coefficients (above 75%). Therefore, the goodness of fit of the model is high, and this allows a correct interpretation of its results.
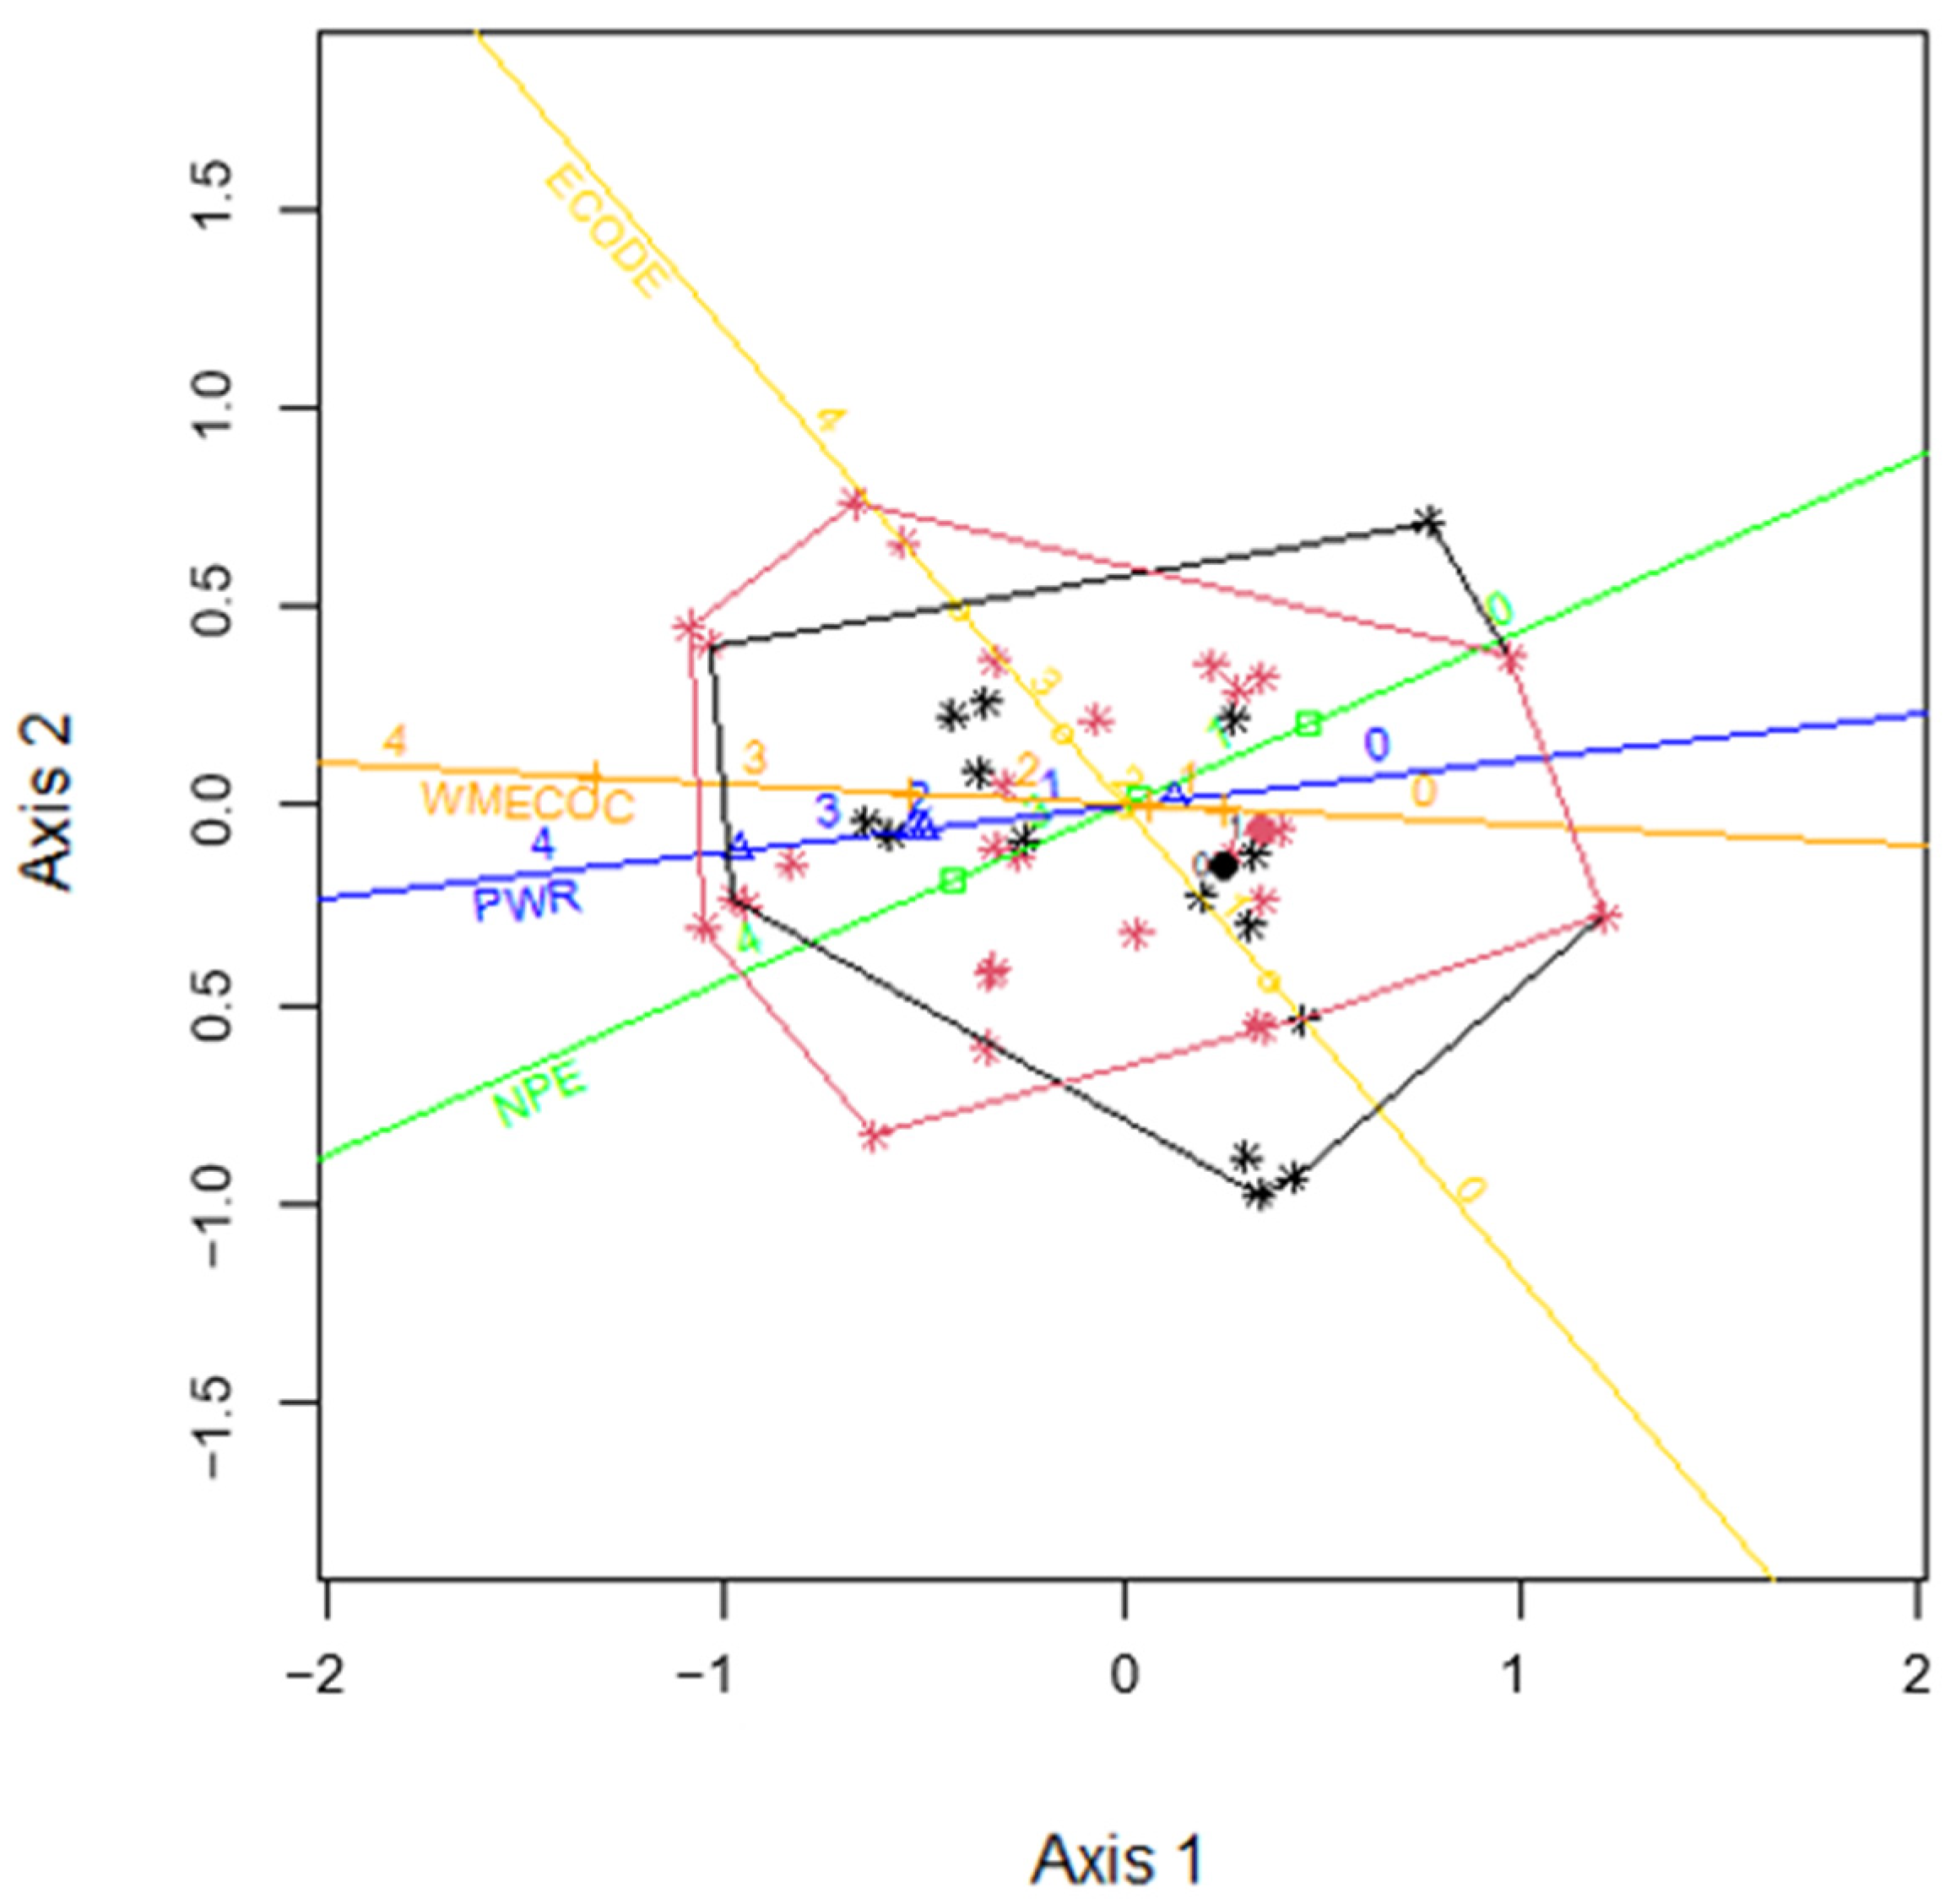
In the representation of the ordinal logistic biplot,
Figure 11, we can see how the high values of the variables are positioned in the left semi-plane so that those communities located in that area will be those that present the greatest degree of progress in the transition towards a circular model. Thus, we have that Extremadura is positioned in the highest prediction areas for all variables, showing itself as the leading community in the study. Secondly, we have Valencia with maximum values in all variables except for WMECOC (Waste management and ecosystem care), which has a slightly lower value; the same case for Murcia with a lower value for said variable.
Next, we find Castilla y León, with a high value in all variables, except for ECODE (eco-design and eco-innovation), where it shows a lower value. Andalusia shows a similar structure, with the lowest value in NPE. Similarly, Navarra has a lower value in PWR (source water protection).
Finally, in the right half-plane, we have the communities that are in the initial-middle phase of the transition towards a circular agricultural and livestock model for all variables. Castilla–La Mancha stands out in NPE (non-polluting energy) and ECODE; Aragón prioritizes the NPE; Catalonia prioritizes the PWR; and Madrid prioritizes the WMECOC.
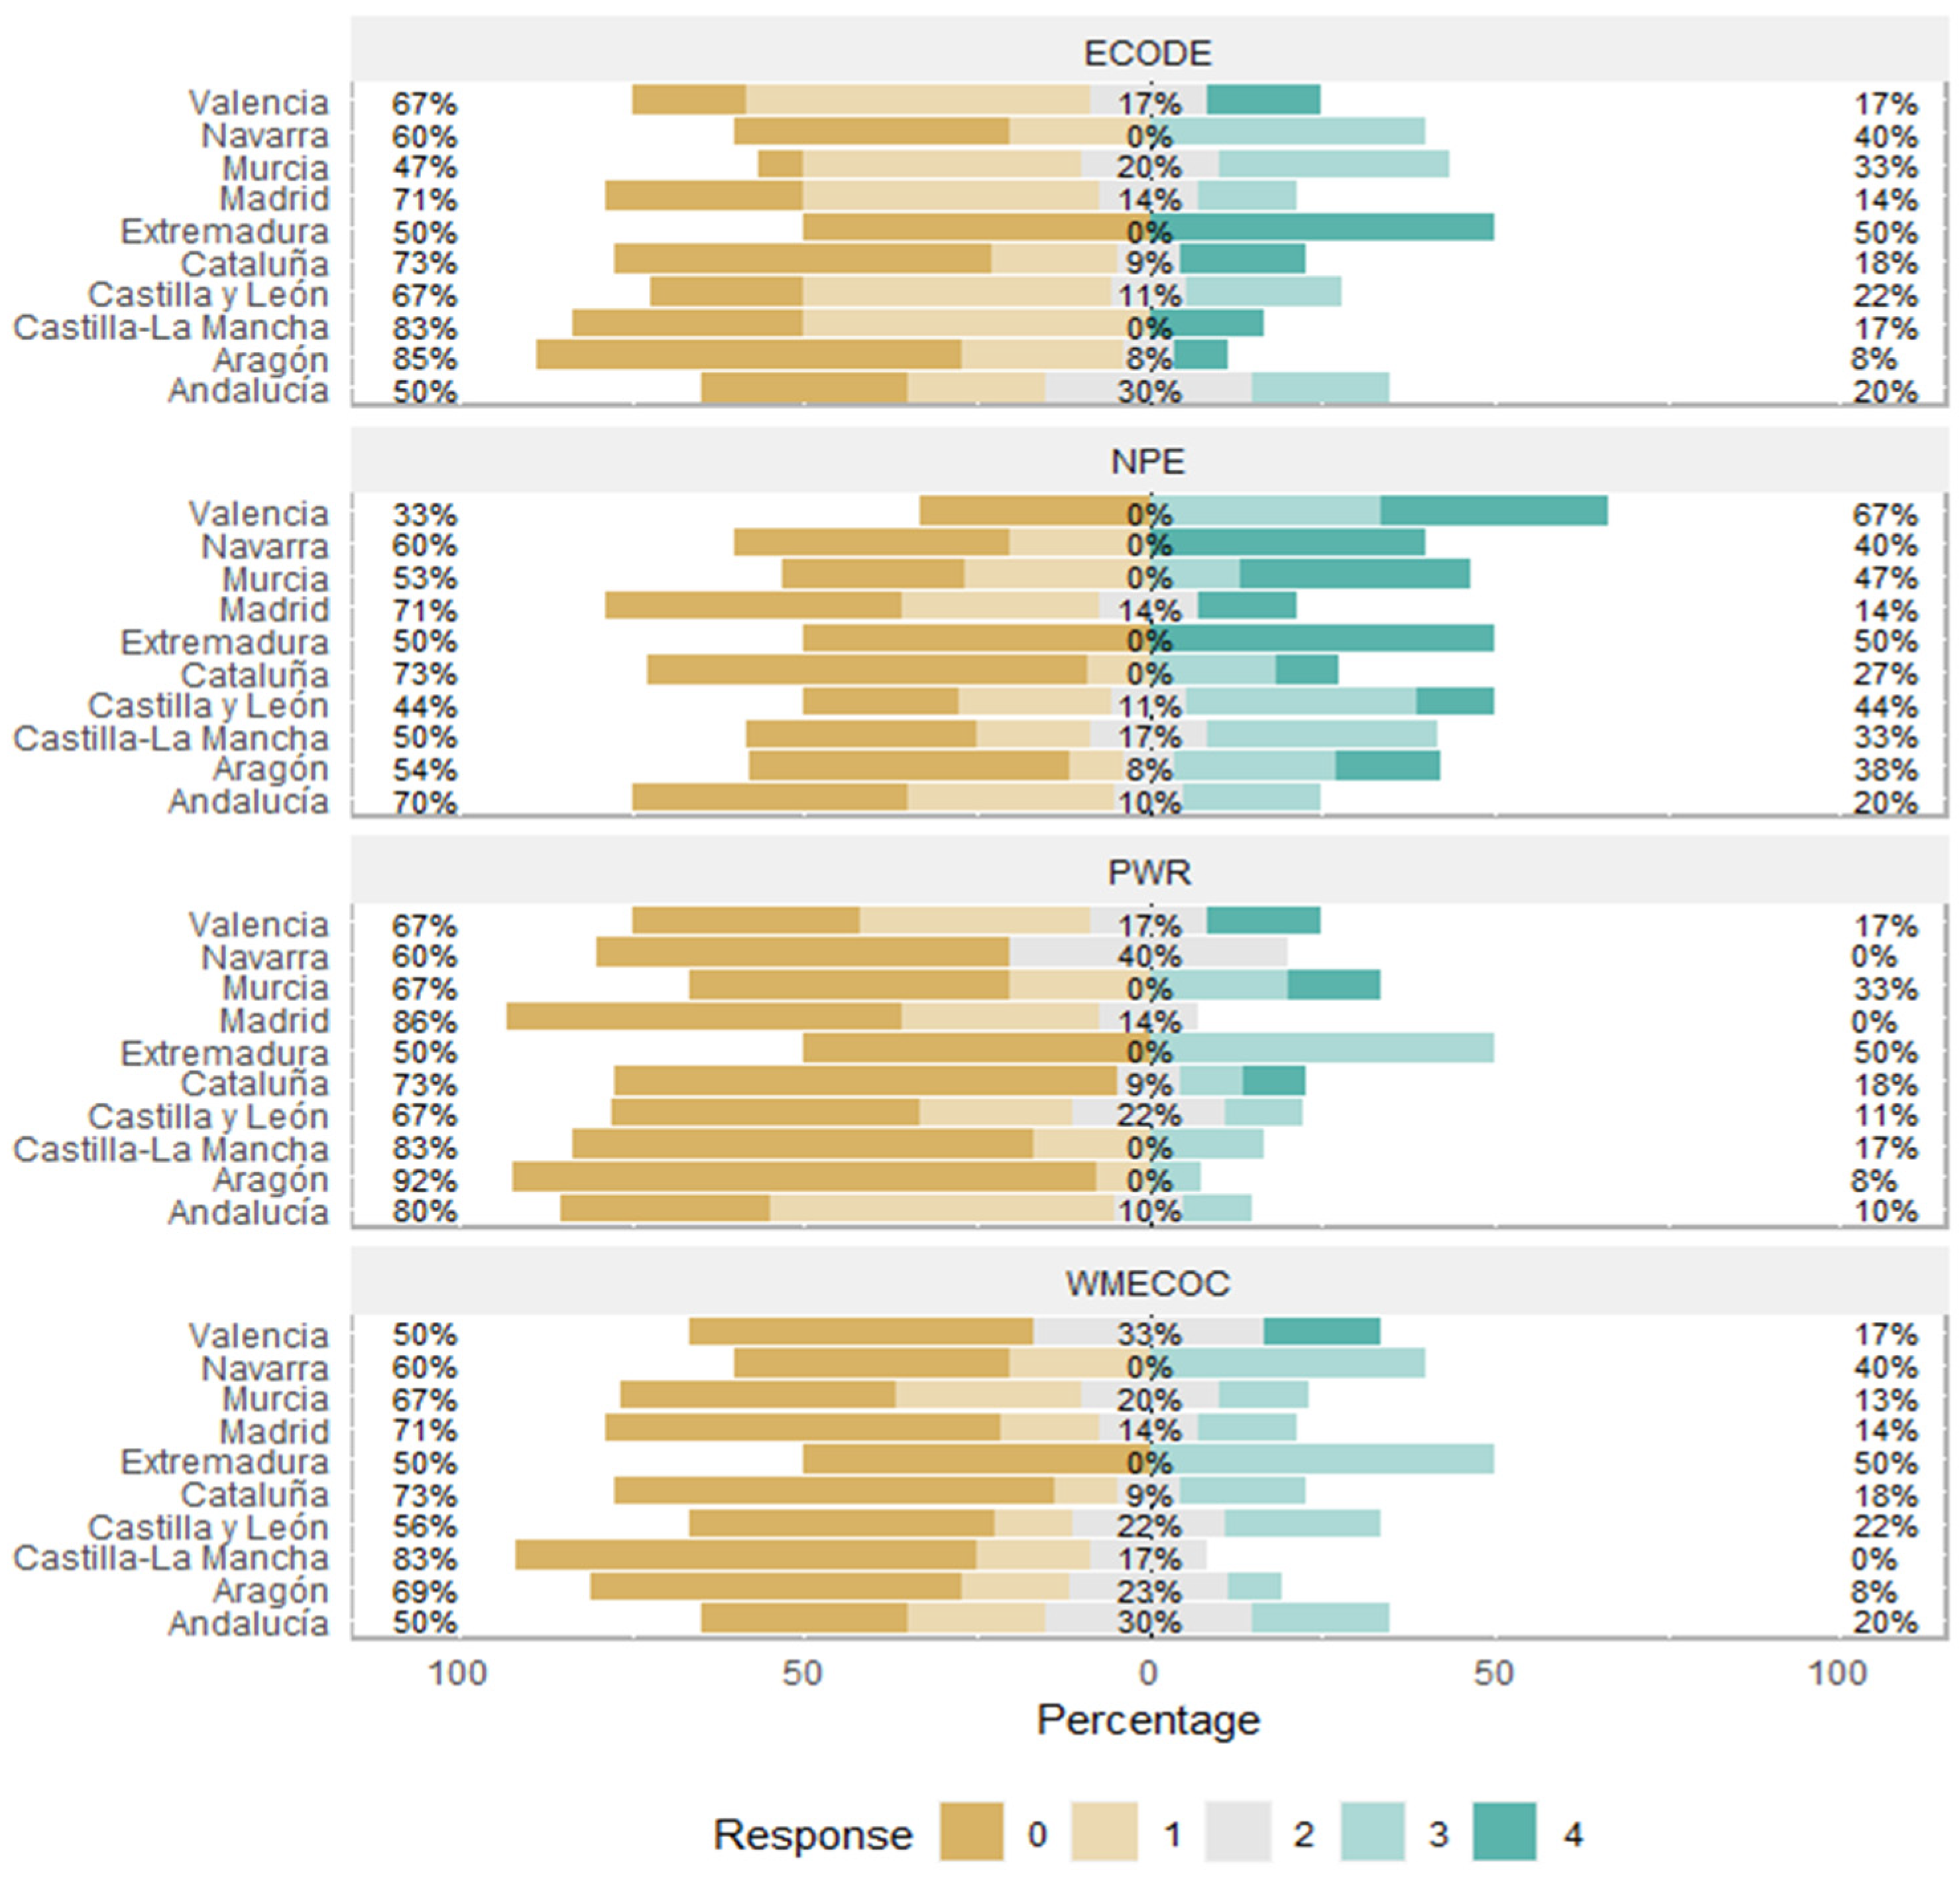
To delve deeper into the information by autonomous community, we show a grouped bar graph segmented by general circular initiatives (see
Figure 11). The data presented are percentages of companies by autonomous community that have a degree of progress in the preliminary or initial circular transition, with values of one (brown tones); an intermediate grade, with a value of two (grey); and an advanced degree, with values three or four (green tones); The percentages on the left correspond to brown tones, and those on the right correspond to green tones. Thus, it is possible to see how, for example, Aragón is shown as the community with the greatest presence in the preliminary or initial phase of the circular transition, with 85% of the companies regarding ECODE; in addition, 8% are in the phase intermediate and 8% in the advanced phase. Regarding NPE, Valencia stands out, with 67% of its companies with an advanced degree in the transition to a circular model and 33% of companies that have not yet begun the transition. Regarding PWR, Murcia stands out, with 33% of companies with an advanced degree and 67% with a preliminary or initial degree in the circular transition. For WMECOC, Navarra stands out with 40% of companies at an intermediate level of progress; likewise, Andalusia has 20% of companies at an intermediate level of progress.
Regarding the economic–financial variables, we did not find the existing relationships by autonomous community in the previous analyses, which is possibly due to the diversity of companies that make up this study (see
Table 5).
7. Conclusions, Limitations, and Future Lines of Research
This paper analyzed the degree of ecological transition of agri-food companies for the basic principles of the circular economy related to rethinking processes and prolonging the use of products and materials to protect ecosystems. In addition, we studied the relationship of the level of circularity in the primary sector with firms’ investment capacity and territorial initiatives.
We selected the top 100 Spanish companies with the highest income and, in consequence, higher activity and environmental impact. A total of 16 firms did not have information on their website. The gross value added of the primary sector in Spain reached 32,875 million euros in 2021, 6.9% less compared to 2020, representing 2.7% of GDP. Likewise, the primary sector generated 691,800 full-time equivalent jobs, 4.2% more than in 2020 [
23].
The use of the logistic biplot allows a multivariate analysis of the level of transition towards a circular agricultural and livestock in Spain, identifying that has been associated with a set of general and specific initiatives. More concretely, under the approach of circular initiatives for the business transition towards a more sustainable model, we can conclude that companies in the Spanish agricultural and livestock sector present a significant degree of progress, especially in the implementation of initiatives that reduce the generation of polluting and harmful gases in the earth’s atmosphere, as well as the development of eco-designs and eco-innovations that improve the processes and products provided by the sector in ecosystem and social terms.
In this vein, academics have a greater knowledge of the ecological transition in the agriculture and livestock sector, having observed that this is articulated as a competitive strategy for the primary sector, regardless of the exporting nature or not of the companies analyzed. In addition, we have identified that the circular economy in the primary sector is a broad concept that emphasizes resource flows as an object of analysis to propose innovation models that optimize efficiency in the consumption of physical resources such as raw materials, energy, and water, and that reduce the generation of waste and emissions. Although the findings also indicate that companies are making changes in their production processes to contribute to reducing the use of resources and improving waste management and its impact on ecosystems, it is also concluded that companies change with different rhythms based on their strengths and capabilities. In any case, it is possible to affirm that firms are managing to develop value propositions to support the sustainability of resources, which could translate into greater differentiation from their competitors.
In addition to the above, from a practical perspective, our findings highlight the importance of government institutions at the regional level to initiate and advance the circular transition of the agricultural and livestock sectors through the economic support that they provide; calling for such aid is focused on small businesses, since according to our results, these companies have the least degree of progress due to the low capital stock necessary to strengthen the circular economy. Furthermore, the involvement of these actors is necessary because the transition towards circular models requires paradigm changes in the relationship between private actors and their perceptions of the added value of efficient resource management as an essential part of business strategies. In this vein, it requires expanding the business vision towards networks and chains that include suppliers and neighboring companies. Thus, through public policies, the most far-reaching circular economy solutions could involve a variety of companies capable of collaborating to find new business models for the productive transformation of the primary sector.
Additionally, our research has limitations that can be overcome in future research, such as access to business data in the field of the circular economy that can be overcome with the establishment of focus groups for agricultural and livestock companies with the support of dedicated non-profit organizations to improve environmental environments as facilitators of communication between academia and farmers and ranchers. Finally, a future line of research that arises from our evidence is the temporal and community analysis of the business use of the economic support provided by government institutions in a territory that demands the preservation of its natural wealth to be enjoyed by current and future generations.

 ,
, 


