Article

GAFOR: Genetic Algorithm Based Fuzzy Optimized Re-Clustering in Wireless Sensor Networks

by
Muhammad K. Shahzad
1,†,
S. M. Riazul Islam
2,*,†,
Mahmud Hossain
3,
Mohammad Abdullah-Al-Wadud
4,
Atif Alamri
5 and
Mehdi Hussain
1
1
Department of Computing, National University of Sciences and Technology, Islamabad 44000, Pakistan
2
Department of Computer Science and Engineering, Sejong University, Seoul 05006, Korea
3
Department of Computer Science, University of Alabama at Birmingham (UAB), Birmingham, AL 35294, USA
4
Department of Software Engineering, College of Computer and Information Sciences, King Saud University, Riyadh 11543, Saudi Arabia
5
Research Chair of Pervasive and Mobile Computing, King Saud University, Riyadh 11543, Saudi Arabia
*
Author to whom correspondence should be addressed.
These authors contributed equally to this work and co-first authors.
Submission received: 5 November 2020 / Revised: 22 December 2020 / Accepted: 22 December 2020 / Published: 28 December 2020
(This article belongs to the Special Issue Mathematical Mitigation Techniques for Network and Cyber Security)

Abstract

:
In recent years, the deployment of wireless sensor networks has become an imperative requisite for revolutionary areas such as environment monitoring and smart cities. The en-route filtering schemes primarily focus on energy saving by filtering false report injection attacks while network lifetime is usually ignored. These schemes also suffer from fixed path routing and fixed response to these attacks. Furthermore, the hot-spot is considered as one of the most crucial challenges in extending network lifetime. In this paper, we have proposed a genetic algorithm based fuzzy optimized re-clustering scheme to overcome the said limitations and thereby minimize the effect of the hot-spot problem. The fuzzy logic is applied to capture the underlying network conditions. In re-clustering, an important question is when to perform next clustering. To determine the time instant of the next re-clustering (i.e., number of nodes depleted—energy drained to zero), associated fuzzy membership functions are optimized using genetic algorithm. Simulation experiments validate the proposed scheme. It shows network lifetime extension of up to 3.64 fold while preserving detection capacity and energy-efficiency.

1. Introduction

One of the critical issues in wireless sensor networks (WSNs) is the hot-spot problem [1]. It occurs due to the fact that the rate of energy consumption at the nodes around the base station (BS) and on critical paths is faster as compared to other nodes. The hot-spot problem results in network partition since intermediate nodes not only transmitting their information but also acting as a forwarder. A widespread placement of WSNs requires mitigating security threats. One of the prevalent threats is false report injection attacks by an adversary, resulting in energy drain of the nodes on the path. An example of the hot-spot problem is shown in Figure 1. The first event sensing node sends its event report to the next node on the path towards the BS. If the the second node senses an event, the node would send not only its report, but also act as a forwarder for the report it received from the first node. Consequently, the nodes closer to the BS and on critical paths experience more traffic and thus more energy consumption occurs at these nodes, resulting in a hot-spot problem that eventually creates partitions in the network.
Furthermore, if these event reports are generated by an adversary, a significant amount of energy is wasted with the draining of batteries of the nodes en-route. In this paper, we therefore propose a genetic algorithm (GA) based fuzzy optimized re-clustering (GAFOR), where the end user is informed about nonexistent event by triggering an alarm so that an adversary cannot decode the complete message since event reports are transmitted via multiple paths. In that way, GAFOR can be more robust in mitigating the said attacks.
In general, existing en-route filtering schemes [2,3,4,5,6] exhibit similar limitations: (1) underlying shortest fixed path routing, which is counter-intuitive from network lifetime perspective, (2) fixed security response for varying degree of attacks, and the (3) hot-spot problem. For example, the greedy perimeter-based stateless routing (GPSR) [7] is a shortest path routing that follows the fixed path routing approach. Several energy-efficient routing protocols [8,9,10] have been proposed in the past, but they do not focus on en-route filtering schemes. Energy consumption analysis of a few existing en-route filtering schemes is performed using the first order radio model [11,12]. However, various assumptions about radio characteristics, such as amount of energy consumption in transmitters and receivers, could be biased towards different protocols. In order to address this issue, a commonly used radio model is used in GAFOR with an acceptable signal-to-noise ratio (i.e., E b / N 0 ).
Some of the major challenges hindering the widespread application of WSNs are security, network lifetime, and energy-efficiency. Efforts have been made to extend the network lifetime by improving underlying routing schemes [9]. To the best of our knowledge, our study is one of the first attempts to increase the network lifetime while preserving energy and security requirements of en-route filtering schemes. Generally, en-route filtering schemes use the shortest path routing such as GPSR which is designed for ad-hoc networks and does not perform well for WSNs. These limitations make it challenging to enhance network lifetime in en-routing filtering schemes and thus become an interesting problem. Therefore, the question arises as to whether it is possible to significantly improve network lifetime while maintaining energy and detection capacity.
The aforesaid limitations-driven question thus motivates us to carry out this study. This study is important to lay out the foundation of an optimized re-clustering scheme to enhance network lifetime in en-route filtering scheme. For different network sizes (i.e., number of nodes) and attack ratios, GAFOR extends network lifetime from 2.29 to 3.64 fold on an average without perturbing the energy efficiency and security level compared to the existing schemes. Our main contributions are as follows:
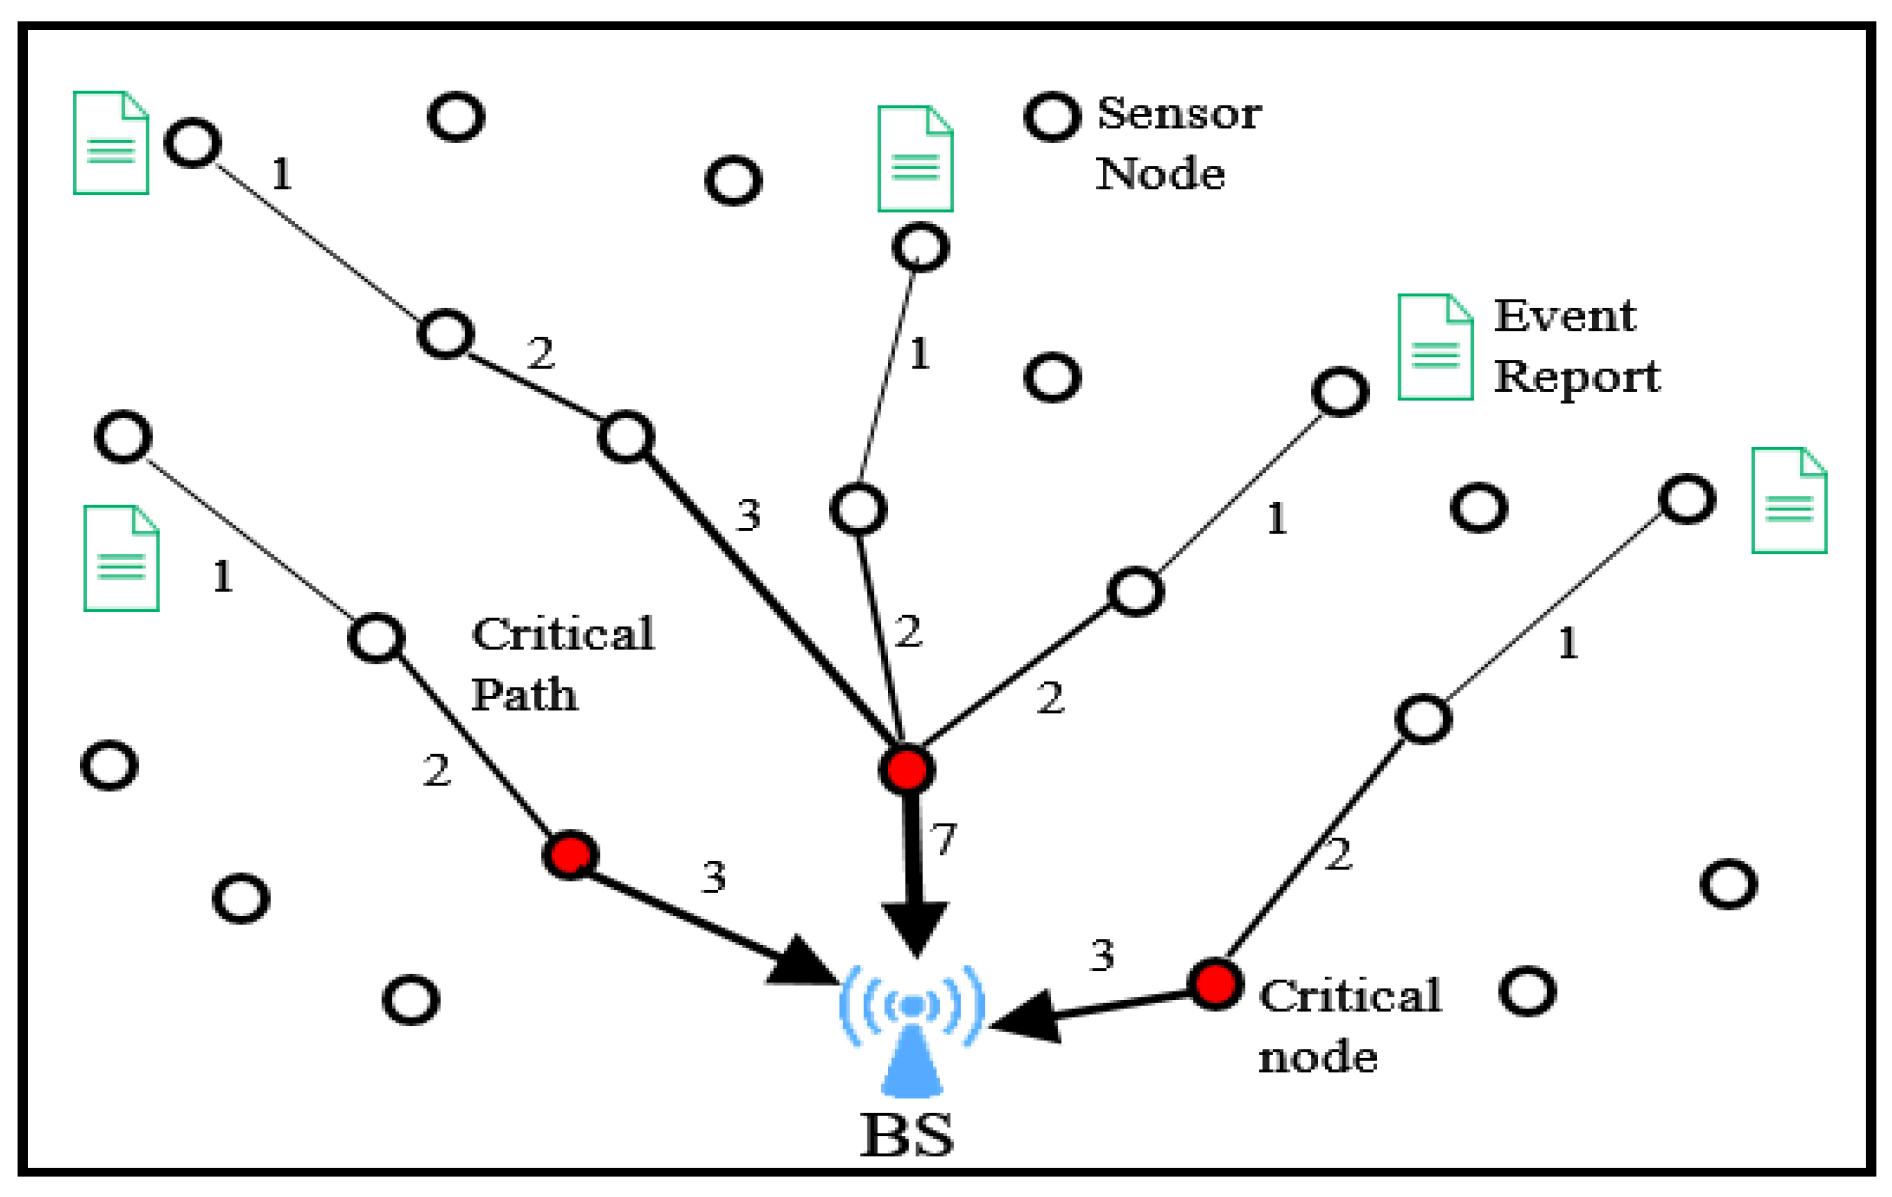
  • We employ a dynamic security solution against varying attack-intensity. As such, we select a path with a higher number of verification nodes from multiple paths for larger attacks and vice versa. Multiple paths with different numbers of verification nodes are created using pre-deterministic key-dissemination.
  • We improvise the load-balancing over a larger number of participating nodes using a dynamic energy-aware routing to overcome the limitation of a fixed path routing.
  • We improve the network lifetime by mitigating the hot-spot problem via appropriate re-clustering. An optimized re-clustering threshold is achieved by modifying fuzzy membership functions with the help of the Genetic Algorithm (GA) algorithm.

2. Background

In this section, we will illustrate en-routing filtering and shortest fix path routing.

2.1. Commutative Cipher Based En-Route Filtering

The verification process of CCEF based on query–response model is illustrated in Figure 2. In this model, a session is established by sending a query message (Q) in an area of interest from where the sensors transmits a message containing response (R) to the cluster head ( C H ) which routes it towards the base station ( B S ). The B S transmits a query message Q = [ Q i d , C H i d , { k s } K n C H ] to the respective C H in that area. This message is composed of the Query ID ( Q i d ), C H ID ( C H i d ) and session key ( k s ) encoded with the C H s node key ( k n ), i.e., { k s } K n C H .
A session is established by dropping a copy of witness key ( k w ) on all en-route nodes. By using ( p = 1 / α h )—a probabilistic method—a fixed number of nodes are selected as verification nodes. Events including false reports are being generated randomly in a W S N . The sensors encountering the event information form consensus about identity of the event choose a C H and play their part in report generation.
The neighbours, receiving the event’s report information, endorse and forward it to the respective C H . As the query arrives at the C H , it uses the k n key to decode the k s key to find if it was generated by the originating B S . The C H compresses the session key ( M A C s ), created by the event sensing nodes; E, F, G, and H with a simple X O R operation and transmits a response including the M A C s and the I D s of report endorsing nodes. In turn, the C H transmits a response message [ Q i d , R , E i d , F i d , G i d , M A C s , M A C n ] and, as a result, a session is created. Consequently, reports created by the event sensing nodes are transmitted to the B S by the respective C H .
After a session is established, reports are transmitted to the B S by the C H . The sensors used k w keys to determine Q i d to check the query validation. Consequently, k w is used to validate the M A C s without having k s with the help of the commutative cipher property. The B S , after receiving the report in the response message, produces the M A C n and validates it along with M A C s . In case both conditions are met, C H and all of the report-endorsing nodes are validated. However, if the any of conditions are not validated, either the C H or at least one of the endorsing nodes is taken over by an adversary.

2.2. Greedy Perimeter Based Stateless Routing

GPSR, a widely used shortest path routing algorithm shown in Figure 3, is not suitable for WSNs, which were designed for ad-hoc wireless networks. It is based on a query–response communication model. Given the large number of nodes and mobility, it makes excessive use of geography rendering it scaleable. It makes use of immediate neighbours for greedy forwarding decisions and frequent topological changes are catered using local topological information. The scalability is addressed using hierarchy and caching.
The first method uses greedy forwarding where a packet is forwarded selecting a closest node among N i neighbour nodes at a closer distance to the BS. The second method caters to a situation where greedy routing does not perform well. The right-hand rule makes it possible to route around the perimeter using counter-clockwise motion. The forwarding decisions should not only be distance based but energy aware in order to make it essential for the WSNs.

3. Literature Review

Micro-electro-mechanical systems (MEMS) advancements [13] have triggered mushroom growth of WSNs. WSNs have witnessed widespread application due to their low cost, small size, wireless capability, and higher density characteristics. Network partitioning, a consequent of the hot-spot problem [1], is a critical challenge in extending network lifetime. En-route filtering schemes [2,3,4,5,6] save energy by filtering false reports as early as possible.
En-route filtering schemes, such as dynamic en-route filtering (DEF) [2] and commutative cipher-based en-route filtering (CCEF) [3], offer improved security at the expense of network lifetime. DEF employs the hill-climbing method for key distribution in order to early detect false report(s). All nodes contain secret keys and a seed authentication key which are loaded from a global key pool randomly. Authentication keys are broadcasted by the C H to nodes on the path encrypted with secret keys before reports forwarding, which will be used for validation. The event reports that are not approved by each en-route nodes are dropped. DEF makes use of several keys with a key chain method, which renders it less useful for large-size WSNs.
On the other hand, CCEF employs early detection of false reports to save energy. A secret key association can be established within the nodes and the ( B S ) for a complete session. Every node en-route contains its own witness. It is noteworthy that the symmetric key among the en-route sensor nodes is not shared, resulting in stronger security protection in comparison with existing symmetric key sharing schemes. In order to resist the attacks, the security response in CCEF relies on probabilistic method p = 1 / α h . The detection probability is fixed response, since system parameters α and hop count h on a path are constant. In contrast, GAFOR uses dynamic security response. Based on attack intensity, this is dynamically carried out by selecting a path from multiple paths (i.e., with a varying number of verification nodes).
Novel statistical en-route filtering (SEF) [4] first countered the en-route filtering issue and calculated the number of compromised nodes. This en-route filtering scheme forms the basis of later schemes. However, energy is saved using early filtering of false reports. Network lifetime extension using underlying routing is not catered to in the design.
Given no more than t compromised nodes, the interleaved hop-by-hop authentication scheme (IHA) [5] successfully detect false data reports. It determined hops count upper bound that a false report may travel before being detected and dropped in the presence of t conspiring nodes. Similar to CCEF, IHA underlying routing is also based on shortest path routing and faced similar issues.
The authors [6] presented a bandwidth-efficient cooperative authentication (BECAN) method for filtering injected fabricated report attacks. Furthermore, during filtering, it utilized a cooperative neighbor router (CNR)-based approach that not only achieves high filtering capacity but high reliability as well. GPSR [7] forwards packets using a greedy approach by selecting a node from the candidate nodes that is closest to the destination. While making forwarding decisions, only distance is considered while residual energy of the nodes in the routing process is ignored, which is an important criterion. Several works on routing [8,9,10] present energy-efficient and lightweight routing protocols.
The work [11,12] presented radio transmission models. In this work, we used a first order radio model for energy consumption and comparison in the WSNs. Research works [14,15,16,17] present various attack types and their counter measures in en-route filtering schemes. Some interesting works exist for improving network lifetime [18,19,20,21,22,23,24] and energy efficiency [25,26,27,28,29]. Re-clustering based schemes to increase network lifetime [30,31,32,33,34,35,36] have been found effective in minimizing the hot-spot problem.
The underlying sensing platform is assumed to be Crossbow Mica2 [37] for energy measurement and management. An energy-efficient time synchronization protocol for wireless sensor networks (ETSP) [38] is assumed for clock synchronization of sensor nodes. A network localization component [39] is used for location discovery of sensor nodes. Analyzing the behavior of crossover operators in NSGA-III for large-scale optimization problems [40] is another example area where soft computing-based optimization approaches might be useful. The work presented in [41] designed and developed a monitoring system for smart cities from an optimization viewpoint.
Authors in [42] proposed a novel memetic GA to solve the traveling salesman problem. Boltzmann probability selection and a multi-parent crossover technique with the known random mutation are combined to achieve a good performance. Another application of GA and fuzzy logic is presented in [43] to introduce a priority-based fuzzy goal programming method for defending against the congestion management issue in electric power transmission lines. These GA applications imply their efficacies in solving different computer science problems. However, we apply these methods to solve a network lifetime optimization problem in en-route filtering schemes.

4. Proposed System Overview and Models

4.1. System Overview

4.1.1. Assumptions

The B S and the sensor nodes are assumed to be secured in the network setup phase. The network is composed of static homogeneous nodes. The sensor nodes have a limited amount of energy, whereas the B S have sufficient enough resources and cannot be compromised. The communication links are bidirectional, i.e., a node A can send a message to node B and vice versa. Nodes can adjust transmission power and range. Sensor network have few compromise nodes capable of sending false reports.

4.1.2. Network Setup

A sensor network is initialized with 1000 randomly deployed sensor nodes in an area of ( 500 × 500 ) m 2 . The unique I D s and k n keys are assigned to the sensor nodes. Sensor nodes have their own locations and the B S knows the location and distance of each sensor from itself.

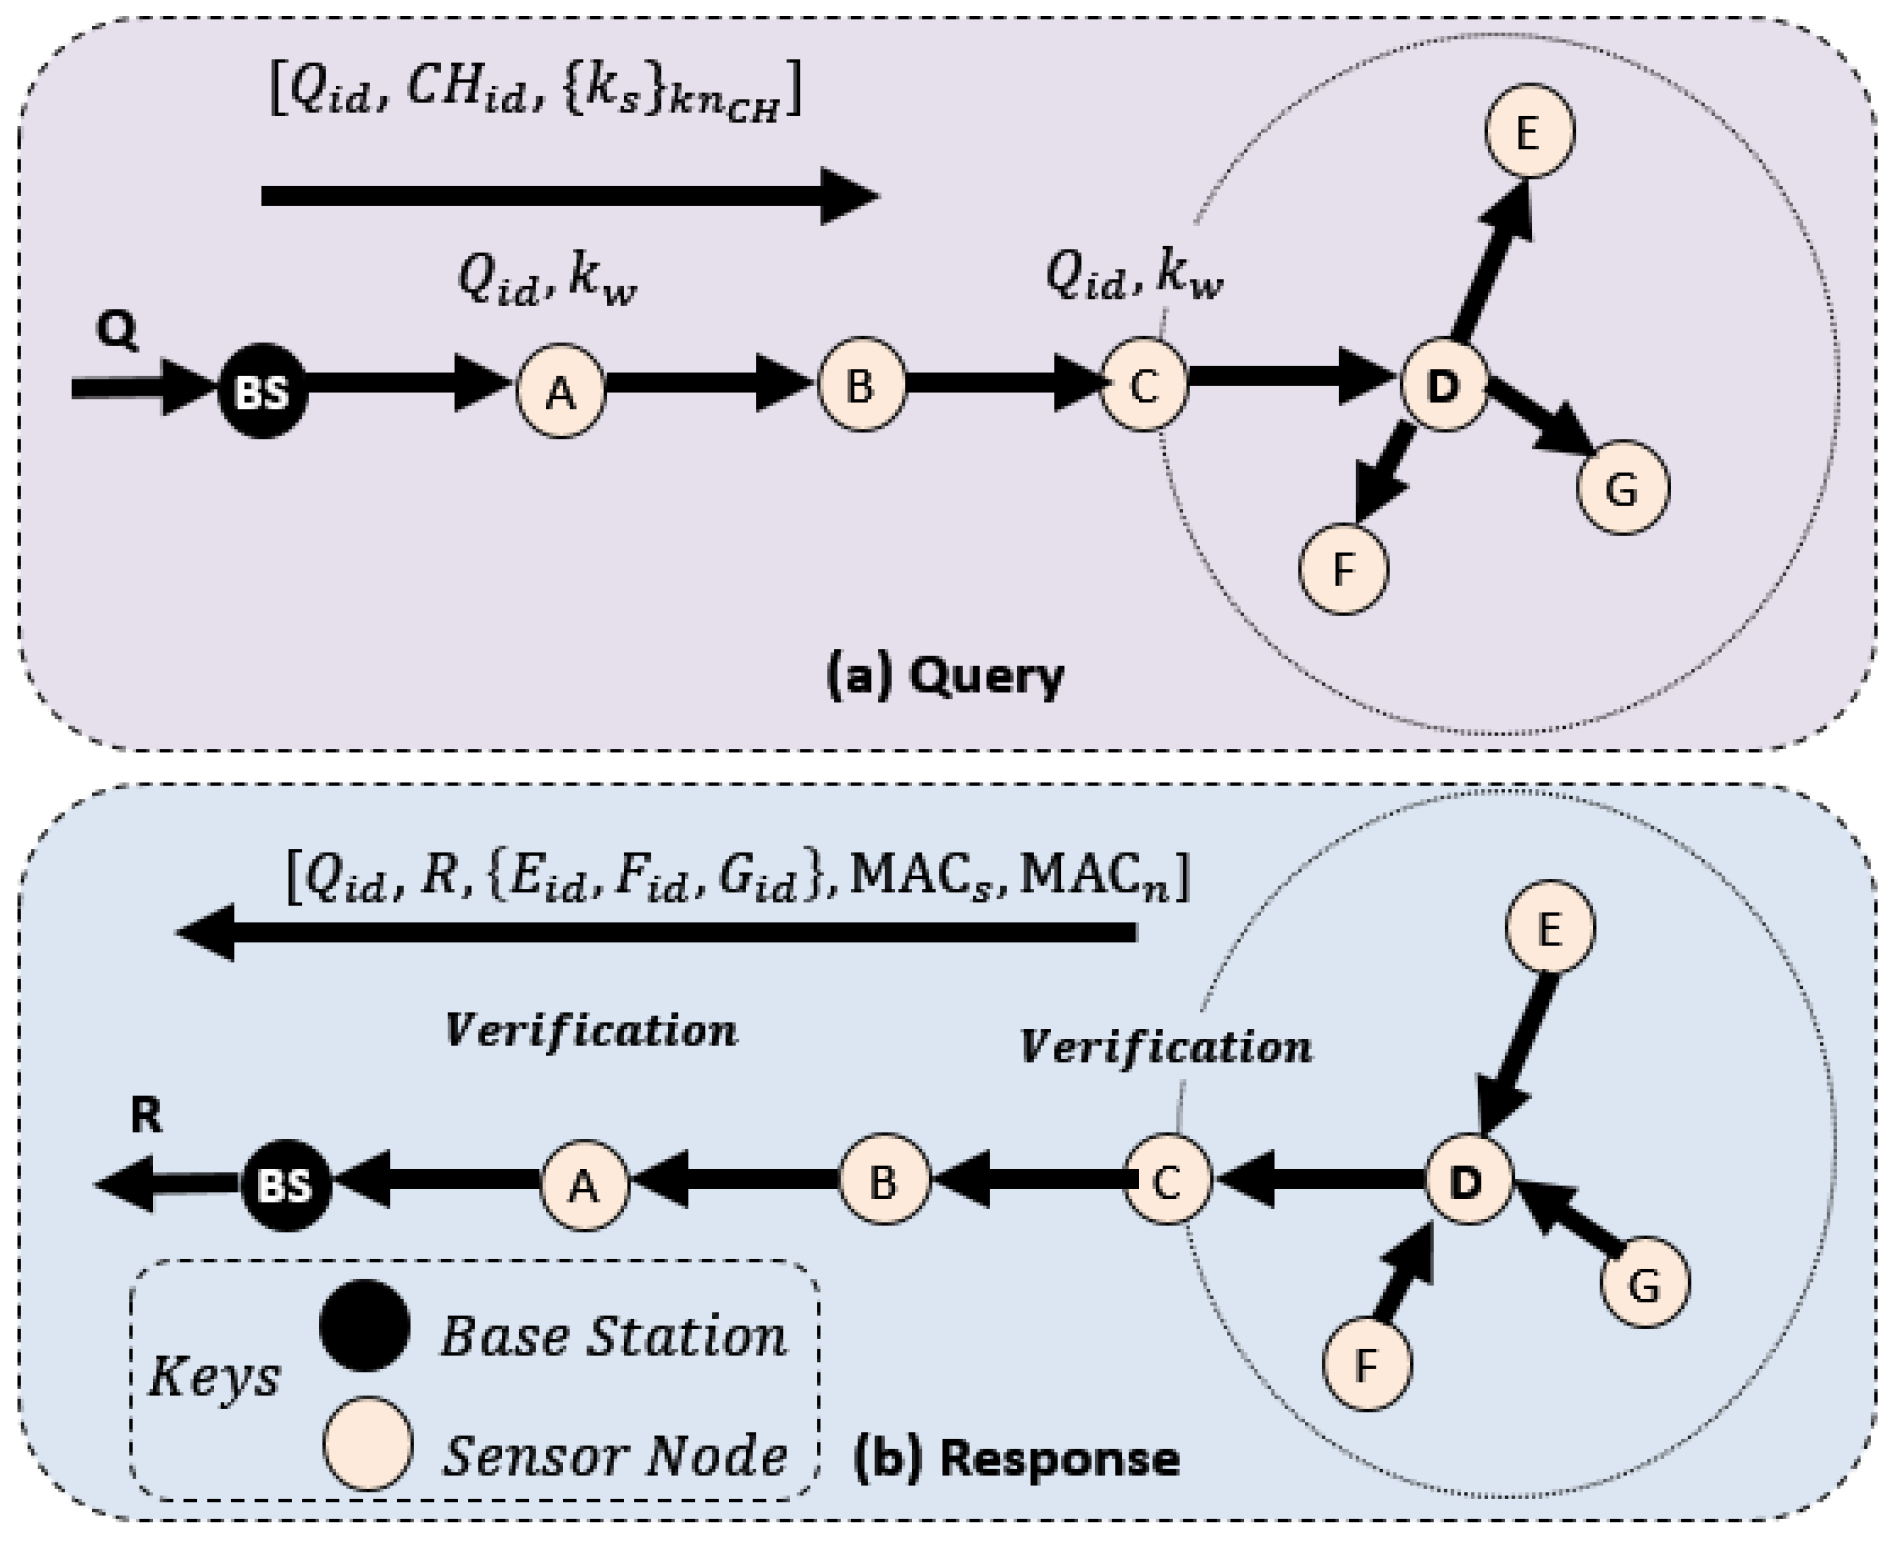
4.1.3. Key Dissemination

A selected number of random sensor nodes are chosen to have the k w key before the establishment of a session in the network according to the false traffic ratio ( F T R ). In a query message, the k w is transmitted securely to the C H . In contrast to, e.g., CCEF, k w keys are disseminated on all nodes on a route. In response, the scheme designates the verification nodes with a probability p = 1 / α h ; α is a design parameter and h represents hops. As both variables are fixed for a given route, therefore, a current F T R with a fixed number of verification nodes can only be granted in CCEF.
In contrast, a proposed scheme consisting of more than a single path selected a path with a proportionate number of verification nodes based on current F T R . This helps in responding dynamically to different levels of response to in real time, which is a realistic scenario. As a result, the proposed method can dynamically select a less or more secure path based on changing attack information.

4.1.4. Path Setup Phase

The forwarding node selection method in addition to distance, energy, and F T R are also taken into account. This enables the proposed scheme to respond dynamically to variation in attack density by choosing a path having more verification nodes in case of higher attacks and vice versa. The B S sends a query message to the C H in an area of interest to establish a path. As the events randomly occur in any area or cluster for the matter at hand, multiple sessions are possible between the B S and C H s .
In order to create a path, the forwarding node ( F n ) method that chooses the fittest node among the candidates nodes is illustrated by Equation (1) as
F n = arg m a x k × 1 β 2 + α × d + e ,
where α and β are the system parameters, d is the node with the shortest distance in the neighbors, e is the remaining energy, and k is the k w presence. These variables are normalized. The highest fitness value node is chosen as the next forwarding node. Eventually, a path is created by repeating this process. There could be multiple paths dynamically created and utilized. The sessions remain active for their time duration or one of the en-route nodes is depleted.

4.1.5. Clustering and Re-Clustering

With the passing of time, the number of nodes lowers, due to uneven energy usage, and some nodes are left unused in the communication due to the hot-spot problem or network partition. After a while, the average number of sensors declines before it reaches a predefined threshold time t in a cluster. It makes an adversary task easier, requiring less keys in order to compromise a node. Moreover, in addition to the increased probability of node compromise, it may also have undesirable effects on network lifetime. Aforementioned issues render it challenging to maintain the number of t nodes in a given cluster.
In order to reach these nodes, topological parameters (i.e., cluster size and transmission range) need to be adjusted to maintain the n ˜ c in a cluster. In order to determine the time for the next re-clustering, we obtained threshold ( t h r ) for re-clustering using fuzzy logic. The fuzzy logic system (FLS) uses network conditions (number of depleted nodes, FTR, and energy of a node). In order to obtain optimal threshold value, we use GA for optimized fuzzy membership functions. Thus, with every t h r decrease in nodes (i.e., one step) with an initial n = 1000 sensor nodes, the cluster size and range are increased to maintain n ˜ c and the coverage (i.e., transmission range).
Deployment of replacement nodes could easily solve this problem; however, physically deploying these nodes is costly, hazardous, and a generally impractical task. Alternatively, we dynamically adjust cluster size and and sensor range to maintain the t nodes inside a cluster.
Here, t is defined as a nodes density ( n ˜ c ) threshold that should be fixated for a cluster. We assume equal heights and widths for the sensor field and clusters. Let’s suppose n ˜ c is our budget for the number of desired nodes per cluster and N n k is the number of total nodes in the field at the k t h step. The number of C H s in a row N C H s r or column N C H s c is presented by Equation (2),
N C H s c = N C H s r = N n k n ˜ c .
The cluster, k height ( C k h ) or width ( C k w ) in sensor field F having height F h and width F w are defined by Equations (3) and (4), respectively, as
C k h = F h N C H s r
and
C k w = F w N C H s c .
Therefore, the cluster size at the K t h step with height C k h and width C k w can be represented by Equation (5) as
C s i z e k = C k h × C k w = F h N r × F w N c = n ˜ c F h 2 N n k .
Similarly, the new range, represented by R k at the k t h step, is defined by Equation (6) as
R k = C k h ,
where = C i h / R i is defined as the system design parameter.
Our proposed method can adjust these parameters to maintain N C H s c . At the network setup phase, all nodes are assigned the same fixed amount of energy without any depleted nodes. The proposed scheme keeps track of remaining nodes. We assume that, after a certain number of communications, a number of nodes are declared as depleted as their energy reaches zero. After depletion of T h r of the total sensors in the network, it resets range R i and C s i z e k along with K t h , height, and width i.e., C k h and C k w are also readjusted based on the current status of the network.

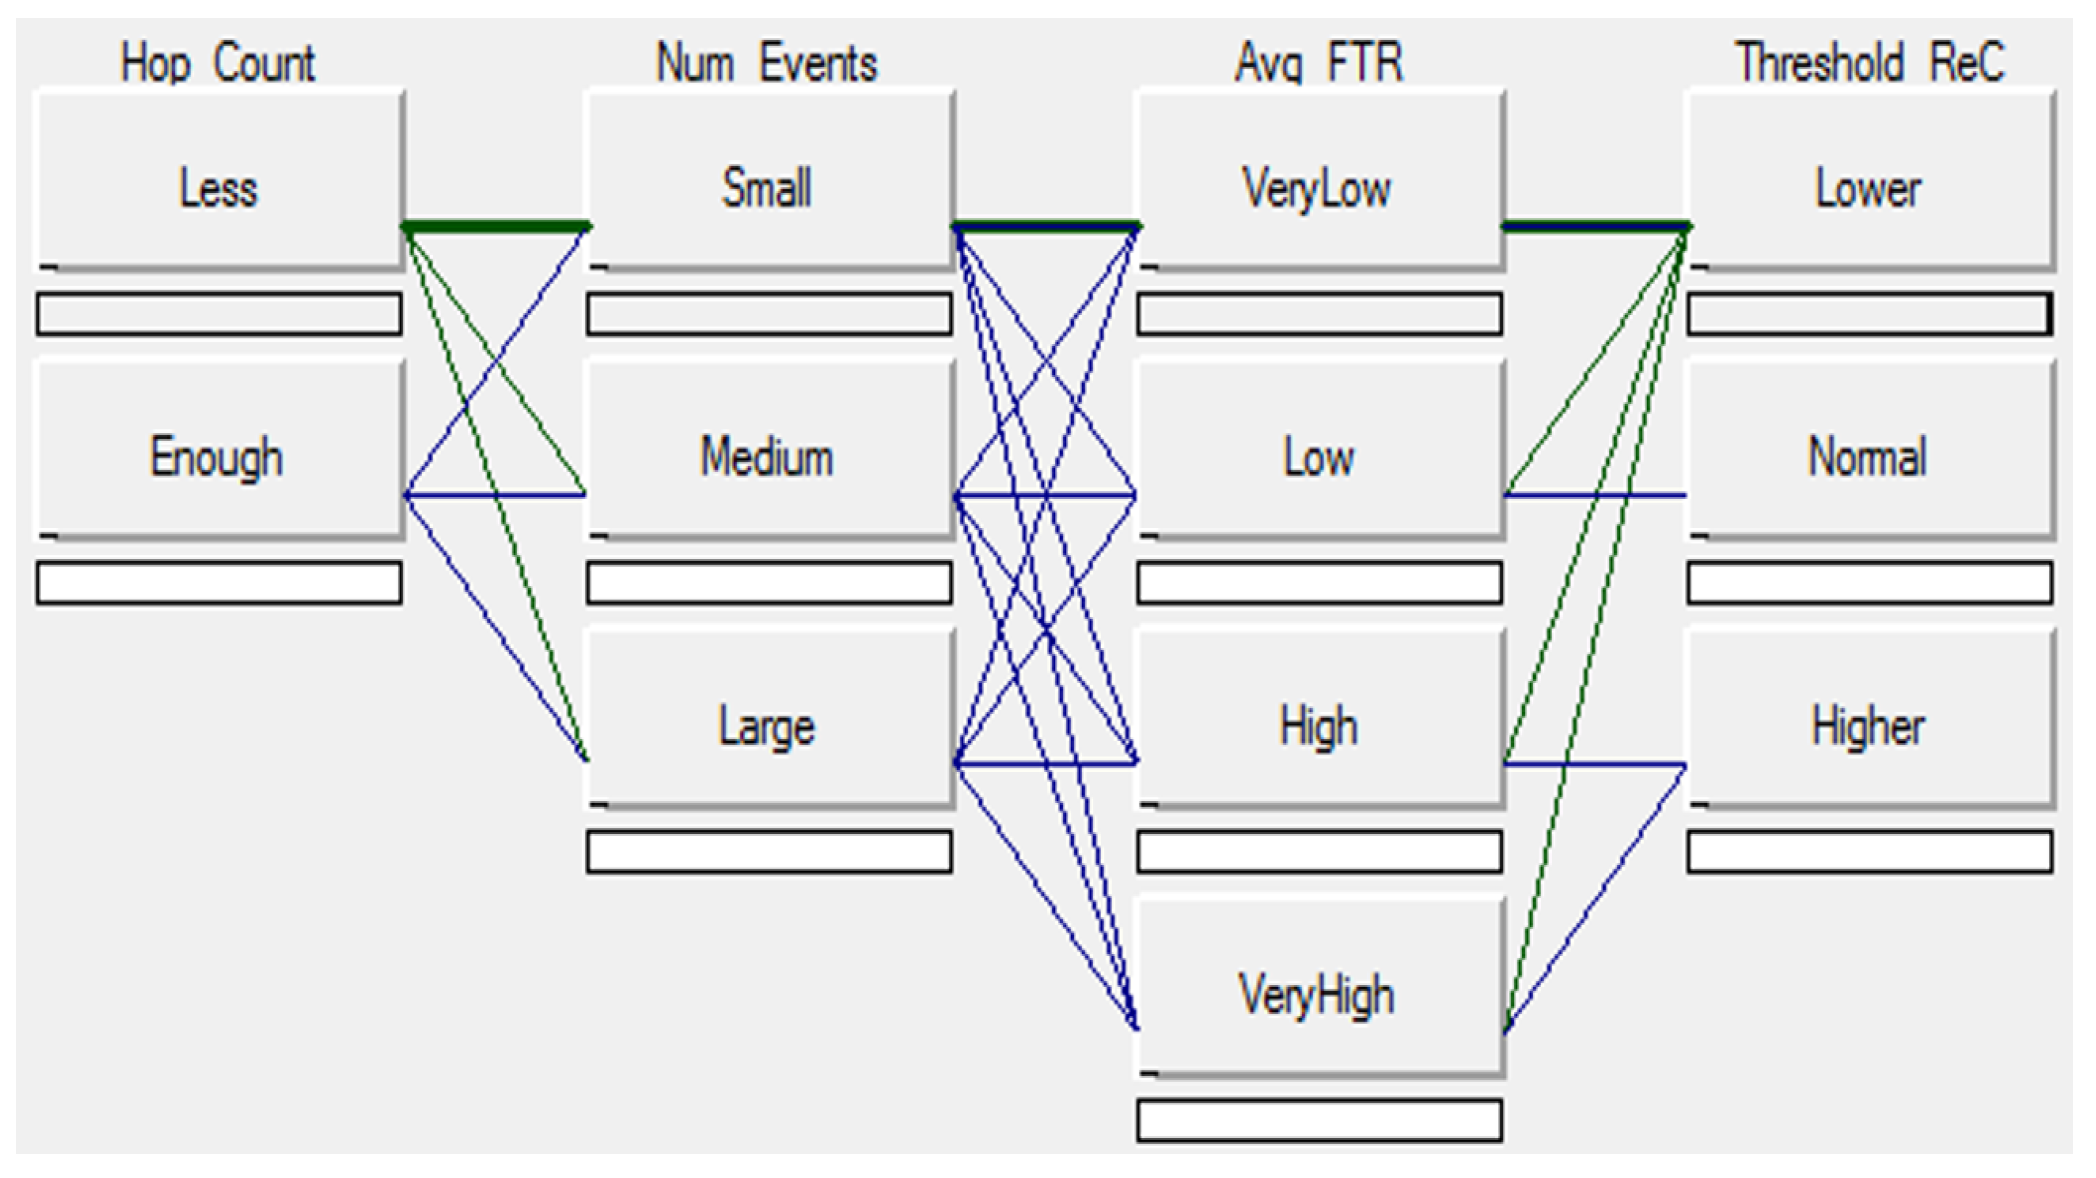
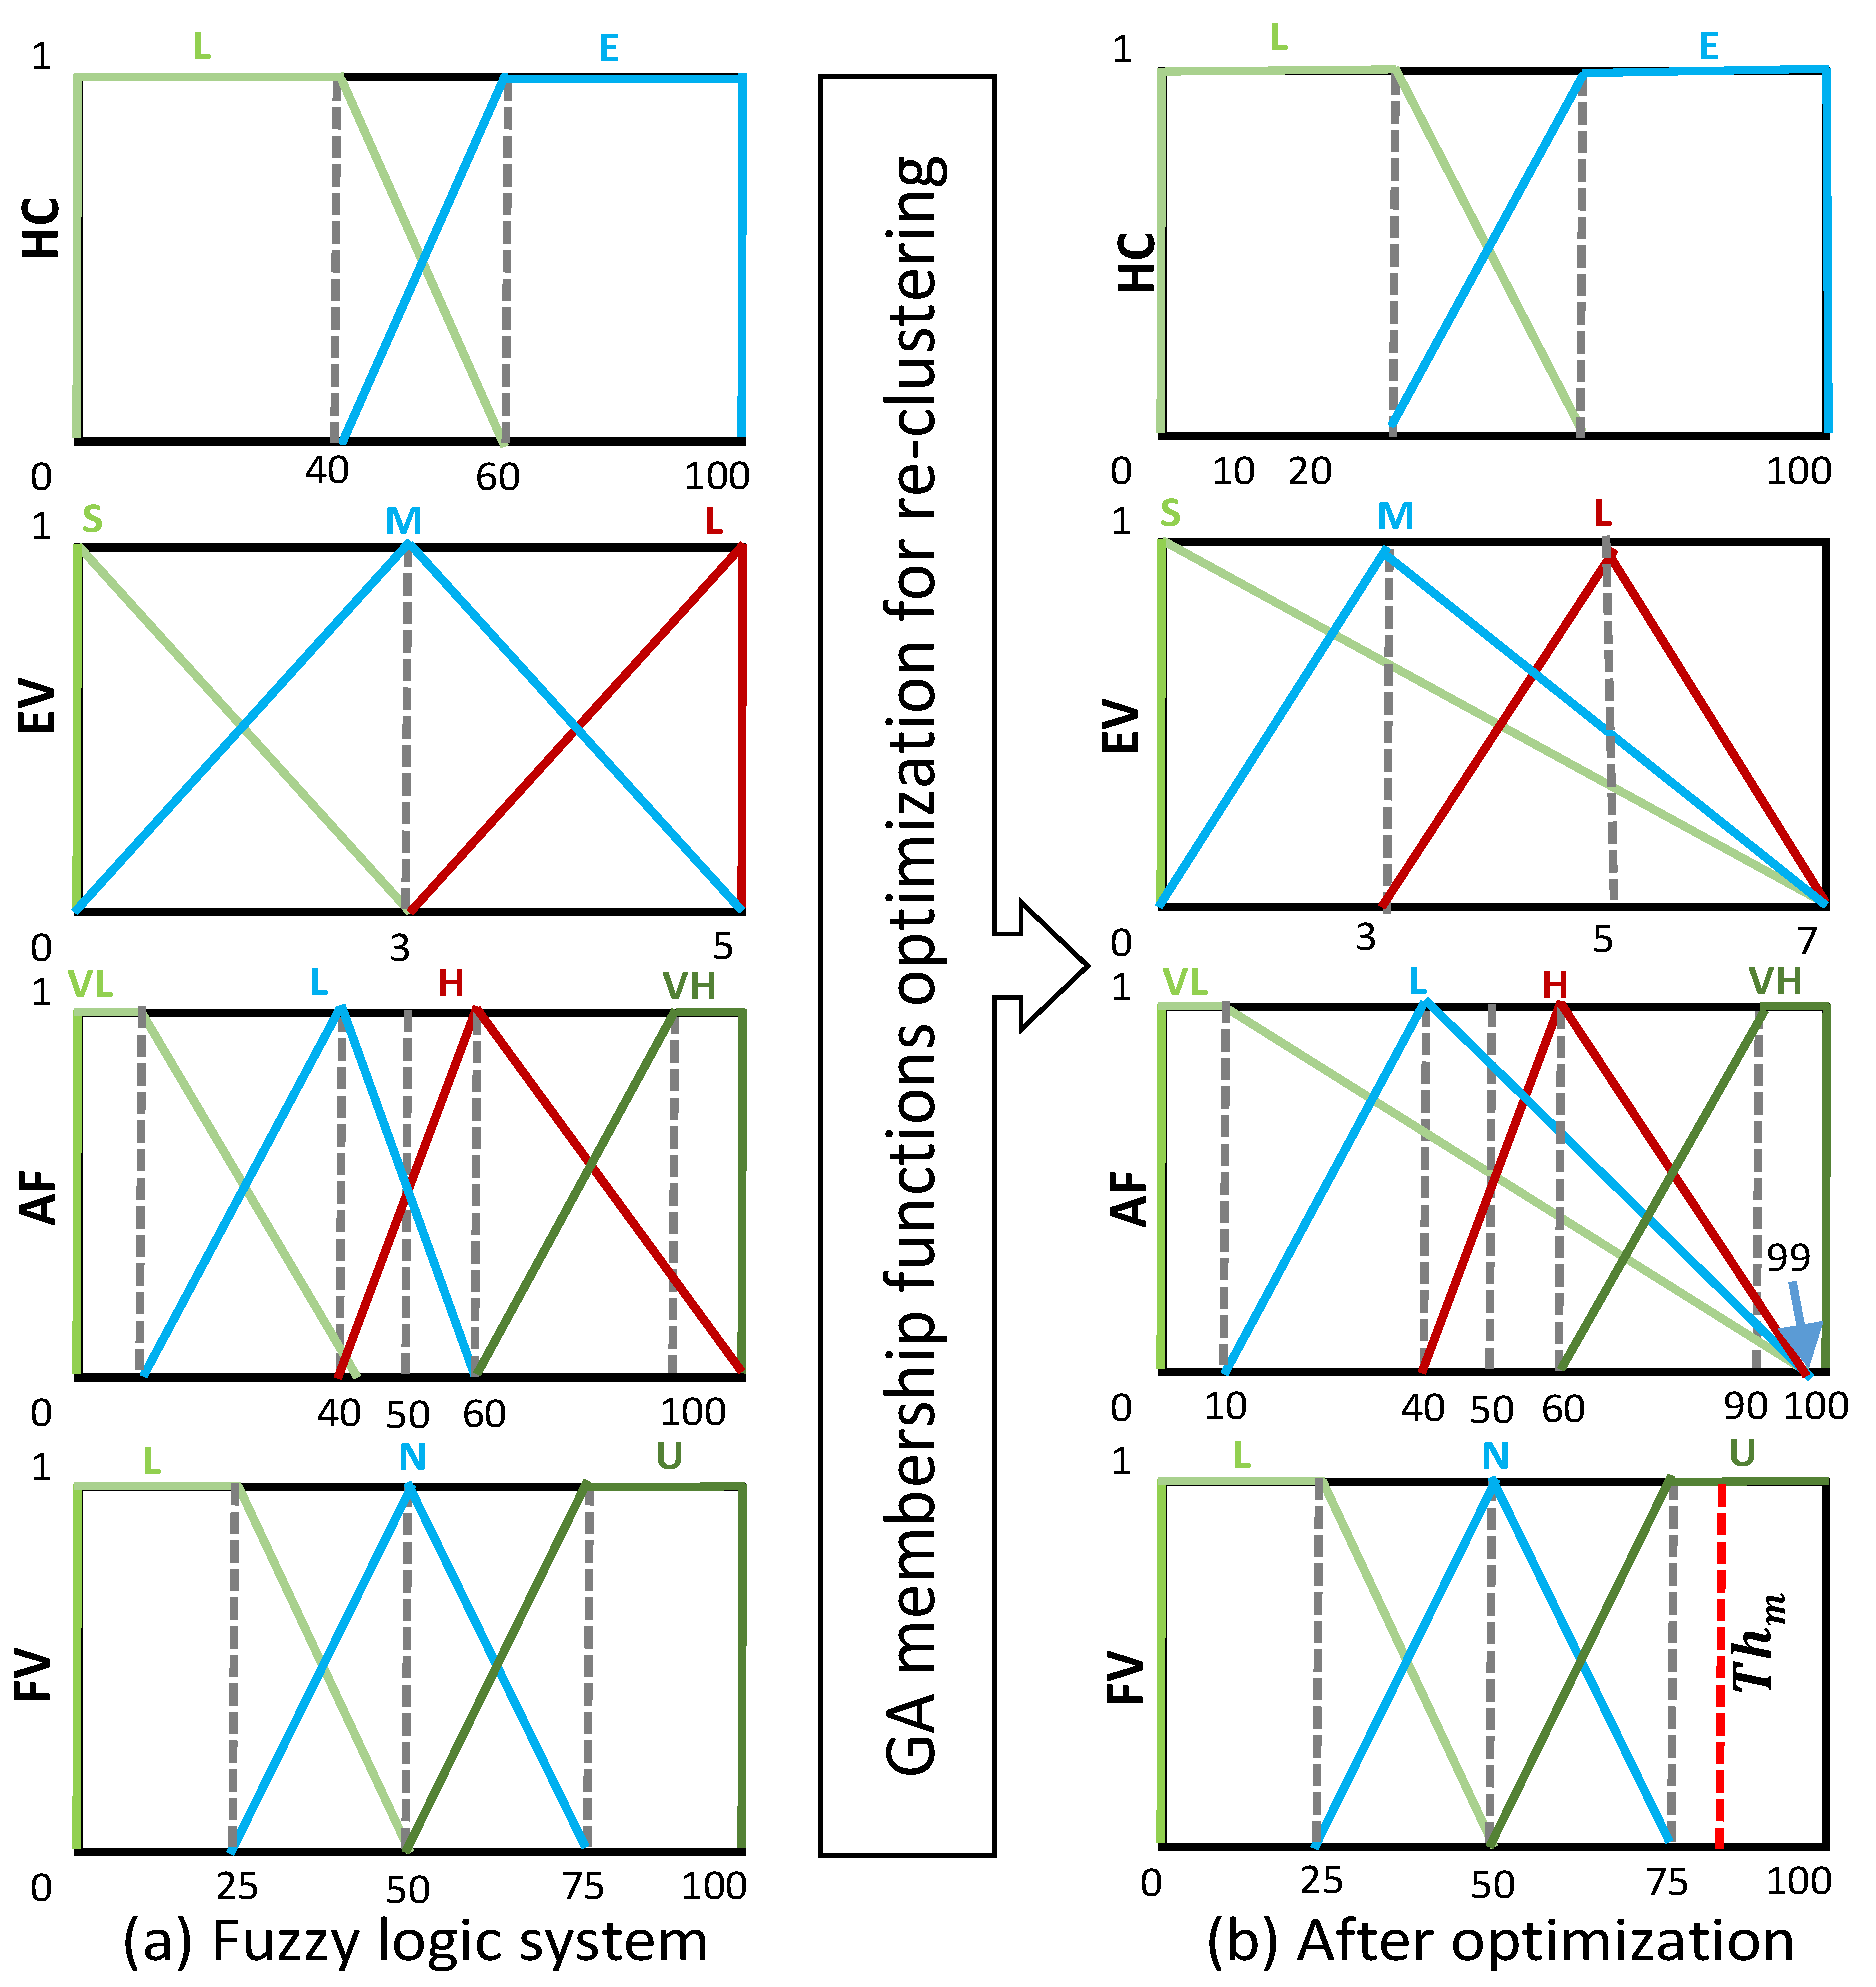
4.1.6. Fuzzy Rule Based System

In order to drive the fitness value of T h m , the fuzzy system considers three inputs: (a) HC, (b) EV, (c) AF, and returns (d) FV. The fuzzy system for re-clustering threshold membership functions, their associated fuzzy sets, and rules are highlighted in Figure 4. The number of fuzzy sets determines the level of granularity or degree of a membership function. Moreover, the range of the fuzzy sets is set based on their importance. For the three input factors, there are two, three, and four fuzzy sets, so there are 24 combinations or rules for fitness value.
The membership functions, boundary values, and ranges of corresponding fuzzy sets are highlighted with different colors. The vertical height of each membership function is one. The details of fuzzy membership functions, fuzzy sets, and horizontal values are defined below:
  • HC represents the hop count for a report from 0 to 100. It has two fuzzy sets, namely less (L) and enough (E).
  • EV is the number of events being generated in the sensor network from 0 to 7. The higher the number, the more the communication overhead is associated, and vice versa. This fuzzy membership function has three fuzzy sets, namely small (S), medium (M), and large (L) from 0 to 100.
  • AF refers to average FTR which has four fuzzy sets; these are very low (VL), low (L), high (H), and very high (VH). This has more fuzzy membership sets due to its relative importance for security to counter different ratios of attacks.
  • FV or fitness value has four fuzzy sets of lower (L), normal (N), and upper (U) from 0 to 100.

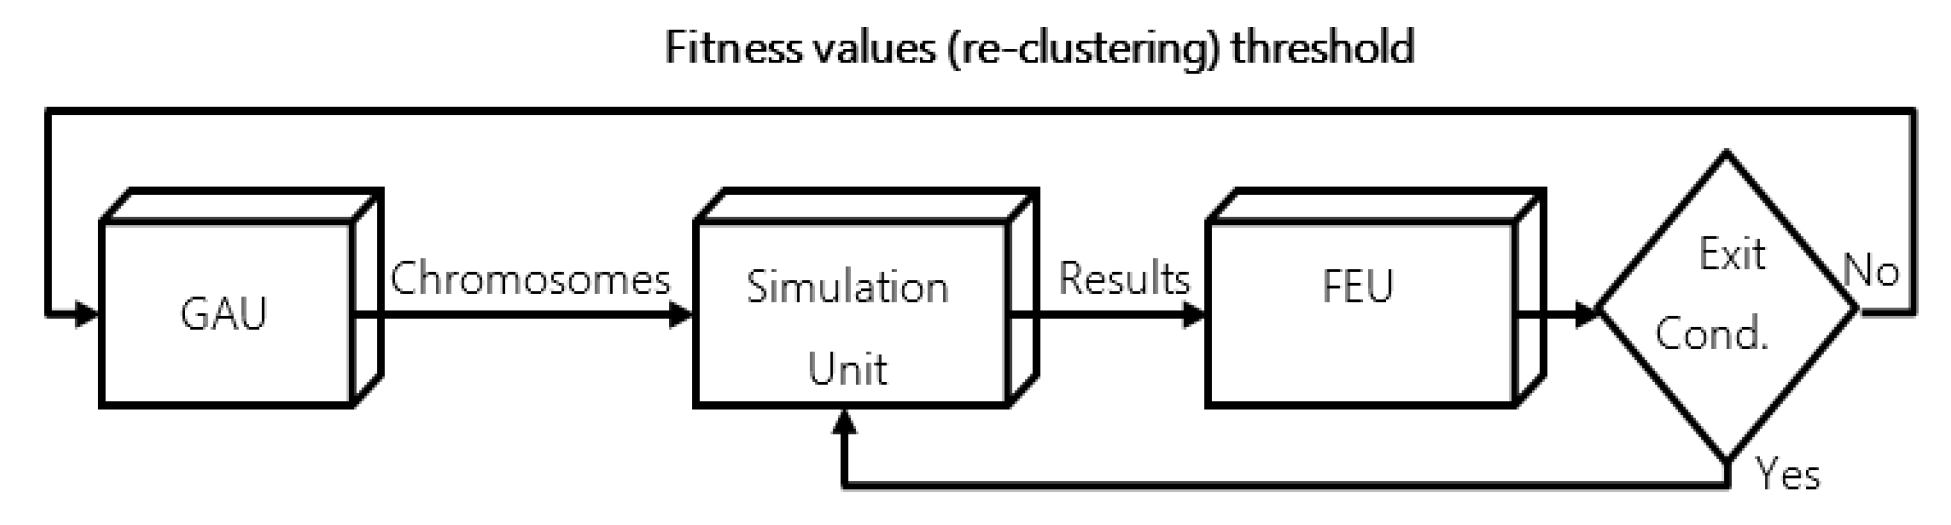
4.1.7. GA-Based Optimization

In order to determine optimized fuzzy membership functions, a GA-based membership function optimizer for re-clustering is illustrated in Figure 5. A chromosome represented one trial set of fuzzy membership functions. The optimizer consists of the GA unit (GAU), the simulation unit (SU), and the fitness evaluation unit (FEU), as illustrated in Figure 6.
  • GAU: The GA-based optimization process begins, and the GAU initiates the population. It randomly generates and maintains a population. Chromosomes from the population are evaluated by the simulation and their fitness value is computed using simulation results.
  • SA: SU starts simulations using chromosomes from the population, and the chromosomes are generated by the population of randomly generated bit strings. The bit string representation of chromosomes render it feasible to employ mutation and crossover operations. The performance parameters or membership function as highlighted in the corresponding fuzzy system are measured in the simulation process.
  • FEU: Based on the simulation results for all chromosomes being finished, the fitness value representing the threshold value is computed by the FEU. The fitness value of the re-clustering threshold ( F R T ) of chromosomes is shown in Equation (7),
F R T = D N × 1 α 2 + T E + A F × 1 β 2 ,
where D N is the total number of depleted nodes, TE is the total energy consumed in the sensor network, AF is average FTR, and α , β are weighted factors for these parameters.
Based on the current fitness value, the GA unit evolves the current population. In order to produce the next generation of chromosomes, selection, crossover, and mutation operations are applied to the population in GA. The optimization process in GAFOR—(1) simulation, (2) evaluation, and (3) evolution—is repeated until the exit condition becomes true. In order to avoid local optimal, a high mutation probability or tolerance are beneficial for a globally optimized solution. The entire optimization process is processed within the simulation experiments. There is one simulation setup for optimization and three different and diverse experimental evaluation setups to apply our method.
After the threshold calculations are completed, the new values of membership function are obtained based on these optimized membership functions being calculated. Based on these new membership functions, the corresponding final ( T h m ) is optimized for the best performance based on network conditions, not guesses or experiences. It does not require many resources as, after optimization, the optimizer is terminated and the threshold obtained for re-clustering is used on wards.
Terminating condition: The terminating condition is satisfied when the fitness value of the highest ranking solution has reached a steady state such that further iteration no longer produces better results. For that purpose, we used tolerance τ =10 for optimization. Therefore, when there is no significant performance improvement after 10 consecutive iterations, we terminate the optimization.

4.2. System Models

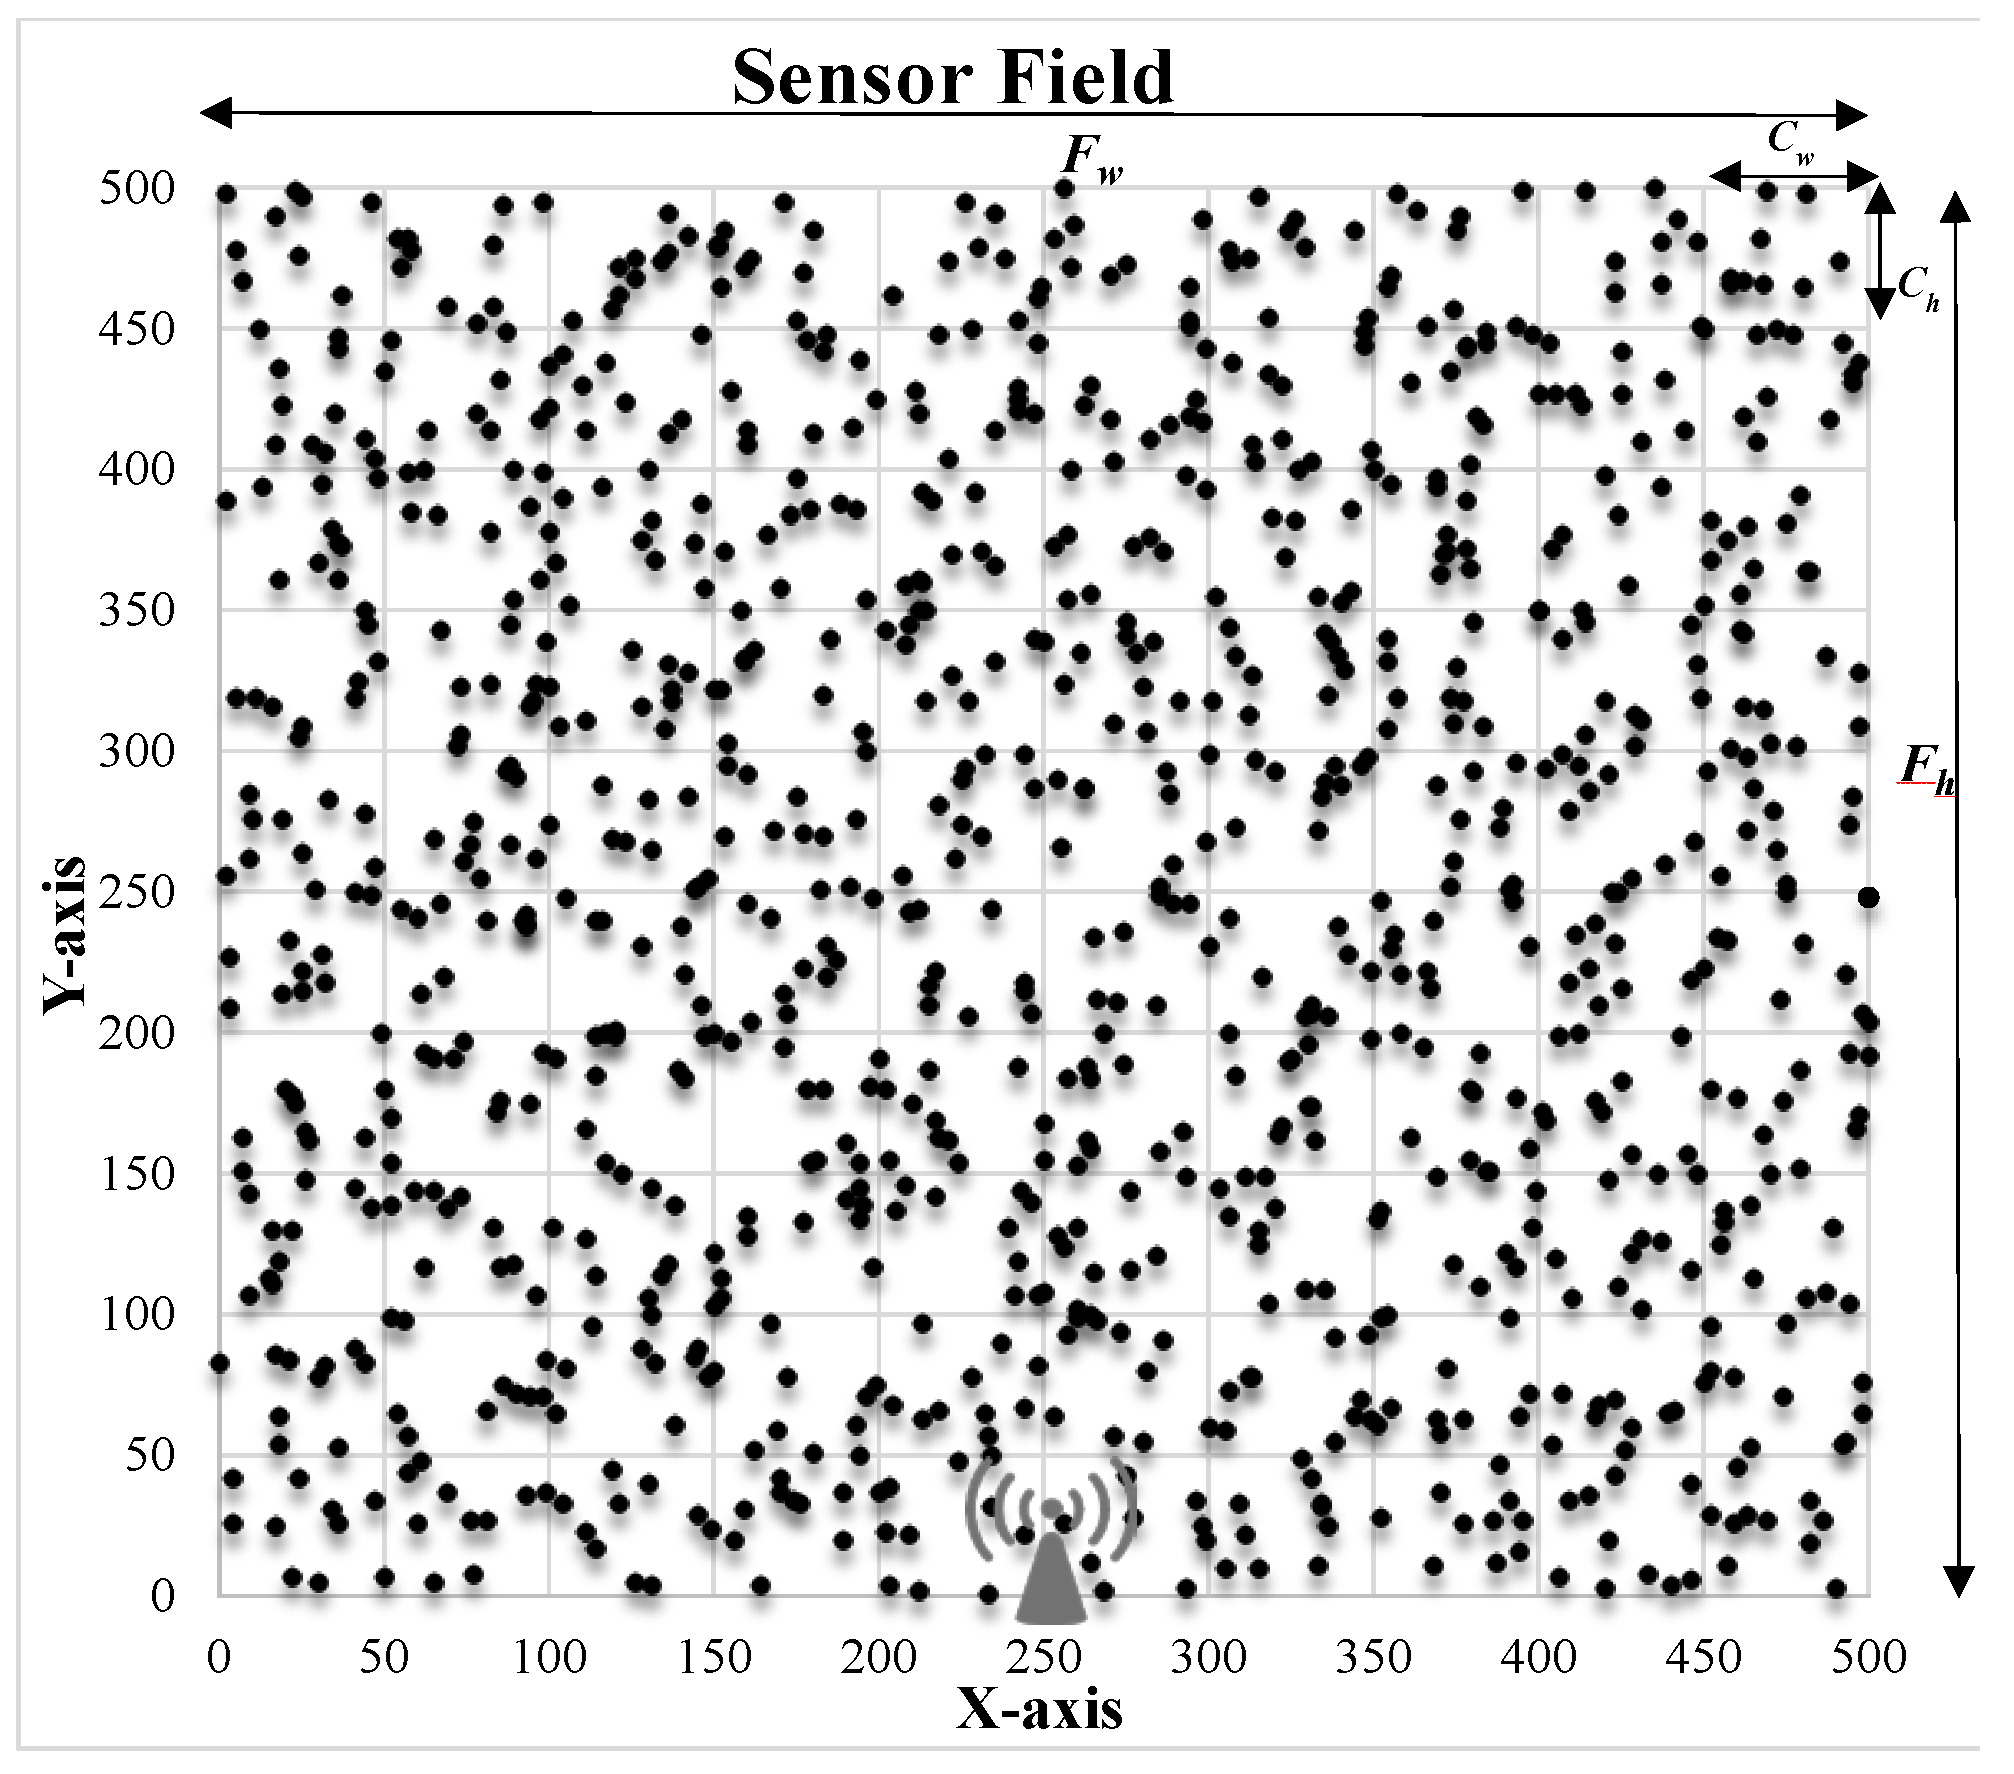
4.2.1. Sensor Network Model

There are N sensor nodes denoted by a set S 1 , S 2 , S 3 , , S n that are evenly and randomly distributed within a squared field of an area A F = F h × F w as illustrated in Figure 7. The B S location is at the middle bottom edge of the field. Encompassing this are the k clusters that are denoted by a set C 1 , C 2 , C 3 , , C k , such that k = H n × W n , where H n = W n represents the number of rows and columns. At the startup phase, C number of clusters, represented by A C = C h × C w are generated. There are an equal number of nodes dispersed, represented by node density ñ of clusters.

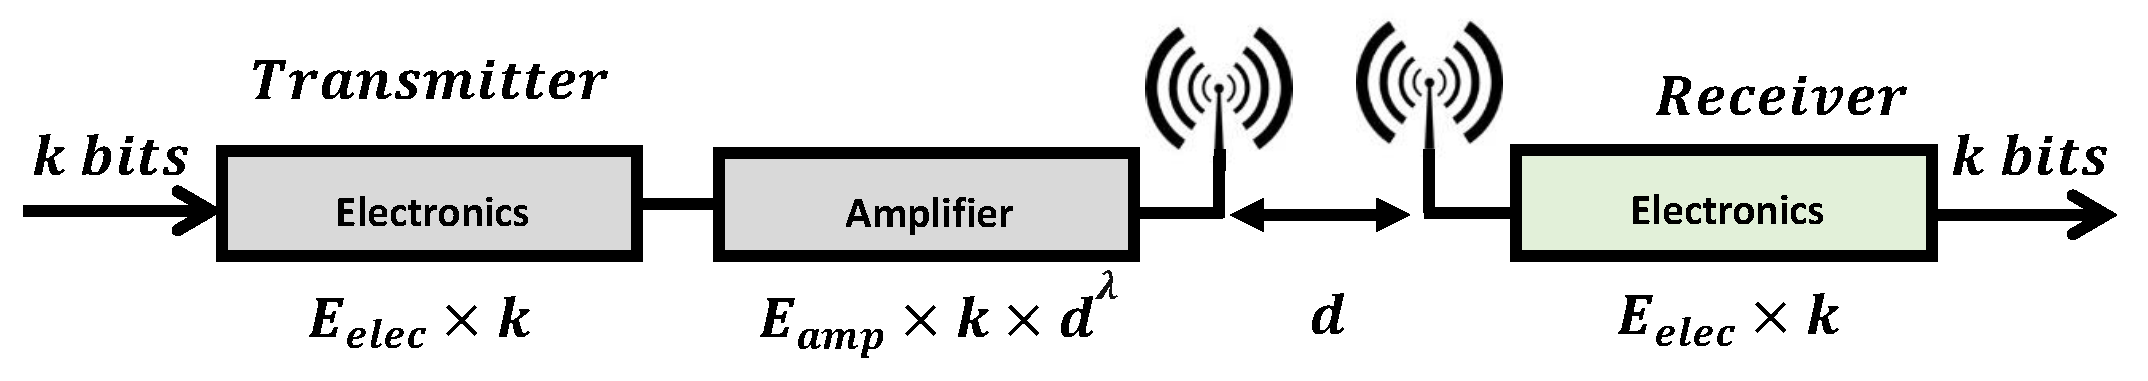
4.2.2. Energy Consumption Model

For sensor node energy usage management, the first order radio model [11,12], a channel model with a free space (i.e., d 2 ), has been used. In this paper, energy dissipation of radio components and circuitry was considered as illustrated in Figure 8.
A packet consisting b bits is transmitted at a d distance between the transmitter ( T x ) and receiver ( R x ), using transmission energy E T x b , d , illustrated by Equation (8) as
E T x b , d = E e l e c × b + E a m p × b × d λ ,
where E e l e c represents the energy consumed by the electronics circuitry, whereas E e l e c × b represents the energy needed by the T x electronics to propagate b bits. Furthermore, E a m p is the amplifier energy, and the path loss constant is represented by λ . The required energy to receive b-bits is denoted by E R x b as shown in Equation (9),
E R x b = E e l e c × b .
The energy for transmission used by the T x amplifier is E a m p = 100 p J / b / m 2 . Moreover, required energy by circuitry of T x and R x is 50 n J / b . The values of E e l e c and E a m p are chosen in such way that they result in an acceptable E b / N 0 [12].

4.2.3. Attack Information Model

The B S can determine the expected event reports generated by the C H for a query–response session. Upon receiving legitimate reports at the C H , the counter for such reports is incremented by one at the B S . Here, no extra cost for the messages or energy is needed at the sensors.
Similarly, fabricated event reports are filtered in the path or at the B S . If a fabricated report was dropped on the path, the B S can know after a predefined was time elapsed. In a second case, the fabricated event report will finally be dropped at the B S if it fails to be detected by en-route filtering nodes.
Therefore, the B S knows the total of fabricated and legitimate reports by exploiting respective counter information without using extra energy or messages on the sensor nodes. Using this information at counters, the current value of F T R can be calculated. The computational cost at the B S can be justified because of a sufficient amount of resources.
For m events in the WSN, the current F T R can be calculated by Equation (10) as
F T R = i = 1 m ( 1 × F i ) i = 1 m 1 × F i + 1 × L i ,
where F i [ 0 , 1 ] , L i depicts legitimate reports, and F i indicates the fabricated, defined as follows:
F i = 0 if the i t h report is valid . 1 if the i t h report is false ,
In Equation (11), i represents the total event count from 1 to m.

5. Experiment Environment

For fair evaluation of the proposed scheme, different setups were employed for training and testing.

5.1. Experimental Setup for Optimization

The simulations’ setup parameters for GA-based fuzzy optimization are illustrated in Table 1. The fuzzy membership optimization using GA is performed on the B S . Since the BS has sufficient enough processing and computational power and simulation are performed by the software, the cost of optimization is not considered. After optimization, we apply our method using fitness thresholds for when to perform successive sink re-locations and re-clustering.

5.2. Experimental Setup for Performance Evaluation

In this work, we consider a 100k-node (k = 10, 7, 4) randomly disseminated in WSN with an area of ( 500 × 500 ) m × m with k c = 100 clusters. In each cluster, a fixed number of nodes η c are distributed randomly. All of the sensors have a range, R i = 50 m ± ε , where ε = 10 % perturbation is introduced, as, due to obstacles, all sensors’ actual ranges may vary. Range is used for neighbors selection, choosing candidates, and forwarding nodes. The variation in initial energy levels of sensor nodes is also accommodated by introducing ε = 5 % noise. Furthermore, different network sizes and FTRs are used to test the robustness of our approach on diverse setups and environments.
The experimental evaluation setup parameters with network size 1000, 700, and 400 sensor nodes are shown in Table 2. The B S is located at (250 m, 0 m) and knows node IDs, locations, and k n keys of each node. At start-up, the boot-up process with localization is initialized. In the simulation, we execute the model of the proposed system as described in Section 4. Table 3 highlights the equations along with the respective context used in the simulation modeling.
The simulation experiments have been carried out building a C++ simulator using Microsoft Visual Studio 2010 (Redmond, Washington, USA).

6. Performance Evaluation

Performance measurement, analysis, and experimental results are presented in this section.

6.1. Performance Measurement

The performance is compared using first node depleted (FND) and percentage nodes depleted (PND) performance metrics for network lifetime results. FND is the number of communication rounds needed for the first node’s energy level reaching zero. PND is the percentage of nodes having zero energy after no more communication is possible due to network partition. The higher the percentage of nodes depleted, the better the scheme is in balancing communication loads and thus the better at avoiding the hot-spot problem and hence extending network lifetime.
Energy-efficiency is determined using average energy consumption per round by a given scheme. The detection capacity is measured using the percentage of attacks detection. These performance measures are evaluated for three different network sizes and three attacks ratios as explained earlier.

6.2. Performance Analysis

We analyze the performance of our scheme for network lifetime and energy efficiency analysis.

6.2.1. Network Lifetime

Three paths are denoted by p 1 , p 2 , and p 3 , fixed F T R (or f), and a constant key ratio (t) (i.e., total keys over total nodes en-route) as in Figure 9a. In greedy routing, the forwarding node is determined by distance only. This results in a single or fixed path which would be used unless it is broken by depletion of a node on the path or a session is expired.
Considering p 2 as the shortest path, intuitively disconnect first. In contrast, the proposed scheme has multiple paths to select from since remaining energy varies with time, therefore resulting in alternative path selection, thus resulting in more events reported to the B S from source C H . Thus, if lifetime is defined by first node depletion, the proposed scheme results in extended network lifetime.
Example: For the sake of simplicity, let us assume that required energy for one T x or R x is 0.1 J, whereas 1J the total energy of a node. Consequently, after five T x and five R x , the fixed path p 2 , will be disconnected as the first node is depleted in ten communications. On the contrary, in the proposed scheme, energy aware and dynamic routing are employed using energy and attack information instead of distance only. Hence, it can alternatively traverse various paths among p 1 , p 2 , and p 3 .
As the energy consumption for communication will be distributed among three paths, the energy consumption will be more balanced among these three routes. Therefore, theoretically, the lifetime would be prolonged up to three-fold if events are evenly using all three paths alternatively in GAFOR. Therefore, the proposed method can prolong the network lifetime regardless of the F T R .

6.2.2. Energy-Efficiency Analysis

Now, consider three paths represented by p 1 , p 2 , and p 3 having different F T R f 1 , f 2 , f 3 and key ratios t 1 , t 2 , t 3 as illustrated in Figure 9b.
In order to select the forwarding node, a compromise is required between the k w keys’ existing en-route nodes and the energy. By the number of k w on en-route nodes, verification nodes as nodes with keys consequently assume verification responsibility. In the case of higher attacks, a path with more verification nodes is selected to save energy by dropping fabricated reports at minimum hops in the proposed scheme. Whereas, in the lower attacks case, a path with a proportionally lower number of verification nodes would be selected—since, in this case, legitimate nodes have to concur with a lower number of verification, hence saving energy.
Example: In the case of a higher number of attacks (e.g., f 3 ), a path is chosen (i.e., p 3 ) having a proportionally higher number of verification nodes, which results in dropping more fabricated reports earlier, hence saving energy. Similarly, for a lower number of attacks (e.g., f 1 ), a path is chosen (i.e., p 2 ) having a lower number of verification nodes; as a result, legitimate reports would need less verifications that save energy. Therefore, dynamically selecting based on attack information, energy could be saved in both cases.

6.3. Performance Results

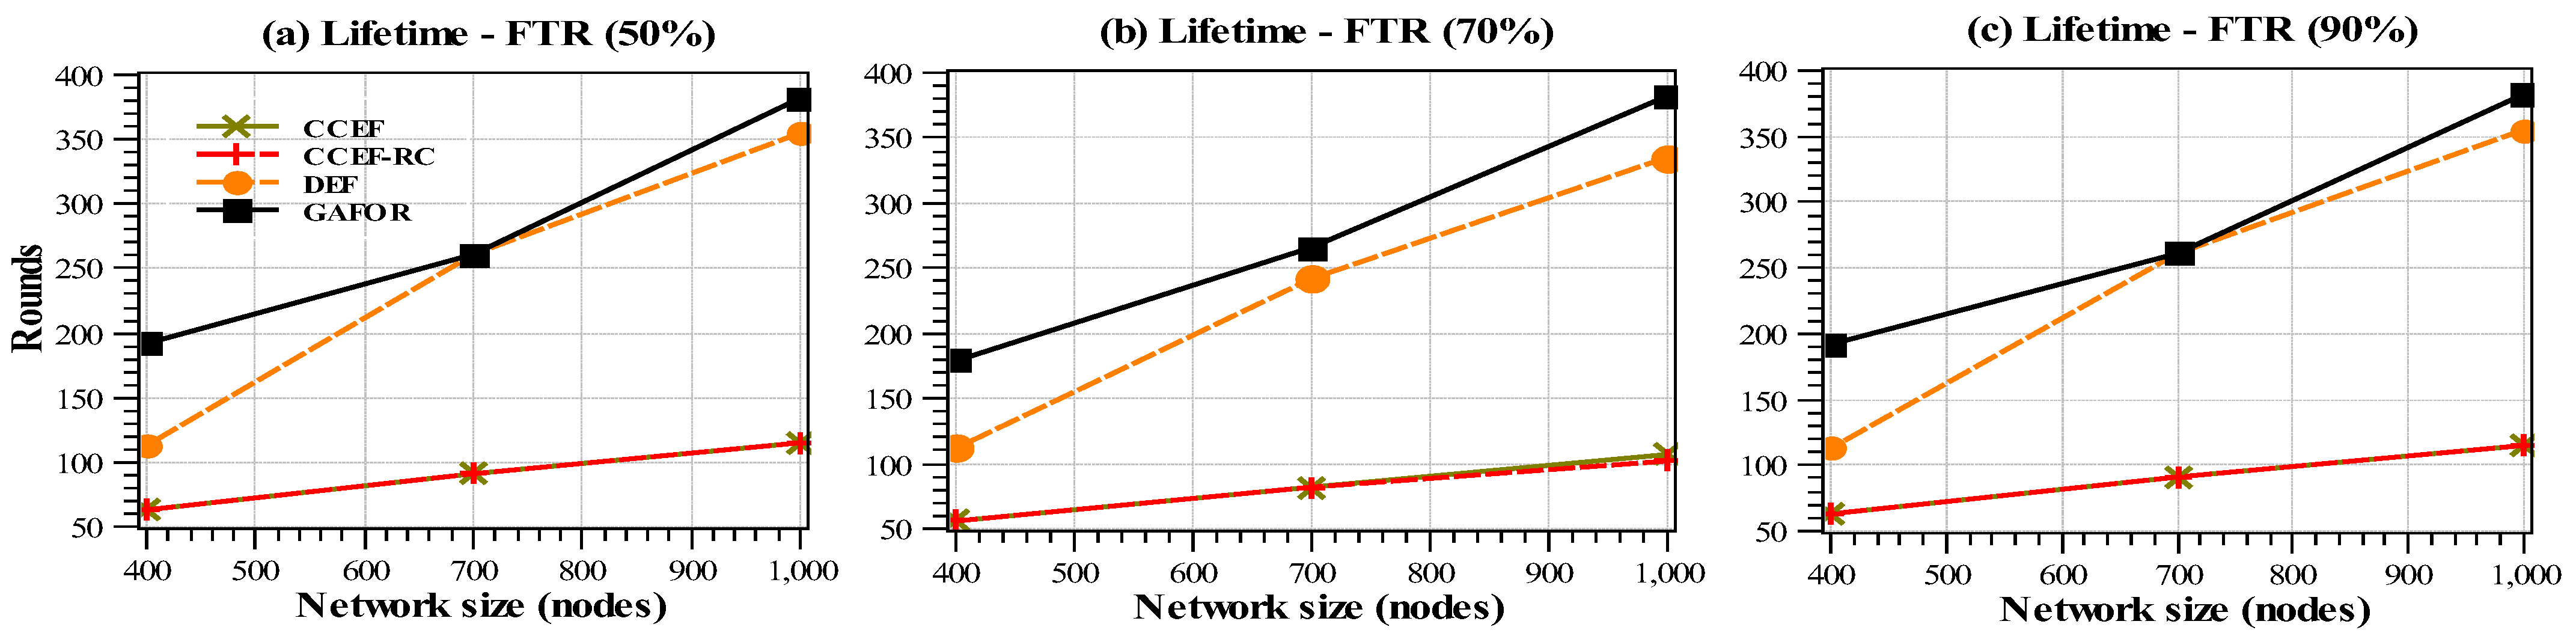
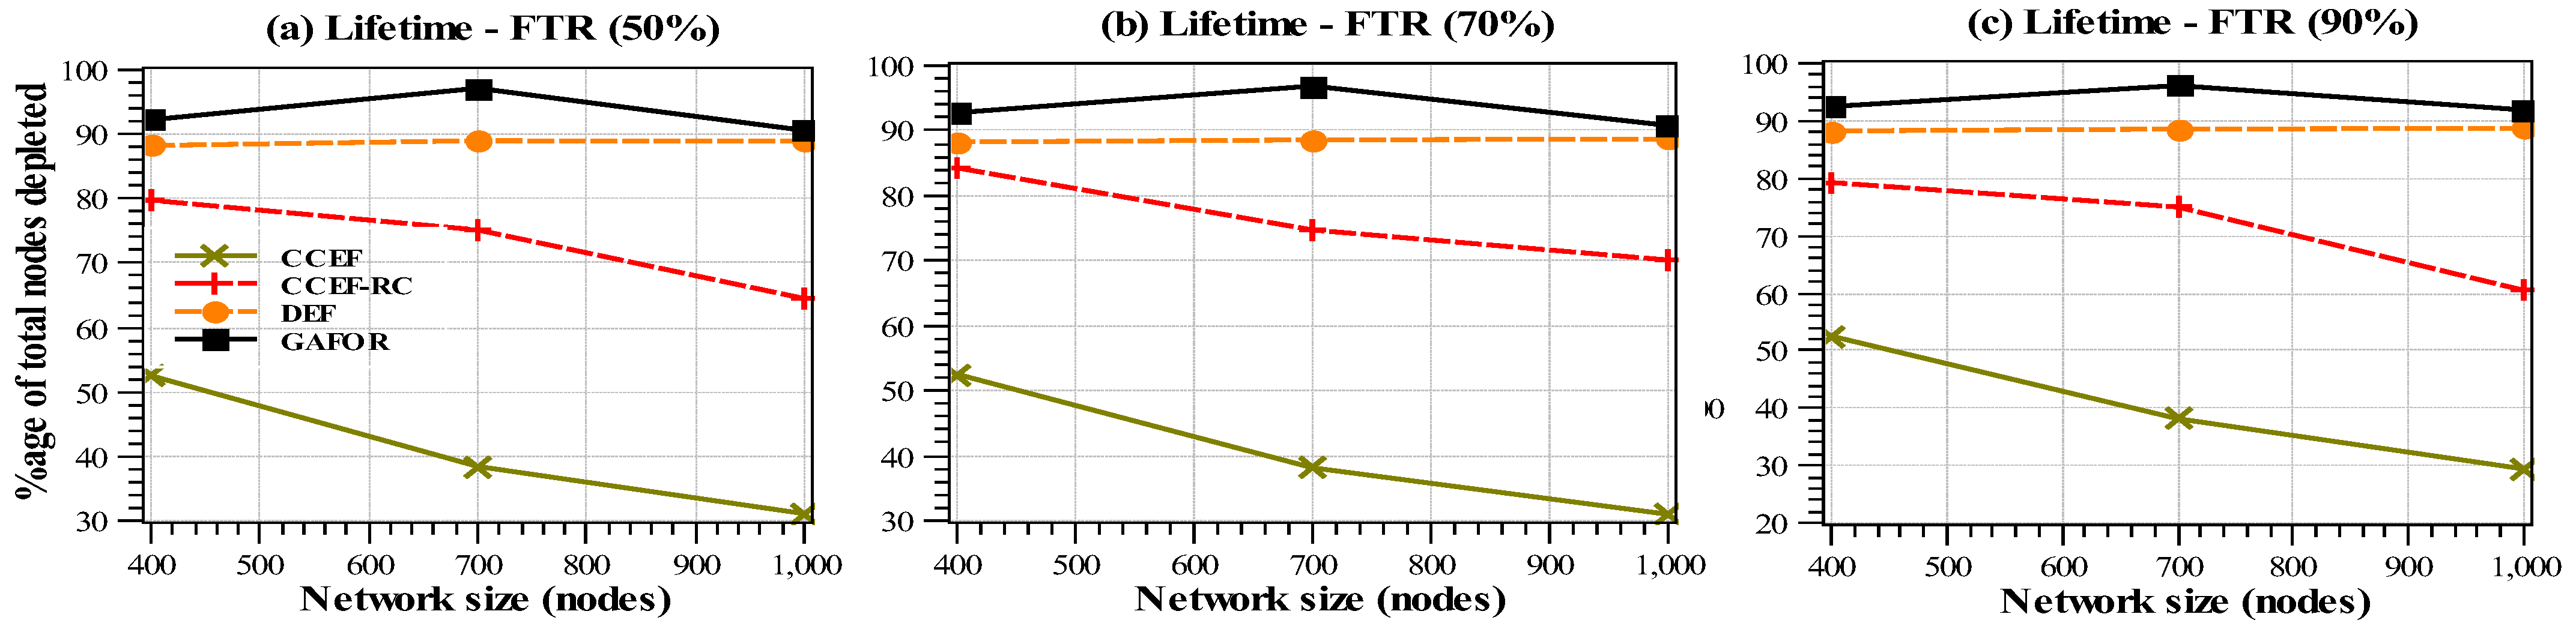
6.3.1. Network Lifetime

A network lifetime performance comparison of GAFOR with existing schemes such as DEF [2], CCEF [3], and CCEF with re-clustering (CCEF-RC) using FND is shown in Figure 10. The reasons for choosing DEF and CCEF schemes to compare the performances of the proposed technique can be explained as follows. The DEF addresses false report injection attacks in WSNs and adopts multipath routing to deal with the topology changes of the networks. Because of its faster false reports’ dropping rate with a low memory requirement, the DEF is still regarded as the benchmark en-route filtering strategy against false report injection attacks. Like DEF, the CCEF also drops fabricated reports en-route, but it does not require symmetric key sharing. In CCEF, the source node sets up a secret association with the BS for each session. Because of this stronger security protection, CCEF is also widely considered a representative en-route filtering scheme. In addition to DEF and CCEF, we have also considered CCEF with fixed time-instant-based re-clustering for a fair comparison. The x-coordinate represents network size in terms of the number of sensor nodes in a squared sensor field of fixed area. The y-coordinate is the number of communication rounds. The margin of improvement varies with network size and F T R . The performance of CCEF and CCEF-RC is similar since re-clustering is performed after a certain number of nodes are depleted. In terms of performance, GAFOR outperforms existing schemes.
In the case of performance metric PND, proposed schemes also perform best among compared schemes in all three setups with different F T R as shown in Figure 11. In the case of PND, CCEF-RC performs better than CCEF due to re-clustering. A margin of improvement is observed for network sizes of 400 and 1000 nodes compared to 700 nodes. Although GAFOR performs better in all cases, the margin of improvement decreases with an increase in F R T . GAFOR shows 2.71 to 2.92 fold improvement using FND and 2.29 to 2.34 times using PND. A summary of network lifetime performance using FND and PND is shown in Table 4.

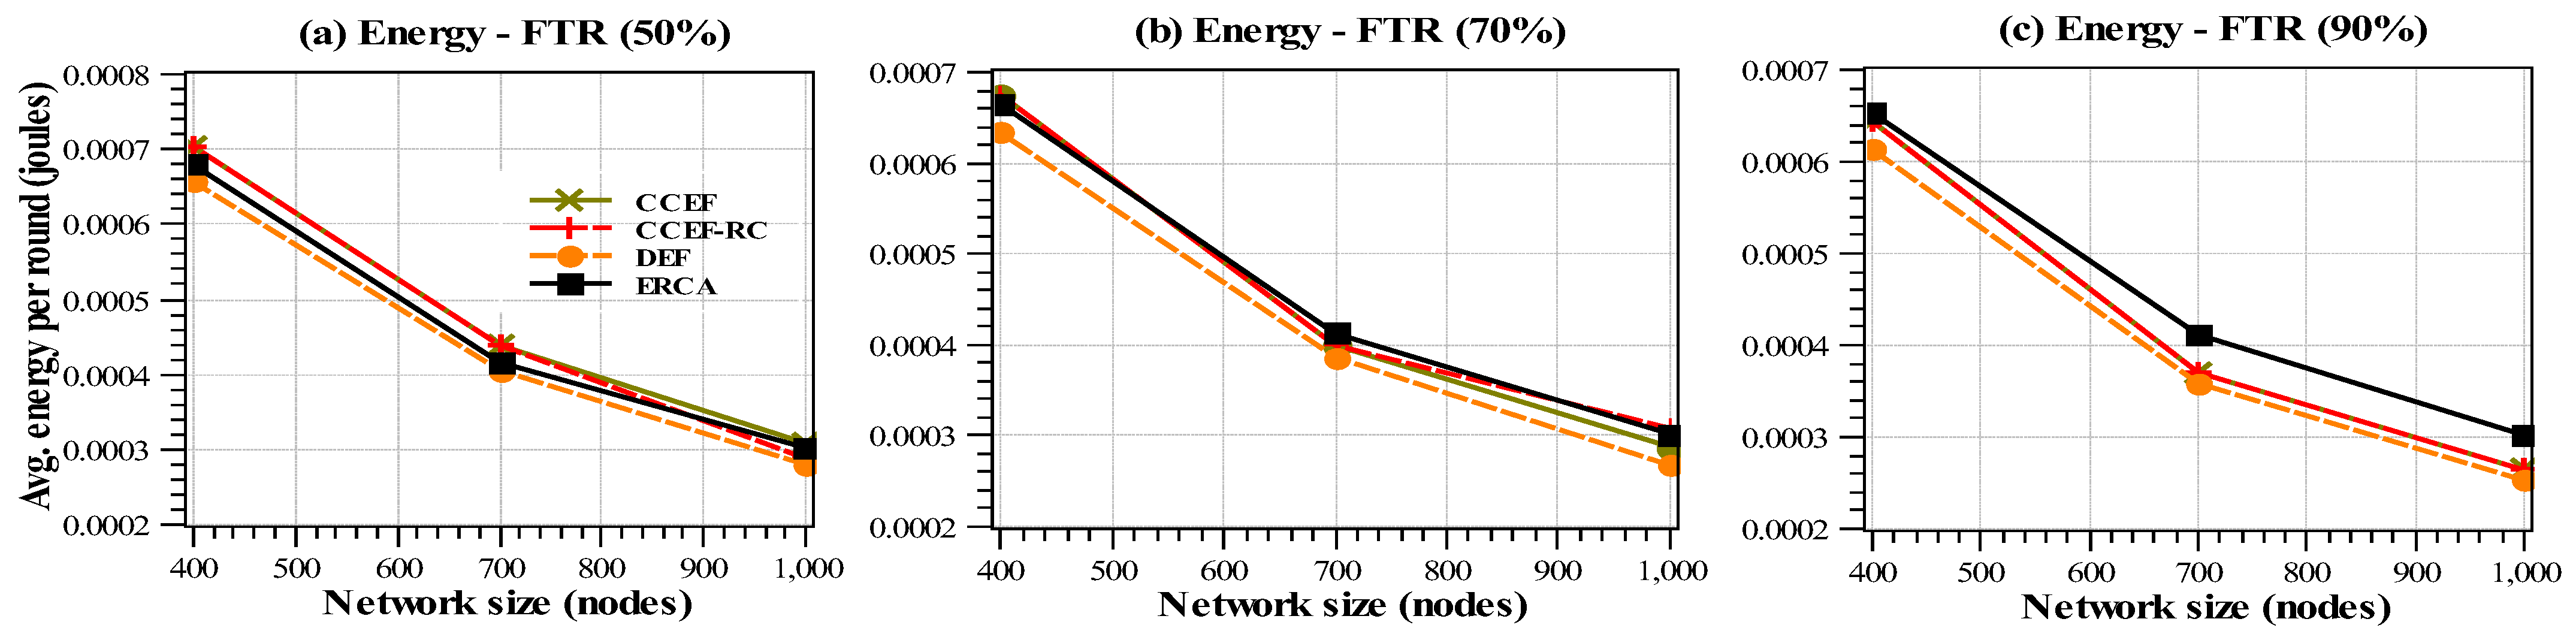
6.3.2. Energy-Efficiency

The energy-efficiency performance of GAFOR and existing schemes is shown in Figure 12. The x-coordinate illustrates network size while average energy consumed per round in joules is represented on the y-coordinate. The less energy that is used, the better the energy-efficiency performance of that scheme. We save more energy in proposed schemes at lower F T R . It is observed that, as the F T R increases, the relative gain in the energy-efficiency decreases as evident in Table 5 and Figure 12.
GAFOM average energy-efficiency is similar as compared to CCEF and CCEF-CR, while DEF performs better since it does not employ re-clustering, which saves energy. There is re-clustering and optimization cost associated with the proposed scheme that results in a decrease in energy saving. However, GAFOR has comparable energy efficiency in comparison to CCEF and CCEF-RC.

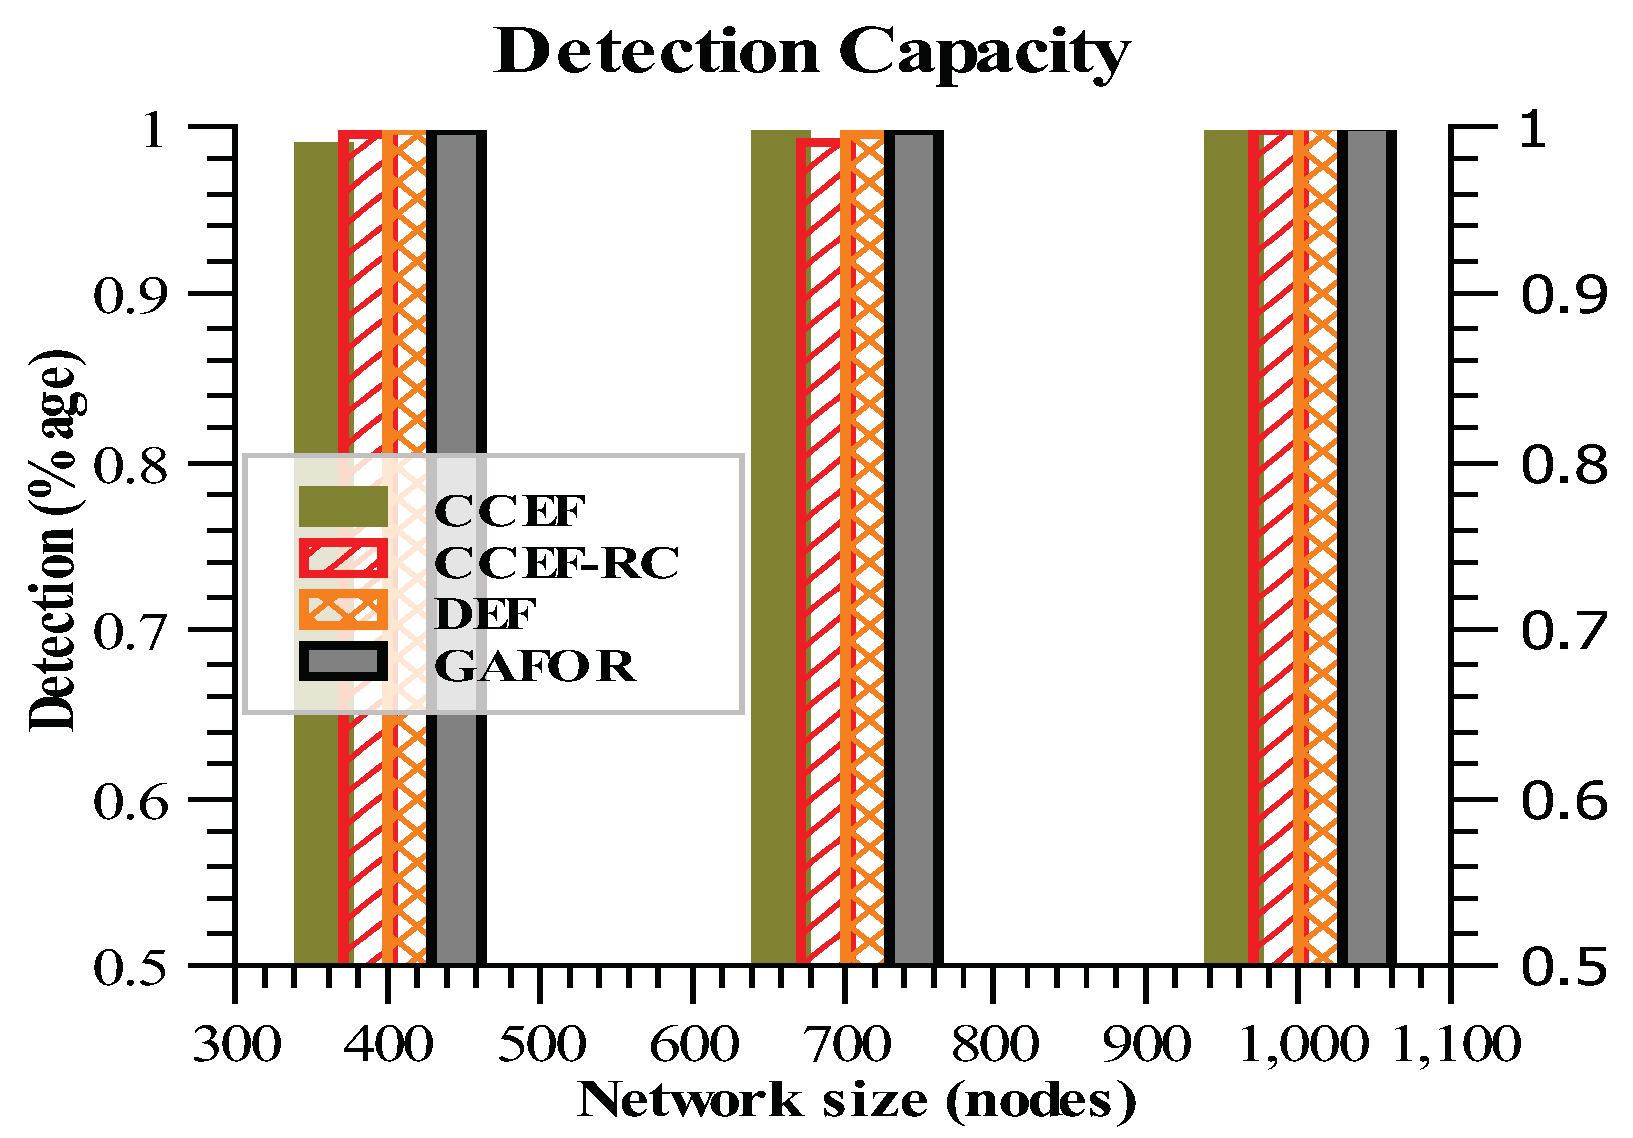
6.3.3. Detection Capacity

In this section, performance of GAFOR in terms of detection capacity (also referred as filtering capacity or detection power) is compared to existing schemes as shown in Figure 13. The network size is represented with the x-coordinate while detection capacity by the y-coordinate. The robustness of the our scheme is evaluated using different network sizes and F T R s . The detection capacity is defined in Equation (12) as
D e t e c t i o n C a p a c i t y = N u m b e r o f F i l t e r e d A t t a c k s N u m b e r o f A t t a c k s .
It is observed that, on average, the detection capacity of compared schemes is similar with trivial differences, while significantly extending network lifetime.

7. Conclusions and Future Works

7.1. Concluding Remarks

As outlined, several security schemes have the potential to extend network lifetime for routing. However, the en-route filtering scheme saves energy at the cost of network lifetime. The proposed scheme addresses the issue of extending network lifetime while preserving energy and security of the existing schemes by the joint consideration of network conditions and re-clustering. This study is the first of its kind to address underlying limitations of exiting en-route filtering schemes to extend network lifetime. The proposed scheme is novel in the sense that it introduces a GA and FLS based re-clustering optimizer that effectively determines the time-instance for the next re-clustering.
Major performance improvement occurs due to the application of FLS on routing and filtering node selection. This results in balancing energy load management and thus prolonging network lifetime. The proposed re-clustering further contributes to the extended network lifetime by estimating the time-instant of the next re-clustering using the GA. The GA basically optimizes the supplied standard fuzzy membership function to reflect various network parameters such as hop count, number of events, and F T R more precisely and eventually returns the exact number of events after which it is the best time to do the next re-clustering.

7.2. Limitations and Future Directions

A number of possible improvements of this study can be possible, which can be subjected to future works. Some of them are as follows:
  • The study presented in this paper is solely simulation based, and we have not ported the proposed algorithm onto a real sensor based embedded system and thus not tested it in a real environment. Whereas a simulation environment can assume perfect channel estimation and network synchronization, the real environment introduces various challenging tasks.
  • If a WSN can run for an enhanced lifetime, it will definitely be cost effective in the long run because various network elements such as sensor nodes and batteries will be utilized for a longer period of time, and the number of fresh network deployments will be reduced. However, the cost estimation from an economical viewpoint was beyond the scope of our present study. A complete cost analysis can be performed to get better insights into the relationship between an extended network lifetime from an en-route filtering perspective and overall network cost.
  • In addition to effective re-clustering, optimized sink mobility can further enhance the network lifetime. An interesting question in sink mobility is when and where to relocate the sink. In order to answer “when”, the time-instant, in terms of how many nodes were depleted (or events), can be determined by optimizing fuzzy membership functions for the sink relocation fuzzy system using GA. To address the "where" issue, we would evaluate the aforementioned trajectory as well as the energy-aware sink trajectory. Determining the optimal trajectory under a particular network condition, e.g., size of a network, sparse, or dense networks, would also be worthy of investigation
  • In addition to re-clustering and optimized sink mobility, balanced dynamic routing can be investigated with the aim of a generalized framework to maximize the network lifetime.

Author Contributions

Conceptualization, M.K.S. and S.M.R.I.; Data curation, M.K.S., S.M.R.I., and M.H. (Mahmud Hossain); Formal analysis, M.K.S., S.M.R.I., M.H. (Mahmud Hossain), M.A.-A.-W. and M.H. (Mehdi Hussain); Funding acquisition, A.A.; Investigation, M.K.S., S.M.R.I., and M.H. (Mahmud Hossain); Supervision, A.A.; Writing—original draft, M.K.S. and S.M.R.I.; Writing—review and editing, M.K.S., S.M.R.I., and M.H. (Mahmud Hossain). All authors have read and agreed to the published version of the manuscript.

Funding

This research was funded by King Saud University in 2020.

Acknowledgments

The authors are grateful to the Deanship of Scientific Research at King Saud University for funding this work through Vice Deanship of Scientific Research Chairs: Chair of Pervasive and Mobile Computing.

Conflicts of Interest

The authors declare no conflict of interest for publishing in this journal.

References

  1. Gharaei, N.; Bakar, K.A.; Hashim, S.Z.; Pourasl, A.H. Inter-and intra-cluster movement of mobile sink algorithms for cluster-based networks to enhance the network lifetime. Ad Hoc Netw. 2019, 85, 60–70. [Google Scholar] [CrossRef]
  2. Yu, Z.; Guan, Y. A dynamic en-route filtering scheme for data reporting in wireless sensor networks. IIEEE/ACM Trans. Netw. 2009, 18, 150–163. [Google Scholar]
  3. Yang, H.; Lu, S. Commutative cipher based en-route filtering in wireless sensor networks. In Proceedings of the IEEE 60th Vehicular Technology Conference, Los Angeles, CA, USA, 26–29 September 2004; Volume 2, pp. 1223–1227. [Google Scholar]
  4. Ye, F.; Luo, H.; Lu, S.; Zhang, L. Statistical en-route filtering of injected false data in sensor networks. IEEE J. Sel. Areas Commun. 2005, 23, 839–850. [Google Scholar]
  5. Zhu, S.; Setia, S.; Jajodia, S.; Ning, P. Interleaved hop-by-hop authentication against false data injection attacks in sensor networks. ACM Trans. Sens. Netw. 2007, 23, 839–850. [Google Scholar] [CrossRef]
  6. Lu, R.; Lin, X.; Zhu, H.; Liang, X.; Shen, X. BECAN: A bandwidth-efficient cooperative authentication scheme for filtering injected false data in wireless sensor networks. IEEE Trans. Parallel Distrib. Syst. 2012, 23, 32–43. [Google Scholar]
  7. Karp, B.; Kung, H.-T. GPSR: Greedy perimeter stateless routing for wireless networks. In Proceedings of the 6th Annual International Conference on Mobile Computing and Networking—MobiCom’06, Boston, MA, USA, 6–10 August 2000; pp. 243–254. [Google Scholar]
  8. Pantazis, N.A.; Nikolidakis, S.A.; Vergados, D.D. Energy-Efficient Routing Protocols in Wireless Sensor Networks: A Surveys. IEEE Commun. Surv. Tutor. 2013, 15, 551–591. [Google Scholar] [CrossRef]
  9. Wang, J.; Yin, Y.; Kim, J.U.; Lee, S.; Lai, C.F. A mobile-sink based energy-efficient clustering algorithm for wireless sensor networks. In Proceedings of the 2012 IEEE 12th International Conference on Computer and Information Technology, Chengdu, China, 27–29 October 2012; pp. 678–683. [Google Scholar]
  10. Shahzad, M.K.; Nguyen, D.T.; Zalyubovskiy, V.; Choo, H. LNDIR: A lightweight non-increasing delivery-latency interval-based routing for duty-cycled sensor networks. Int. J. Distrib. Sens. Netw. 2018, 14, 1550147718767605. [Google Scholar] [CrossRef] [Green Version]
  11. Banerjee, J.; Mitra, S.K.; Naskar, M.K. Comparative study of radio models for data gathering in wireless sensor network. Int. J. Comput. Appl. 2011, 27, 49–57. [Google Scholar] [CrossRef]
  12. Heinzelman, W.R.; Chandrakasan, A.; Balakrishnan, H. Energy-efficient communication protocol for wireless microsensor networks. In Proceedings of the 33rd Annual Hawaii International Conference on System Sciences, Maui, HI, USA, 7 January 2000; pp. 1–10. [Google Scholar]
  13. Lyshevski, S.E. Nano-In addition, Micro-Electromechanical Systems: Fundamentals of Nano-In Addition, Microengineering; CRC Press: Boca Raton, FL, USA, 2018. [Google Scholar]
  14. Azzabi, T.; Farhat, H.; Sahli, N. A survey on wireless sensor networks security issues and military specificitie. In Proceedings of the 2017 International Conference on Advanced Systems and Electric Technologies (IC_ASET), Hammamet, Tunisia, 14–17 January 2017; Volume 1, pp. 66–72. [Google Scholar]
  15. Kumar, A.; Pais, A.R. En-route filtering techniques in wireless sensor networks: A survey. Wirel. Pers. Commun. 2017, 96, 697–739. [Google Scholar] [CrossRef]
  16. Harb, H.; Makhoul, A.; Jaoude, C.A. En-route data filtering technique for maximizing wireless sensor network lifetime. In Proceedings of the 2018 14th International Wireless Communications & Mobile Computing Conference (IWCMC), Limassol, Cyprus, 25–29 June 2018; pp. 298–303. [Google Scholar]
  17. Luo, Z.; Zhu, L.; Chang, Y.; Luo, Q.; Li, G.; Liao, W. False Data Filtering In Wireless Sensor Networks. Int. J. Smart Sens. Intell. Syst. 2016, 9, 1795–1821. [Google Scholar] [CrossRef] [Green Version]
  18. Nguyen, N.; Liu, B.; Pham, V.; Luo, Y. On Maximizing the Lifetime for Data Aggregation in Wireless Sensor Networks using Virtual Data Aggregation Trees. Comput. Netw. 2016, 105, 99–110. [Google Scholar] [CrossRef]
  19. Shahzad, M.K.; Islam, S.M.; Kwak, K.S.; Nkenyereye, L. AEF: Adaptive En-Route Filtering to Extend Network Lifetime in Wireless Sensor Networks. Sensors 2019, 19, 4036. [Google Scholar] [CrossRef] [PubMed] [Green Version]
  20. Castaño, F.; André, R.; Marc, S.; Nubia, V. An exact approach to extend network lifetime in a general class of wireless sensor networks. Inf. Sci. 2018, 433, 274–291. [Google Scholar] [CrossRef]
  21. Ding, Z.; Song, X.; Feng, Y.; Shen, L. Impact of Optimal Hop Distance on the Network Lifetime for Wireless Sensor Networks With QoS Requirements. IEEE Commun. Lett. 2019, 23, 534–537. [Google Scholar] [CrossRef]
  22. Shahzad, M.K.; Cho, T.H. A Network Density-adaptive Improved CCEF Scheme for Enhanced Network Lifetime, Energy Efficiency, and Filtering in WSNs. Adhoc Sens. Wirel. Netw. 2017, 1, 35. [Google Scholar]
  23. Shahzad, M.K.; Nkenyereye, L.; Islam, S.M. A Fuzzy System based Approach to Extend Network Lifetime for En-Route Filtering Schemes in WSNs. In Proceedings of the 2019 11th International Conference on Computer and Automation Engineering, Perth, Australia, 23 February 2019; ACM: New York, NY, USA, 2019; pp. 118–121. [Google Scholar]
  24. Kim, H.-Y. An energy-efficient load balancing scheme to extend lifetime in wireless sensor networks. Clust. Comput. 2016, 19, 279–283. [Google Scholar] [CrossRef]
  25. Jiang, D.; Xu, Z.; Lv, Z. A multicast delivery approach with minimum energy consumption for wireless multi-hop networks. Telecommun. Syst. 2016, 62, 771–782. [Google Scholar] [CrossRef]
  26. Cheng, L.; Niu, J.; Luo, C.; Shu, L.; Kong, L.; Zhao, Z.; Gu, Y. Towards minimum-delay and energy-efficient flooding in low-duty-cycle wireless sensor networks. Comput. Netw. 2016, 134, 66–77. [Google Scholar] [CrossRef]
  27. Wazid, M.; Das, A.K.; Bhat, V.; Vasilakos, A.V. LAM-CIoT: Lightweight authentication mechanism in cloud-based IoT environment. J. Netw. Comput. Appl. 2020, 150, 102496. [Google Scholar] [CrossRef]
  28. Iqbal, A.; Shahzad, K.; Khayam, S.A. SRVF: An energy-efficient link layer protocol for reliable transmission over wireless sensor networks. In Proceedings of the 2008 IEEE International Conference on Communications, Beijing, China, 19–23 May 2008; pp. 146–150. [Google Scholar]
  29. Shamshirband, S.; Joloudari, J.H.; GhasemiGol, M.; Saadatfar, H.; Mosavi, A.; Nabipour, N. FCS-MBFLEACH: Designing an energy-aware fault detection system for mobile wireless sensor networks. Mathematics 2020, 8, 28. [Google Scholar] [CrossRef] [Green Version]
  30. Rodríguez, A.; Del-Valle-Soto, C.; Velázquez, R. Energy-Efficient Clustering Routing Protocol for Wireless Sensor Networks Based on Yellow Saddle Goatfish Algorithm. Mathematics 2020, 8, 1515. [Google Scholar] [CrossRef]
  31. Guanathillake, A.; Samarasinghe, K. Energy Efficient Clustering Algorithm with Global & Local Re-clustering for Wireless Sensor Networks. Int. J. Electr. Comput. Energetic Electron. Commun. Eng. 2013, 7, 2013. [Google Scholar]
  32. Karthikeyan, T.; Audithan, S. An enhanced adaptive re-clustering protocol in wireless sensor network. In Proceedings of the 2nd International Conference on Current Trends in Engineering and Technology (ICCTET), Coimbatore, India, 8 July 2014; pp. 418–422. [Google Scholar]
  33. Jin, Y.; Wei, D.; Vural, S.; Gluhak, A.; Moessner, K. A Distributed Energy efficient Re-Clustering Solution for Wireless Sensor Networks. In Proceedings of the 2011 IEEE Global Telecommunications Conference (GLOBECOM 2011), Houston, TX, USA, 5–9 December 2011; pp. 1–6. [Google Scholar]
  34. Shahzad, M.K.; Lee, J.K.; Cho, T.H. ERCA: Energy efficient Routing and re-Clustering Algorithm for CCEF to extend Network lifetime in WSNs. Adv. Comput. Intell. Int. J. 2016, 3, 11–24. [Google Scholar]
  35. Aslam, S.; Alam, F.; Hasan, S.F.; Rashid, M. A Novel Weighted Clustering Algorithm Supported by a Distributed Architecture for D2D Enabled Content-Centric Networks. Sensor 2020, 20, 5509. [Google Scholar] [CrossRef] [PubMed]
  36. Mohammed Almansor, M.A.; Zhang, C.; Khan, W.; Hussain, A.; Alhusaini, N. Cross Lingual Sentiment Analysis: A Clustering-Based Bee Colony Instance Selection and Target-Based Feature Weighting Approach. Sensors 2020, 20, 5276. [Google Scholar] [CrossRef]
  37. Crossbow. Mica2 datasheet. xbow. Available online: http://www.xbow.com/ (accessed on 18 April 2018).
  38. Shahzad, K.; Ali, A.; Gohar, N.D. ETSP: An energy-efficient time synchronization protocol for wireless sensor networks. In Proceedings of the 22nd International Conference on Advanced Information Networking and Applications—Workshops (Aina Workshops 2008), Okinawa, Japan, 25–28 March 2008; pp. 971–976. [Google Scholar]
  39. Win, M.Z.; Andrea, C.; Santiago, M.; Yuan, S.; Gifford, W.M.; Dardari, D.; Chiani, M. Network localization and navigation via cooperation. IEEE Commun. Mag. 2011, 49, 56–62. [Google Scholar] [CrossRef]
  40. Yi, J.H.; Xing, L.N.; Wang, G.G.; Dong, J.; Vasilakos, A.V.; Alavi, A.H.; Wang, L. Behavior of crossover operators in NSGA-III for large-scale optimization problems. Inf. Sci. 2020, 509, 470–487. [Google Scholar] [CrossRef]
  41. Du, R.; Santi, P.; Xiao, M.; Vasilakos, A.V.; Fischione, C. The sensable city: A survey on the deployment and management for smart city monitoring. IEEE Commun. Surv. Tutor. 2018, 21, 1533–1560. [Google Scholar] [CrossRef]
  42. Roy, A.; Manna, A.; Maity, S. A novel memetic genetic algorithm for solving traveling salesman problem based on multi-parent crossover technique. Decis. Mak. Appl. Manag. Eng. 2019, 2, 100–111. [Google Scholar] [CrossRef]
  43. Biswas, P.; Pal, B.B. A fuzzy goal programming method to solve congestion management problem using genetic algorithm. Decis. Mak. Appl. Manag. Eng. 2019, 2, 36–53. [Google Scholar] [CrossRef]
Figure 1. An illustration of the hot-spot problem.
Mathematics 09 00043 g001
Figure 2. Query-response model for en-route filtering schemes.
Mathematics 09 00043 g002
Figure 3. Shortest path routing.
Mathematics 09 00043 g003
Figure 4. Fuzzy members, fuzzy sets, and rules for re-clustering.
Mathematics 09 00043 g004
Figure 5. Standard & optimized fuzzy inputs membership functions.
Mathematics 09 00043 g005
Figure 6. GA-based membership function optimizer for re-clustering.
Mathematics 09 00043 g006
Figure 7. Sensor field.
Mathematics 09 00043 g007
Figure 8. First order radio model.
Mathematics 09 00043 g008
Figure 9. Network Performance analysis: (a) lifetime and (b) energy-efficiency.
Mathematics 09 00043 g009
Figure 10. Network lifetime (FTR 50, 70, and 90% at first node depleted (FND)).
Mathematics 09 00043 g010
Figure 11. Network lifetime (PND).
Mathematics 09 00043 g011
Figure 12. Energy-efficiency.
Mathematics 09 00043 g012
Figure 13. Detection capacity.
Mathematics 09 00043 g013
Table 1. Simulation parameters setup for optimization.
ParametersValues
Sensors nodes800
Sensor field size ( 500 × 500 ) m × m
BS location ( 250 , 0 ) m
R i 50 m
Cluster h/w50 m
E e l e c for Tx and Rx50 nJ/bit
E a m p 100 pJ/bit/m 2
Node energy1 Joules
MAC verification20 mJ
Data packet32 bytes
Round800 bits
F T R 60%
Path loss constant ( λ )2
Table 2. Experimental parameters for Performance Evaluations.
ParametersValues
Sensors nodes1000, 700, 400
Sensor field size ( 500 × 500 ) m × m
BS location ( 250 , 0 ) m
R i 50 m ± ε , where ε = 10 %
Cluster h/w50 m
E e l e c for Tx and Rx50 nJ/bit
E a m p 100 pJ/bit/m 2
Node energy 1 J o u l e s ± ε , where ε = 5 %
MAC verification20 mJ
Data packet200 bits
Round800 bits
F T R 50%, 70%, 90%
Path loss constant ( λ )2
Table 3. Calculations involved in simulation modeling.
Subjects to Be CalculatedMathematical Expressions
Fitness evaluation for path selectionEquation (1)
Finding re-clustering parametersEquations (2) to (6)
Fitness evaluation for re-clusteringEquation (7)
Modeling false injection attackEquations (10) and (11)
Table 4. Network Lifetime—FND and PND.
FNDPND
FTRCCEF-RCDEFGAFORCCEF-RCDEFGAFOR
50%1.022.923.641.82.182.29
70%0.982.813.381.882.182.31
90%1.002.713.101.792.212.34
Avg.1.002.813.371.822.192.31
Table 5. Energy efficiency.
FTRCCEF-RCDEFGAFOR
50%1.428.123.83
70%−1.475.84−1.2
90%04.39−6.5
Avg.−0.026.12−1.3
Publisher’s Note: MDPI stays neutral with regard to jurisdictional claims in published maps and institutional affiliations.

