
Energy-Efficient Production Planning Using a Two-Stage Fuzzy Approach

1
Department of Industrial Engineering and Management, College of Science and Engineering, Chaoyang University of Science and Technology, Taichung 413310, Taiwan
2
Department of Information Technology, Lingtung University, Taichung 408213, Taiwan
3
Department of Industrial Engineering and Management, National Yang Ming Chiao Tung University, Hsinchu 30010, Taiwan
*
Author to whom correspondence should be addressed.
Mathematics 2021, 9(10), 1101; https://0-doi-org.brum.beds.ac.uk/10.3390/math9101101
Submission received: 25 March 2021
/
Revised: 12 April 2021
/
Accepted: 6 May 2021
/
Published: 13 May 2021
(This article belongs to the Special Issue Applications of Fuzzy Optimization and Fuzzy Decision Making)
Abstract
:Analyzing energy consumption is an important task for a factory. In order to accomplish this task, most studies fit the relationship between energy consumption and product design features, process characteristics, or equipment types. However, the energy-saving effects of product yield learning are rarely considered. To bridge this gap, this study proposes a two-stage fuzzy approach to estimate the energy savings brought about by yield improvement. In the two-stage fuzzy approach, a fuzzy polynomial programming approach is first utilized to fit the yield-learning process of a product. Then, the relationship between monthly electricity consumption and increase in yield was fit to estimate the energy savings brought about by the improvement in yield. The actual case of a dynamic random-access memory factory was used to illustrate the applicability of the two-stage fuzzy approach. According to the experiment results, product yield learning can greatly reduce electricity consumption.
1. Introduction
Factories all over the world are striving to reduce energy consumption in order to pursue green and sustainable manufacturing [1,2,3,4,5]. For this reason, evaluating the effects of various treatments on reducing energy consumption is a crucial task [6,7,8,9], which is the basis of the necessity for this research.
In the literature, many studies focused on determining the relationship between energy consumption and product design features, process characteristics, or equipment types [10,11,12]. However, improvement in product yield reduces the amount of rework and additional inputs, thereby saving energy [13,14]. However, this issue was rarely investigated, and this is a research gap that needs to be filled.
This study estimates the reduction in energy consumption on the basis of the reduction in monthly electricity consumption (MEC) brought about by the yield-learning process of a product. The novelty of this research lies in the following: in past studies, other performance measures were used for the same purpose, including production efficiency index (PEI; annual electricity consumption normalized by annual production area) and electrical utilization index (EUI; annual electricity consumption normalized by production units) [15,16,17]. Most existing indicators are annually measured. However, because the yield of a product is usually tracked on a monthly basis [18], MEC was more suitable for our purposes and replaced the existing annual indicators.
The research question was as follows: taking into account the inherent uncertainty in the yield-learning process of a product, how would one model the effect of improving yield on reducing MEC? To answer this question, a two-stage fuzzy approach is proposed in this study.
In the two-stage fuzzy approach, a fuzzy polynomial-programming (FPP) method is proposed to fit the yield-learning process of a product, so as to predict the future yield in consideration of the inherent uncertainty. In theory, there are other ways to deal with yield uncertainty, such as probabilistic methods or fuzzy rules. However, the planning horizon spans dozens of months, and it is difficult to estimate the probability distribution functions of variables over such a long time. In addition, fuzzy rules are suitable for modelling the effects of multiple factors on yield. When there is only one factor (i.e., time), a fuzzy yield-learning process is more appropriate. Further, the FPP method can generate fuzzy yield forecasts that are very likely to contain actual values [19]. This property may eliminate the need to learn a new example, which is beneficial to the scalability of the two-stage fuzzy approach. For these reasons, the FPP method was applied instead of probabilistic methods or fuzzy rules. Subsequently, in the second stage, the relationship between MEC and yield was fit to estimate the energy savings brought about by the increase in yield. In the two-stage fuzzy approach, polynomial-programming problems were solved that could be easily realized using existing optimization software (e.g., Lingo and MATLAB).
The practical case of a dynamic random-access memory (DRAM) product in a wafer-fabrication (wafer fab) plant was used to illustrate the applicability of the two-stage fuzzy approach. Many researchers attempted to estimate the electricity consumption of DRAM fabs by fabricating DRAM products [18,20]. However, these studies were static because only annual electricity consumption was observed, while long-term electricity consumption was not estimated. In addition, none of the existing methods was able to quantify the reducing effects of yield learning on electricity consumption. Compared with existing methods, the two-stage fuzzy approach has the following advantages:
- (1)
- The original yield value is considered when evaluating forecasting performance. In contrast, existing methods usually consider the logarithmic value of yield.
- (2)
- The reduction in MEC is measured once a month, which is consistent with the progress of yield improvement. In contrast, existing methods usually measure the reduction in power consumption once a year.
The main contributions of this study include:
- (1)
- An FPP method, proposed to improve the precision and accuracy of tracking a yield-improvement process.
- (2)
- A systematic procedure, established to estimate the energy savings brought about by the increase in yield.
The rest of this article is organized as follows: Section 2 is dedicated to a literature review; Section 3 introduces the two-stage fuzzy approach, and a practical case is used to illustrate the applicability of the two-stage fuzzy approach. In addition, existing methods within the field were applied to the case for comparison. In Section 4, experiment results are presented and discussed; then, conclusions are drawn in the last section.
2. Literature Review
There are two ways to analyze the energy consumption of a factory; the top–down and the bottom–up methods [10]. In fact, the energy consumption of a product is affected by many factors, e.g., equipment type, product type, and yield [10,11,13,14].
Reducing energy consumption is an important task for a factory [1]. In order to accomplish this task, factories take the following measures [15,21,22,23,24,25,26,27,28,29,30,31,32]:
- (1)
- Designing products that require less energy or help to save energy.
- (2)
- Switching to new manufacturing technologies that feature lower energy consumption.
- (3)
- Acquiring new equipment with lower energy consumption.
- (4)
- Solving quality problems that lead to energy waste.
- (5)
- Shifting more production to locations or time periods with lower electricity rates.
- (6)
- Using relatively cheap and environmentally friendly long-term green electricity (such as wind and solar energy).
Many studies used multiple measures at the same time. Table 1 shows the comparison results of some related references.
DRAM is an electronic component that is widely used in computers, mobile phones, medical equipment, robots, etc. [33]. DRAM manufacturing can be divided into four stages: wafer fabrication, sorting, packaging, and final testing [34]. Among these four stages, wafer fabrication is the most energy-consuming stage [35,36]. Wafer fabrication involves very complex and difficult-to-control operations [37,38]. Each job in a wafer fab consists of 20–25 wafers, and goes through hundreds of steps. The processing steps can be divided into several categories, including photolithography, etching, and stripping. Some of these steps are energy-consuming heating and cooling operations. In addition, the same operation is performed on a job many times. As a result, the cycle time for all operations to complete in a job is usually as long as several months, during which a large amount of energy is consumed. Therefore, fabs aim to reduce energy consumption and pursue green manufacturing [39]. The expected benefits include lowering the unit costs of products and reducing the environment impact [30].
3. Two-Stage Fuzzy Approach
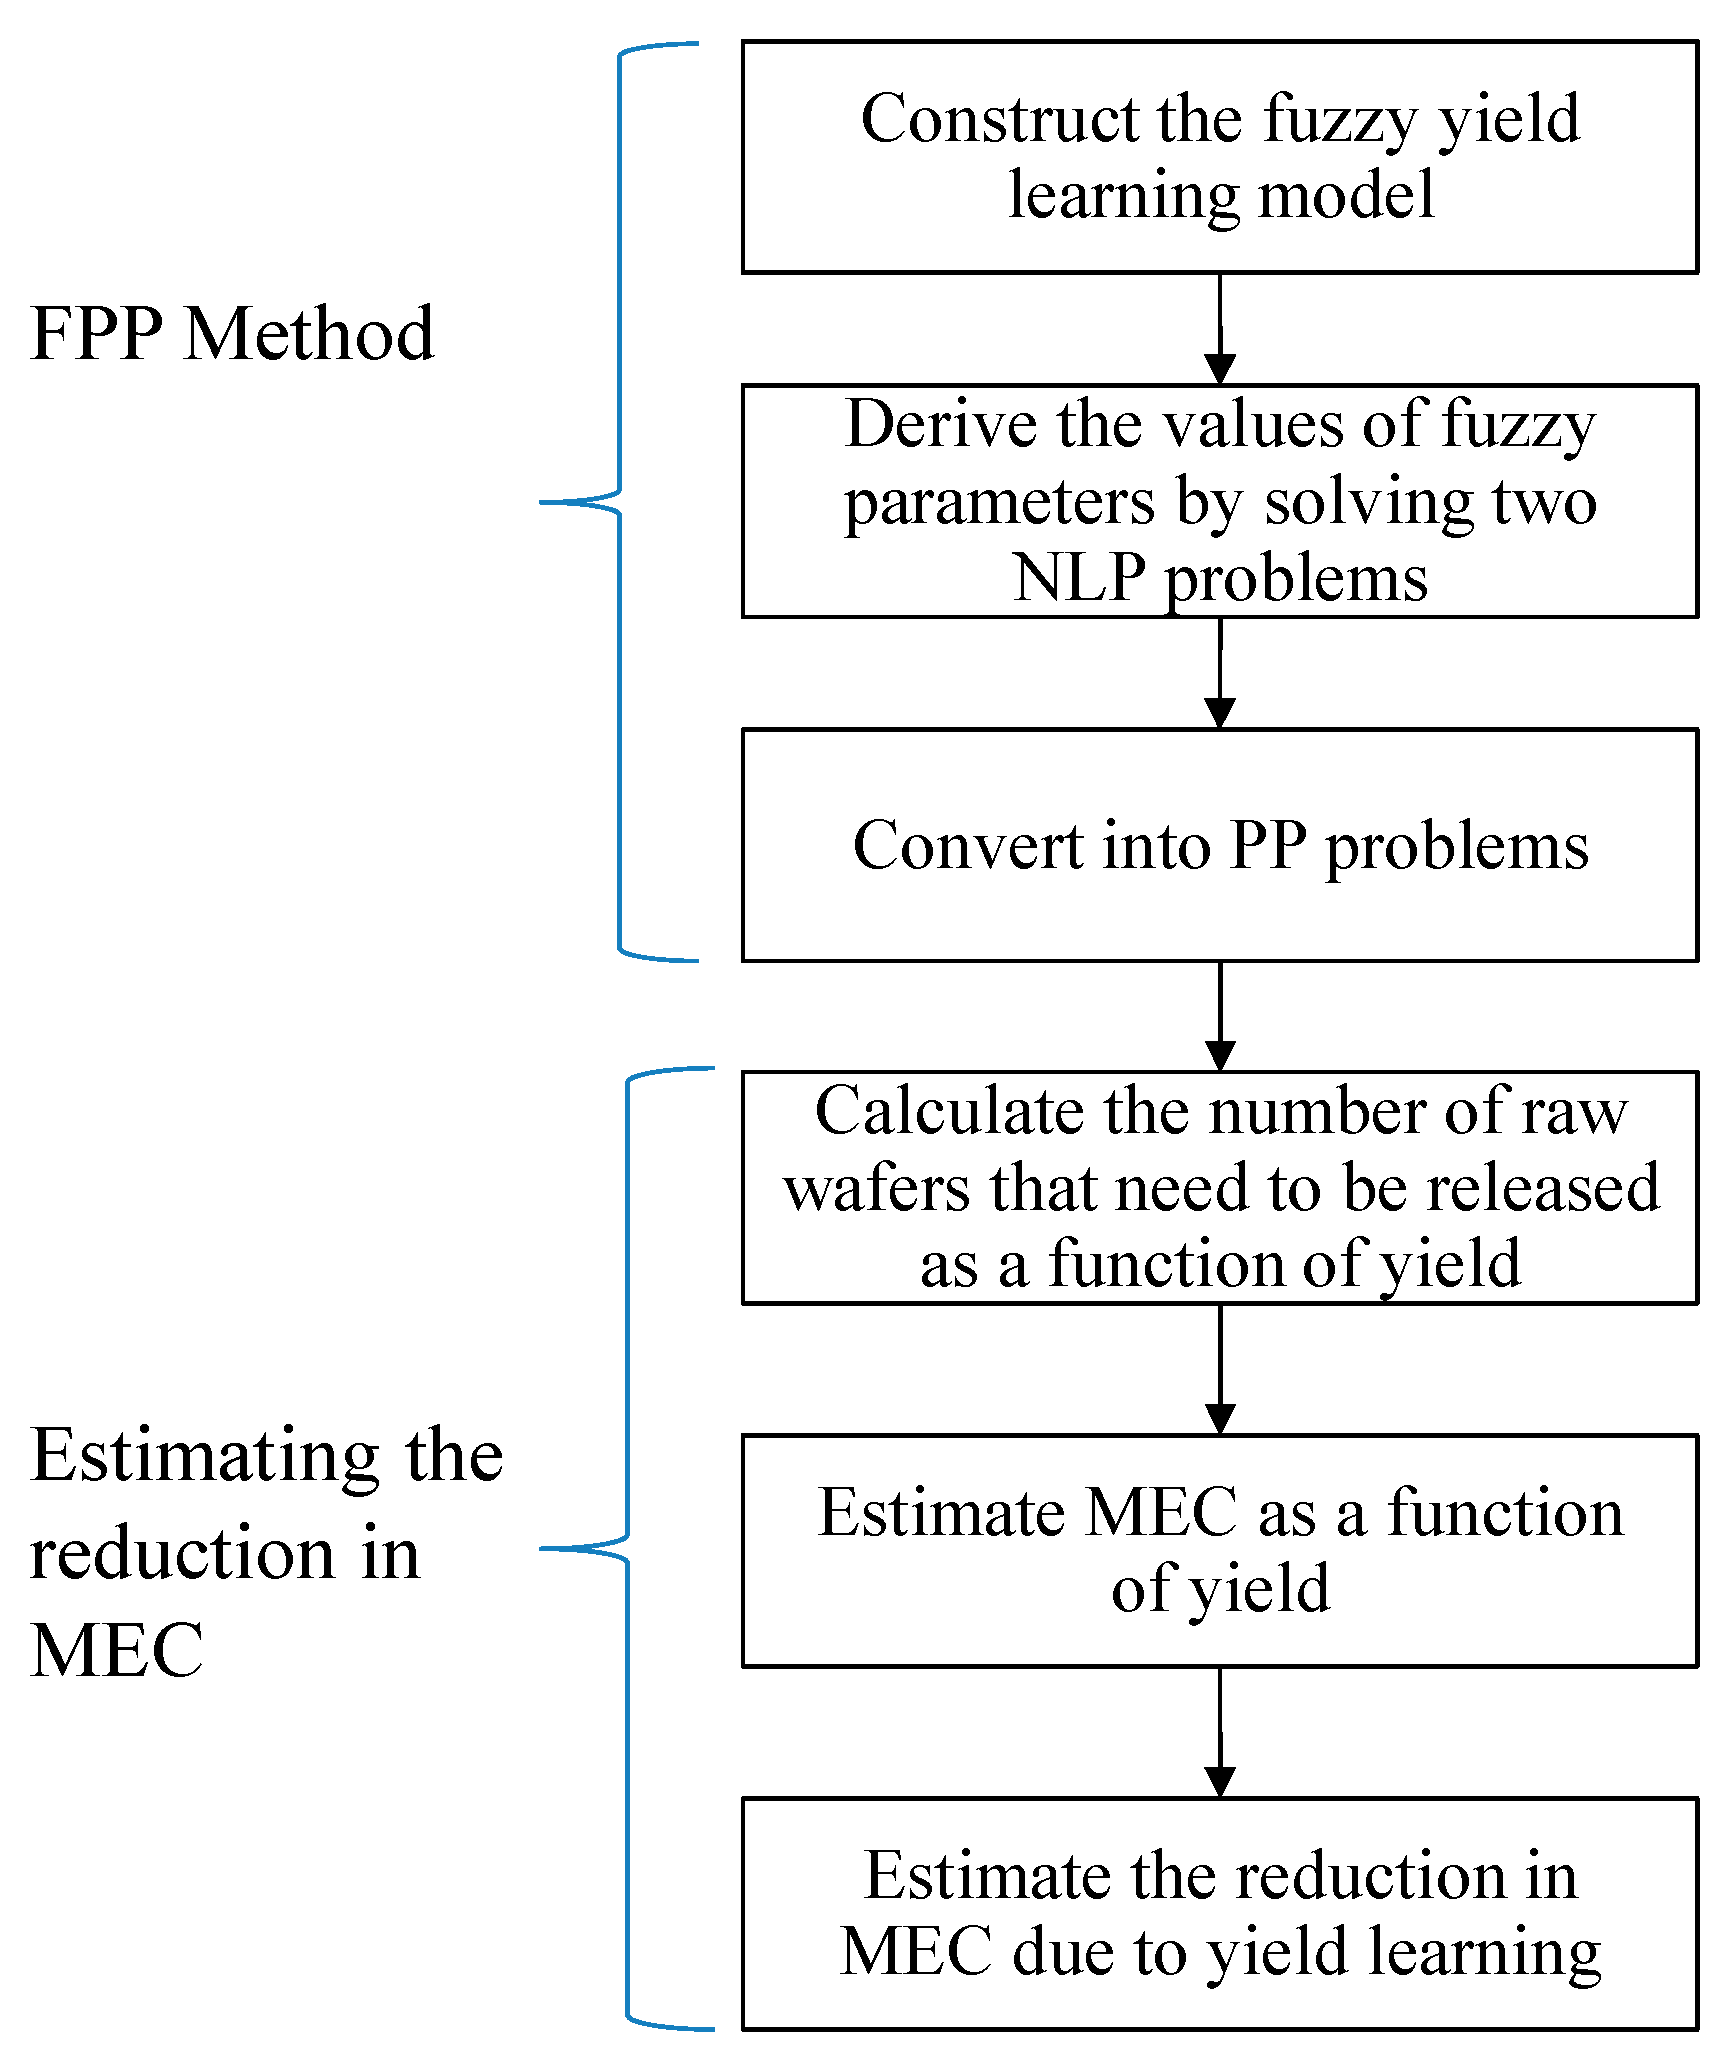
The proposed methodology comprises two stages: fitting the uncertain yield-learning process and estimating the reduction in MEC. Figure 1 presents the flowchart of the procedure of the two-stage fuzzy approach. A nomenclature is provided in Appendix A.
3.1. Uncertain Yield-Learning Process
A yield-learning process describes the increase in yield due to various learning activities [40,41]. For example,
- As time goes by, operators become increasingly skilled, which can help to avoid misoperation.
- Quality-control engineers are increasingly experienced in solving quality-related issues.
- Equipment engineers gradually learn how to optimize machine settings.
The general yield model [42] is usually used to describe a yield-learning process:
where
- is the yield at time t; ; t = 1 − T;
- is the asymptotic or final yield (a real-valued function of the point defect density per unit area, chip area, and a set of parameters unique to the specific yield model); ;
- is the learning constant; > 0;
- r(t) is a homoscedastic serially uncorrelated error term that can be ignored.
However, because learning activities are subject to human intervention [43], a yield-learning process involves a lot of uncertainty [44]. This uncertainty can be modelled by defining yield as a probability function or fuzzy set. It is necessary to estimate the parameters of a probability function, which is not easy in the long run. A fuzzy set, on the other hand, is easy to define and calculate. For these reasons, in the two-stage fuzzy approach, the yield is defined as a fuzzy set.
In the two-stage fuzzy approach, parameters in Equation (1) are given as fuzzy values. As a result, the following fuzzy yield-learning model is constructed [45]:
where
are triangular fuzzy numbers (TFNs). TFNs in this study could be symmetric or asymmetric. In addition, other types of fuzzy numbers are applicable.
According to the fuzzy arithmetic operations of TFNs [46],
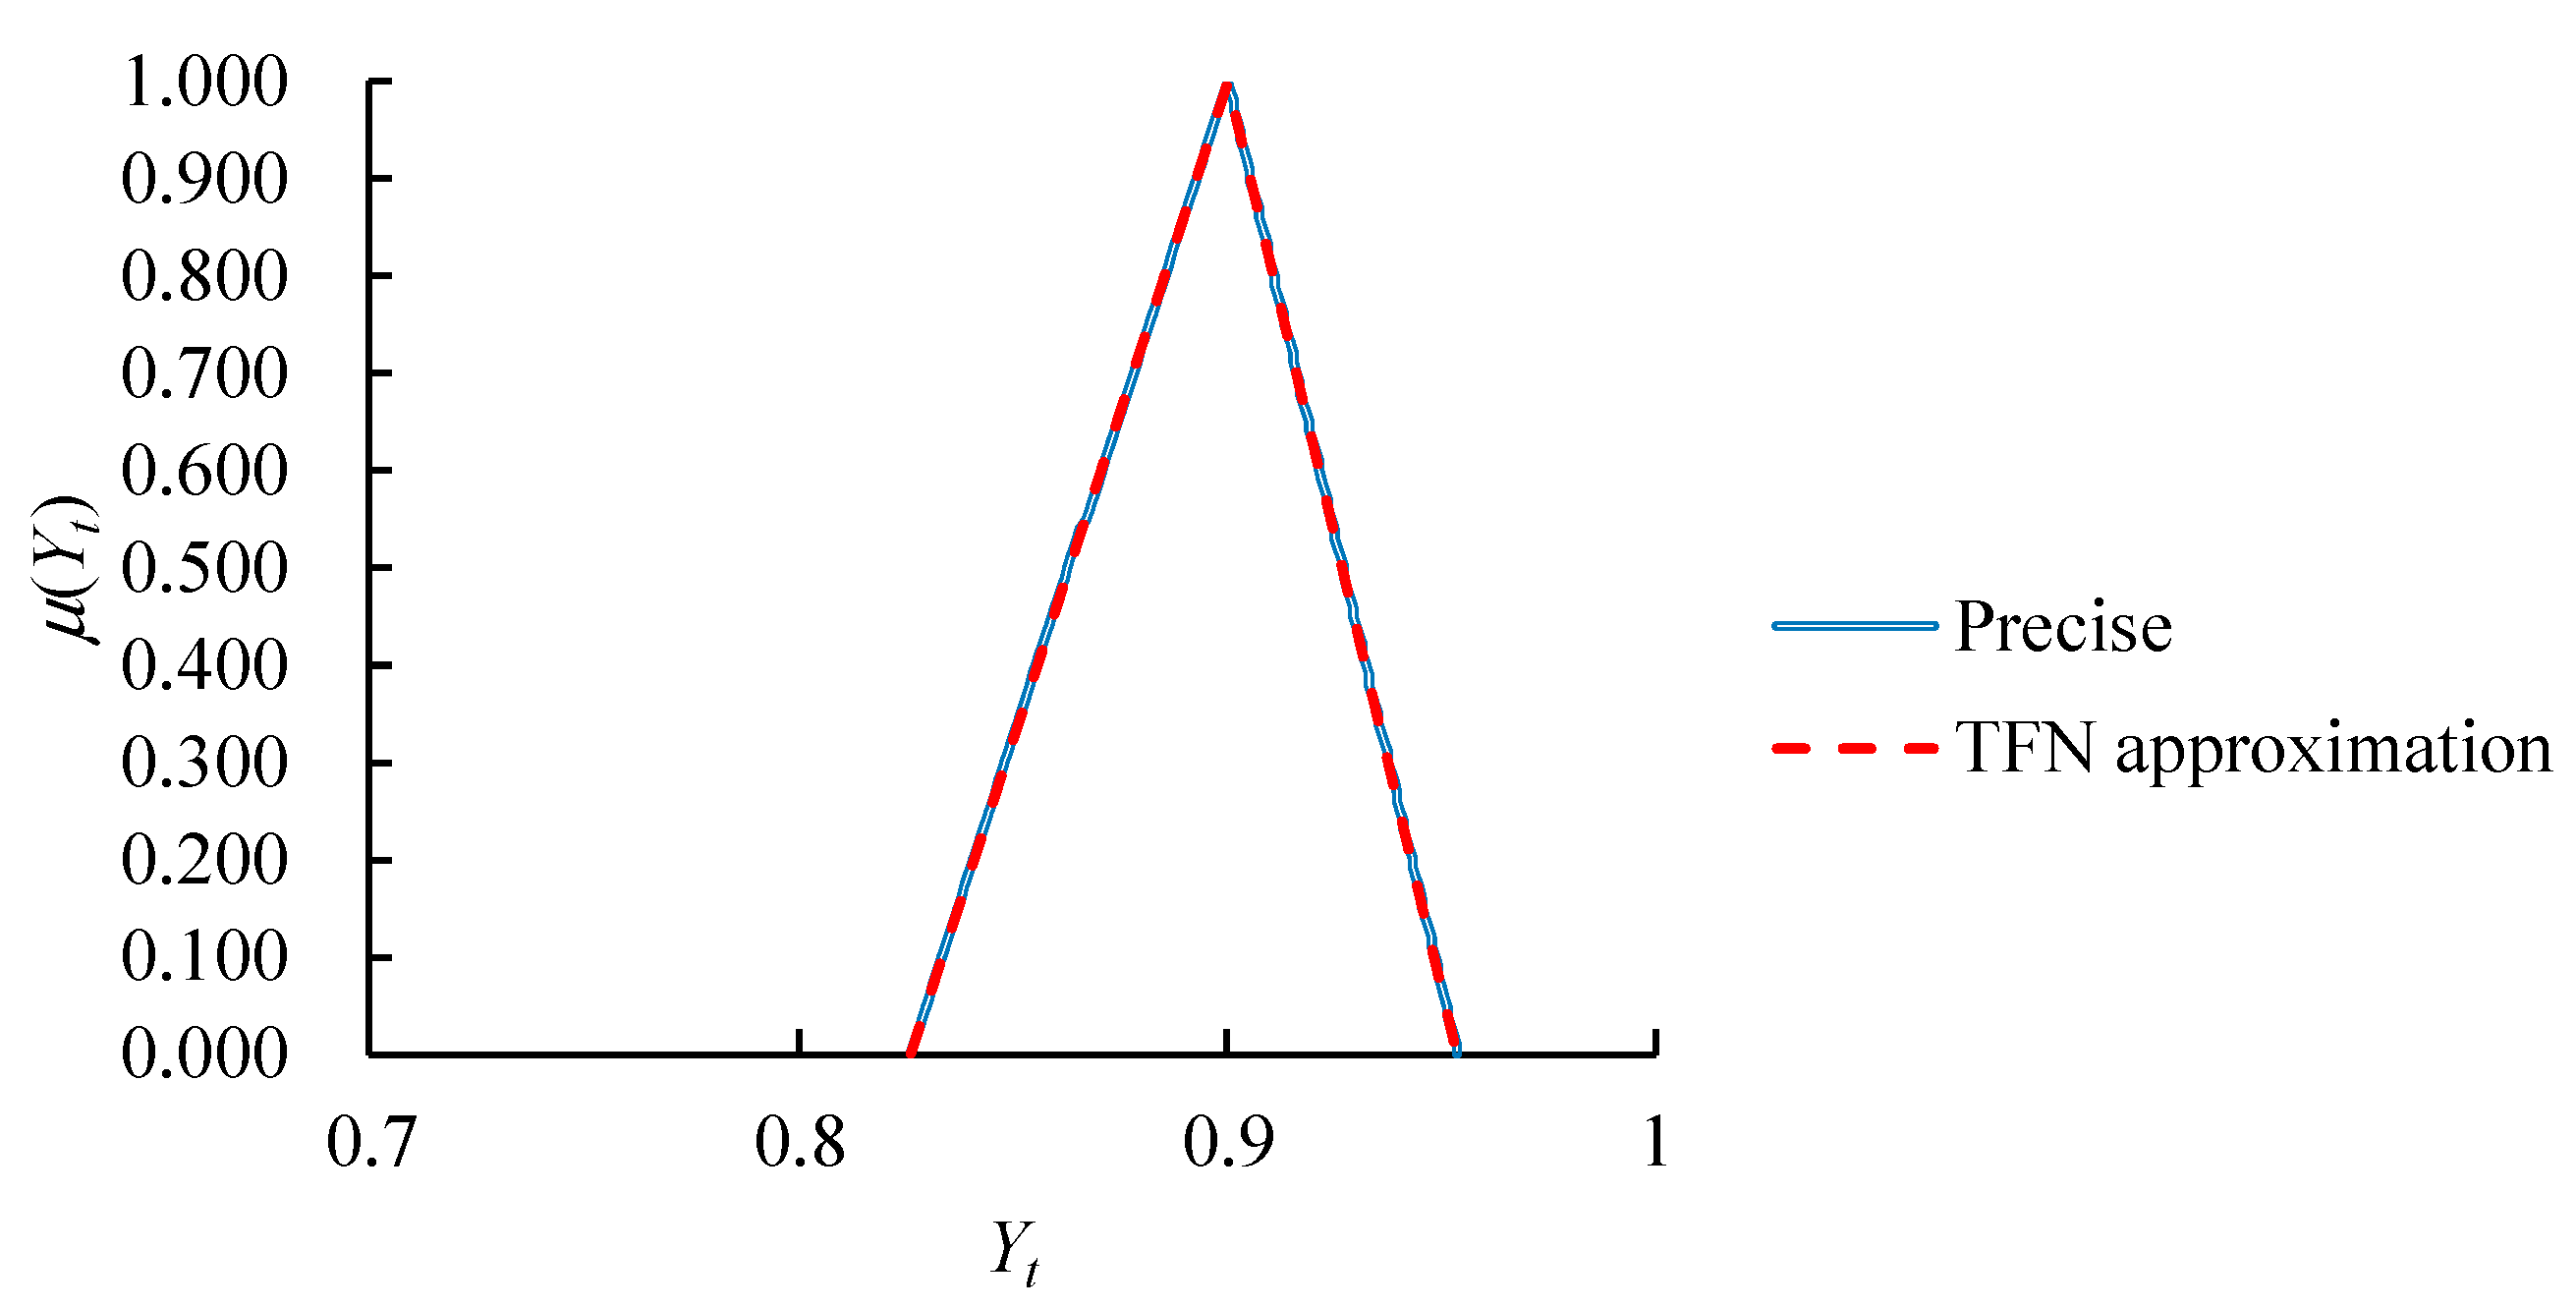
where (×) indicates fuzzy multiplication. The fuzzy multiplication of TFNs is not a TFN anymore. However, most studies approximated the fuzzy multiplication result with a TFN [47,48,49,50,51]. In Equation (5), fuzzy multiplication result is also approximated with a TFN. A possible issue is the precision of such approximation. , the final yield of a product, is a value very close to 1. is also a value less than 1, and it gradually approaches 1 through learning. The multiplication of the two fuzzy variables can be very precisely approximated with a TFN, as illustrated in Figure 2. Approximation error was less than 0.002. Therefore,
To derive the values of fuzzy parameters, the FPP method is proposed, as follows.
3.2. Deriving Values of Fuzzy Parameters
In this research, an FPP method is proposed to derive the values of fuzzy parameters in the fuzzy yield-learning model. This method involves solving two nonlinear-programming (NLP) problems:
(NLP Problem I)
subject to
The objective function is to minimize the mean absolute percentage error (MAPE) to maximize forecasting accuracy.
(NLP Problem II)
subject to
The objective function minimizes the average range to maximize forecasting precision. However, these two NLP problems include intractable absolute value functions or exponential equations, so they must be converted into more easily solvable forms [52,53].
First, the objective function of NLP Problem I is equivalent to
where
Subsequently, the exponential function can be approximated as [45]
when .
As a result, the two NLP problems are replaced by the following easy-to-solve polynomial-programming (PP) problems [54]:
(PP Problem I)
subject to
(PP Problem II)
subject to
Table 2 presents the comparison of the FPP method with existing methods for the same purpose. When the original value of yield is considered, only the two-stage fuzzy approach can minimize the forecasting error. In addition, most methods except the artificial-neural-network (ANN) [41] and two-stage fuzzy approaches require defuzzification.
3.3. Estimating MEC Reduction
Some wafers in a wafer fab are scrapped due to poor quality. Therefore, the number of wafers that could be successfully completed is usually less than the number of wafers that are input into the wafer fab. For this reason, assuming that the monthly production target of a product is Q wafers per month, the number of raw wafers that need to be released into the wafer fab is
per month.
According to the statistics of historical data, it was assumed that the electricity consumption of each wafer used to fabricate the product is about E. Then, the MEC used to fabricate the product is
where is the residue when rounding up the result to the nearest integer; . Since Q is usually in the thousands, term is negligible, which leads to
This is also a learning process, where the asymptotic value is equal to and the learning rate is equal to .
From month t to month t + 1, yield improves from to , so MEC reduces by
where (−) indicates fuzzy subtraction. is approximated with a TFN as
4. Actual Case
4.1. Background
The actual case of a DRAM product [62] was used to illustrate the two-stage fuzzy approach. Because the energy consumed by DRAMs in a large computer system accounts for a large part of the total energy consumption, DRAM has received much attention in energy-saving research [63]. The DRAM product was fabricated in an 8 inch wafer fab located in Hsinchu Scientific Park, Taiwan. There were more than 40 memory products fabricated in the wafer fab. All operators, engineers, and managers were committed to improving the efficiency of the operation and management of the wafer fab, including energy consumption. If the wafer fab was a static environment, then these efforts could reduce total energy consumption. However, the wafer fab was actually a dynamic environment because new products were continuously released into it. New products were usually related to low yields and poor operating efficiency. As a result, there was no significant trend to reduce the total energy consumption of the wafer fab, which was frustrating for the operators, engineers, and managers. It was also difficult to distinguish the energy consumption of old and new products. To solve this problem, the two-stage fuzzy approach was a viable option because it could estimate the energy savings by fabricating a single product.
In order to apply the two-stage fuzzy approach, the following tasks were completed:
- (1)
- The electricity consumption of the wafer fab in the previous year was known.
- (2)
- The number of wafers fabricated in previous years was known.
- (3)
- The latest yield data of the target product were collected.
The actual case included 15 months of yield data, as shown in Table 3. The yield fluctuated greatly, which was caused by machine failures, operator misoperations, lack of experience in solving quality-related problems, unoptimized machine settings, etc. As a result, a crisp yield-learning model could not perfectly fit the collected yield data. As an alternative, many studies [41,42,57,58,59,60] used fuzzy-valued parameters to model the learning process of yield to generate fuzzy yield forecasts with ranges. Since there was only one factor (i.e., time) that affected the yield, and all data related to energy consumption were given, the analytical results in this study can be full replicated in another study.
4.2. Fitting the Uncertain Yield-Learning Process
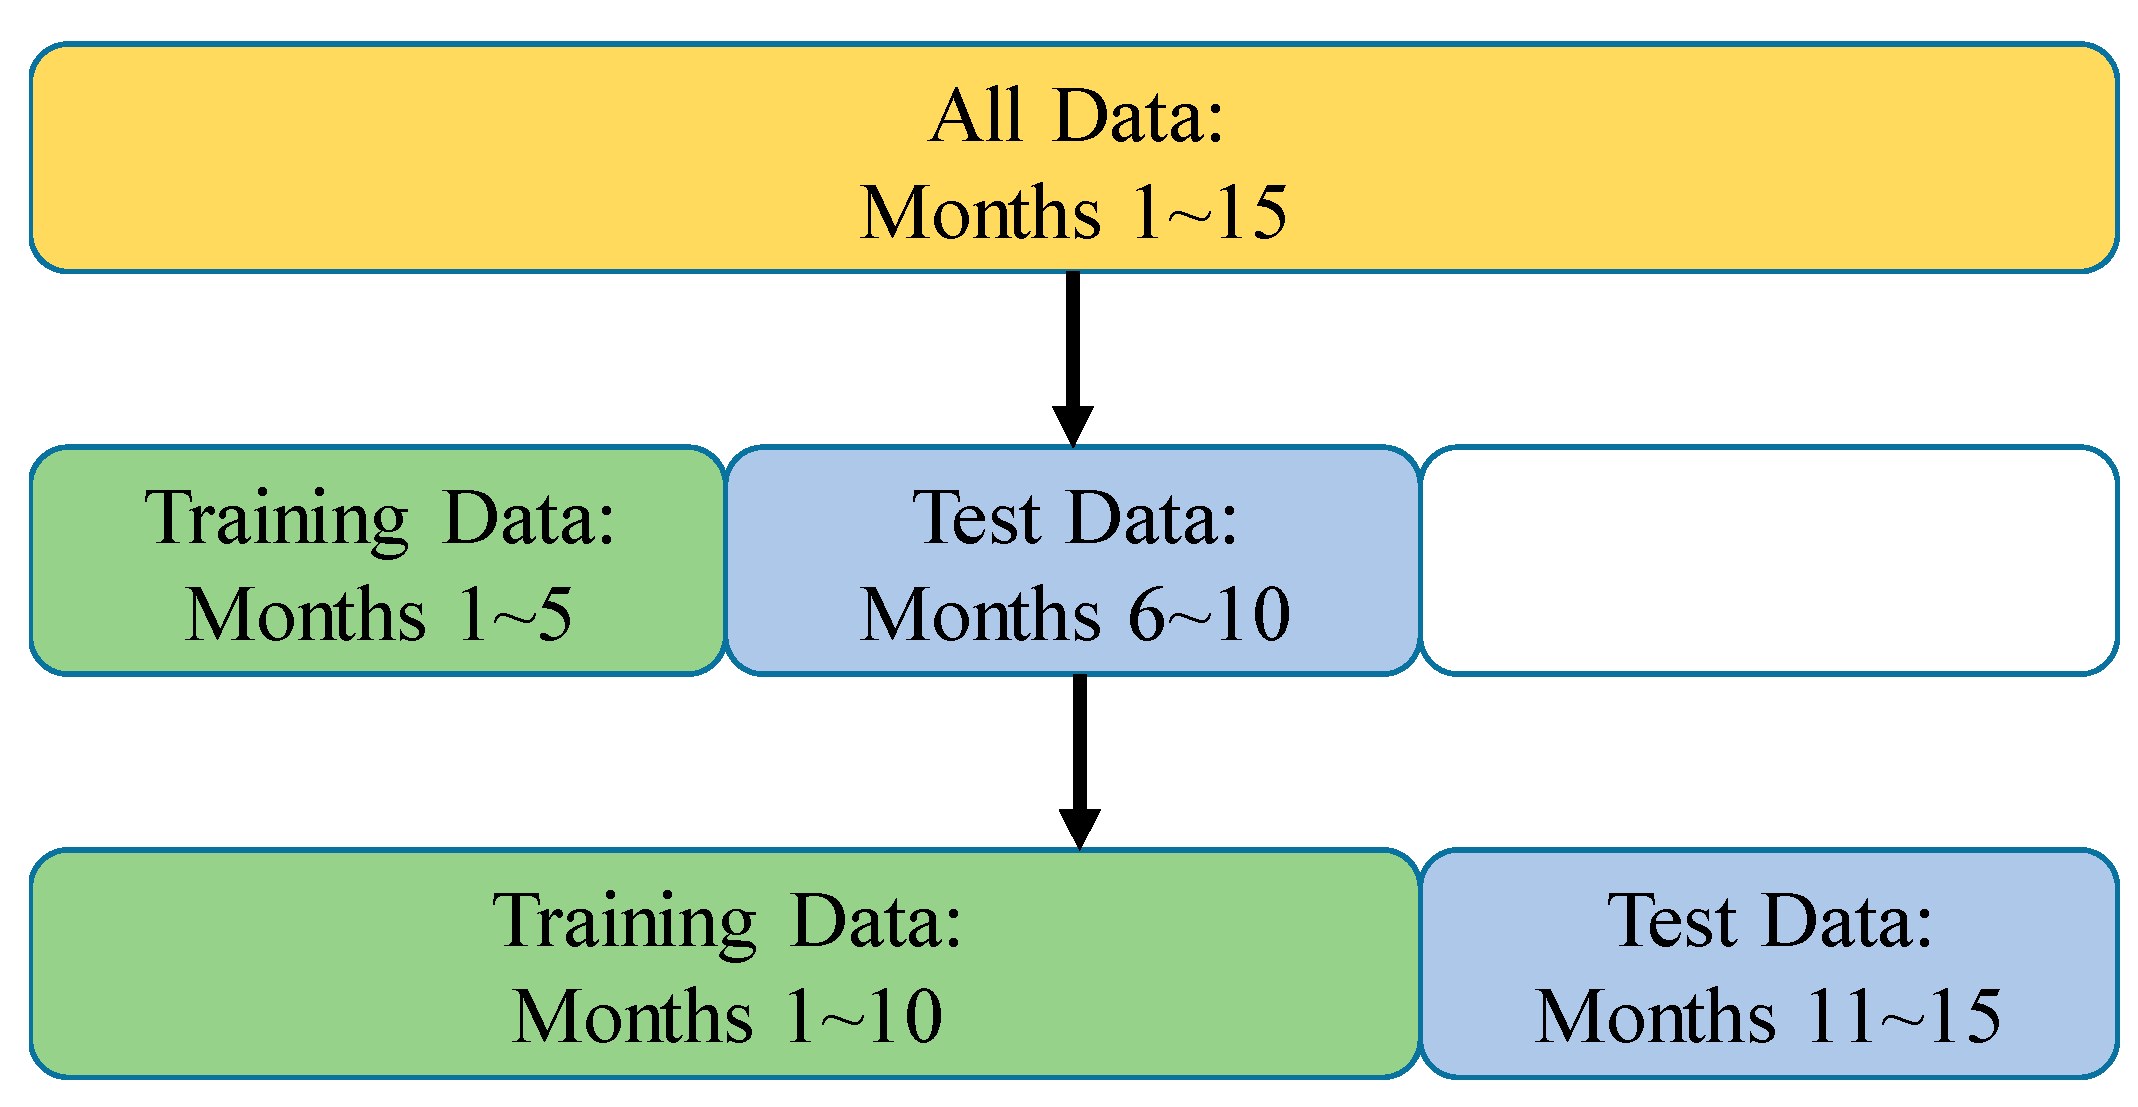
Time-split cross-validation [64] was applied to evaluate forecasting performance as shown in Figure 3.
When building the PP models using data from the first five months, the optimal solutions are as follows:
- (Model PP I) ,
- (Model PP II) , , ,
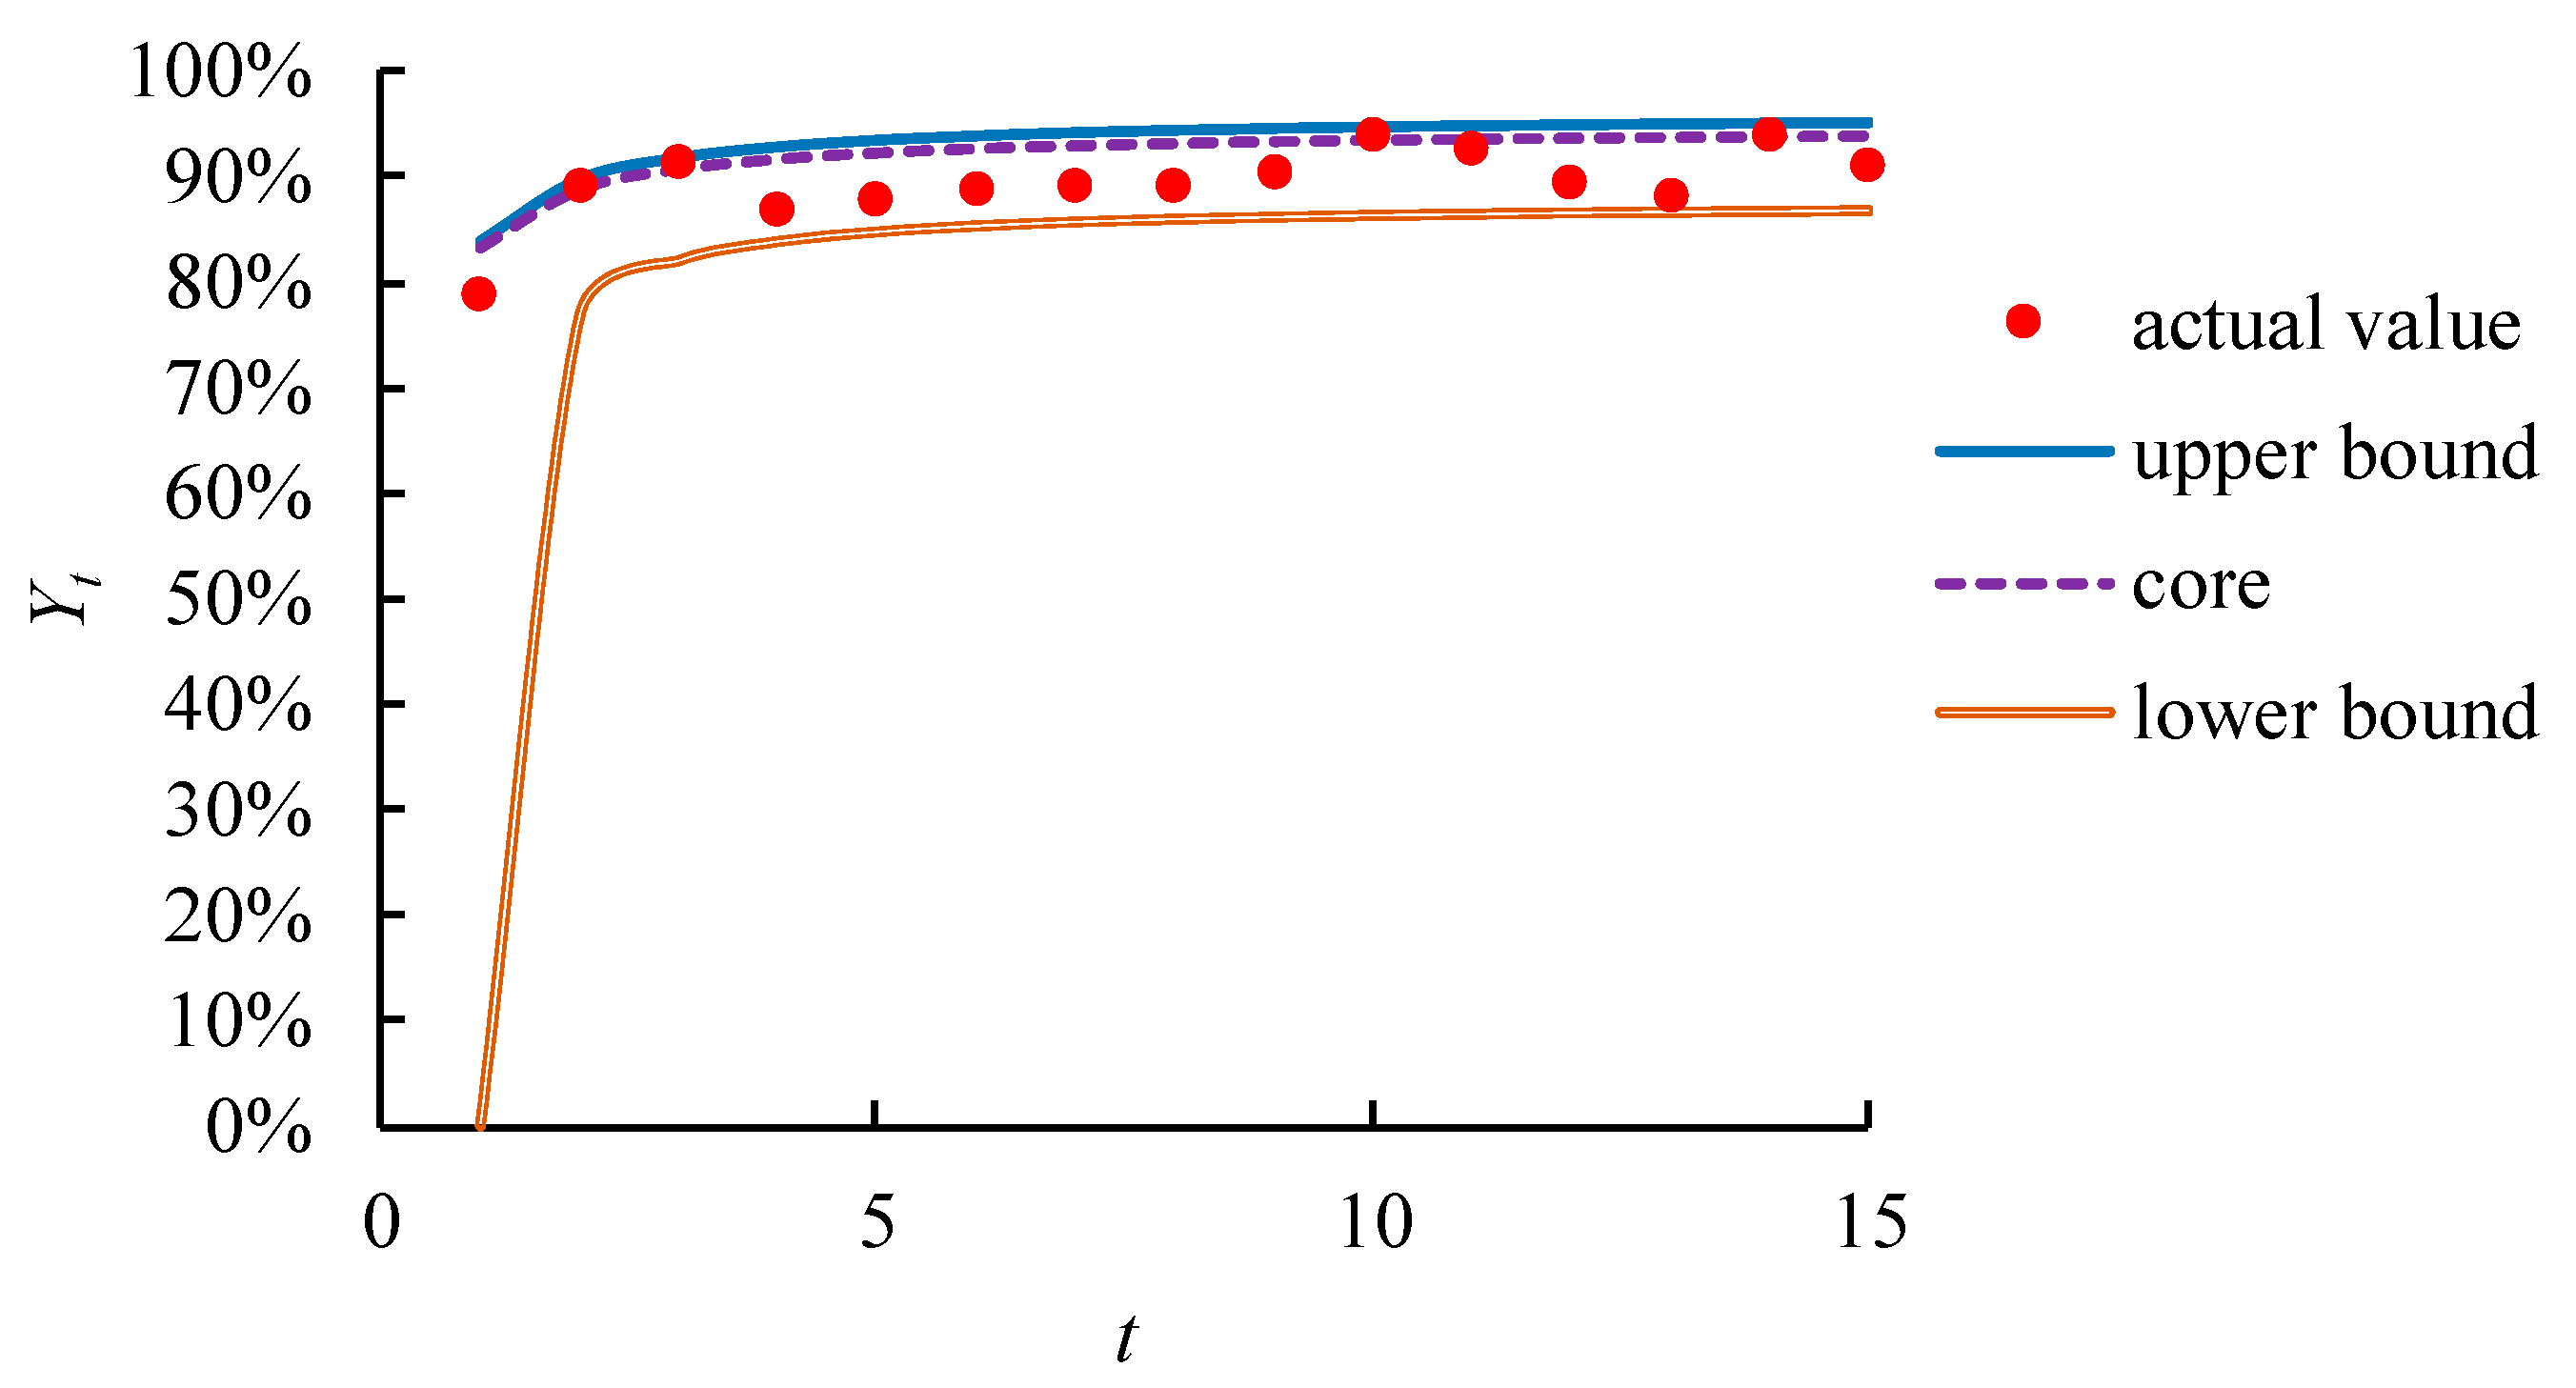
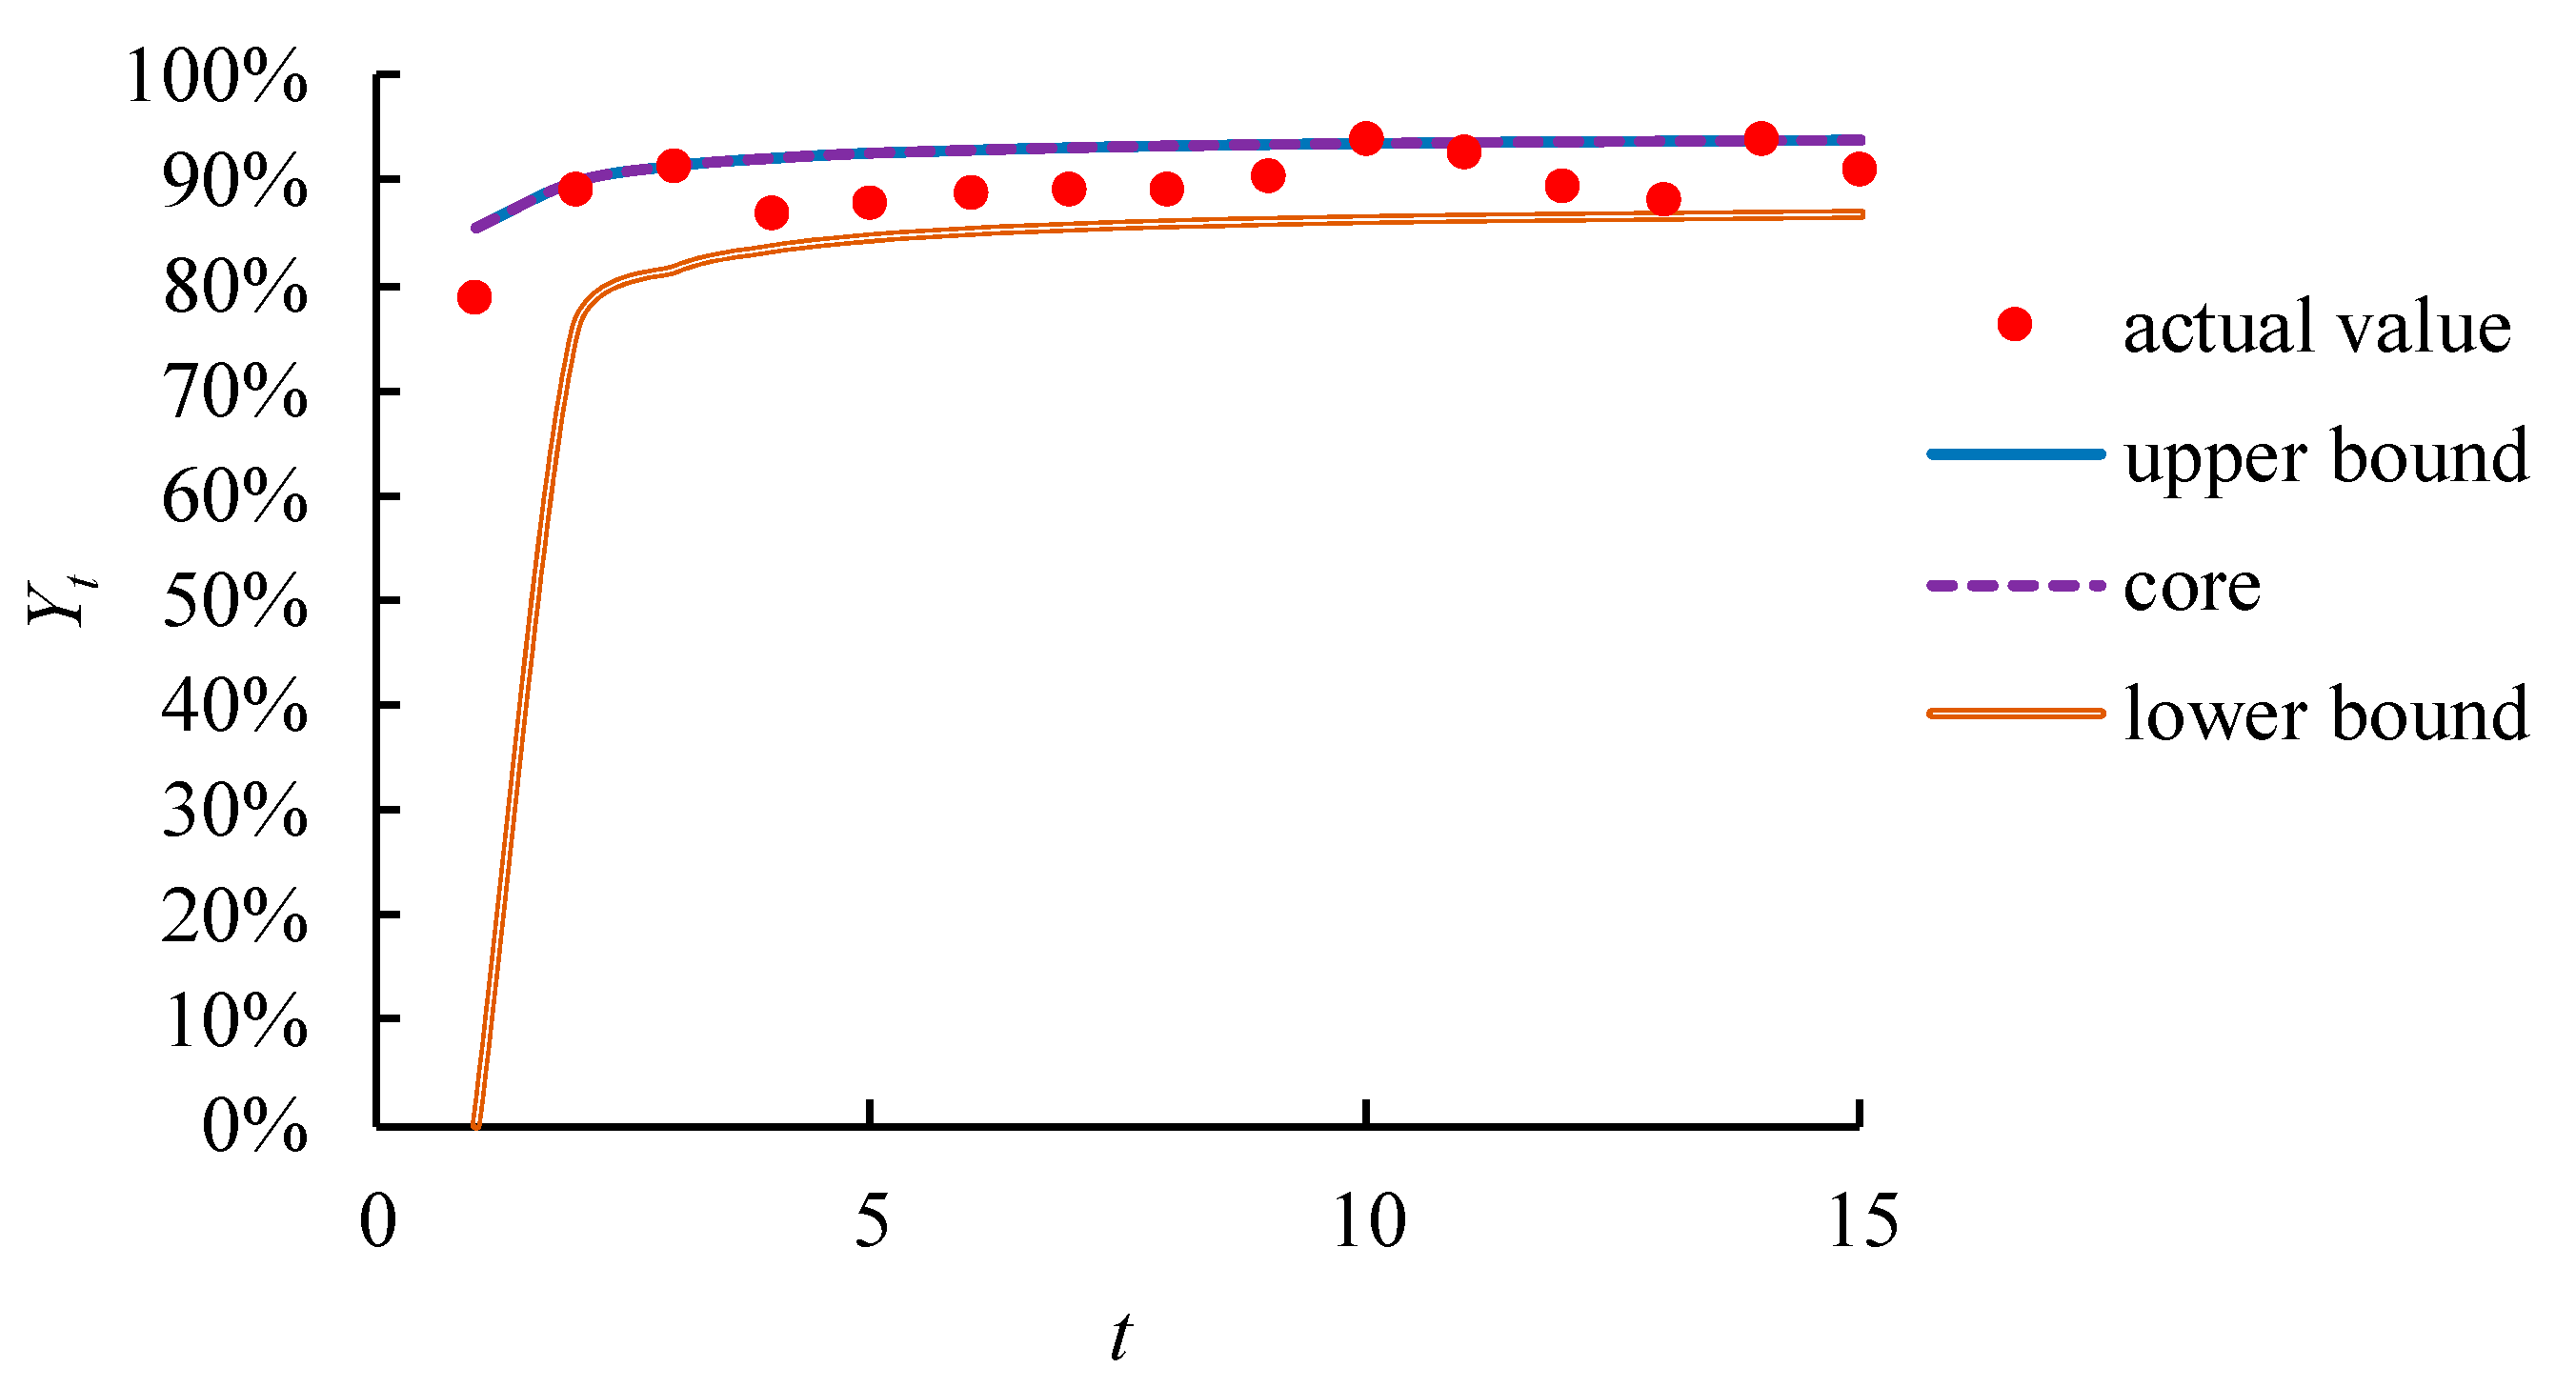
Fuzzy yield forecasts are compared with actual values in Figure 4. The fitted fuzzy yield-learning model was applied to generate fuzzy yield forecasts for Months 6–10. Then, the forecasting precision was measured in terms of the average range, while the forecasting accuracy was evaluated in terms of mean absolute error (MAE), MAPE, and root mean squared error (RMSE):
Results are summarized below:
- Average range = 0.080;
- MAE = 0.019;
- MAPE = 2.08%;
- RMSE = 0.019.
Subsequently, the data of the first 10 months were used to construct the PP models to obtain the optimal solutions as
- (Model PP I) ,
- (Model PP II) , , ,
Forecasting results are shown in Figure 5. The fitted fuzzy yield-learning model was applied to generate fuzzy yield forecasts for Months 11 to 15. Forecasting performance was evaluated as
- Average range = 0.070;
- MAE = 0.018;
- MAPE = 2.06%;
- RMSE = 0.021.
After time-split cross-validation, forecasting performance using the two-stage fuzzy approach was evaluated as
- Average range = 0.075;
- MAE = 0.019;
- MAPE = 2.07%;
- RMSE = 0.020.
4.3. Comparison
For comparison, six existing methods in this field, namely, the LP model of Guo and Tanaka [55], the QP model of Donoso et al. [56], the two NLP models of Chen and Lin [58], the QP model of Peters et al. [59], and the ANN approach proposed by Chen [61] were also applied to this case. The two NLP models of Chen and Lin [58] are represented by CL I and CL II. Table 4 summarizes the parameter settings in these methods. A fuzzy yield forecast was defuzzified using the center-of-gravity (COG) method [65,66]. Chen’s ANN approach [61] directly compares the core of a fuzzy yield forecast with actual value, so defuzzification is not required. All methods were implemented using MATLAB 2017 on a PC with i7-7700 CPU 3.6 GHz and 8 GB RAM to ensure fair comparison. In addition, the value of the same parameter in various methods was set to the same value. The initial values of solutions (or parameters) in these methods were randomized.
Forecasting performance using various methods is compared in Table 5.
Compared with existing methods, the PP models achieved better forecasting performance by minimizing MAE, MAPE, RMSE, and average range, which laid a good foundation for subsequent electricity-consumption estimation. Their complexities and execution times are compared in Table 6.
4.4. Estimating MEC Reduction
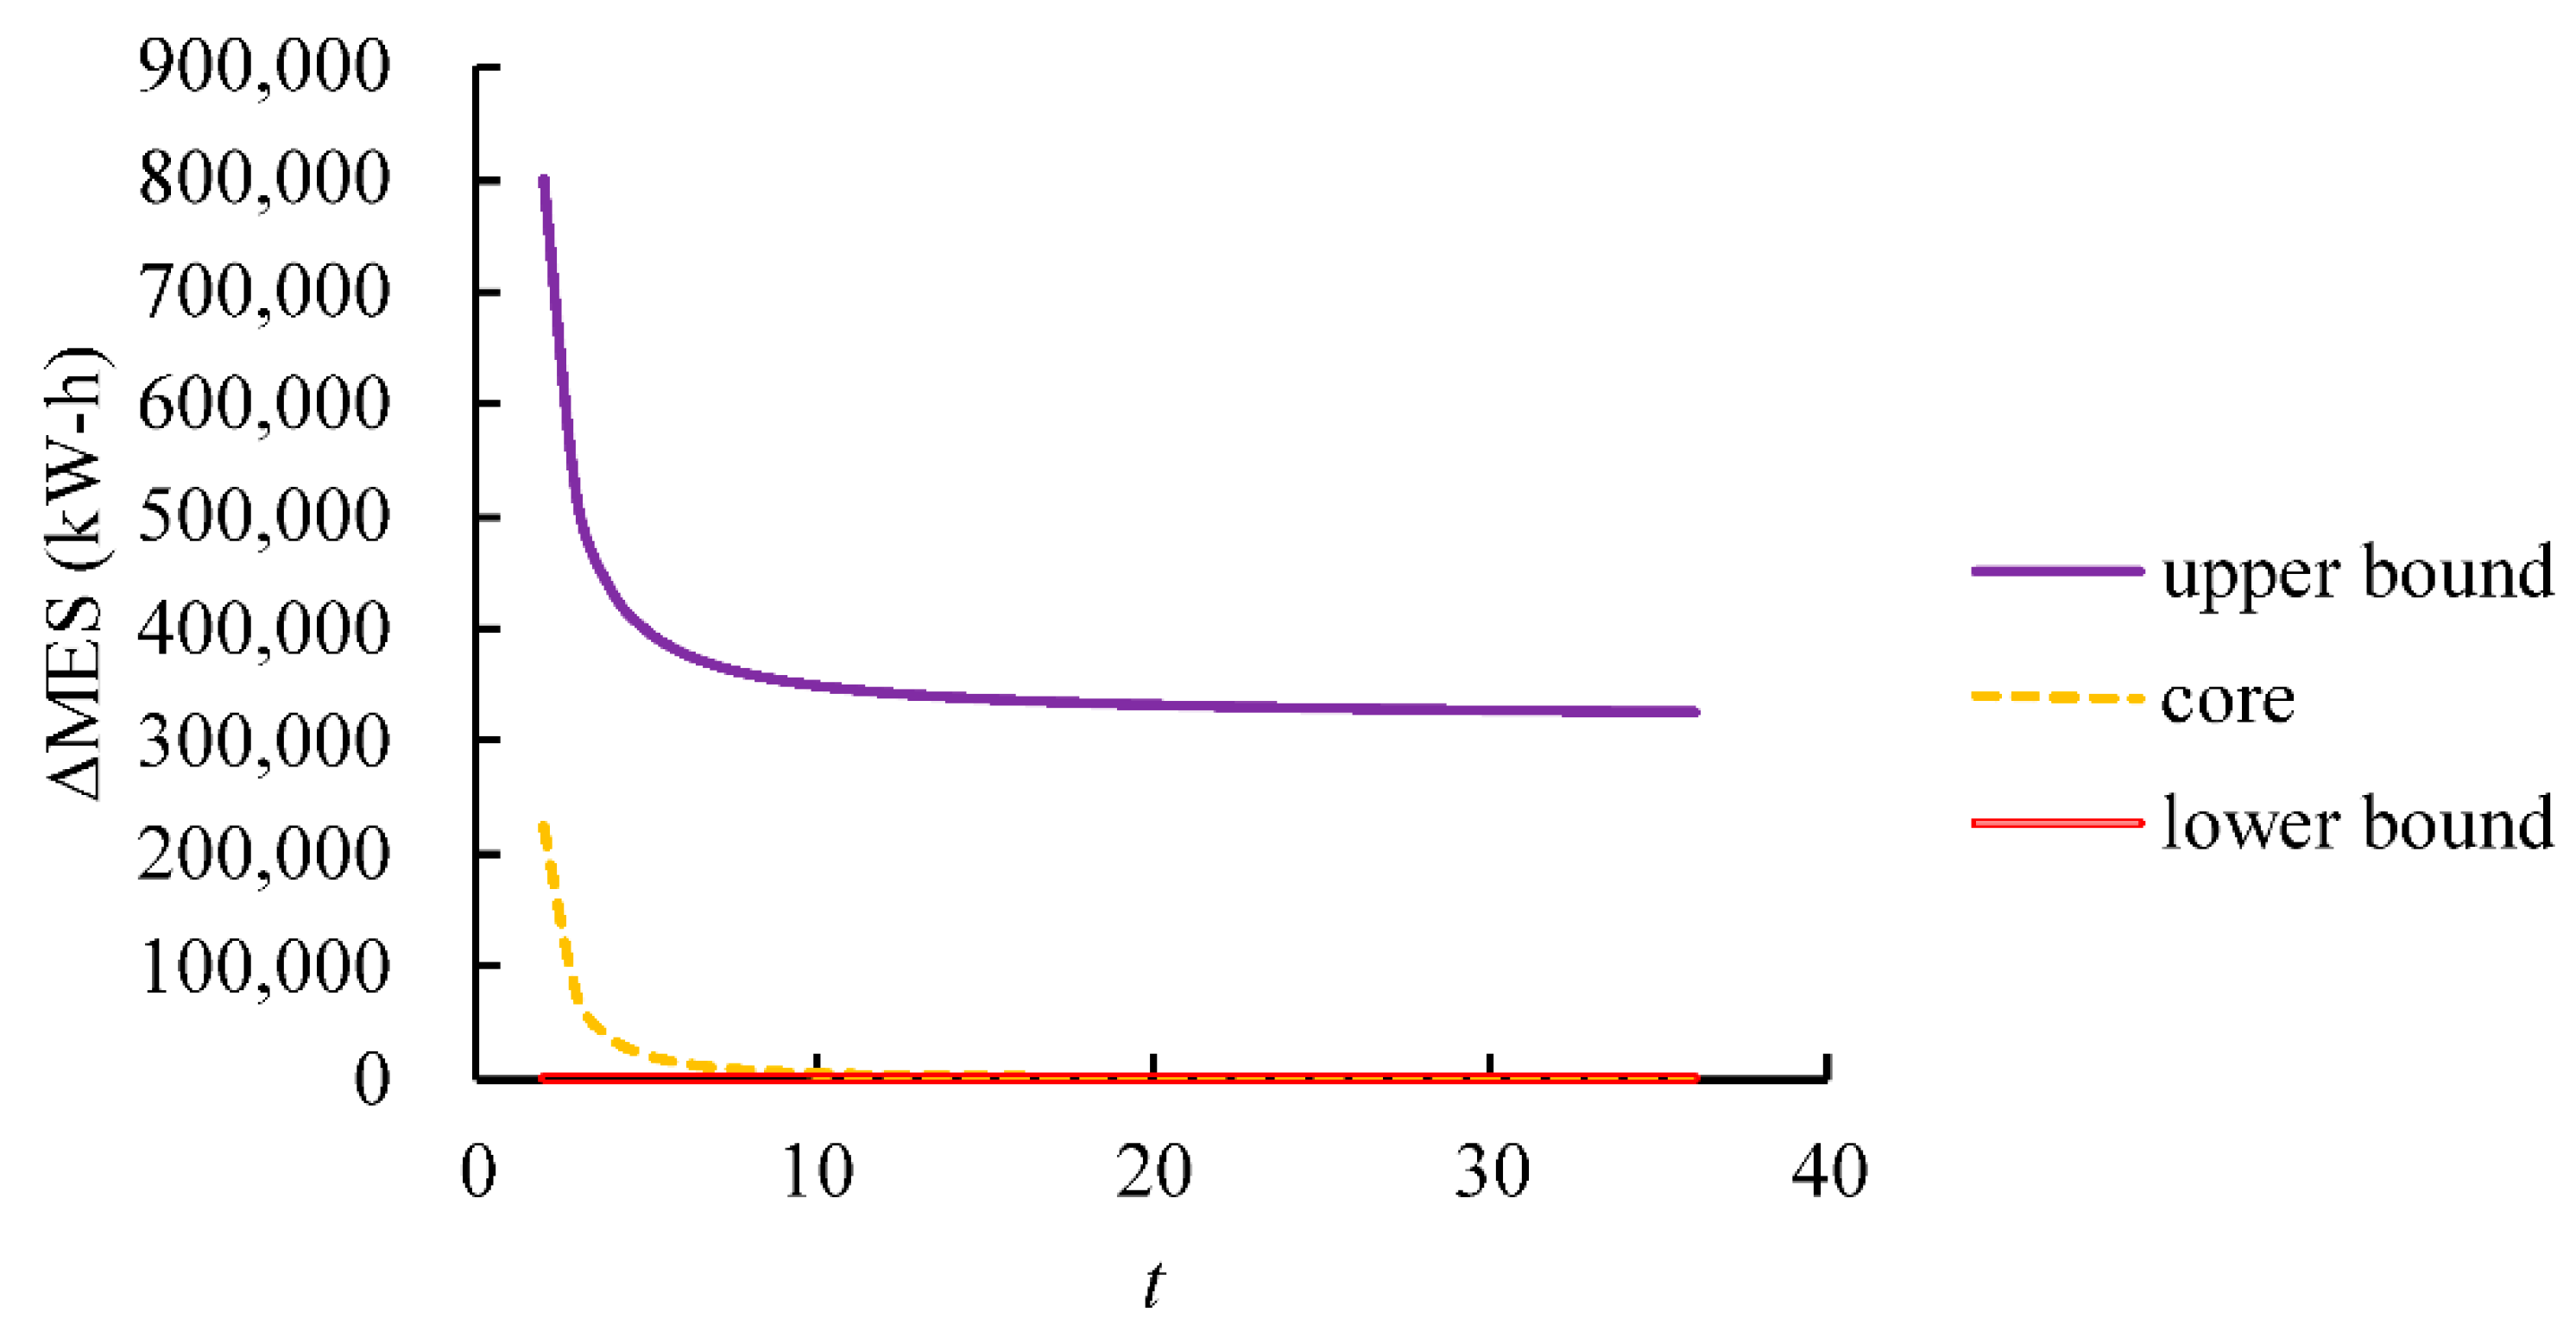
According to the historical statistics of the wafer fab, the electricity consumption to fabricate an 8 inch wafer was about 1.4 kW-h/cm2 or 453.8 kW-h per wafer. This product accounted for approximately 60% of the wafer fab’s capacity, which is equivalent to 12,000 wafers per month. On the basis of these statistics, MEC reduction due to yield learning was estimated according to Equation (40). The result is shown in Figure 6.
According to the experiment results:
- (1)
- As far as yield learning is concerned, the amount of electricity that may be saved by reducing MEC may be as high as 400,000 kW-h per month.
- (2)
- The increase in electricity consumption due to yield loss can be avoided, which means that the MEC reduction estimated in Figure 6 can be achieved.
- (3)
- (4)
- In addition, the reduction in MEC decreased with time, but converged to a certain minimal level.
- (5)
- A larger learning constant means a faster yield-learning process, which can save energy waste owing to quicker yield loss. In this case, MEC drops faster, meaning that more energy can be saved within the planning horizon.
- (6)
- Results here only apply to a single product. By taking into account all products in the wafer fab, it further saves power consumption.
5. Conclusions
There are different levels of green manufacturing. On a higher level of green manufacturing when a certain monthly output is produced, the consumed energy and generated waste should be as low as possible [69]. In low-level green manufacturing, the additional (and unnecessary) consumption of energy and additional (and unnecessary) waste should be avoided by eliminating yield loss, inefficiency, and other aspects [70]. This study estimated the energy-saving effect of the yield-learning process in a wafer fab. To this end, a two-stage fuzzy approach was proposed. In the first stage, an FPP method was proposed to fit the yield-learning process of a product to predict future yield. Subsequently, the relationship between MEC and yield was fit to estimate the energy saving brought by the increase in yield. In addition, there are other factors that affect product energy consumption, such as the type of wafer-fabrication equipment and product type. The same analysis could be performed to model their effects. This study is one of the first attempts to link improvement in product yield with the reduction in electricity consumption, and to quantify the long-term relationship by considering potential uncertainties.
Taking the actual case of a DRAM product as an example, the applicability of the two-stage fuzzy approach is illustrated. According to the experiment results:
- (1)
- The two-stage fuzzy approach was very effective in fitting the yield-learning process of the DRAM product. Compared with existing methods for the same purpose, the FPP approach achieved higher forecasting accuracy in terms of MAE, MAPE, or RMSE.
- (2)
- The two-stage fuzzy approach also established a very narrow range of yield. On the basis of precise and accurate yield forecasts, the energy saved by reducing MEC could be reliably estimated.
- (3)
- Electricity consumption was reduced by fabricating the product in the wafer fab.
However, the focus of this research was to reduce the MEC of a single semiconductor product. There are usually many products in a wafer fab. The MEC reductions of all products need to be aggregated in some way. In addition, the two-stage fuzzy approach can be applied to a situation where the number of released wafers to fabricate a specific product types fluctuates. Further, other data-preprocessing mechanisms can be used, such as input-data analysis mechanisms [71] or outlier-filtering mechanisms [72], to improve the credibility of the input data, thereby enhancing the reliability of the two-stage fuzzy approach.
Author Contributions
All authors contributed equally to the writing of this paper. Data curation, methodology, and writing—original draft, H.-C.W., H.-R.T., and T.-C.T.C.; writing—review and editing, T.-C.T.C., H.-C.W., and K.-W.H. All authors have read and agreed to the published version of the manuscript.
Funding
This research received no external funding.
Institutional Review Board Statement
Not applicable.
Informed Consent Statement
Not applicable.
Conflicts of Interest
The authors declare that there is no conflict of interest regarding the publication of this article.
Appendix A

Table A1.
Nomenclature.
| Variable/Symbol | Meaning |
|---|---|
| (×) | Fuzzy multiplication |
| Residue | |
| Dummy variable | |
| or | Learning constant |
| E | Electricity consumption per wafer |
| MAE | Mean absolute error |
| MAPE | Mean absolute percentage error |
| MEC | Monthly electricity consumption |
| Reduction in MEC | |
| Number of raw wafers that need to be released during period t | |
| Q | Monthly output |
| r(t) | Homoscedastic serially uncorrelated error term |
| RMSE | Root mean squared error |
| t | Period |
| T | Planning horizon |
| or | Asymptotic/final yield |
| or | Yield at period t |
References
- Gandhi, N.S.; Thanki, S.J.; Thakkar, J.J. Ranking of drivers for integrated lean-green manufacturing for Indian manufacturing SMEs. J. Clean. Prod. 2018, 171, 675–689. [Google Scholar] [CrossRef]
- Chen, T. Competitive and sustainable manufacturing in the age of globalization. Sustainability 2017, 9, 26. [Google Scholar] [CrossRef] [Green Version]
- Lin, C.W.; Chen, T. 3D printing technologies for enhancing the sustainability of an aircraft manufacturing or MRO company—A multi-expert partial consensus-FAHP analysis. Int. J. Adv. Manuf. Technol. 2019, 105, 4171–4180. [Google Scholar] [CrossRef]
- Yin, S.; Zhang, N.; Li, B. Enhancing the competitiveness of multi-agent cooperation for green manufacturing in China: An empirical study of the measure of green technology innovation capabilities and their influencing factors. Sustain. Prod. Consum. 2020, 23, 63–76. [Google Scholar] [CrossRef]
- Chen, T.; Wang, L.C.; Chiu, M.C. A multi-granularity approach for estimating the sustainability of a factory simulation model: Semiconductor packaging as an example. Oper. Res. 2018, 18, 711–729. [Google Scholar] [CrossRef]
- Wang, Y.C.; Chen, T. Modelling and optimization of machining conditions for the multi-pass dry turning process. Proc. Inst. Mech. Eng. Part. B J. Eng. Manuf. 2008, 222, 1387–1394. [Google Scholar] [CrossRef]
- Chen, T. Strengthening the competitiveness and sustainability of a semiconductor manufacturer with cloud manufacturing. Sustainability 2014, 6, 251–266. [Google Scholar] [CrossRef] [Green Version]
- Abualfaraa, W.; Salonitis, K.; Al-Ashaab, A.; Ala’raj, M. Lean-green manufacturing practices and their link with sustainability: A critical review. Sustainability 2020, 12, 981. [Google Scholar] [CrossRef] [Green Version]
- Chen, T.; Wang, Y.C. Long-term load forecasting by a collaborative fuzzy-neural approach. Int. J. Electr. Power Energy Syst. 2012, 43, 454–464. [Google Scholar] [CrossRef]
- Abraham, M.; Nguyen, N. Green engineering: Defining principles—results from the Sandestin conference. Environ. Prog. 2004, 22, 233–236. [Google Scholar] [CrossRef]
- Ershadi, H.; Karimipour, A. Present a multi-criteria modeling and optimization (energy, economic and environmental) approach of industrial combined cooling heating and power (CCHP) generation systems using the genetic algorithm, case study: A tile factory. Energy 2018, 149, 286–295. [Google Scholar] [CrossRef]
- Chen, T. Forecasting the long-term electricity demand in Taiwan with a hybrid FLR and BPN approach. Int. J. Fuzzy Syst. 2012, 14, 361–371. [Google Scholar]
- Sonntag, D.; Kiesmüller, G.P. Disposal versus rework–Inventory control in a production system with random yield. Eur. J. Oper. Res. 2018, 267, 138–149. [Google Scholar] [CrossRef]
- Wang, Y.C.; Chen, T.; Lin, Y.C. A collaborative and ubiquitous system for fabricating dental parts using 3D printing technologies. Healthcare 2019, 7, 103. [Google Scholar] [CrossRef] [Green Version]
- Hu, S.C.; Xu, T.; Chaung, T.; Chan, D.Y.L. Characterization of energy use in 300 mm DRAM (Dynamic Random Access Memory) wafer fabrication plants (fabs) in Taiwan. Energy 2010, 35, 3788–3792. [Google Scholar] [CrossRef]
- Ge, L.; Wang, S.; Jiang, X. A combined interval AHP-entropy method for power user evaluation in Smart Electrical Utilization Systems. In Proceedings of the 2016 IEEE Power and Energy Society General Meeting, Boston, MA, USA, 17–21 July 2016; pp. 1–5. [Google Scholar]
- Lakić, E.; Gubian, A.; Fournely, C.; Djokić, S. Introducing system utilization index for energy efficiency evaluation and labelling. In Proceedings of the 2019 16th International Conference on the European Energy Market, Ljubljana, Slovenia, 18–20 September 2019; pp. 1–6. [Google Scholar]
- Kumar, N.; Kennedy, K.; Gildersleeve, K.; Abelson, R.; Mastrangelo, C.M.; Montgomery, D.C. A review of yield modelling techniques for semiconductor manufacturing. Int. J. Prod. Res. 2006, 44, 5019–5036. [Google Scholar] [CrossRef]
- Wang, Y.C.; Chen, T. A fuzzy collaborative forecasting approach for forecasting the productivity of a factory. Adv. Mech. Eng. 2013, 5, 234571. [Google Scholar] [CrossRef] [Green Version]
- Chang, C.K.; Hu, S.C.; Liu, V.; Chan, D.Y.L.; Huang, C.Y.; Weng, L.C. Specific energy consumption of dynamic random access memory module supply chain in Taiwan. Energy 2012, 41, 508–513. [Google Scholar] [CrossRef]
- Gong, X.; Van der Wee, M.; De Pessemier, T.; Verbrugge, S.; Colle, D.; Martens, L.; Joseph, W. Integrating labor awareness to energy-efficient production scheduling under real-time electricity pricing: An empirical study. J. Clean. Prod. 2017, 168, 239–253. [Google Scholar] [CrossRef] [Green Version]
- Jo, M.S.; Shin, J.H.; Kim, W.J.; Jeong, J.W. Energy-saving benefits of adiabatic humidification in the air conditioning systems of semiconductor cleanrooms. Energies 2017, 10, 1774. [Google Scholar] [CrossRef] [Green Version]
- Golpîra, H.; Khan, S.A.R.; Zhang, Y. Robust smart energy efficient production planning for a general job-shop manufacturing system under combined demand and supply uncertainty in the presence of grid-connected microgrid. J. Clean. Prod. 2018, 202, 649–665. [Google Scholar] [CrossRef]
- Wu, H.C.; Chen, T.C.T. Quality control issues in 3D-printing manufacturing: A review. Rapid Prototyp. J. 2018, 24, 607–614. [Google Scholar] [CrossRef]
- Dai, M.; Tang, D.; Giret, A.; Salido, M.A. Multi-objective optimization for energy-efficient flexible job shop scheduling problem with transportation constraints. Robot. Comput. Integr. Manuf. 2019, 59, 143–157. [Google Scholar] [CrossRef]
- Liang, J.; Wang, Y.; Zhang, Z.H.; Sun, Y. Energy efficient production planning and scheduling problem with processing technology selection. Comput. Ind. Eng. 2019, 132, 260–270. [Google Scholar] [CrossRef]
- Gao, K.; Huang, Y.; Sadollah, A.; Wang, L. A review of energy-efficient scheduling in intelligent production systems. Complex. Intell. Syst. 2020, 6, 237–249. [Google Scholar] [CrossRef] [Green Version]
- Golpîra, H. Smart energy-aware manufacturing plant scheduling under uncertainty: A risk-based multi-objective robust optimization approach. Energy 2020, 209, 118385. [Google Scholar] [CrossRef]
- Wang, S.; Wang, X.; Chu, F.; Yu, J. An energy-efficient two-stage hybrid flow shop scheduling problem in a glass production. Int. J. Prod. Res. 2020, 58, 2283–2314. [Google Scholar] [CrossRef]
- Chang, K.H.; Sun, Y.J.; Lai, C.A.; Chen, L.D.; Wang, C.H.; Chen, C.J.; Lin, C.M. Big data analytics energy-saving strategies for air compressors in the semiconductor industry—An empirical study. Int. J. Prod. Res. 2021, 1–13. [Google Scholar] [CrossRef]
- Wang, Y.C.; Chiu, M.C.; Chen, T. A fuzzy nonlinear programming approach for planning the energy-efficient manufacturing of a wafer fab. Appl. Soft Comput. 2020, 95, 106506. [Google Scholar] [CrossRef]
- Kumar, R.; Mishra, J.S.; Mondal, S.; Meena, R.S.; Sundaram, P.K.; Bhatt, B.P.; Lal, R.; Saurabh, K.; Chandra, N.; Samal, S.K.; et al. Designing an ecofriendly and carbon-cum-energy efficient production system for the diverse agroecosystem of South Asia. Energy 2021, 214, 118860. [Google Scholar] [CrossRef]
- Mandelman, J.A.; Dennard, R.H.; Bronner, G.B.; DeBrosse, J.K.; Divakaruni, R.; Li, Y.; Radens, C.J. Challenges and future directions for the scaling of dynamic random-access memory (DRAM). IBM J. Res. Dev. 2002, 46, 187–212. [Google Scholar] [CrossRef]
- Wang, Y.C.; Chen, T.; Lin, C.W. A slack-diversifying nonlinear fluctuation smoothing rule for job dispatching in a wafer fabrication factory. Robot. Comput. Integr. Manuf. 2013, 29, 41–47. [Google Scholar] [CrossRef]
- Murphy, C.F.; Kenig, G.A.; Allen, D.T.; Laurent, J.P.; Dyer, D.E. Development of parametric material, energy, and emission inventories for wafer fabrication in the semiconductor industry. Environ. Sci. Technol. 2003, 37, 5373–5382. [Google Scholar] [CrossRef] [PubMed]
- Pan, S.Y.; Snyder, S.W.; Ma, H.W.; Lin, Y.J.; Chiang, P.C. Energy-efficient resin wafer electrodeionization for impaired water reclamation. J. Clean. Prod. 2018, 174, 1464–1474. [Google Scholar] [CrossRef]
- Zhang, H.; Jiang, Z.; Guo, C. Simulation-based optimization of dispatching rules for semiconductor wafer fabrication system scheduling by the response surface methodology. Int. J. Adv. Manuf. Technol. 2009, 41, 110–121. [Google Scholar] [CrossRef]
- Chen, T.; Rajendran, C.; Wu, C.W. Advanced dispatching rules for large-scale manufacturing systems. Int. J. Adv. Manuf. Technol. 2013, 67, 1–3. [Google Scholar] [CrossRef] [Green Version]
- Xie, M.; Ruan, J.; Bai, W.; Qiao, Q.; Bai, L.; Zhang, J.; Li, H.; Lv, F.; Fu, H. Pollutant payback time and environmental impact of Chinese multi-crystalline photovoltaic production based on life cycle assessment. J. Clean. Prod. 2018, 184, 648–659. [Google Scholar] [CrossRef]
- Maki, S.; Ashina, S.; Fujii, M.; Fujita, T.; Yabe, N.; Uchida, K.; Ginting, G.; Boer, R.; Chandran, R. Employing electricity-consumption monitoring systems and integrative time-series analysis models: A case study in Bogor, Indonesia. Front. Energy 2018, 12, 426–439. [Google Scholar] [CrossRef]
- Chen, T.C.T.; Lin, C.W. An innovative yield learning model considering multiple learning sources and learning source interactions. Comput. Ind. Eng. 2019, 131, 455–463. [Google Scholar] [CrossRef]
- Nakata, K.; Orihara, R.; Mizuoka, Y.; Takagi, K. A comprehensive big-data-based monitoring system for yield enhancement in semiconductor manufacturing. IEEE Trans. Semicond. Manuf. 2017, 30, 339–344. [Google Scholar] [CrossRef]
- Chiu, M.-C.; Chen, T.; Hsu, K.-W. Modeling an uncertain productivity learning process using an interval fuzzy methodology. Mathematics 2020, 8, 998. [Google Scholar] [CrossRef]
- Chen, T.; Chiu, M.C. An interval fuzzy number-based fuzzy collaborative forecasting approach for DRAM yield forecasting. Complex. Intell. Syst. 2021, 7, 111–122. [Google Scholar] [CrossRef]
- Wang, Y.C.; Chen, T.C.T. A direct-solution fuzzy collaborative intelligence approach for yield forecasting in semiconductor manufacturing. Procedia Manuf. 2018, 17, 110–117. [Google Scholar] [CrossRef]
- Klir, G.J.; Yuan, B. Fuzzy Sets and Fuzzy Logic: Theory and Applications; Prentice-Hall Inc.: Hoboken, NJ, USA, 2006. [Google Scholar]
- Wang, J.; Ding, D.; Liu, O.; Li, M. A synthetic method for knowledge management performance evaluation based on triangular fuzzy number and group support systems. Appl. Soft Comput. 2016, 39, 11–20. [Google Scholar] [CrossRef]
- Chakraborty, D.; Jana, D.K.; Roy, T.K. A new approach to solve fully fuzzy transportation problem using triangular fuzzy number. Int. J. Oper. Res. 2016, 26, 153–179. [Google Scholar] [CrossRef]
- Zhang, F.; Chen, B. Risk assessment for substation operation based on triangular fuzzy number AHP and cloud model. In Proceedings of the 2018 IEEE/PES Transmission and Distribution Conference and Exposition, Denver, CO, USA, 16–19 April 2018; pp. 1–5. [Google Scholar]
- Wang, H.; Lu, X.; Du, Y.; Zhang, C.; Sadiq, R.; Deng, Y. Fault tree analysis based on TOPSIS and triangular fuzzy number. Int. J. Syst. Assur. Eng. Manag. 2017, 8, 2064–2070. [Google Scholar] [CrossRef]
- Irvanizam, I.; Syahrini, I.; Afidh, R.P.F.; Andika, M.R.; Sofyan, H. Applying fuzzy multiple-attribute decision making based on set-pair analysis with triangular fuzzy number for decent homes distribution problem. In Proceedings of the 2018 6th International Conference on Cyber and IT Service Management, Parapat, Indonesia, 7–9 August 2018; pp. 1–7. [Google Scholar]
- Lin, Y.C.; Chen, T. A biobjective fuzzy integer-nonlinear programming approach for creating an intelligent location-aware service. J. Appl. Math. 2013, 2013, 423415. [Google Scholar] [CrossRef]
- Tsai, H.R.; Chen, T. A fuzzy nonlinear programming approach for optimizing the performance of a four-objective fluctuation smoothing rule in a wafer fabrication factory. J. Appl. Math. 2013, 2013, 720607. [Google Scholar] [CrossRef]
- Dua, V. Mixed integer polynomial programming. Comput. Chem. Eng. 2015, 72, 387–394. [Google Scholar] [CrossRef] [Green Version]
- Guo, P.; Tanaka, H. Dual models for possibilistic regression analysis. Comput. Stat. Data Anal. 2006, 51, 253–266. [Google Scholar] [CrossRef]
- Donoso, S.; Marin, N.; Vila, M.A. Quadratic programming models for fuzzy regression. In Proceedings of the International Conference on Mathematical and Statistical Modeling in Honor of Enrique Castillo, University of Castilla La Mancha, Ciudad Real, Spain, 28–30 June 2006; pp. 1–12. [Google Scholar]
- Chen, T. A fuzzy logic approach for incorporating the effects of managerial actions on semiconductor yield learning. Int. Conf. Mach. Learn. Cybern. 2007, 4, 1979–1984. [Google Scholar]
- Chen, T.; Lin, Y.C. A fuzzy-neural system incorporating unequally important expert opinions for semiconductor yield forecasting. Int. J. Uncertain. Fuzziness Knowl. Based Syst. 2008, 16, 35–58. [Google Scholar] [CrossRef]
- Peters, G.; Crespo, F.; Lingras, P.; Weber, R. Soft clustering–fuzzy and rough approaches and their extensions and derivatives. Int. J. Approx. Reason. 2013, 54, 307–322. [Google Scholar] [CrossRef]
- Chen, T.; Wang, Y.C. An agent-based fuzzy collaborative intelligence approach for precise and accurate semiconductor yield forecasting. IEEE Trans. Fuzzy Syst. 2013, 22, 201–211. [Google Scholar] [CrossRef]
- Chen, T. A heterogeneous fuzzy collaborative intelligence approach for forecasting product yield. Appl. Soft Comput. 2017, 57, 210–224. [Google Scholar] [CrossRef]
- Chen, T. Forecasting the yield of a semiconductor product with a collaborative intelligence approach. Appl. Soft Comput. 2013, 13, 1552–1560. [Google Scholar] [CrossRef]
- Vogelsang, T. Understanding the energy consumption of dynamic random access memories. In Proceedings of the Annual IEEE/ACM International Symposium on Microarchitecture, Atlanta, GA, USA, 4–8 December 2010; pp. 363–374. [Google Scholar]
- Sheridan, R.P. Time-split cross-validation as a method for estimating the goodness of prospective prediction. J. Chem. Inf. Model. 2013, 53, 783–790. [Google Scholar] [CrossRef]
- Van Broekhoven, E.; De Baets, B. Fast and accurate center of gravity defuzzification of fuzzy system outputs defined on trapezoidal fuzzy partitions. Fuzzy Sets Syst. 2006, 157, 904–918. [Google Scholar] [CrossRef]
- Huang, D.; Chen, T.; Wang, M.J.J. A fuzzy set approach for event tree analysis. Fuzzy Sets Syst. 2001, 118, 153–165. [Google Scholar] [CrossRef]
- Endo, M.; Nakajima, H.; Hata, Y. Simplified factory energy management system based on operational condition estimation by sensor data. In Proceedings of the IEEE International Conference on Automation Science and Engineering, Seoul, Korea, 20–24 August 2012; pp. 14–19. [Google Scholar]
- Makita, H.; Shida, Y.; Nozue, N. Factory energy management system using production information. Mitsubishi Electr. Adv. 2012, 140, 7–11. [Google Scholar]
- Haapala, K.R.; Khadke, K.N.; Sutherland, J.W. Predicting manufacturing waste and energy for sustainable product development via WE-FAB software. In Proceedings of the Global Conference on Sustainable Product Development and Life Cycle Engineering, Berlin, Germany, 29 September 2004; pp. 243–250. [Google Scholar]
- Panno, D.; Messineo, A.; Dispenza, A. Cogeneration plant in a pasta factory: Energy saving and environmental benefit. Energy 2007, 32, 746–754. [Google Scholar] [CrossRef]
- Singh, P.K. Granular-based decomposition of complex fuzzy context and its analysis. Prog. Artif. Intell. 2019, 8, 181–193. [Google Scholar] [CrossRef]
- Lazhar, F. Fuzzy clustering-based semi-supervised approach for outlier detection in big text data. Prog. Artif. Intell. 2019, 8, 123–132. [Google Scholar] [CrossRef]
Figure 1.
Procedure of two-step fuzzy approach.

Figure 2.
Approximation of fuzzy multiplication result ( = (0.85, 0.92, 0.97); = (0.10, 0.13, 0.17); t = 6).
Figure 2.
Approximation of fuzzy multiplication result ( = (0.85, 0.92, 0.97); = (0.10, 0.13, 0.17); t = 6).

Figure 3.
Time-split cross-validation.

Figure 4.
Comparing fuzzy yield forecasts to actual values.

Figure 5.
Forecasting results.

Figure 6.
MEC reduction due to yield learning.

Table 1.
Comparison of relevant references.
| Reference | Designing Green Products | Green Manufacturing Technologies | Green Equipment | Solving Quality Problems | Green Production Scheduling | Green Electricity |
|---|---|---|---|---|---|---|
| Gong et al. [21] | √ | |||||
| Jo et al. [22] | √ | |||||
| Golpîra et al. [23] | √ | |||||
| Wu and Chen [24] | √ | |||||
| Dai et al. [25] | √ | |||||
| Hu et al. [15] | √ | |||||
| Liang et al. [26] | √ | |||||
| Gao et al. [27] | √ | |||||
| Golpîra [28] | √ | √ | ||||
| Wang et al. [29] | √ | √ | ||||
| Chang et al. [30] | √ | |||||
| Kumar et al. [32] | √ | √ | ||||
| This study | √ |
Table 2.
Comparison of FPP approach with existing methods for the same purpose.
| Method | Type | Objective Functions | Characteristics |
|---|---|---|---|
| Guo and Tanaka [55] | Linear programming (LP) |
|
|
| Donoso et al. [56] | Quadratic programming (QP) |
|
|
| Chen [57] | LP |
|
|
| Chen and Lin [58] | Nonlinear programming (NLP) |
|
|
| Peters et al. [59] | LP |
|
|
| Chen and Wang [60] | NLP |
|
|
| Chen [61] | Artificial neural network (ANN) |
|
|
| Proposed methodology | Polynomial programming (PP) |
|
|
Table 3.
Practical case.
| t | 1 | 2 | 3 | 4 | 5 | 6 | 7 | 8 | 9 | 10 | 11 | 12 | 13 | 14 | 15 |
|---|---|---|---|---|---|---|---|---|---|---|---|---|---|---|---|
| 0.789 | 0.892 | 0.915 | 0.87 | 0.879 | 0.887 | 0.892 | 0.892 | 0.904 | 0.939 | 0.928 | 0.896 | 0.883 | 0.939 | 0.911 |
Table 4.
Parameter settings in existing methods.
| Method | Parameter Setting |
|---|---|
| Guo and Tanaka [55] | , where is the required satisfaction level. |
| Donoso et al. [56] | , where and are the weights of the two terms in the objective function, respectively; is the required satisfaction level. |
| CL I [58] | , where is the order of the range of a fuzzy yield forecast; is the required satisfaction level. |
| CL II [58] | , where is the order of the range of a fuzzy yield forecast; is the order of the satisfaction level; is the required range. |
| Peters et al. [59] | , where is the required range. |
| Chen [61] | , where is the learning rate; is the connection weight; is the threshold on the output node. |
Table 5.
Forecasting performance using various methods.
| Method | Average Range | MAE | MAPE | RMSE |
|---|---|---|---|---|
| Guo and Tanaka [55] | 0.082 | 0.019 | 2.11% | 0.021 |
| Donoso et al. [56] | 0.081 | 0.019 | 2.12% | 0.021 |
| CL I [58] | 0.079 | 0.020 | 2.17% | 0.022 |
| CL II [58] | 0.110 | 0.021 | 2.33% | 0.025 |
| Peters et al. [59] | 0.110 | 0.021 | 2.33% | 0.025 |
| ANN [61] | 0.139 | 0.019 | 2.10% | 0.023 |
| Two-stage fuzzy approach | 0.075 | 0.019 | 2.07% | 0.020 |
Table 6.
Complexity and execution-time comparison results.
| Method | Complexity | Computation Time (s) |
|---|---|---|
| Guo and Tanaka [55] | LP (global optimal) | <1 |
| Donoso et al. [56] | QP (local optimal) | 1 |
| CL I [58] | NLP (local optimal) | 2 |
| CL II [58] | NLP (local optimal) | 2 |
| Peters et al. [59] | QP (local optimal) | 1 |
| ANN [61] | NLP (local optimal) | 10 |
| Two-stage fuzzy approach | PP (local optimal) | 5 |
Publisher’s Note: MDPI stays neutral with regard to jurisdictional claims in published maps and institutional affiliations. |
© 2021 by the authors. Licensee MDPI, Basel, Switzerland. This article is an open access article distributed under the terms and conditions of the Creative Commons Attribution (CC BY) license (https://creativecommons.org/licenses/by/4.0/).
Share and Cite
MDPI and ACS Style
Wu, H.-C.; Tsai, H.-R.; Chen, T.-C.T.; Hsu, K.-W. Energy-Efficient Production Planning Using a Two-Stage Fuzzy Approach. Mathematics 2021, 9, 1101. https://0-doi-org.brum.beds.ac.uk/10.3390/math9101101
AMA Style
Wu H-C, Tsai H-R, Chen T-CT, Hsu K-W. Energy-Efficient Production Planning Using a Two-Stage Fuzzy Approach. Mathematics. 2021; 9(10):1101. https://0-doi-org.brum.beds.ac.uk/10.3390/math9101101
Chicago/Turabian StyleWu, Hsin-Chieh, Horng-Ren Tsai, Tin-Chih Toly Chen, and Keng-Wei Hsu. 2021. "Energy-Efficient Production Planning Using a Two-Stage Fuzzy Approach" Mathematics 9, no. 10: 1101. https://0-doi-org.brum.beds.ac.uk/10.3390/math9101101
Note that from the first issue of 2016, this journal uses article numbers instead of page numbers. See further details here.