
Time-Dependent Reliability Analysis of Plate-Stiffened Prismatic Pressure Vessel with Corrosion


1
Department of Mechanical Engineering, Korea Advanced Institute of Science and Technology, 291 Daehak-ro, Yuseong-gu, Daejeon 34141, Korea
2
Korea Maritime Transportation Safety Authority (KOMSA), Sejong 30100, Korea
*
Authors to whom correspondence should be addressed.
Mathematics 2021, 9(13), 1544; https://0-doi-org.brum.beds.ac.uk/10.3390/math9131544
Submission received: 3 June 2021
/
Revised: 25 June 2021
/
Accepted: 27 June 2021
/
Published: 1 July 2021
(This article belongs to the Special Issue Advances in Reliability Modeling, Optimization and Applications)
Abstract
:In this study, the structural reliability of plate-stiffened prismatic pressure vessels was analyzed over time. A reliability analysis was performed using a time-dependent structural reliability method based on the response surface method (RSM). The plate-stiffened prismatic pressure vessel had a rectangular cross-section with repeated internal load-bearing structures. For the structural analysis, this repeated structure was modeled as a strip, and a structural reliability analysis was performed to identify changes in the reliability index when general corrosion and pitting corrosion occurred in the outer shell. Pitting corrosion was assumed to be randomly distributed on the outer shell, and the reliability index according to the degree of pit (DOP) and time was analyzed. Analysis results confirmed that the change in the reliability index was larger when pitting corrosion was applied compared with when only general corrosion was applied. Additionally, it was confirmed that above a certain DOP, the reliability index was affected.
1. Introduction
In general, deterministic analysis is used in the design of structures. The safety factor obtained from experience is mainly used to secure the safety of the design, and the average or representative value is used for the strength of the structure and the properties of the material used. When a factor of safety is used, it is difficult to know how much the variables used in the design affect safety. In structures, acting loads and material properties are inherent uncertainties. Hence, deterministic analysis using a representative value cannot account for the instantaneous maximum load [1,2].
To solve problems in deterministic analysis, researchers have proposed a probabilistic analysis of structures that considers uncertainties. Several design variables are assumed as random variables having a probability distribution such as normal distribution, and the probability of failure of the structure is calculated. Reliability is a basic concept in structural design that considers uncertainties in loads and material properties, and structural reliability is crucial in determining whether a structure is safe. Many methodologies, such as the FORM, SORM, and MCS have been applied in various fields to evaluate the reliability or failure probability of structures [3,4].
Many researchers have applied structural reliability techniques to various structures. Joung et al. (2009) [5] used structural reliability techniques for deep-sea unmanned underwater vehicles. Moreover, Elsayed et al. (2016) [6] used them for the offshore jacket structure, Wei et al. (2016) [7] for jacket-type offshore wind turbines, Morato et al. (2016) [8] for offshore wind turbine support systems, Montes-Iturrizaga and Heredia-Zavoni (2016) [9] for offshore mooring lines. Joung et al. (2017) [10] obtained structure reliability using various reliability analysis techniques for the load-out support frame in the offshore installation.
Marine infrastructures, such as offshore structures and ships, are exposed to harsh environmental conditions throughout their lifetime. The most significant safety issue is structure deterioration [11], whereas corrosion and fatigue are representative deterioration mechanisms of the marine infrastructure [12,13]. The deterioration of structures, such as corrosion and fatigue, changes over time; furthermore, because time is interpreted in terms of reliability, time-dependent reliability analysis is performed to assess structural reliability [14].
Researchers investigating ships and offshore structures have conducted studies regarding structural reliability. Guedes Soares and Garbatov (1999) [15] conducted tests for ship structure, Sun and Bai (2003) [16] for FPSO, Bai et al. (2016) [17] for the offshore jacket platform, Liu and Frangopol (2018) [11] for ship structure under shock deteriorations. Hou et al. (2019) [18] performed time-dependent structural reliability analysis for the pipeline using various methods.
In the marine infrastructure, steel is often used for economic reasons. However, in the marine environment, it is very corrosive to mild and low-alloy steel. Therefore, corrosion is prevented through protective coatings or cathodic protection; however, it has been discovered that corrosion occurs even in these approaches [19]. According to statistics on ship hulls, most ship failures are related to corrosion [20,21,22]. As such, ageing is a dominant life-limiting factor, and the most severe factor is corrosion. Structure destruction by corrosion can occur without any warning; therefore, it is crucial to predict the mechanism of corrosion and the ease with which it occurs [23].
In this study, time-dependent reliability analysis was performed for the case where corrosion occurred on an external shell plate for plate-stiffened prismatic pressure vessels used in marine environments. Section 2 details the time-dependent structural reliability analysis procedure and the general and pitting corrosion models. In Section 3, for the time-dependent structural reliability analysis proposed in Section 2, a strip model was defined for the target system, plate-stiffened pressure. Moreover, analysis modeling of strip model to apply general and pitting corrosion is shown. In Section 4, a reliability index is obtained by changing the DOP to indicate the reliability of the structure over time when general and pitting corrosion occur simultaneously. The conclusions are presented in Section 5.
2. Structural Reliability Method
Uncertainties occur in geometrical values, material properties, and loads. Uncertainty indicates the lack of information required for assessment, and ambiguous or incorrect information can result in wrong decisions. The use of deterministic methods in structural analysis does not reflect the actual uncertainty that may arise. Physical, measurement, statistical, and model uncertainties may occur, and to evaluate structure stability, structural analysis must be performed considering the degree of uncertainty from various parts. In structural reliability analysis, various design variables are defined as random variables and can be reasonably evaluated through stochastic structural analysis [24].
Reliability refers to the ability of a structure to perform the required function under a certain condition when no breakdown or damage occurs, and it can be expressed as shown in Equation (1) when the probability of failure is . Failure probability values are calculated for various failure modes, and the sum of the probability is used to obtain the maximum reliability value of the structure. The reliability index represents the value of Z in the standard normal distribution when evaluating the reliability of probability, and the failure probability can be obtained using the inverse function of the cumulative distribution function.
If the stress or displacement of the structure exceeds the defined threshold, the structure will fail to satisfy the required performance. This can be defined as a performance function or a limit state function, and the final or serviceability limit state can be distinguished according to the limit state. In general, the limit state is composed of the relationship between the resistivity of the system and the applied load, which can be expressed as Equation (2). The limit state function represents the boundary between the fault area and the safe area, called the failure surface, and the probability of failure represents the probability when the limit state function is less than 0, i.e., when the load is greater than the resistance.
The structure deteriorates over time and the material strength changes accordingly; therefore, the probability distribution depends on time and must be evaluated. Time dependence may result from a decrease in structural capacity or failure resulting from the occurrence of loads above the structural strength or loading capacity. This time-related structural reliability analysis is called time-dependent reliability analysis. In other words, the reliability index of the structure will fluctuate over time, and whether the structure is safe for the designed lifetime should be determined. Hence, a time-related term is added to the limit state function and transformed into a limit state function in Equation (3). If the load and resistance change over time, and the change in load over time is higher than the resistance or strength of the structure over time, i.e., , structure failure will occur. In general, in time-dependent reliability, corrosion and fatigue progress primarily because they change over time.
2.1. Structural Reliability Analysis Procedure
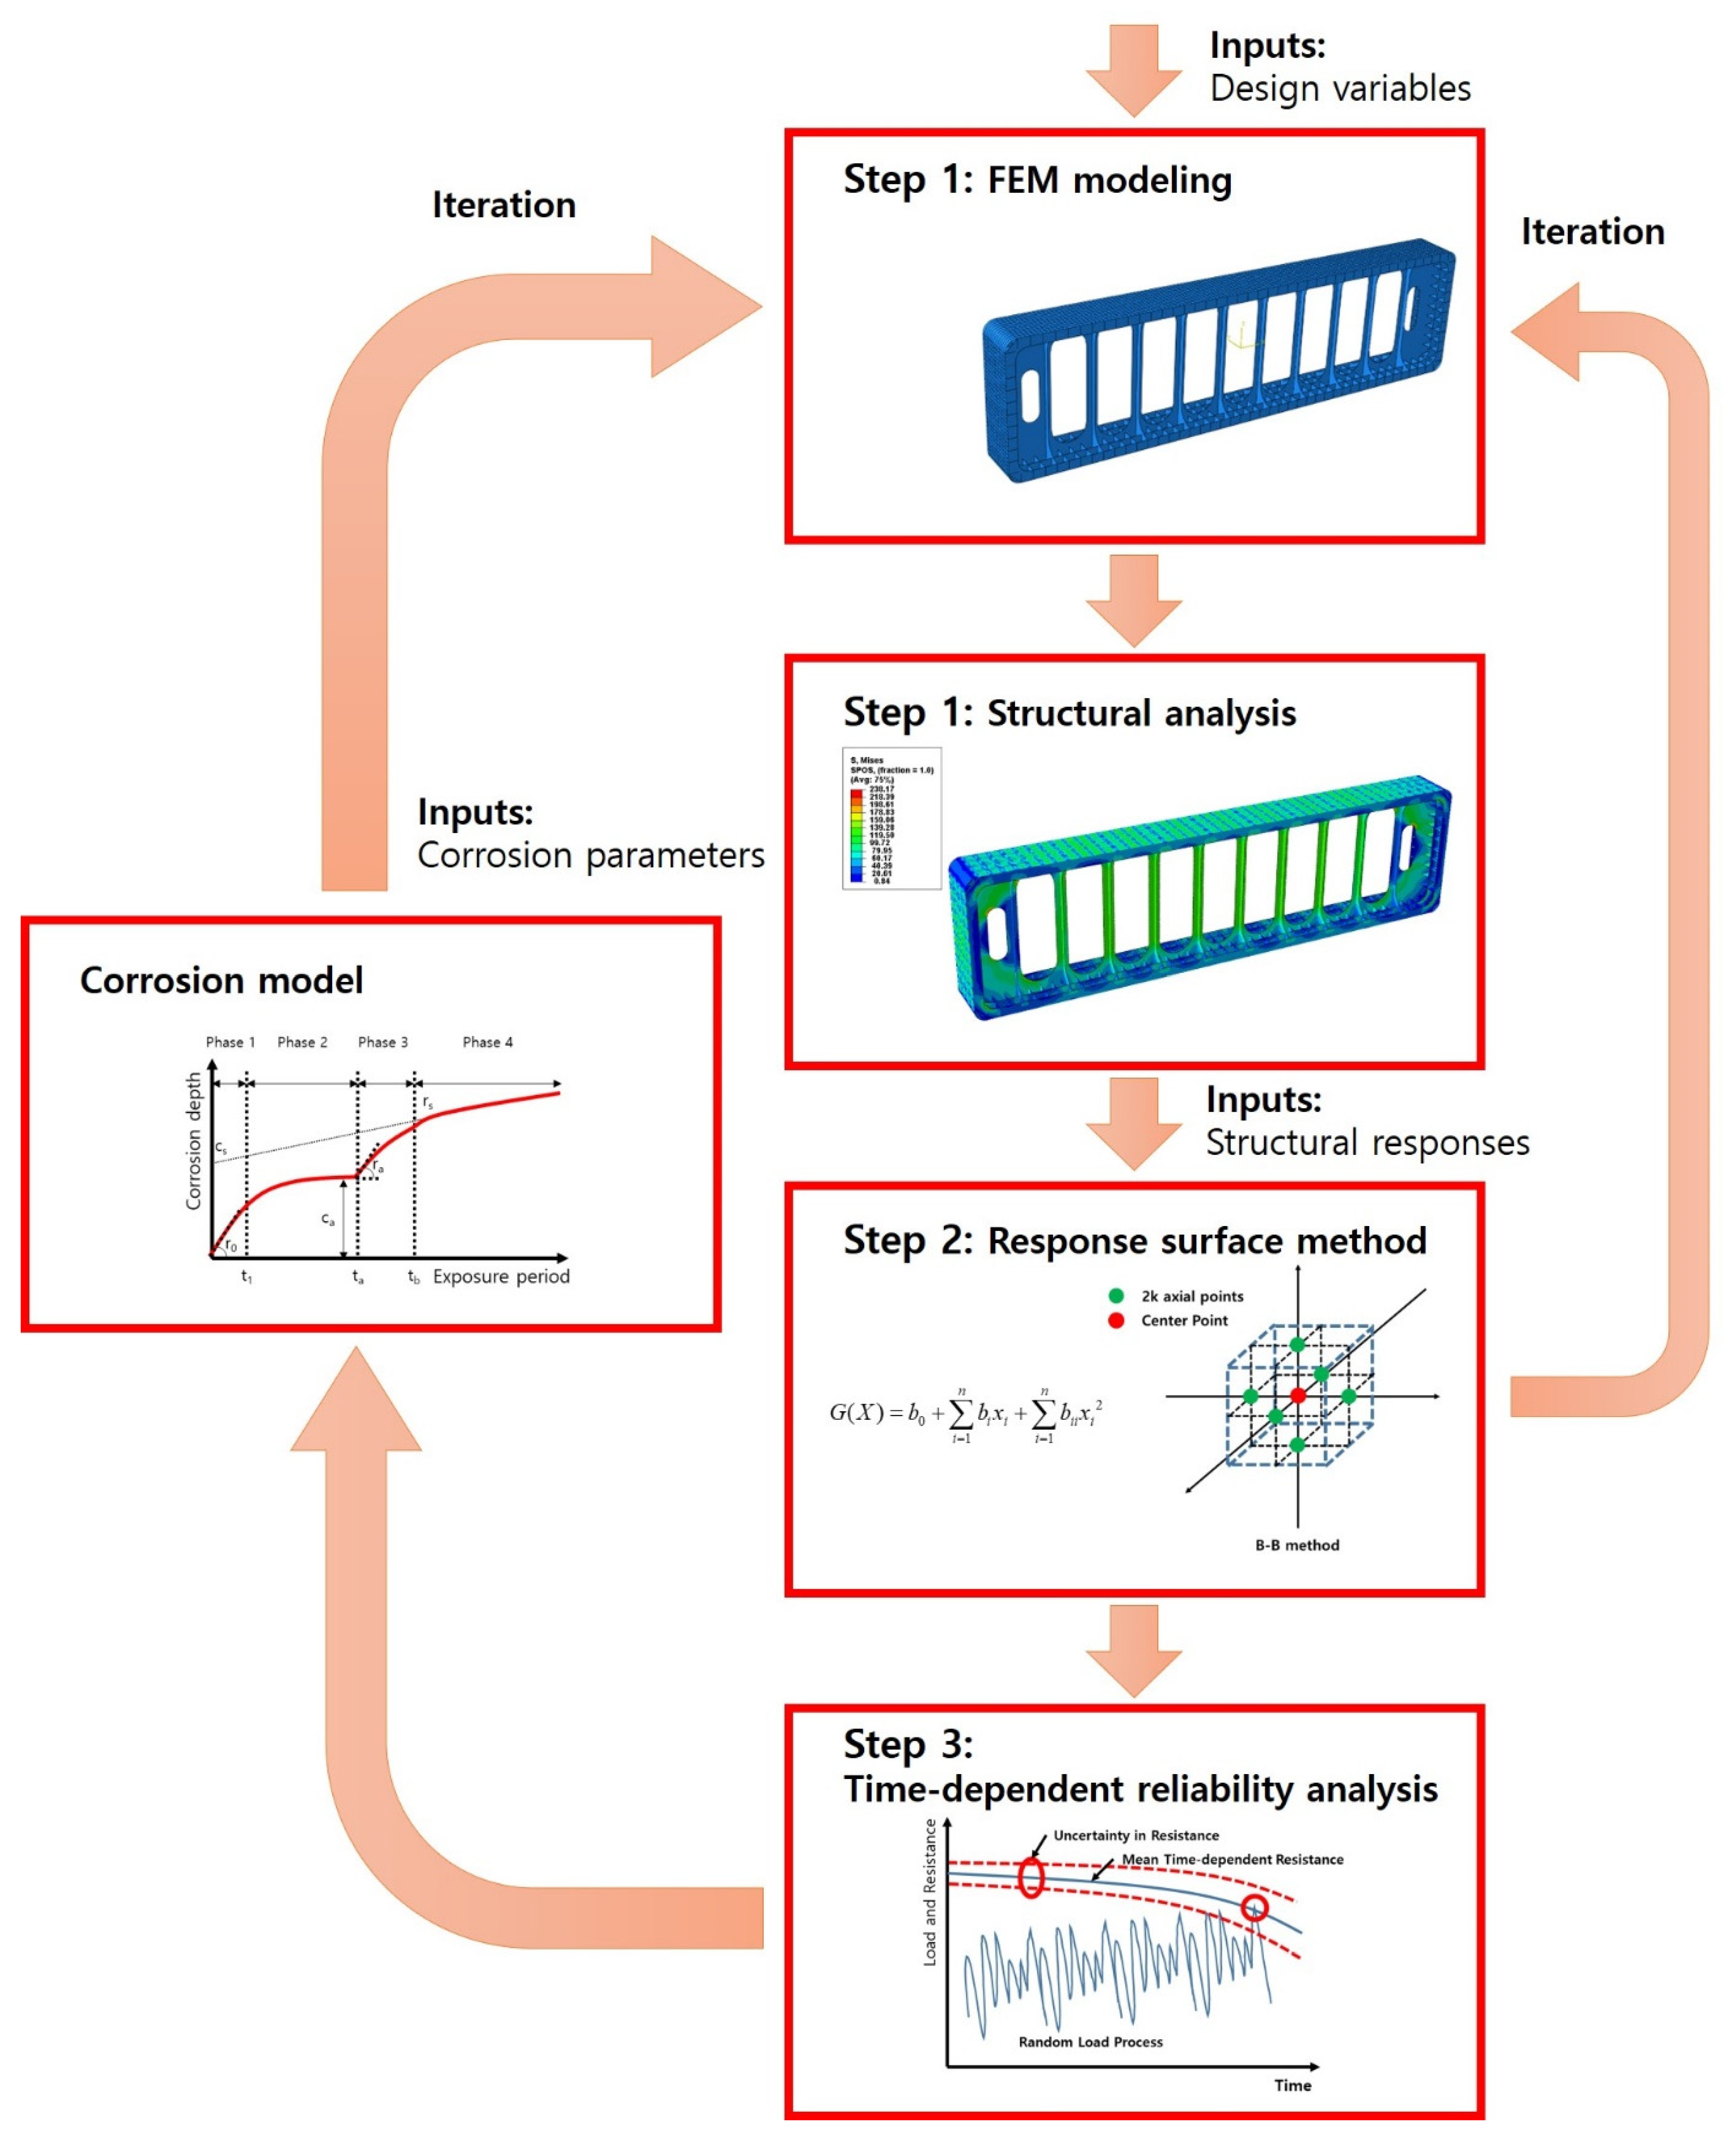
Figure 1 shows the process of the time-dependent structural reliability analysis. The entire procedure consists of the following three steps:
- Step 1
- FEM modeling and analysis,
- Step 2
- Limit state function generation using RSM,
- Step 3
- Time-dependent reliability analysis with corrosion.
The description of each step is as follows. Step 1 is the process of manufacturing a pressure tank for reliability analysis in a FEM model for structural analysis. FEM modeling was conducted using the commercial program Abaqus CAE 6.14 using the given design variables, and the repeated structural analysis in the plate-stiffened prismatic pressure vessel was conducted by modifying the full model to save computing time by requiring repeated structural analysis in structural reliability analysis. It was divided into a strip model and used for the production of FEM modeling.
Step 2 is the process of obtaining the limit state function of the structural reliability analysis structure plate-stiffened prismatic pressure vessel using RSM. Since plate-stiffened prismatic pressure vessel is a complex structure, limit state function for structural reliability analysis is difficult to obtain analytically, and limit state function was fabricated by using a surrogate model. Using the RSM, which expresses the strength response of the target system for a given load as a formula, the structure response was obtained through iterative structural analysis. Based on this, the structure limit state function was constructed.
The final Step 3 is the process of performing time-dependent reliability analysis with corrosion. This is a process to find the reliability index of plate-stiffened prismatic pressure vessel using the FEM model and limit state function produced in Step 1 and Step 2. The structure reliability analysis over time was conducted to observe the changes in the reliability index values over time. Corrosion was reflected for the thickness of the plate used for the design and fabrication of the structure, and a time-dependent limit state function was derived by reflecting the effect of corrosion on the FEM model, and structural reliability analysis was conducted by utilizing it. To analyze the structural reliability, the previous Step 1 and 2 are repeated, and the process proceeds until the values of the reliability index of the entire structure converge. In the model, the effects of corrosion are continuously updated, and the updated limit state function production and structural reliability analysis are repeatedly performed.
2.2. Limit State Function Generation Using RSM
For simple structures, the limit state function can be easily expressed as a function of design variables. However, complex shapes such as those of plate-stiffened prismatic pressure vessels are difficult to express mathematically. The RSM is a technique of approximating several variables using a small number of result values, which is primarily used to obtain the limit state functions in complex structures in reliability analysis. In this study, a response surface was obtained using a second-order polynomial approximate form without a coupling term, as shown in Equation (4), through which a limit state function was designed, as shown in Equation (5).
In the case of RSM using the second-order polynomial approximate form without a coupling term, the limit state function can be obtained through a analysis when variables exist. The recommended sampling point is that which is separated by for each variable around the center point. In general, represents the standard deviation of the variables and values between 1 and 3 are used according to experience; in this study, 3 was used. To obtain the probability of failure, the MCS was performed for the performance function produced using the RSM, and times of iterations were performed in the MCS to ensure accuracy.
In this study, structural reliability analysis was performed using the RSM. The stress response of the target structure could be obtained using the RSM technique, and limit state function was fabricated through this. The stress response was obtained using Equation (5). There is a total of random variables in the equation, and coefficients of such as can be obtained through regression. If this is expressed in matrix form, it can be expressed as the following Equations (6)–(8).
By using the RSM, the structure shows the response of stress according to the change of the design variable (Equation (9)).
Here, the stress value of the structure was derived through repeated execution using the Abaqus python scripts. One response surface can be fabricated through repeated structural analysis of in total.
The vector can be obtained by using the Equation (10), and combined with the material strength along with the matrix, limit state function was produced as in Equation (5). Using the derived limit state function, MCS was used for the number of repetitions of the following equation, and the response surface also changed with time, so the reliability index was obtained with the newly produced limit state function for each time Equation (11) [25].
2.3. Target Reliability
2.3.1. Concept of Reliability Index
In general, what we want to know through the structural reliability analysis is the probability that the structure is destroyed over time, . In other words, the concept of the stability of the structure is probable and the values of , reliability index are used to represent it. Reliability index was proposed by Hasofer and Lind [3] and represents the distance from the origin in the standard normal space to the linearly limited limit state surface, and is used in FORM, etc.
can be obtained using simulation methods such as MCS, and can be obtained through analytic methods such as FORM. The two values can be compared using the standard cumulative normal distribution function (Equation (12)).
2.3.2. Target Reliability Index
In designing a structure, reliability analysis is required to design a reliable structure, and for this, a reference or target value is required. Target reliability index represents the reliability level that is required to satisfy the level of safety and serviceability, and these values are suggested by various standards and regulations. According to Lee et al. (2016) [25], it must satisfy the probability of failure of (per year) by the American Petroleum Institute (API), in the case of great risk to life by the Canadian Standards Association, in serious consequences by DNV GL. When the structure is expressed as a reliability index, it should be designed to reflect a value greater than .
The plate-stiffened prismatic pressure vessel, which undergoes structural reliability analysis, has a lifetime of 20 years or more and is expensive, so there is no redundant structure. Plate-stiffened prismatic pressure vessel can be used in various fields and can store various substances, so the consequences are different for each case. In this study, a target reliability index was set to satisfy , because the target system is an LNG fuel tank used in an LNG-fueled ship.
2.4. Corrosion Models
Marine environments can be extremely corrosive to mild and low-alloy steel. From the economic perspective, steel is the preferred material for many engineering structures. Statistics on ship hulls indicate that more than 90% of ship failures are related to corrosion [20,21,22]. Marine infrastructures, such as marine structures and ships, have protective coatings or cathodic protections to prevent; nevertheless, they become corrosive [19] and hence destruction can occur without any warning [26]. Therefore, it is important to predict the numbers of corrosive buildings and buildings likely to corrode [23].
In most time-dependent reliability analysis, the effect of corrosion is expressed as an uncertainty. Many studies have been performed regarding building corrosions. The latter can be categorized into two types: (i) general corrosion, which results in the thickness loss of the overall material in plates and structural members, and (ii) pitting corrosion, which results in partial thickness changes in storage containers [23]. In this study, structural reliability analysis was conducted by applying a strip model with general and pitting corrosion models that can affect the overall structure.
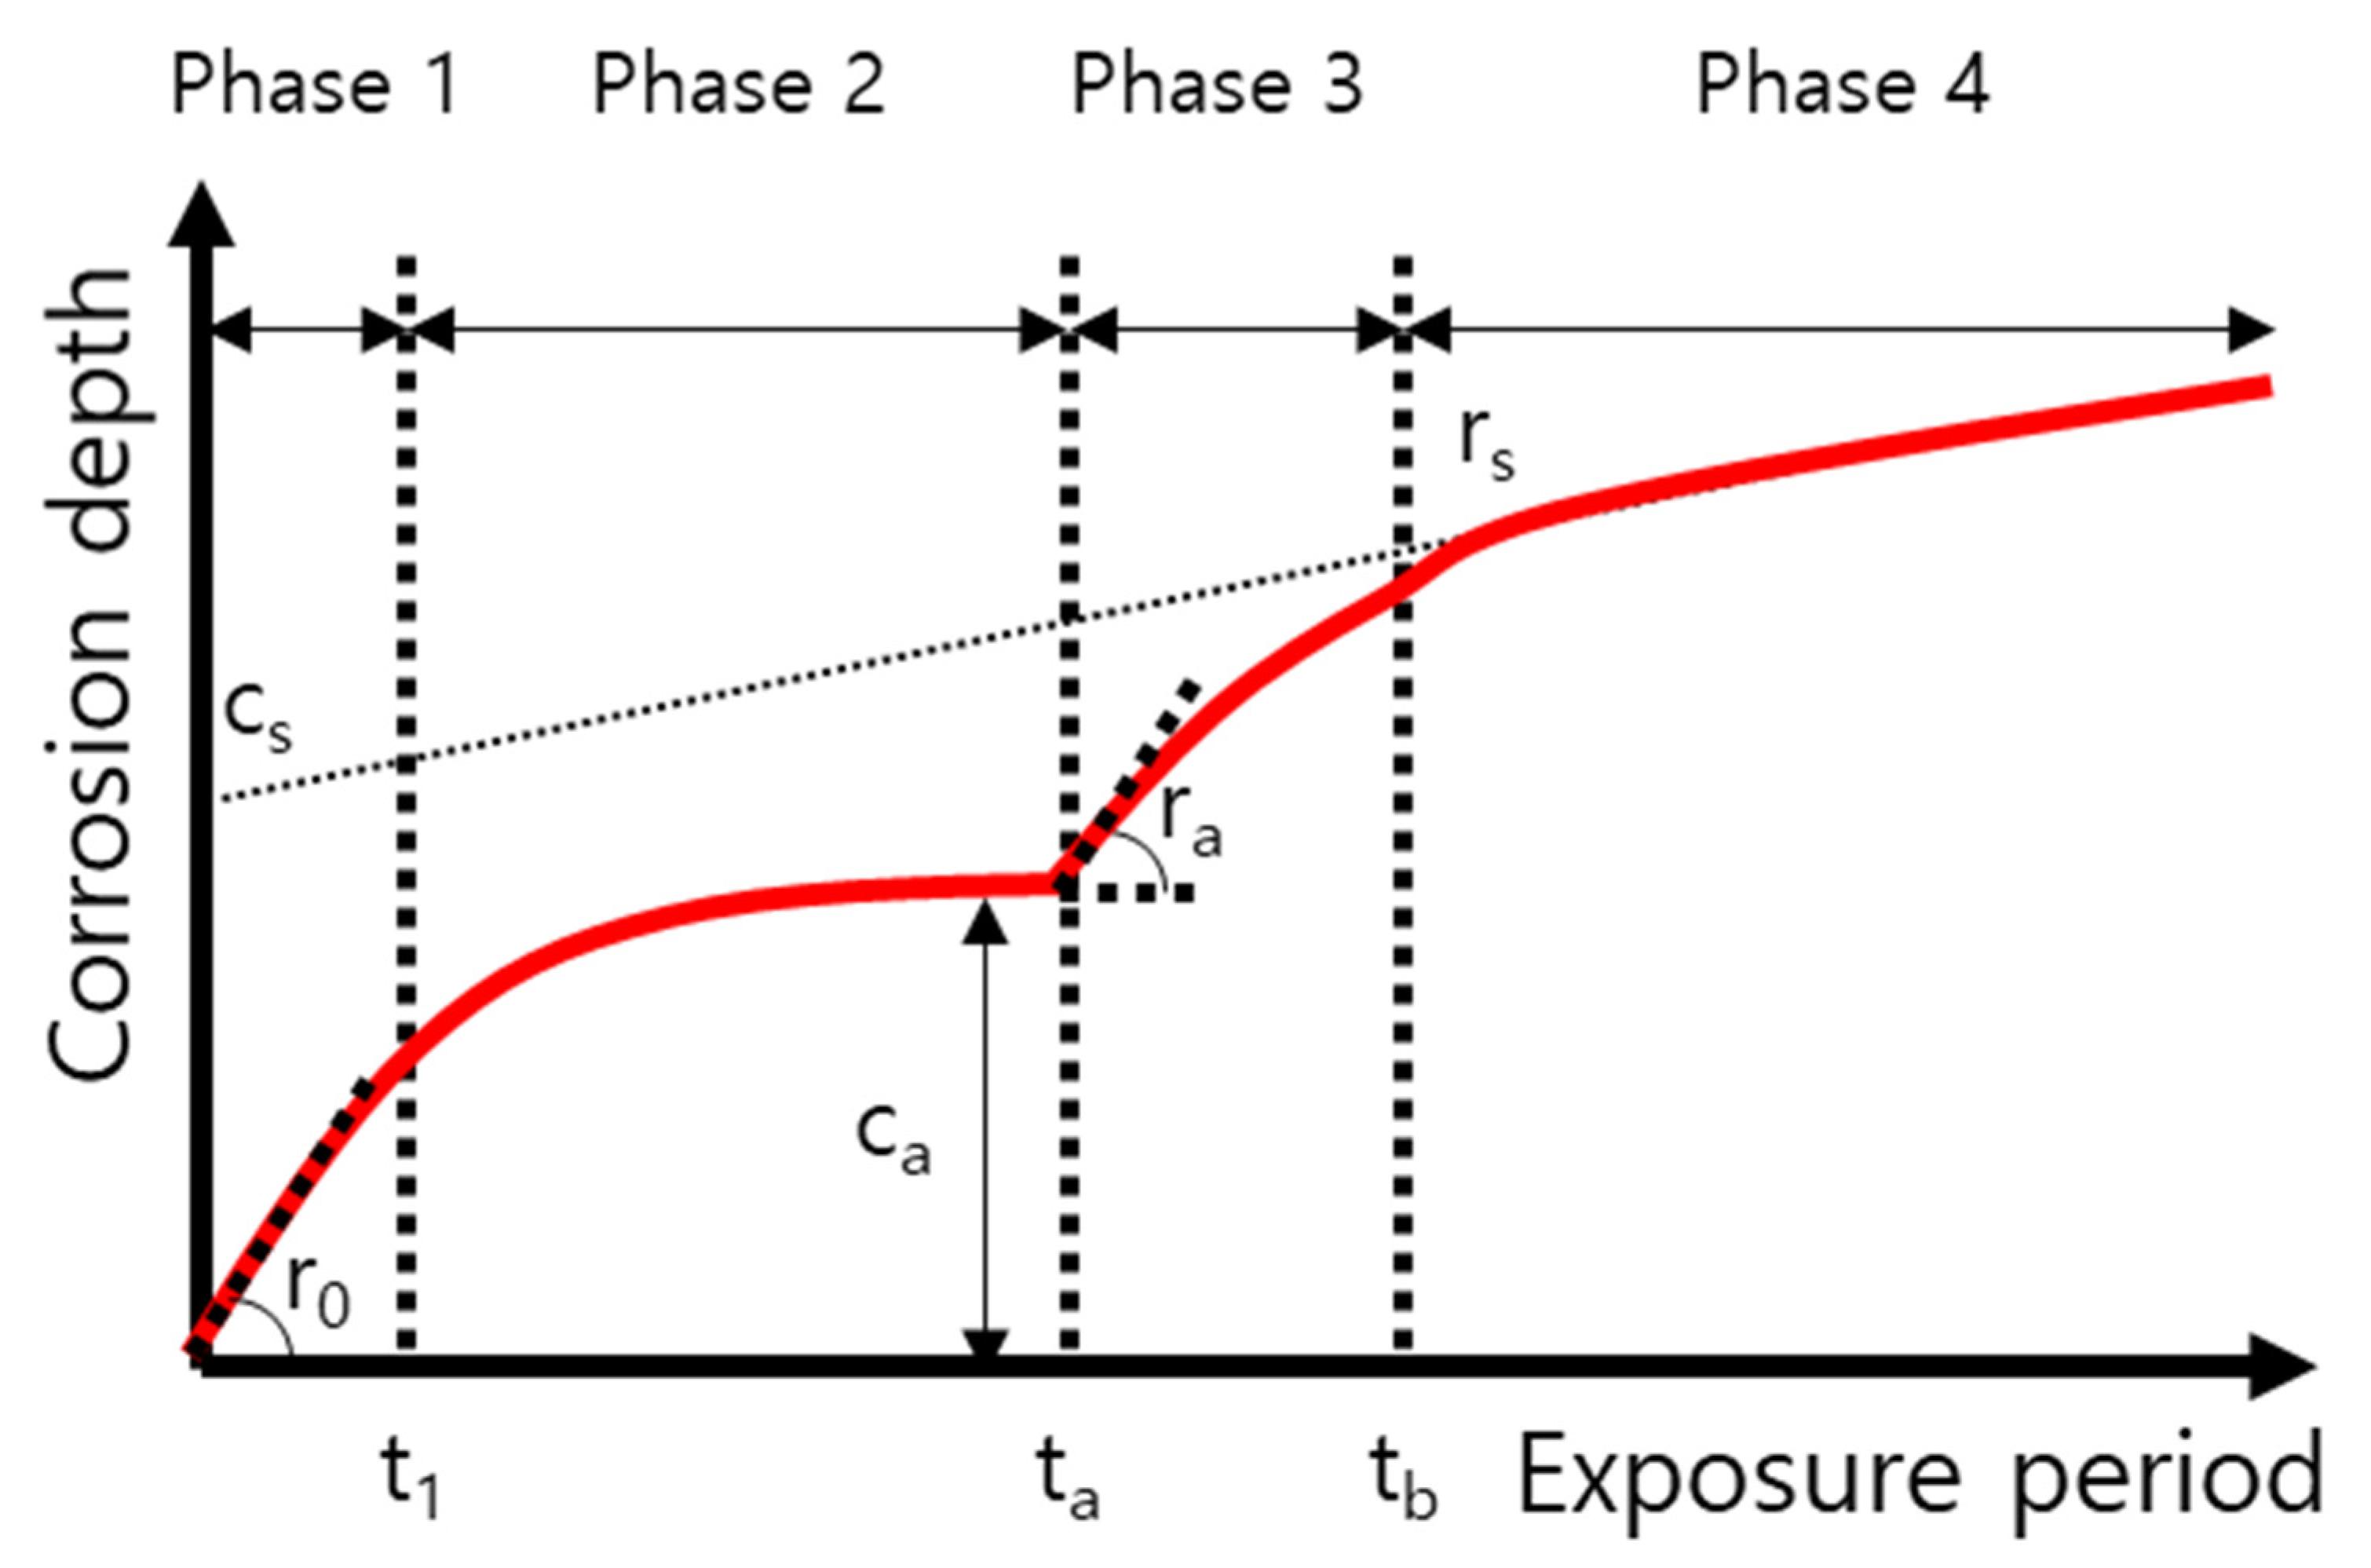
Several empirical models have been proposed for general and pitting corrosion. In this study, the corrosion model proposed by Melchers [19,23,27,28] was used, and the parameters in Figure 2 and Table 1 were used to focus on long-term corrosion.
In this study, Abaqus CAE 6.14 was used as a commercial FEM tool for structural analysis, and a MATLAB program was used for reliability analysis. To perform an iterative analysis and derive results, a program was developed using a modeling and analysis tool using Python.
3. Structural Reliability Analysis for Prismatic Pressure Vessel
In this section, we describe the application of the structural reliability procedure presented in Section 2 to plate-stiffened prismatic pressure vessels. For the plate-stiffened prismatic pressure vessel, a description of the entire system was presented, and how the corrosion was modeled in the FEM model and DOP was applied. Moreover, definitions and probability distributions of random variables which were used to apply structural reliability analysis were listed.
3.1. System Description of Plate-Stiffened Prismatic Pressure Vessel
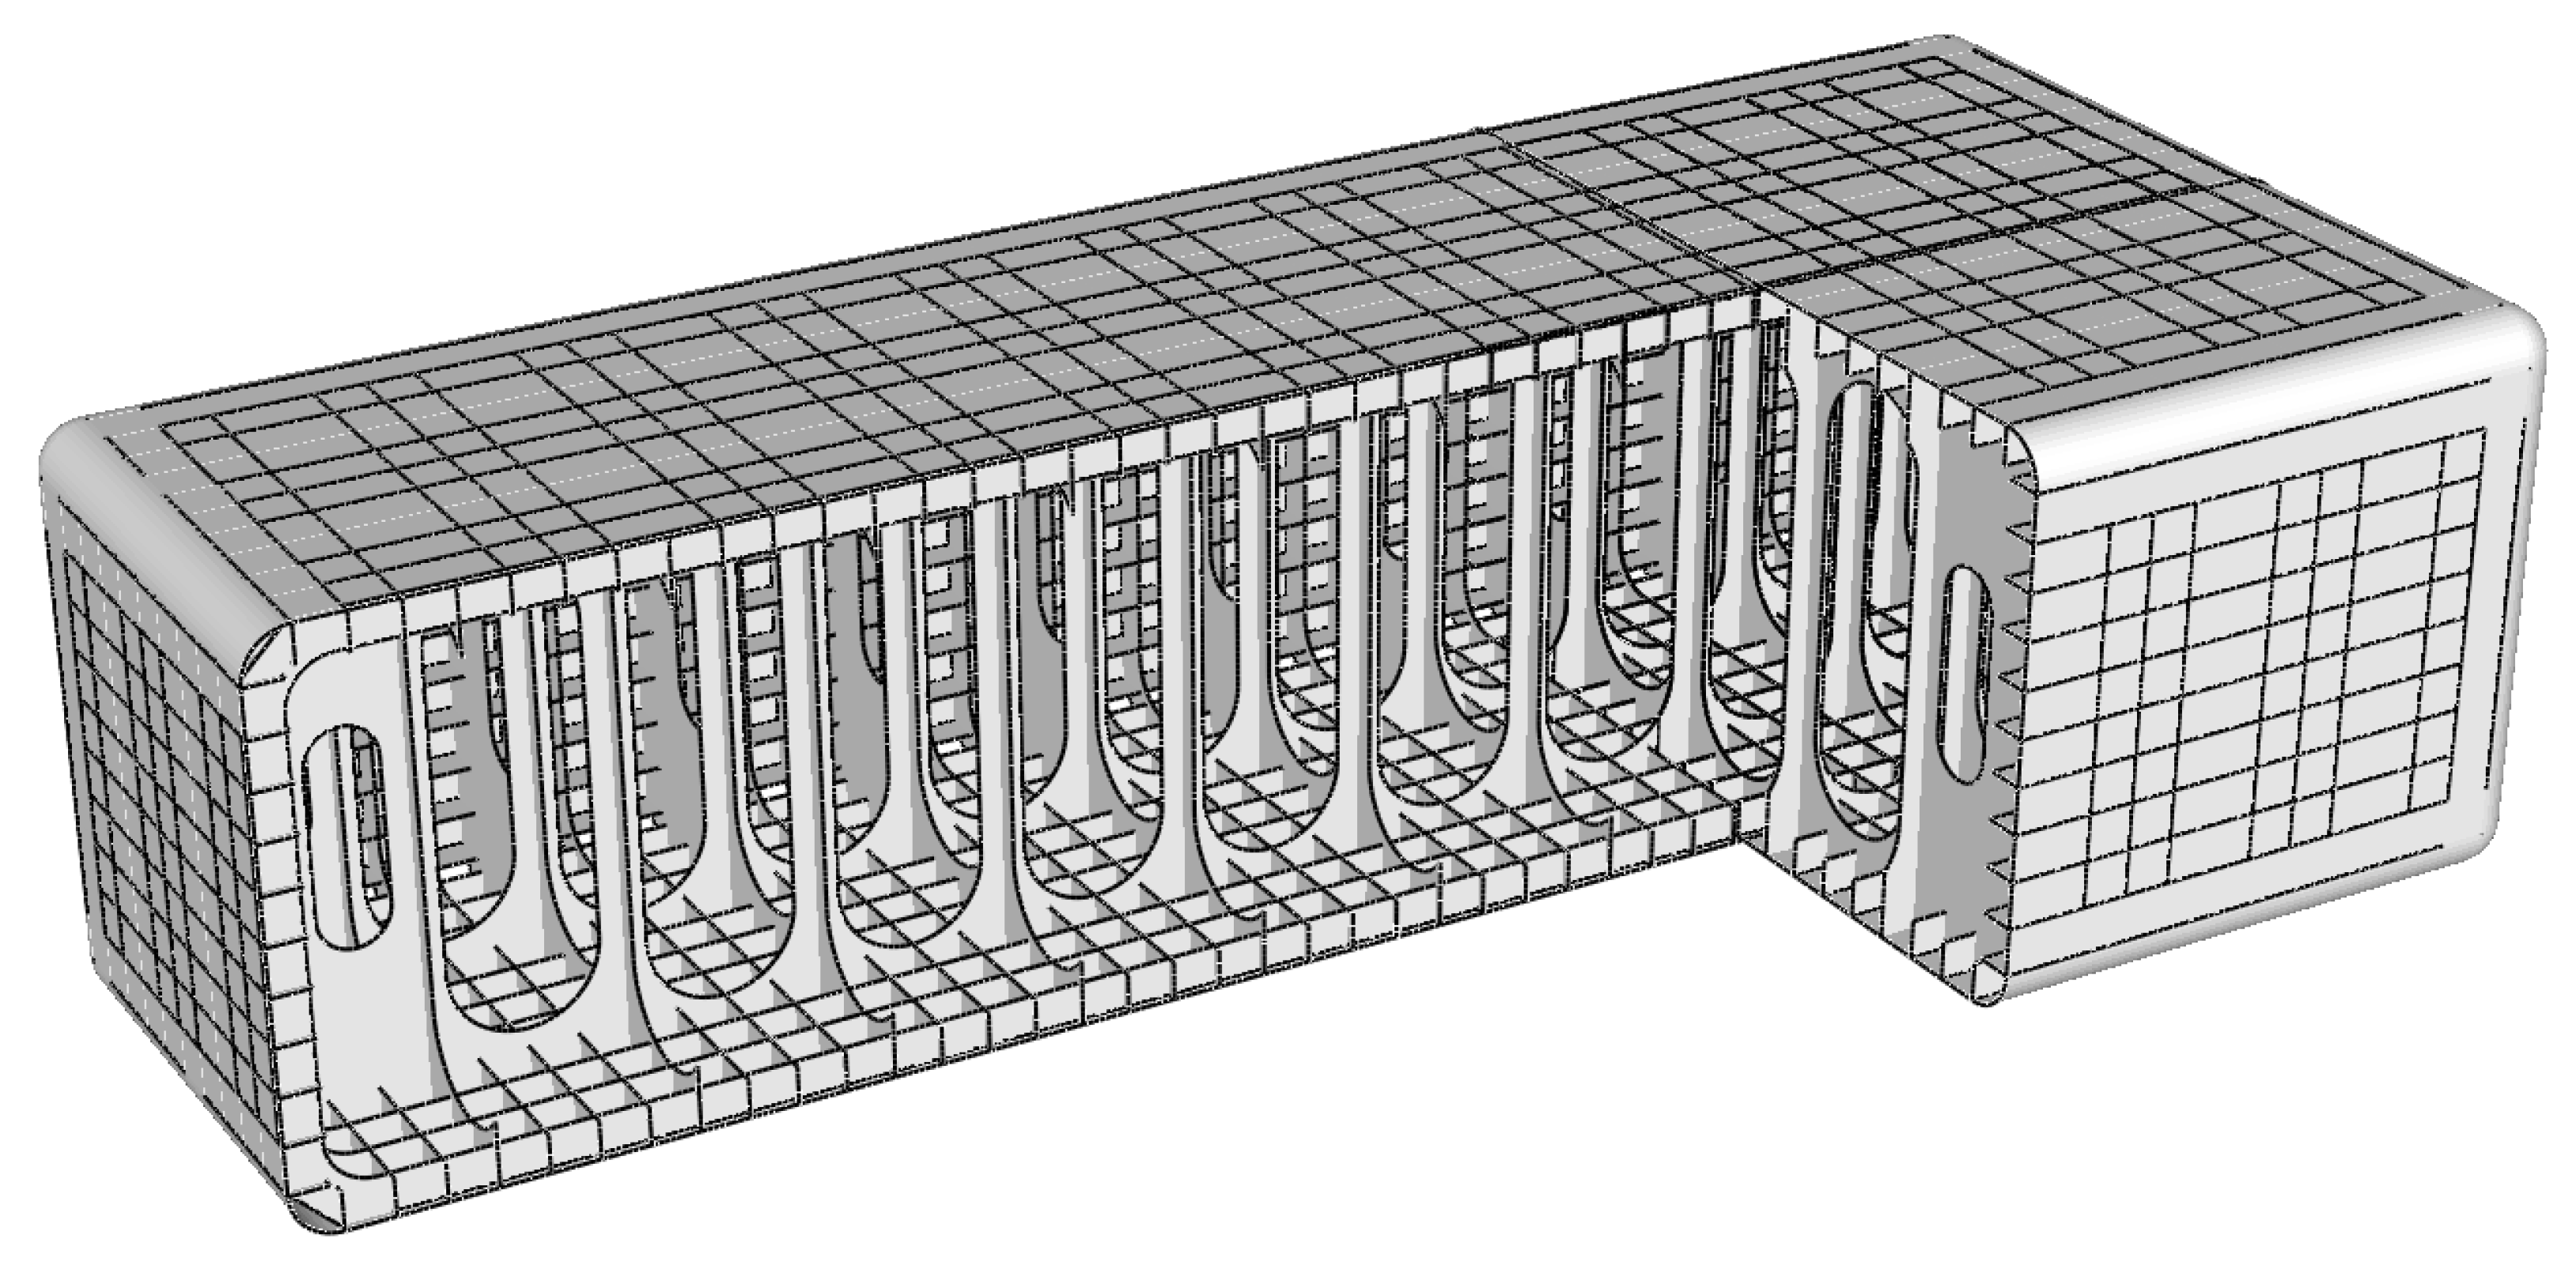
A prismatic pressure vessel is a new-shape pressure vessel that increases the volume efficiency to reduce dead space, which is a disadvantage of cylindrical or spherical pressure vessels. As shown in Figure 3, the outside is rectangular, whereas the inside exhibits a repeating lattice structure. It is designed such that tension is applied to the lattice structure owing to internal pressure. Various types of prismatic pressure vessels exist depending on the repeated load carrying structure. Ahn et al. (2017) [29] proposed a prismatic pressure vessel in the form of an X-beam; Choi et al. (2018, 2020) [30,31] proposed a plate-stiffened prismatic pressure vessel using a plate.
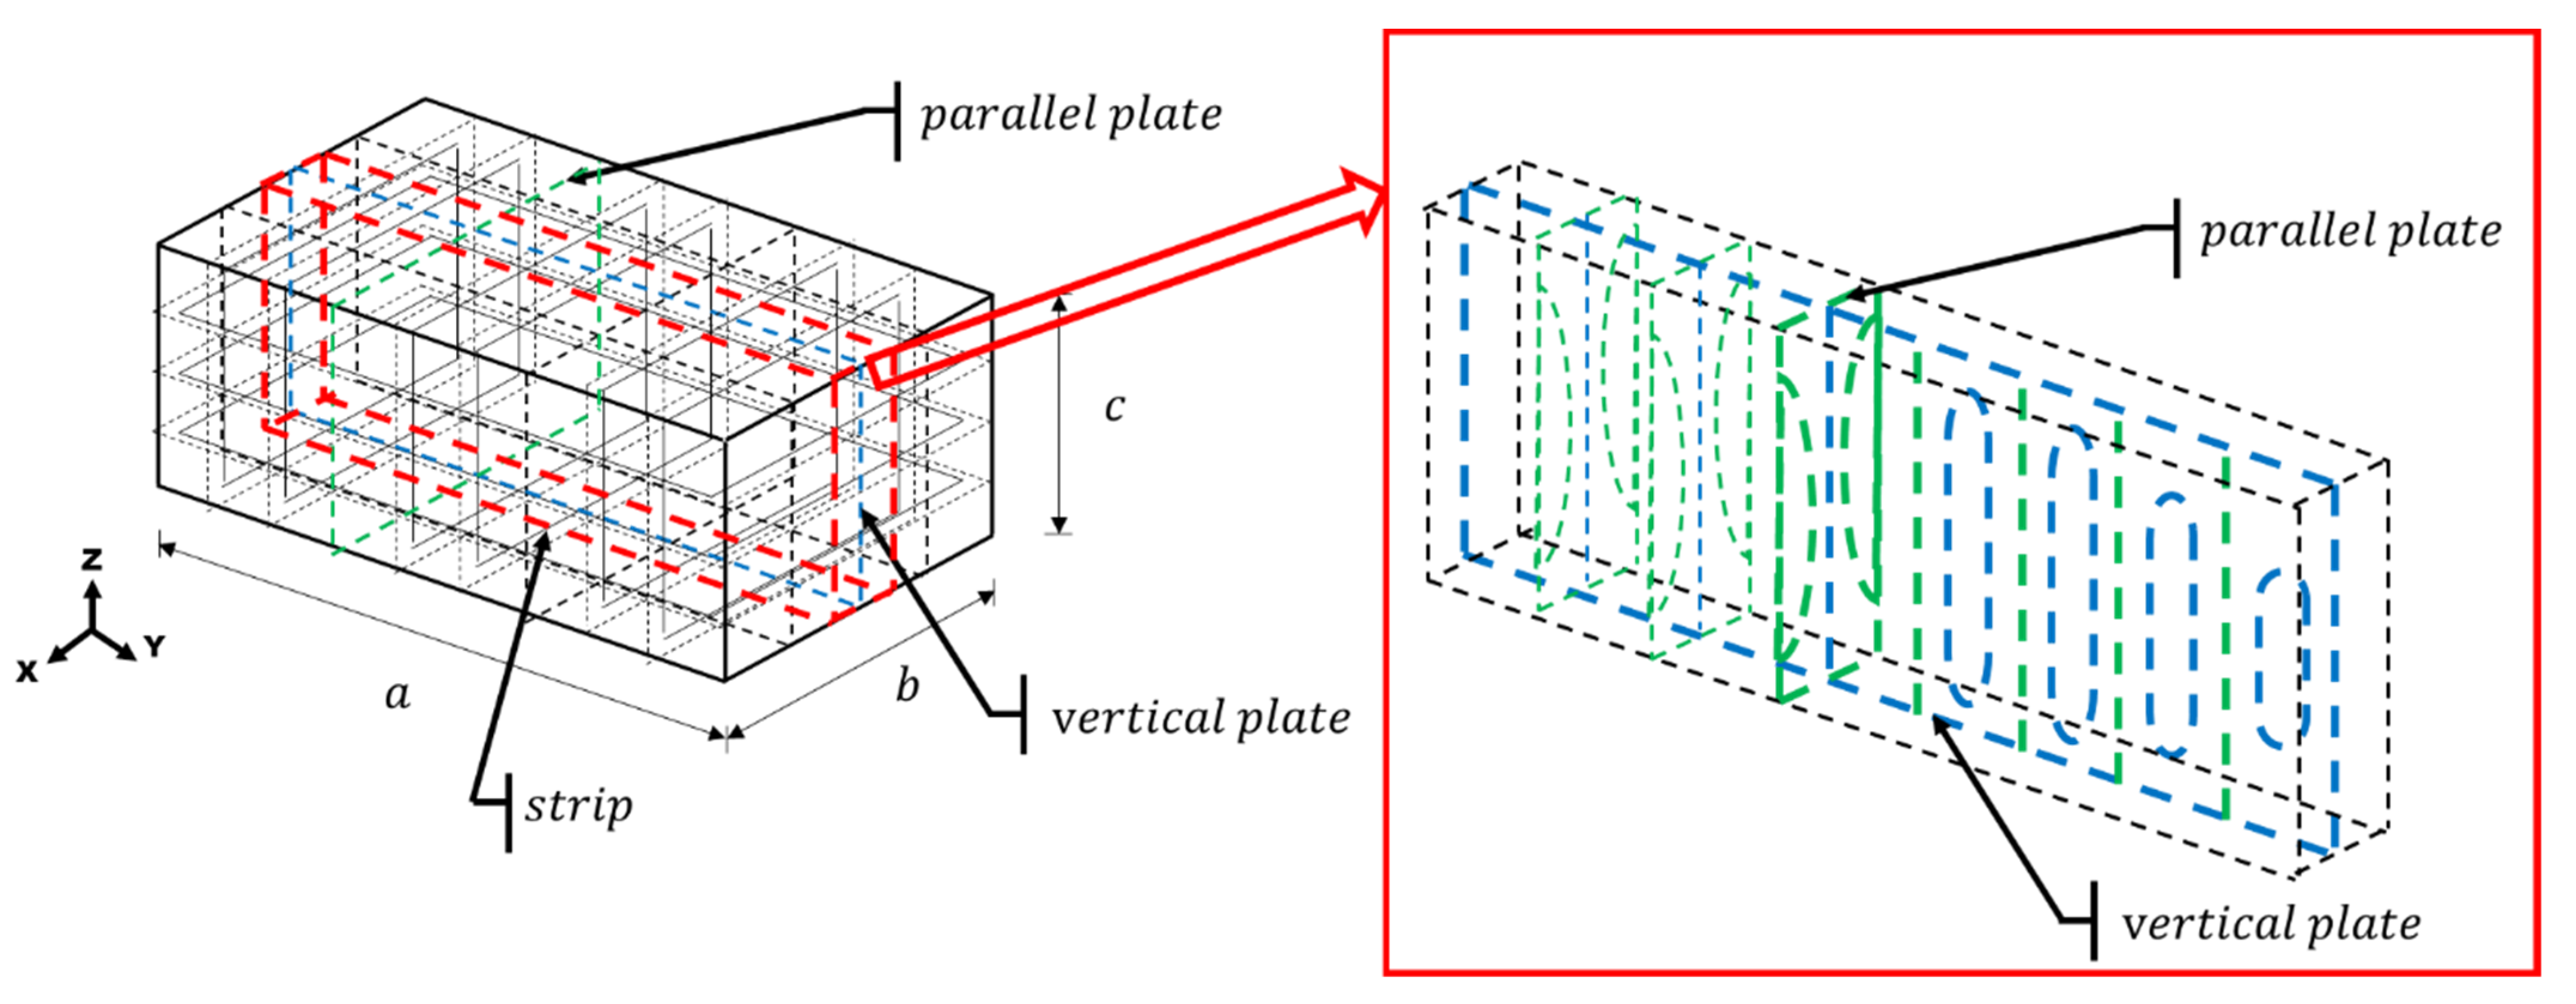
In this study, plate-stiffened prismatic pressure vessels were investigated, and the load carrying structure of the pressure vessels was a vertical plate and a parallel plate. A stiffener was installed on the outer shell to disperse the internal pressure. The target pressure vessel was the fuel tank of the AFRAMAX LNG tanker used as an example in Choi et al. (2020) [31], and the fuel tank measured L = 15 m, B = 33 m, H = 9 m, and the design pressure was 6 barg to load the fuel when calculating the amount of LNG fuel.
3.2. Finite Element Modeling
As shown in Figure 4, the plate-stiffened pressure vessel possesses a structure in which the internal lattice structure is repeated. A repeated structure carried out the reliability analysis by making a strip analysis model. Structural reliability analysis was performed based on the RSM of the second-order polynomial approximate form without a coupling term.
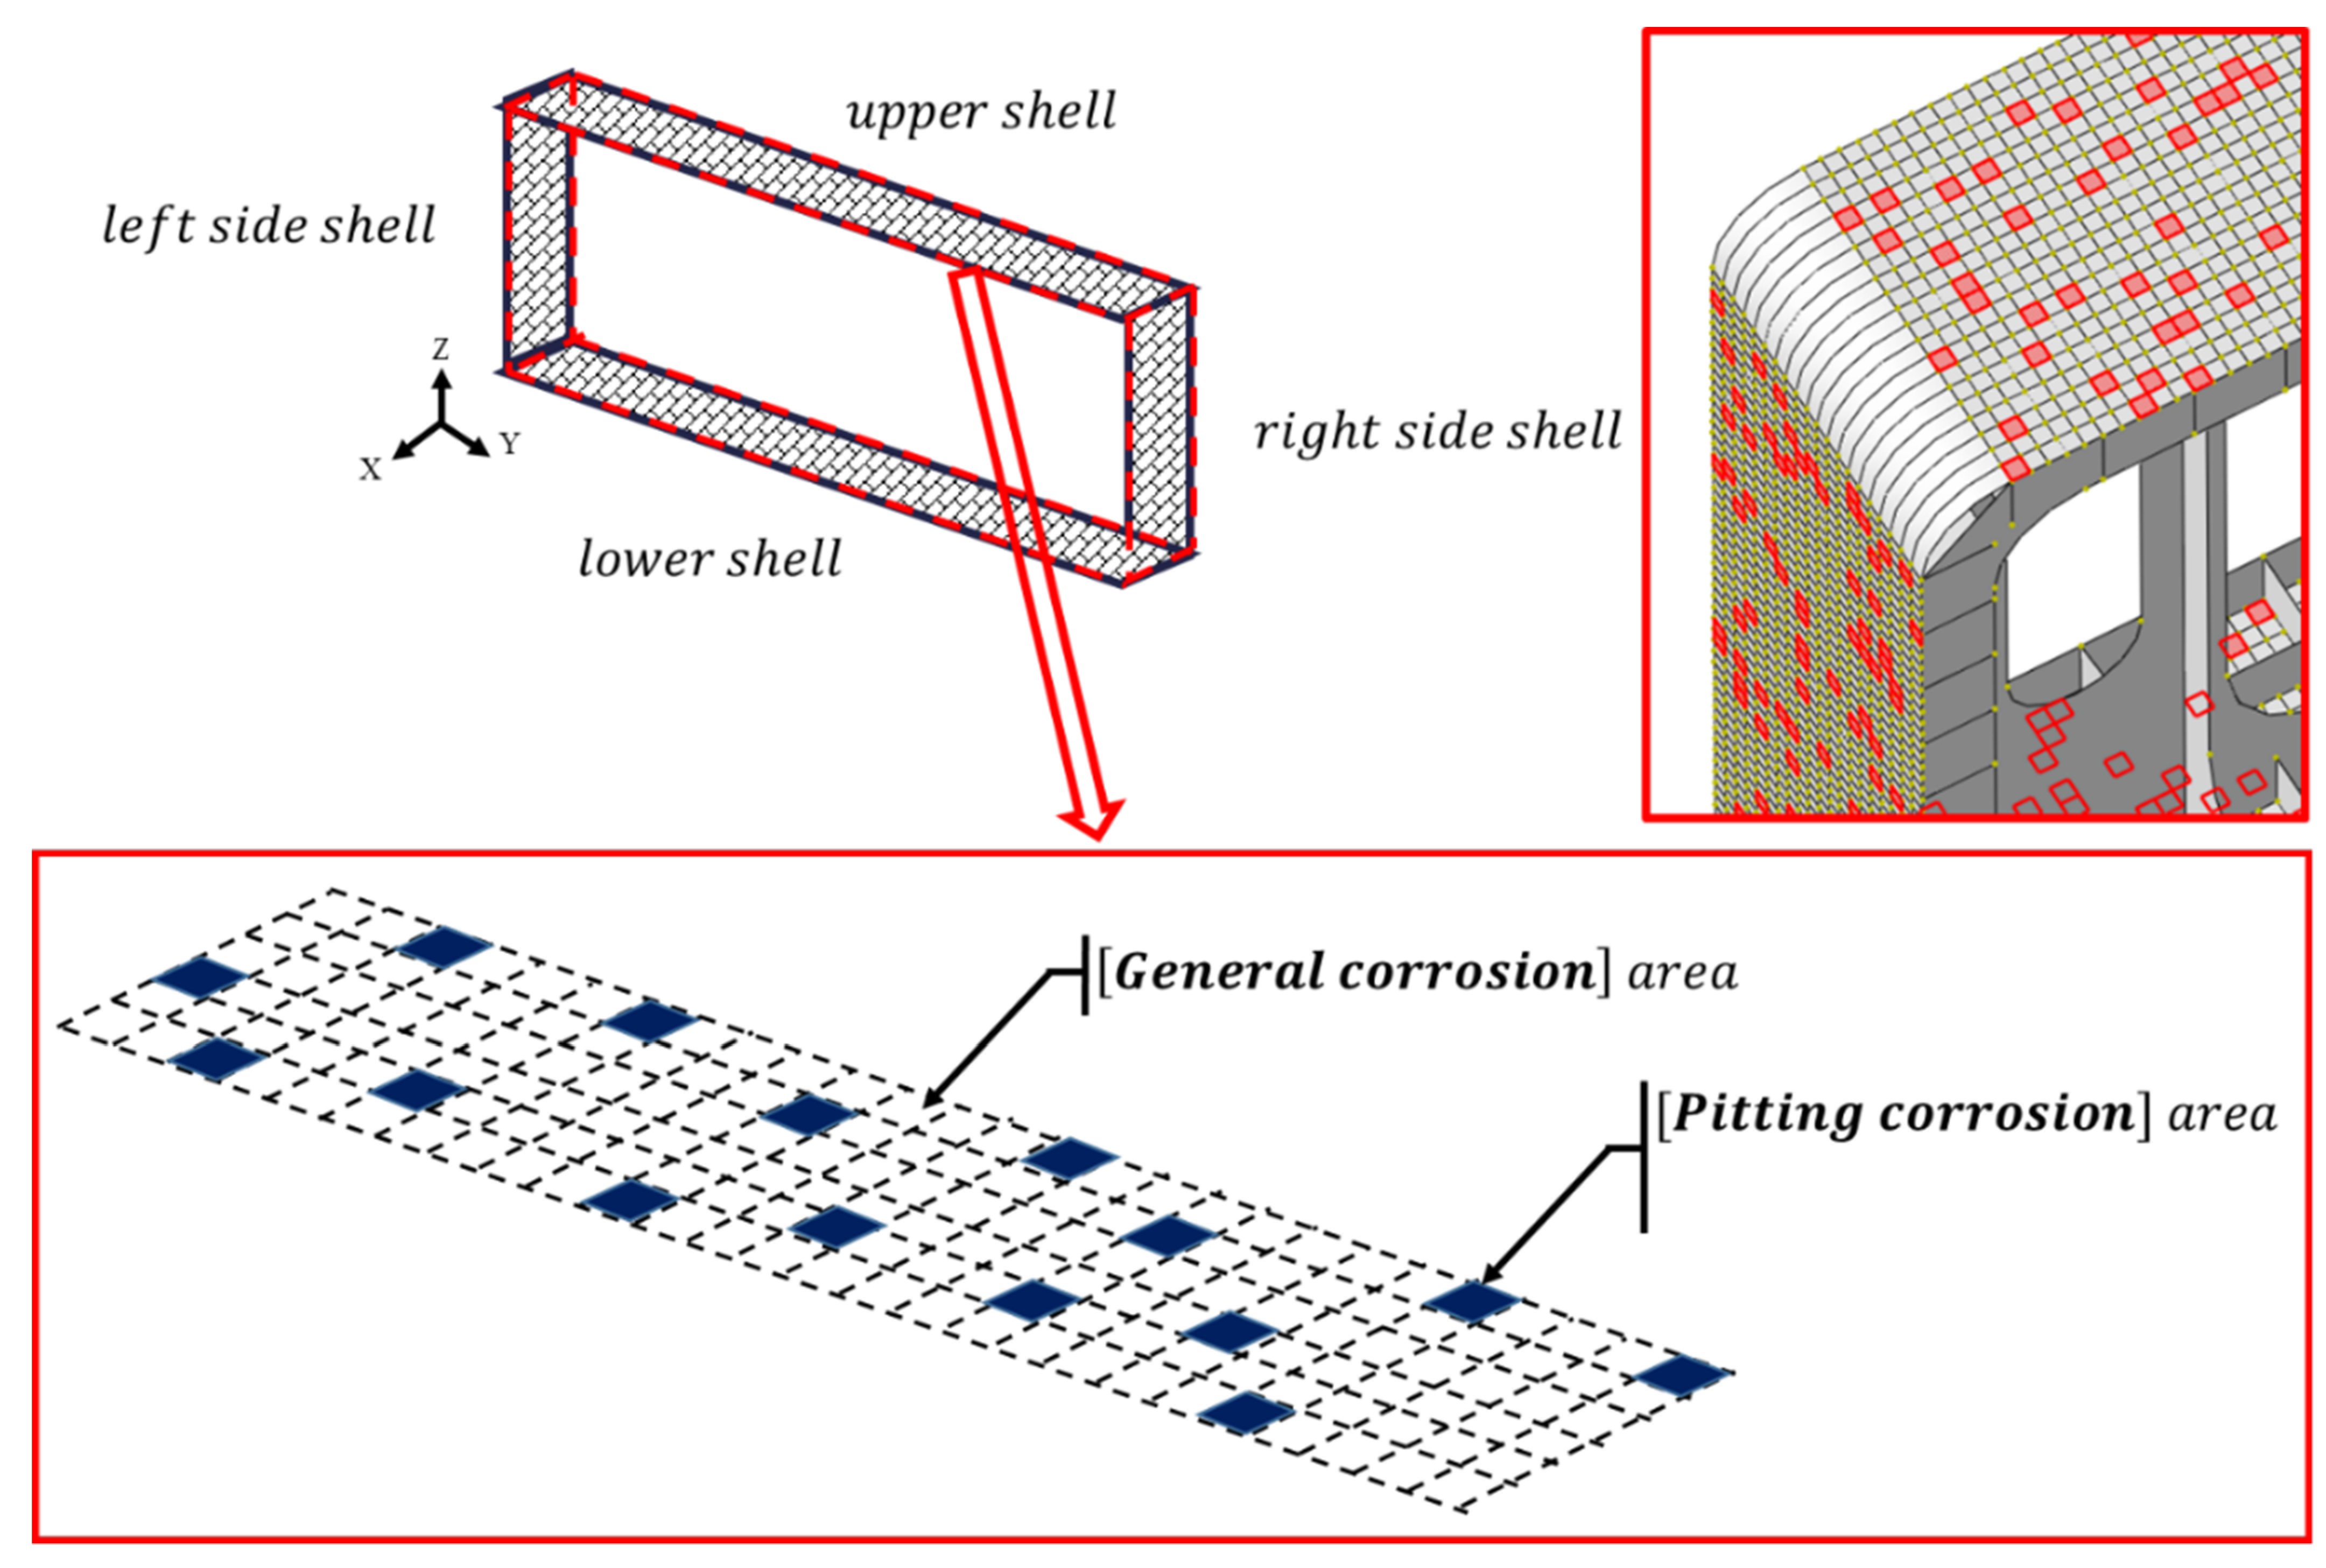
The prismatic pressure vessel is generally made of 9% nickel steel (the properties are shown in Table 2), and it has been reported that corrosion does not occur in the latter because it is stored at low temperatures. However, according to Ming et al. (2018) [32], general corrosion or pitting corrosion may occur owing to external environmental factors. Therefore, in time-dependent reliability analysis, corrosion is analyzed in the outer shell, and it is assumed that general corrosion occurs in the entire outer shell and pitting corrosion occurs in some areas.
For the pitting corrosion, the DOP expressed as Equation (13) is important [11]. To investigate the effects of these values, an analysis was performed by changing the DOP by 10% for each analysis model. To indicate the DOP, the outer shell was divided by the corrosion size, and the presence or absence of pitting corrosion on each element was divided as shown in Figure 5.
The FEM analysis was designed based on a three-dimensional shell and performed using Abaqus CAE 6.14, a commercial program. The mesh used S8R, an eight-node shell element for structural analysis. The basic mesh size was set to 50 mm based on the DNVGL Guidelines for Finite Element Analysis: “a minimum of three elements between the elementary lengths and a minimum of three longitudinal elements” [33]. Boundary conditions for the analysis were X-axis symmetry conditions on the left and right sides of the strip model, and displacement = 0 in the X, Y, and Z-axis directions for the center node of the lower shell, displacement = 0 in the Z-axis directions for other nodes in the lower shell.
To reflect the effect of corrosion over time in modeling, the outer shell thickness was changed. The outer shell was divided into areas where general corrosion and pitting corrosion occurred, and each area was subtracted from the initial design thickness by the corrosion depth according to the change in time. In this study, the corrosion depth was calculated by applying temperature, T = 15 °C to the Melchers’ general and pitting corrosion model described in Section 2.
3.3. Analysis Conditions
Based on the design variables shown in Table 2, a structural reliability analysis was performed according to the number of years of use in normal operation conditions. Based on the design variables, we analyzed the effect of each variable on the reliability index by changing the number of years of use and DOP. To determine the effect of corrosion on the structural reliability, the effects of general corrosion and pitting corrosion were analyzed separately.
First, to determine the effect of general corrosion, an analysis was performed while varying the lifetime to 0, 5, 10, 15, and 20 when the DOP without pitting corrosion was 0%. Based on the final lifetime of 20 y, the reliability index was obtained for the number of years of use: 0, 5, 10, 15, and 20. Next, to compare between when general corrosion and pitting corrosion occurred, the DOP was assumed to be 10%, and changes in reliability index values according to the number of years of use were examined. The values were compared with when only general corrosion was applied while varying the number of years of use from 0 to 20 y. Subsequently, to determine the effect of DOP on the reliability index of the entire structure, the change in the reliability index according to the DOP was examined while varying the DOP from 0 to 10%. The corrosion size was set to 250 mm × 250 mm, and the reliability index after 20 y was compared with the initial reliability index. Because the pitting corrosion occurring on the structure was randomly distributed in the FEM modeling, the structural reliability analysis was repeated 100 times to reflect the uncertainty according to the distribution.
4. Results and Discussion
In this section, we proceed to the structural reliability analysis with respect to the plate-stiffened prismatic pressure vessel based on the structural reliability procedure presented in Section 2. As mentioned above, after repeating Steps 1, 2, and 3, it was confirmed whether the structural reliability analysis result of the limit state function manufactured through RSM came within the target reliability, and using the general and pitting corrosion models, the change of analysis results according to the change of time were also examined. Responses to general and pitting corrosion and the effects of DOP and temperature changes were also analyzed. Finally, through this, guidelines for application to design and analysis were presented.
4.1. Structural Reliability Results
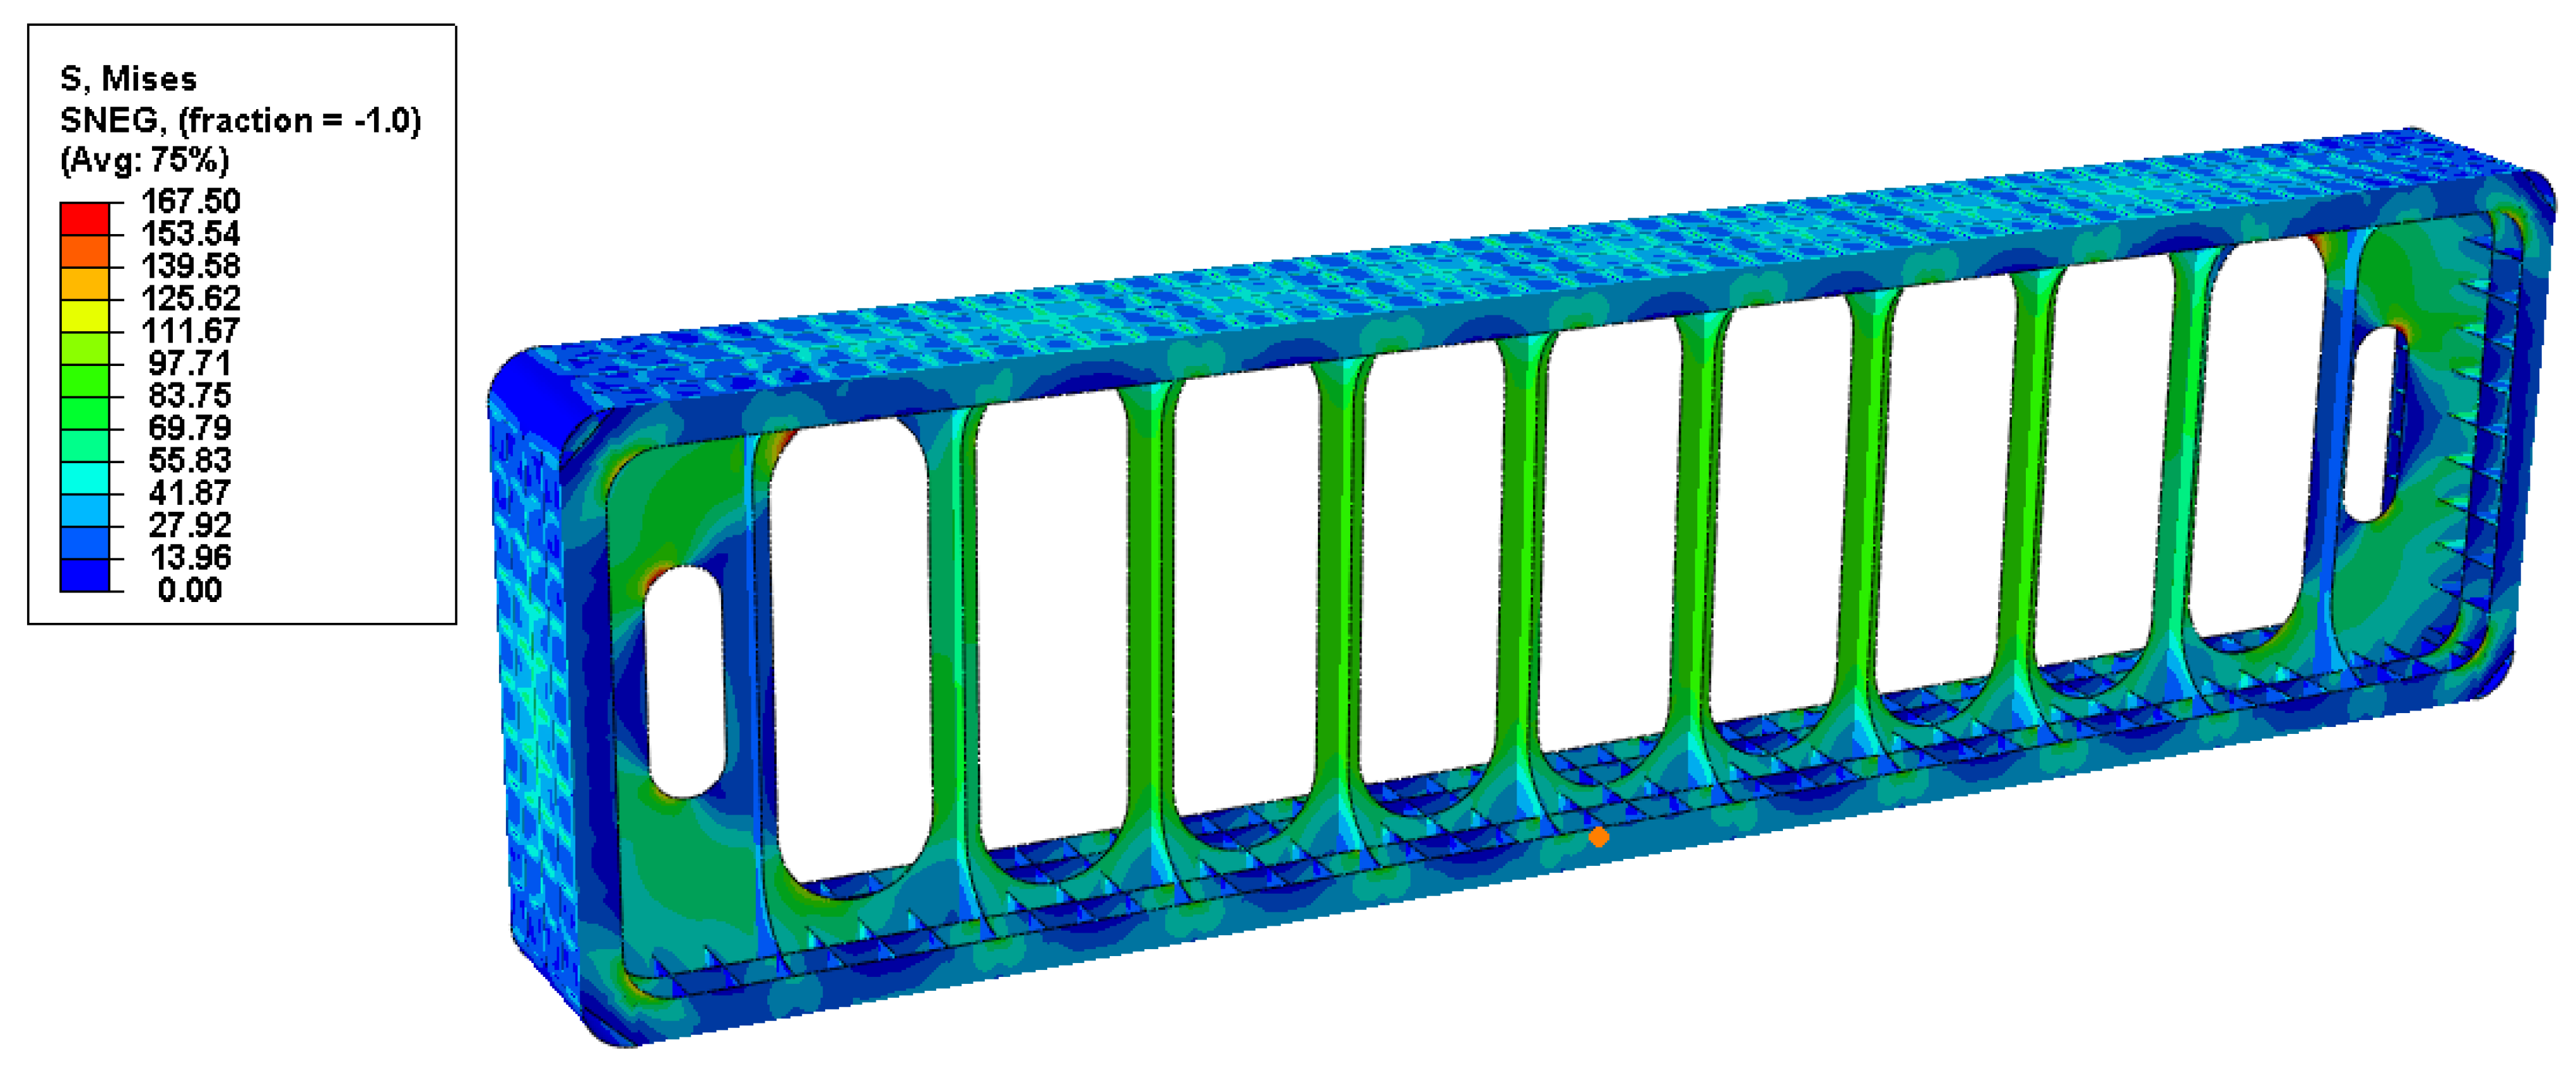
Figure 6 shows the results of FEM analysis. After fabricating and analyzing the strip model for the plate-stiffened prismatic pressure vessel, it was confirmed that the stress value was 167.5 MPa, which was an extremely low value compared with the allowable strength of the material, i.e., 230 MPa. Based on the results of structural analysis, it can be concluded that prismatic pressure vessels are safe.
Next, the structural reliability was analyzed. According to DNV CN 30.6 (1992) [2], for structures that do not have redundant structures but have serious consequences, and must be satisfied. When structural reliability analysis was performed on the structure before applying corrosion, it was discovered that the criteria were satisfied. The results of structural reliability were also confirmed to be safe.
In the structure analysis, the analysis value was lower than the allowable strength, which was the reference value; furthermore, the structure was assumed to be extremely safe. Although both of the design criteria were satisfied, it was discovered that the safety margin was small in the structural reliability analysis using the reliability index compared with the structural analysis using the allowable strength.
4.2. Effects of General/Pitting Corrosion
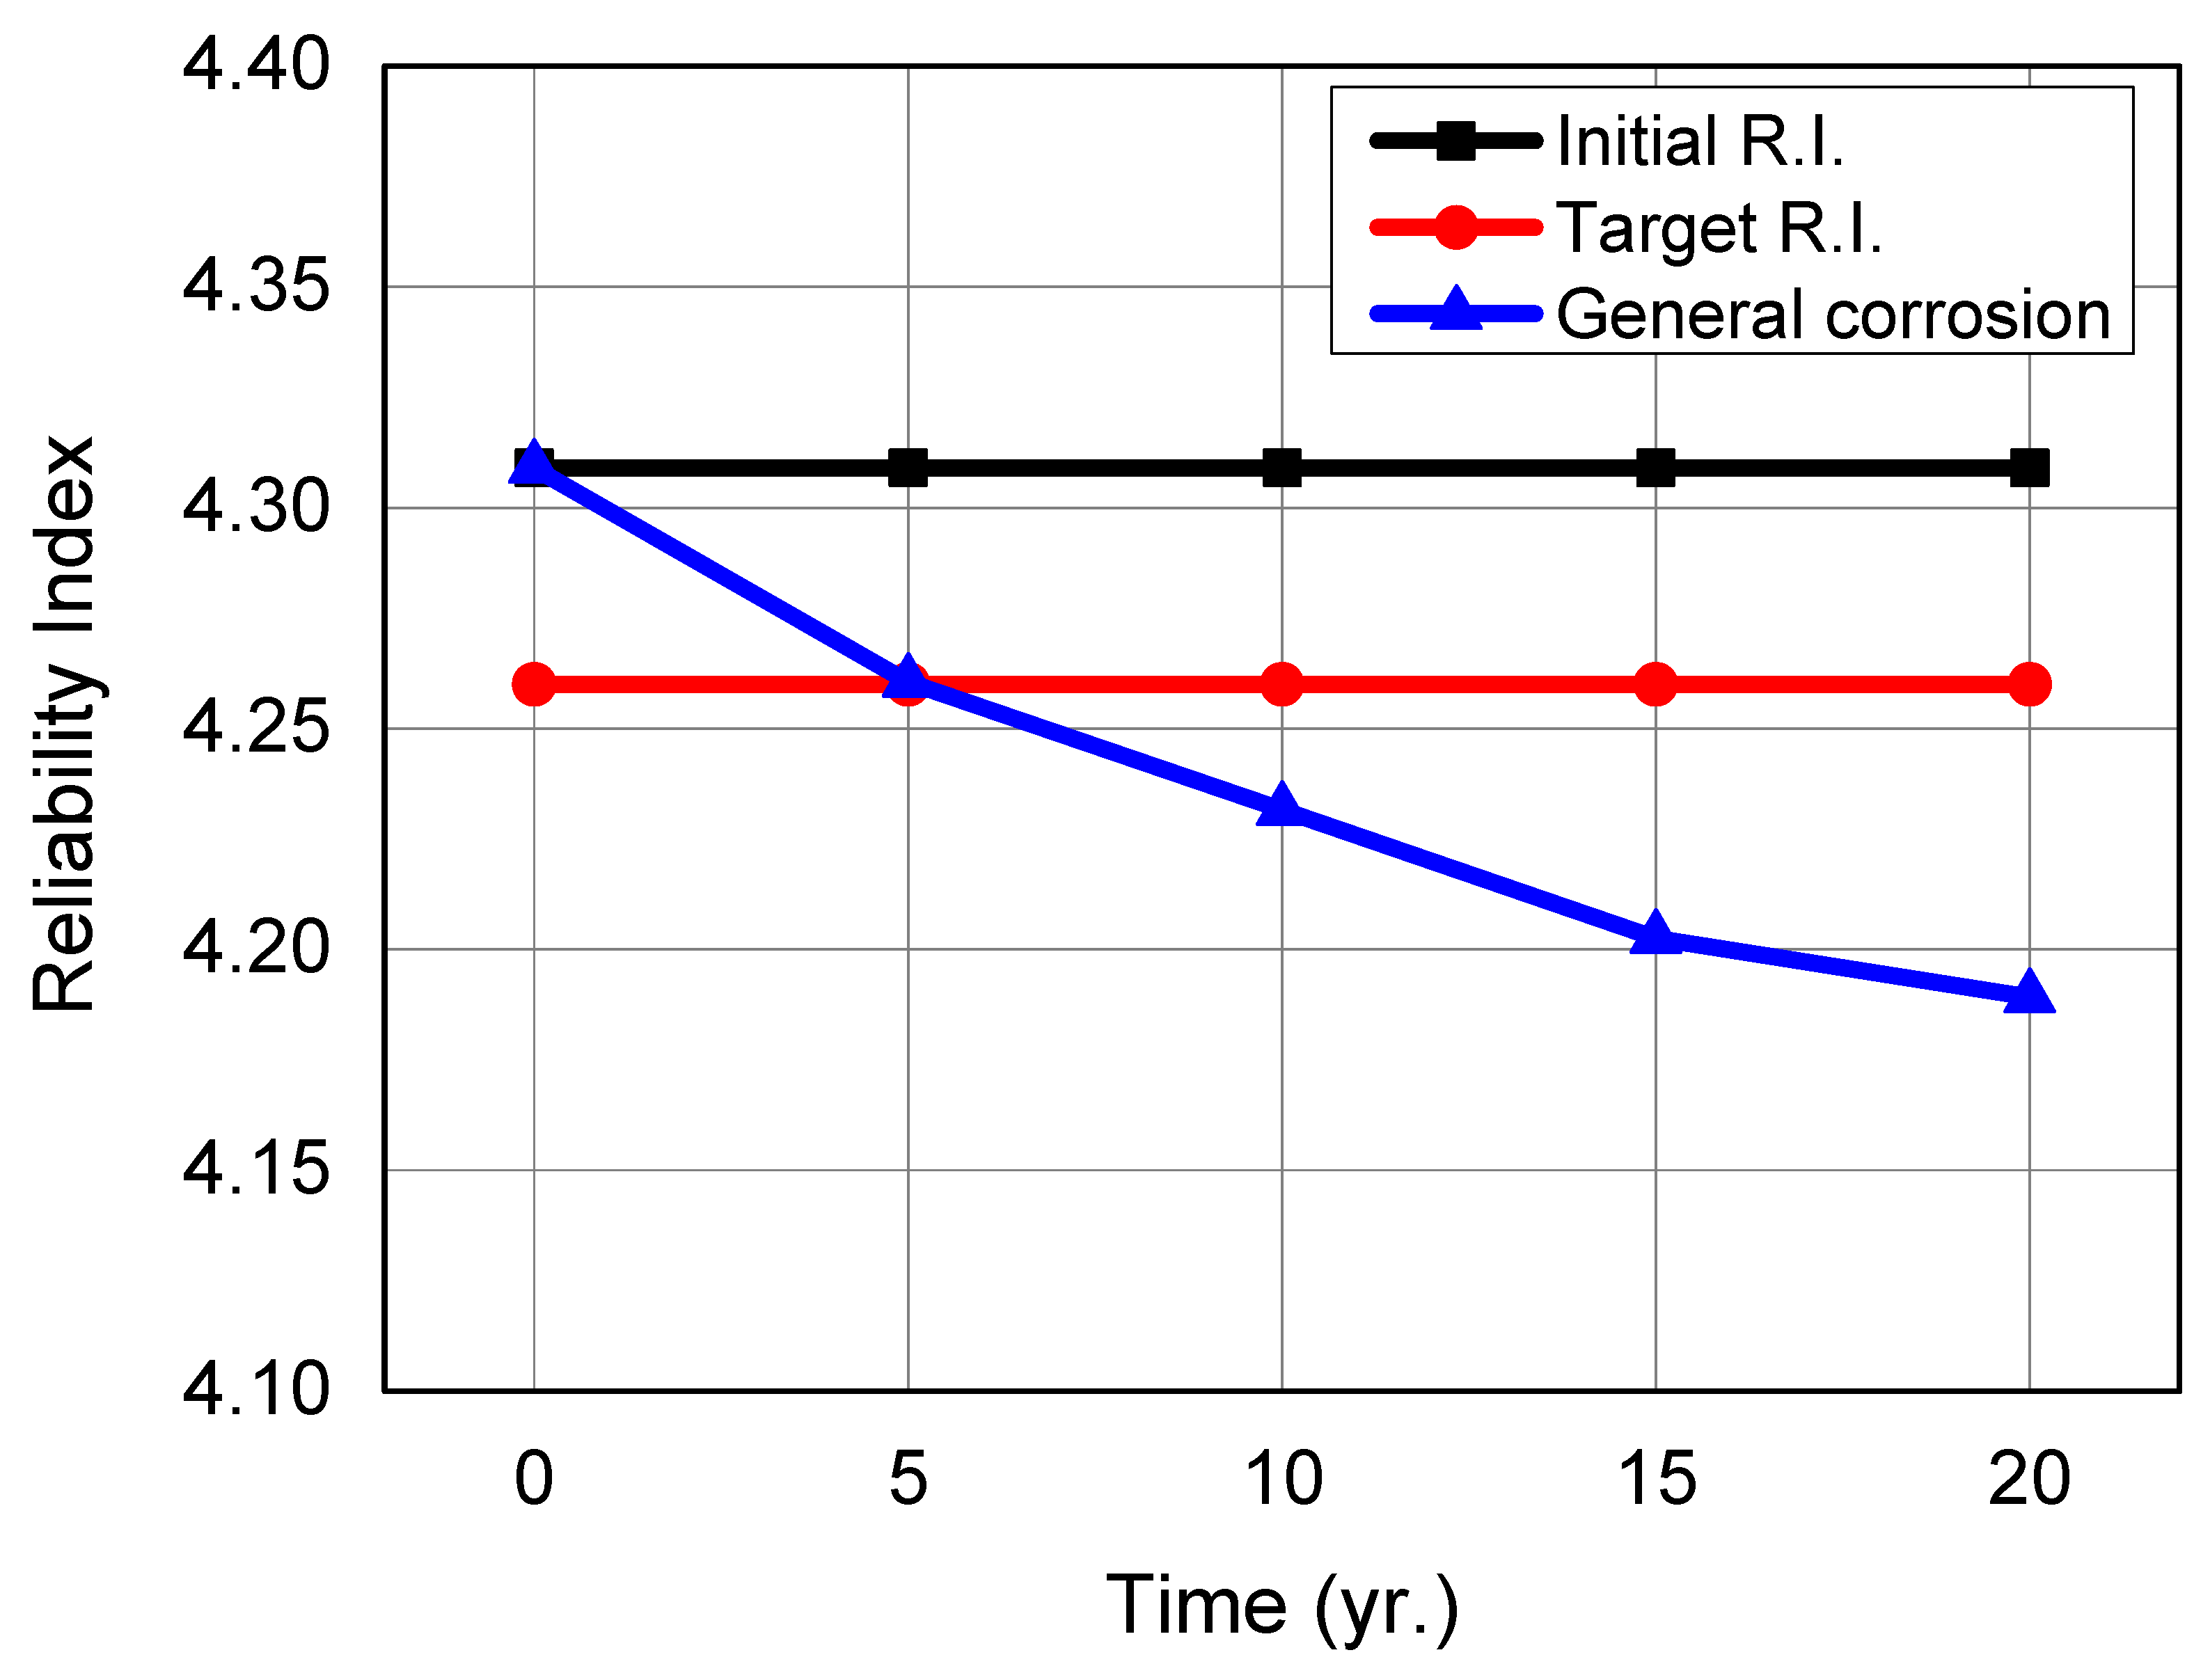
Before applying the corrosion effect, the reliability of the basic structure was as follows. The reliability index value was 4.309, and the target reliability index value was higher than 4.26. To confirm the change in the reliability index over time, an analysis was performed when general/pitting corrosion occurred on the outer shell for 5, 10, 15, and 20 y.
When general corrosion occurred on the outer shell, the resulting graph according to the change over time is as shown in Figure 7; it was confirmed that the following values representing general corrosion were applicable for 5, 10, 15, and 20 y. After 5 y, the reliability index value was 4.261, which was almost the same as the initial target reliability index. As the lifetime increased, the effect of corrosion gradually increased, and the reliability index declined to 4.189 after 20 y. The corrosion depth at 5 and 20 y was 0.41 and 1.26 mm, respectively. After 20 y., it was confirmed that a corrosion thickness of 0.8 mm or more was required to satisfy the target reliability index.
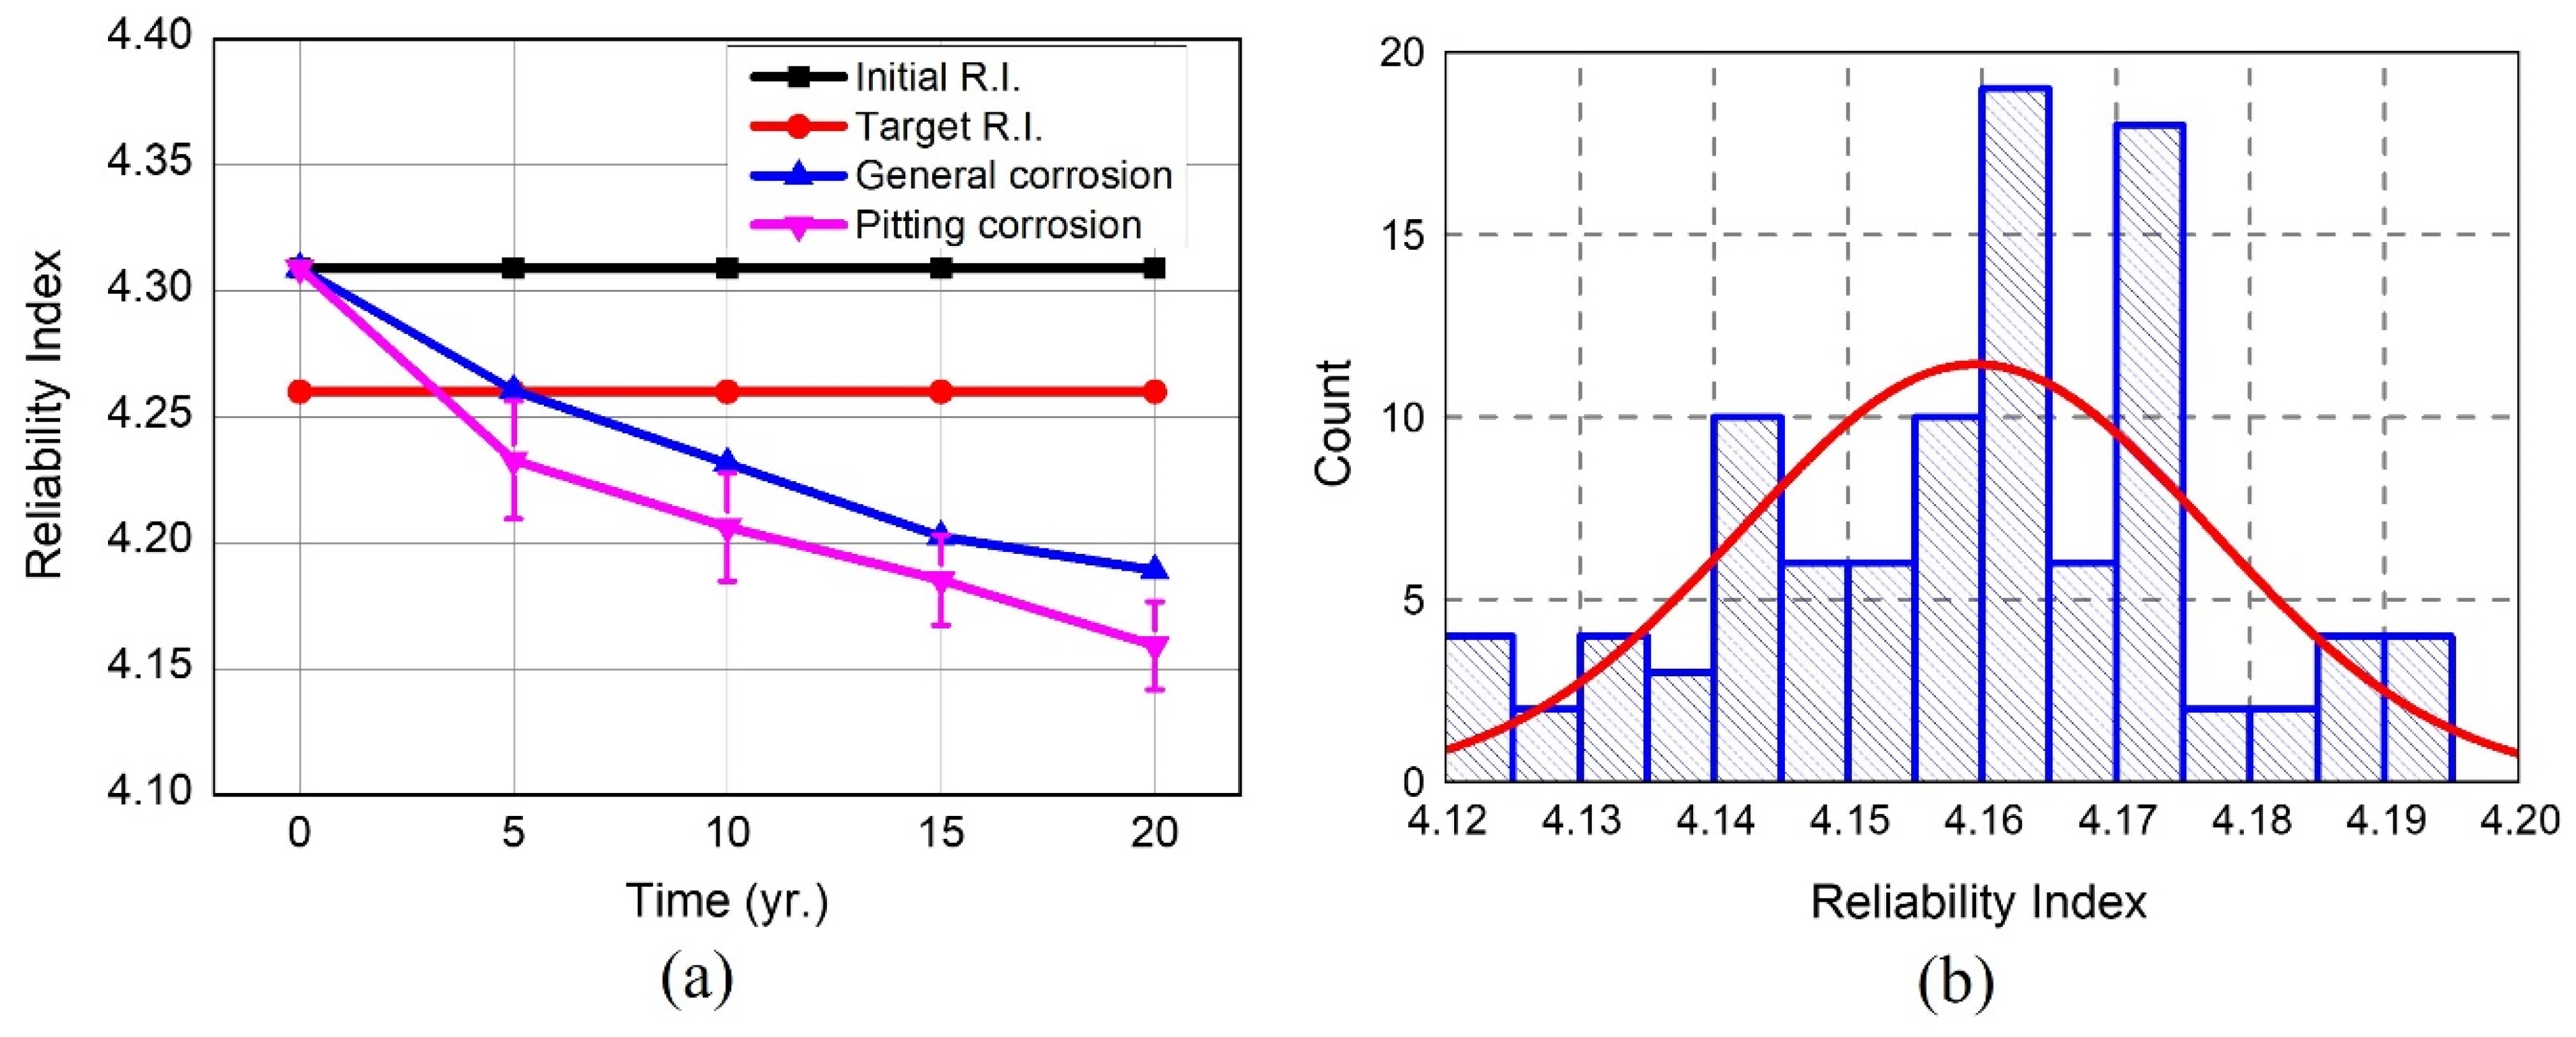
Next, the effects of pitting corrosion were compared. Pitting corrosion resembling general corrosion, which occurred on the outer shell, is depicted in Figure 8a. In pitting corrosion, because the elements of the outer shell were randomly selected according to the determined DOP, it was confirmed that the value changed each time an element was selected and analyzed. Accordingly, the uncertainty of the reliability index existed, and the tendency of the reliability index was verified through repeated executions, i.e., 100 times for each number of years of use; consequently, it was confirmed that the reliability index exhibited a normal distribution, as shown in Figure 8b. Verifying the overall trend according to the time constant, it was discovered that similar to general corrosion, the reliability index decreased with time.
The area of pitting corrosion was smaller compared with when only general corrosion was applied; however, it was confirmed that the change in reliability index was greater when pitting corrosion was applied. Because the area of pitting corrosion was randomly distributed, the reliability index exhibited a normal distribution and uncertainty occurred, unlike when general corrosion was applied. This confirmed that the stress distribution and maximum stress were greater than those in other areas when the area of pitting corrosion was large in the vicinity of the stiffener. Because the corrosion depth was modeled linearly as a corrosion model shifted to long-term corrosion, the reliability index was confirmed to decrease linearly although uncertainty existed.
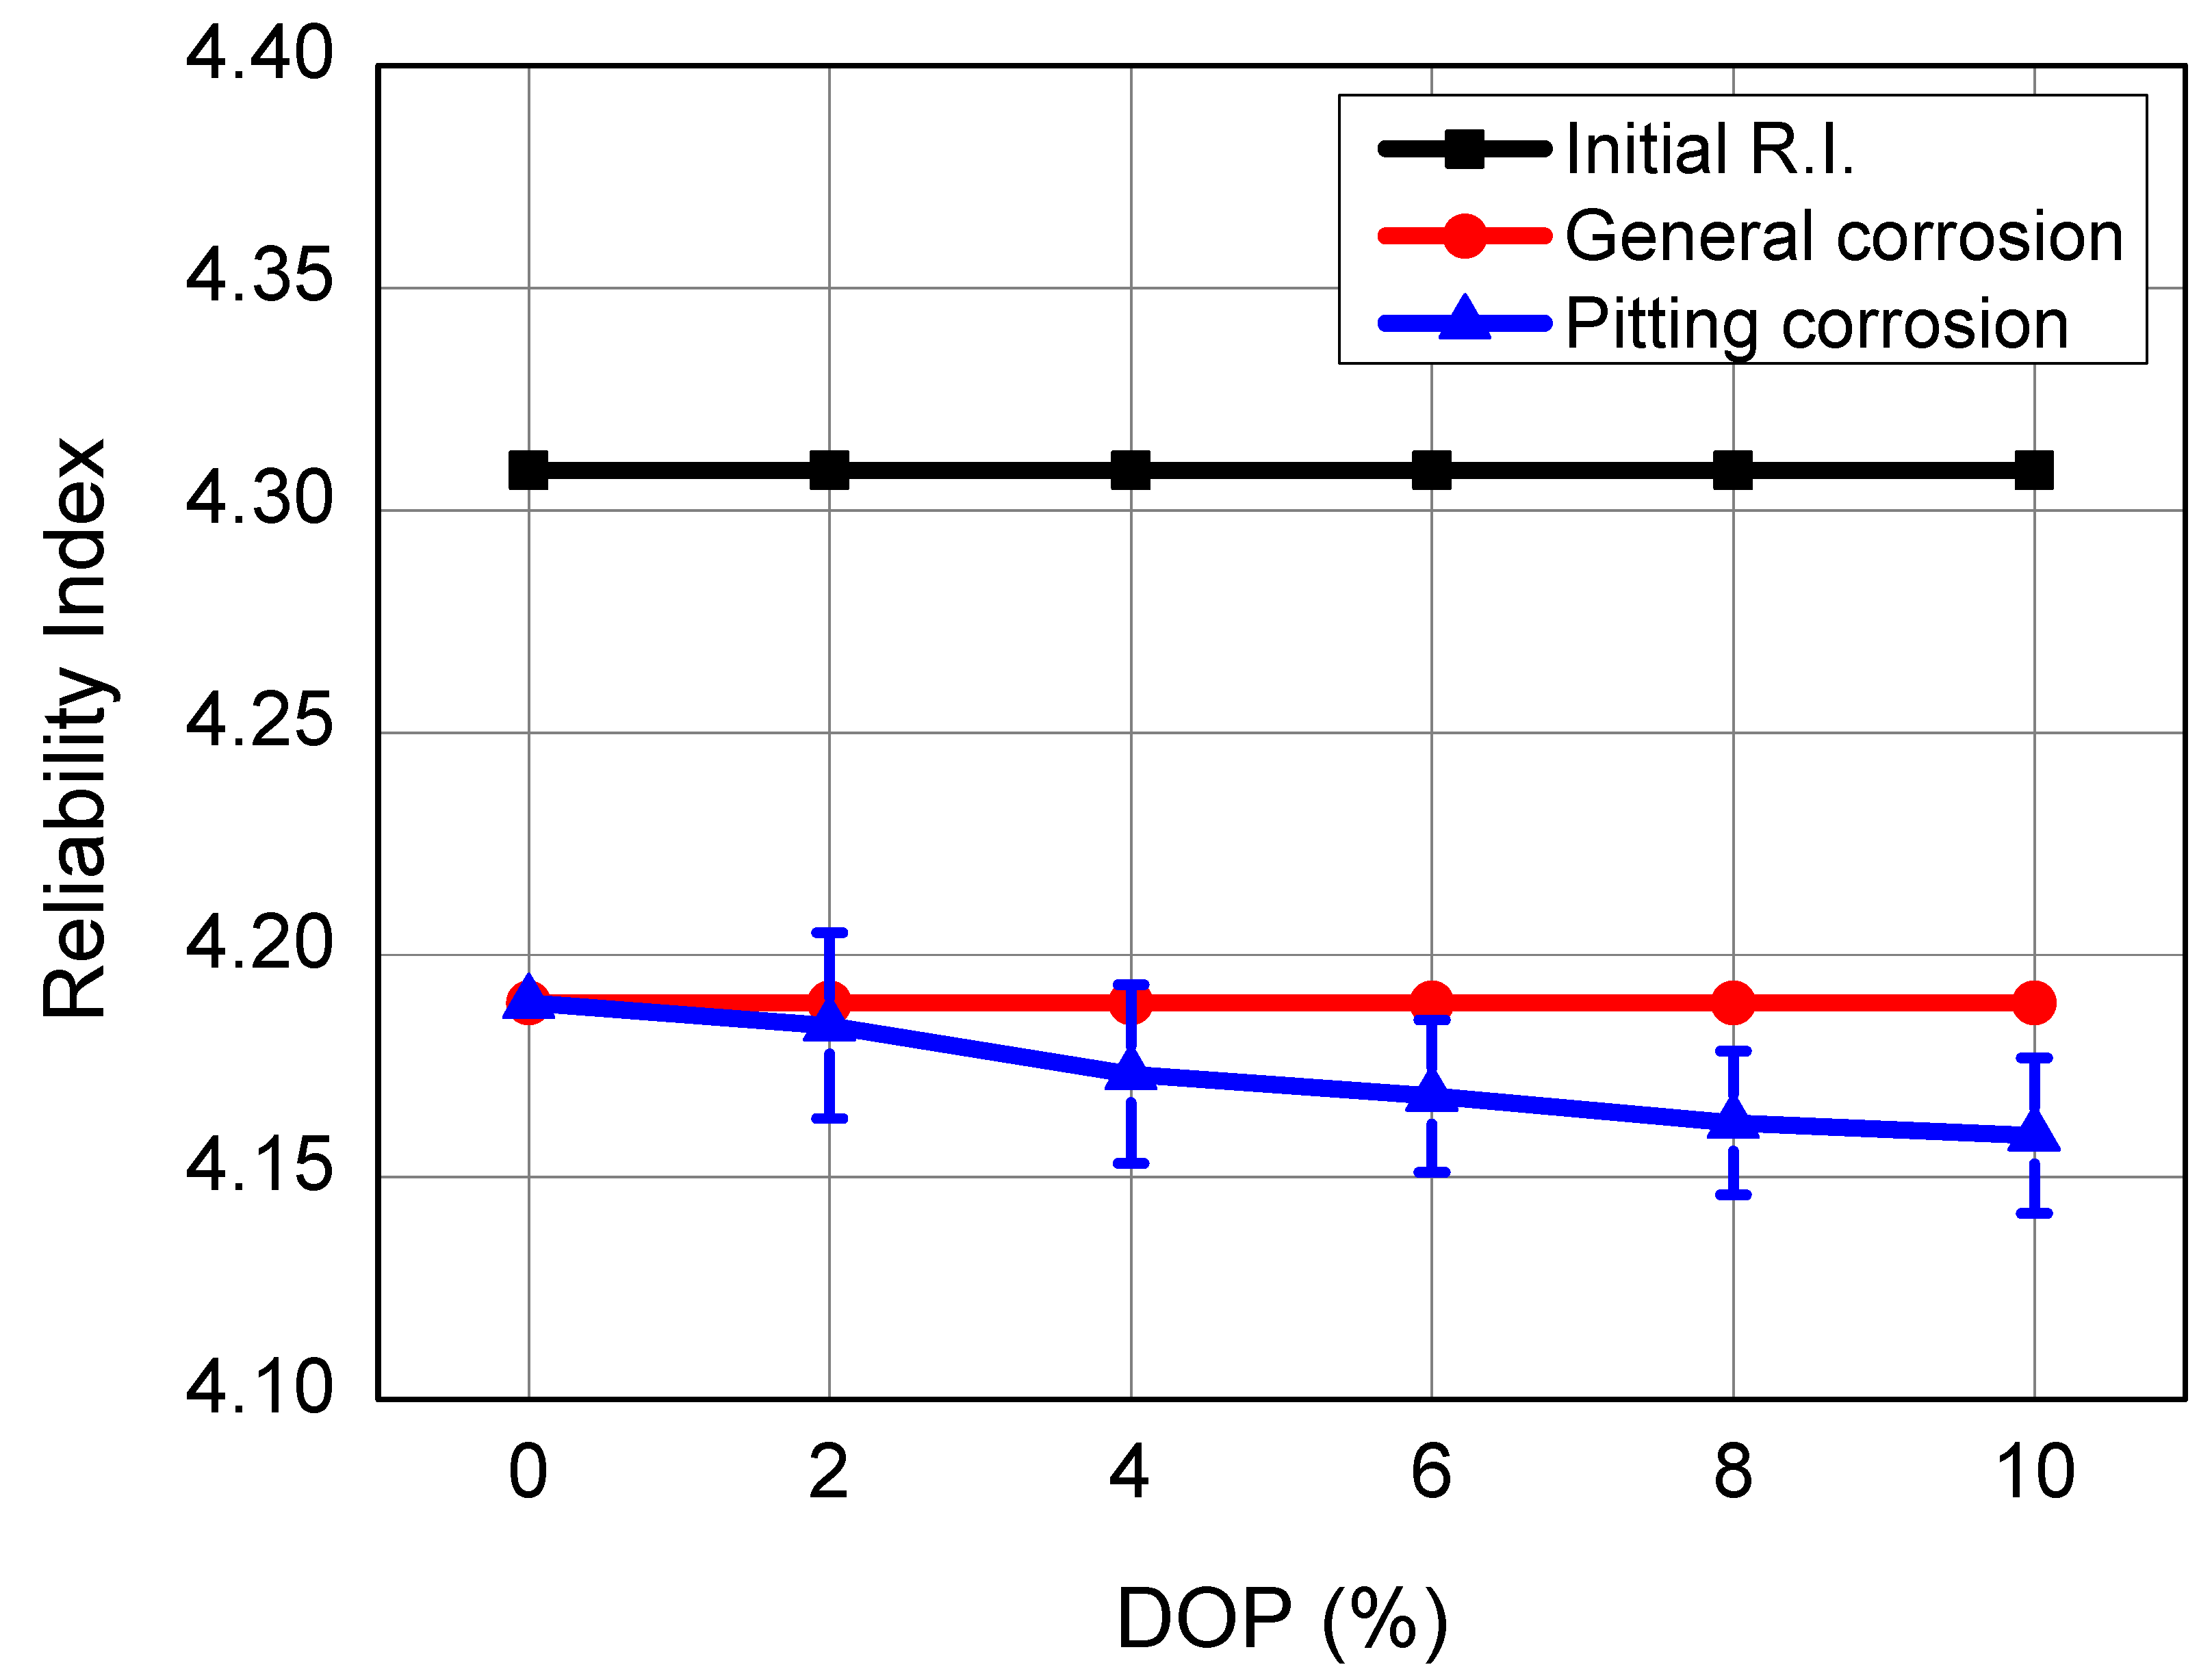
4.3. Effects of DOP
Next, we analyzed the effect of changes in the reliability index of the structure according to the change in the DOP. The DOP was changed at 2% intervals from 0 to 10%, and the reliability index changes according to the DOP are shown in Figure 9. The reliability of the initial structure and the effect of pitting corrosion owing to DOP change after 20 y were compared. Until 2% in DOP change, the reliability index change was not affected significantly. At 4% DOP change, the reliability index value when pitting corrosion was applied was within or outside the standard deviation compared with that of general corrosion, and it was within the error range. As the DOP increased by 4%, the value of the reliability index decreased as the value of the DOP increased. Hence, it was confirmed that when the DOP due to the corrosion depth occurred owing to the actual pitting corrosion, the reliability of the structure was affected.
4.4. Effects of Temperature
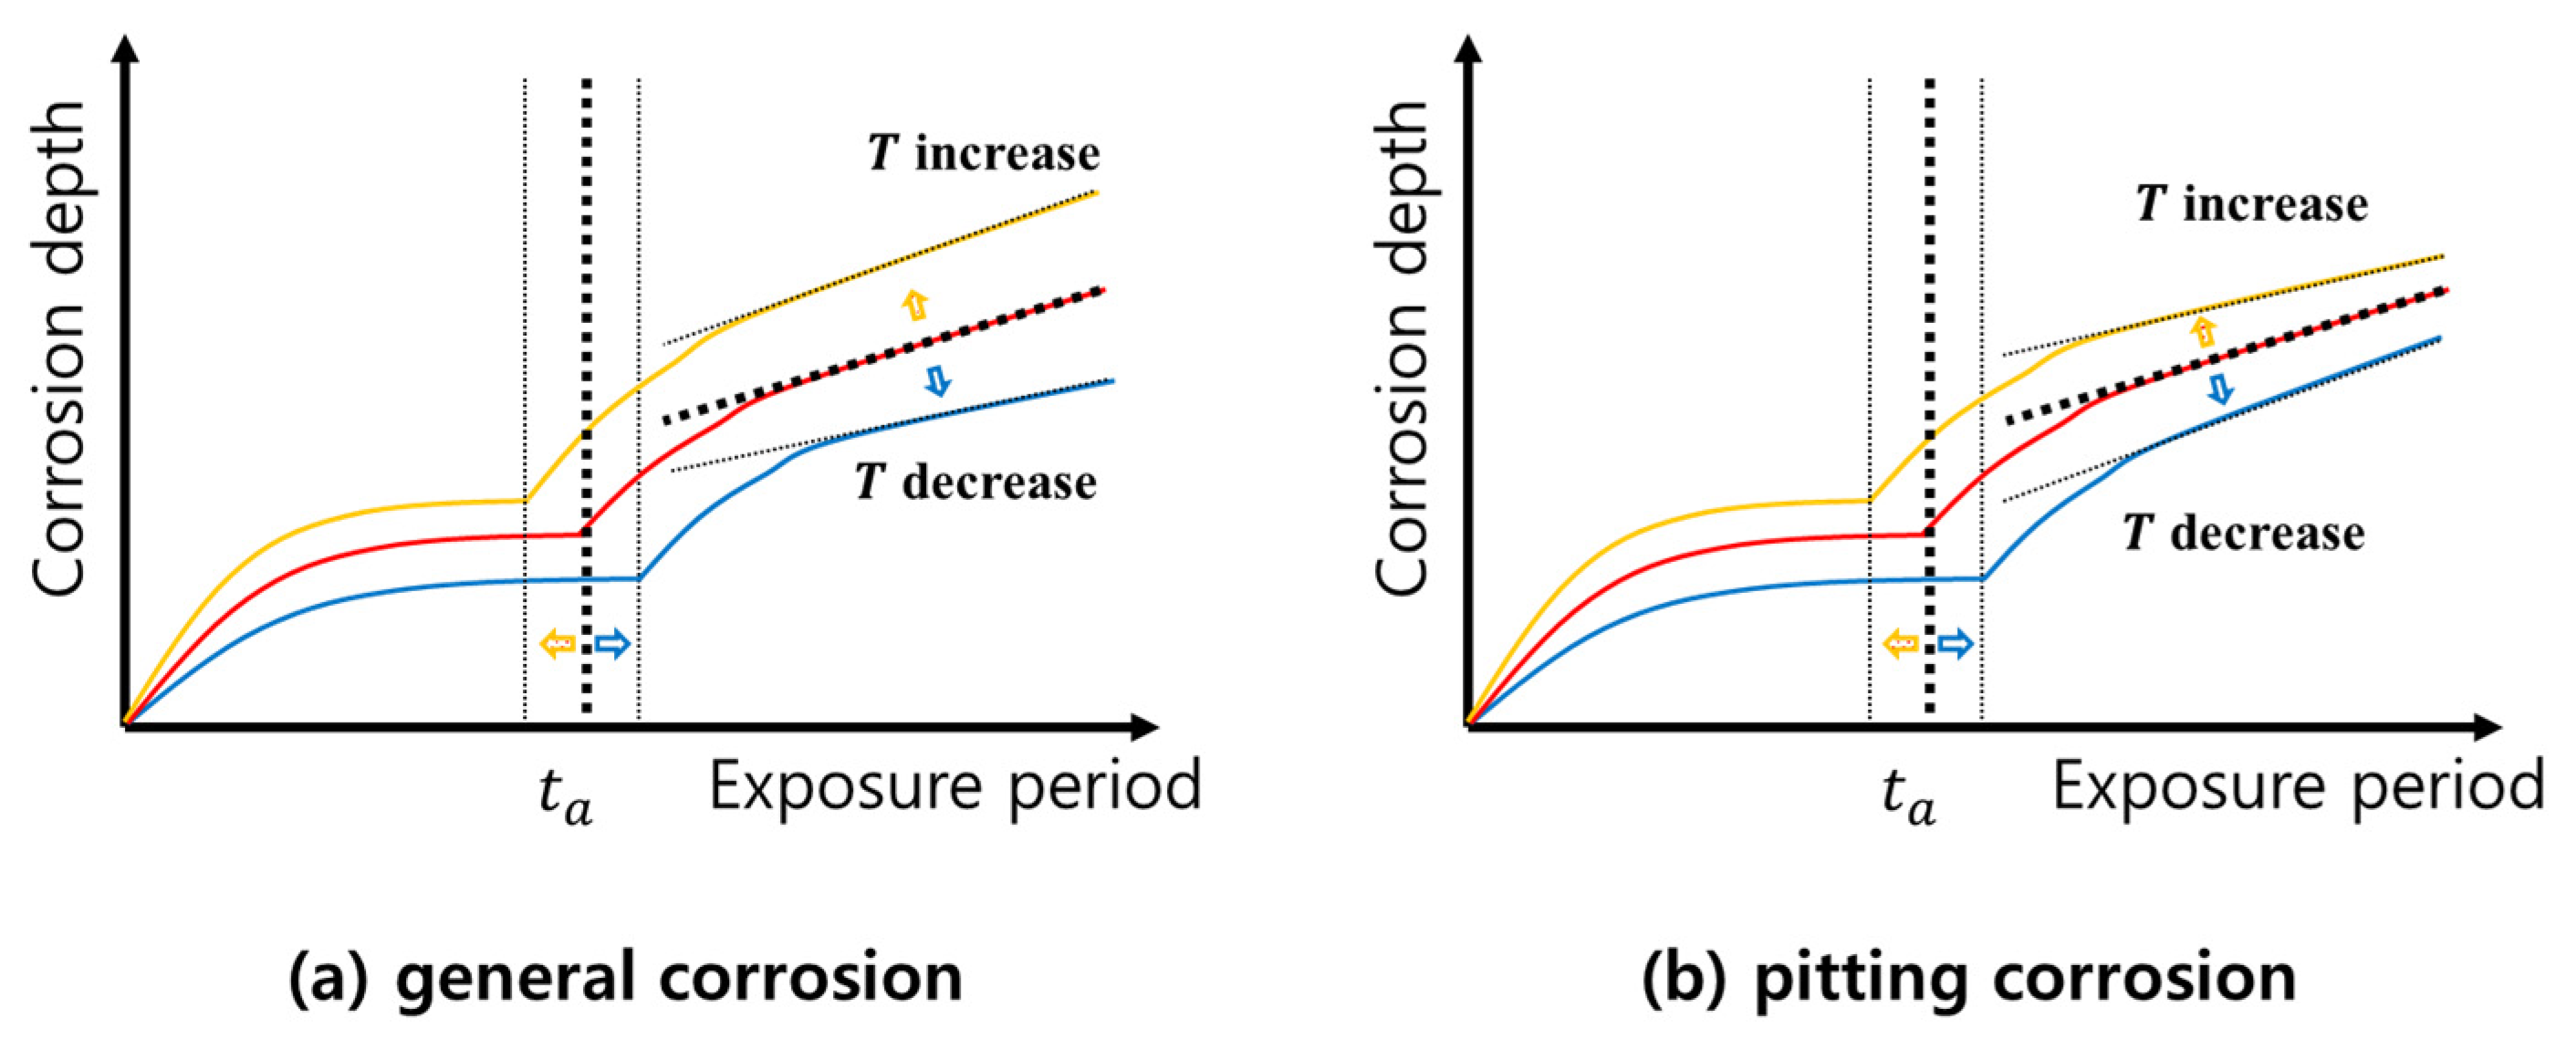
In the case of corrosion, corrosion depth changes with temperature. In this study, corrosion is reflected in the analysis using the general and pitting corrosion model of Melchers as shown in Table 1. Looking at the equations in Table 1, it can be seen that the corrosion model parameter value changes depending on the temperature . To see the effect on the temperature, we examined the change in the corrosion depth at low and high temperatures based on T = 15 °C.
According to the Melchers model, in the case of general corrosion, the higher the temperature, the deeper the corrosion depth. At 15 °C, corrosion showed a linear change in thickness in the long-term region for 5, 10, 15, and 20 y of service time to be compared. However, as the temperature increases, the corrosion graph shows that the graph moves to the left as a whole, as shown in Figure 10a. The occurrence of deeper corrosion depth could be confirmed even after a little time. On the contrary, when the temperature was lowered, the graph moved to the right, confirming that the overall corrosion depth was reduced.
That is, it was found that the corrosion depth becomes deeper when the use increases in a high temperature place, and the depth decreases when the temperature decreases. In addition, it was found that the time to enter the long-term region was delayed at a low temperature, so that it had a constant rate at 15 °C, but a change in rate occurred at a low temperature. Through analysis of this model, the general corrosion is affected by temperature, and the reliability index is also expected to be affected due to the change in the corrosion depth, resulting in a change in shell thickness that is finally applied.
Second, the effect of pitting corrosion was examined. In the case of pitting corrosion, as shown in Figure 10b, it was confirmed that the long-term corrosion development time showed the same tendency as that of general corrosion. However, after the long-term corrosion, the corrosion rate decreases when the temperature increases, compared to when it is low, and there is a possibility of reversing the final corrosion depth in some sections. It was confirmed that this reversal occurred at 15 °C based on 20 y. Through this, it can be seen that the pitting corrosion also shows a different pattern from the general corrosion when the final corrosion depth is affected by temperature.
4.5. Guideline for Design and Analysis
In Section 3 and Section 4, structural reliability analysis is conducted over time. The structure must satisfy a lifetime of 20 y or more, and for this, it is necessary to obtain a final design through changes in design variables in order to satisfy the target reliability index. As such, in order to reflect the reliability part in the design and analysis of the structure, a guideline is needed on how to reflect and analyze the reliability and how it is applied in the final design.
The methodology used in this analysis is a time-dependent structural reliability technique that reflects general and pitting corrosion. As time passes, the corrosion depth changes, and pitting corrosion is randomly generated as shown in Figure 5 and used as an analysis model. Therefore, there is uncertainty that can be expressed as a probability distribution in the reliability index. To reflect this uncertainty, the section on how to determine the confidence interval should be mentioned first.
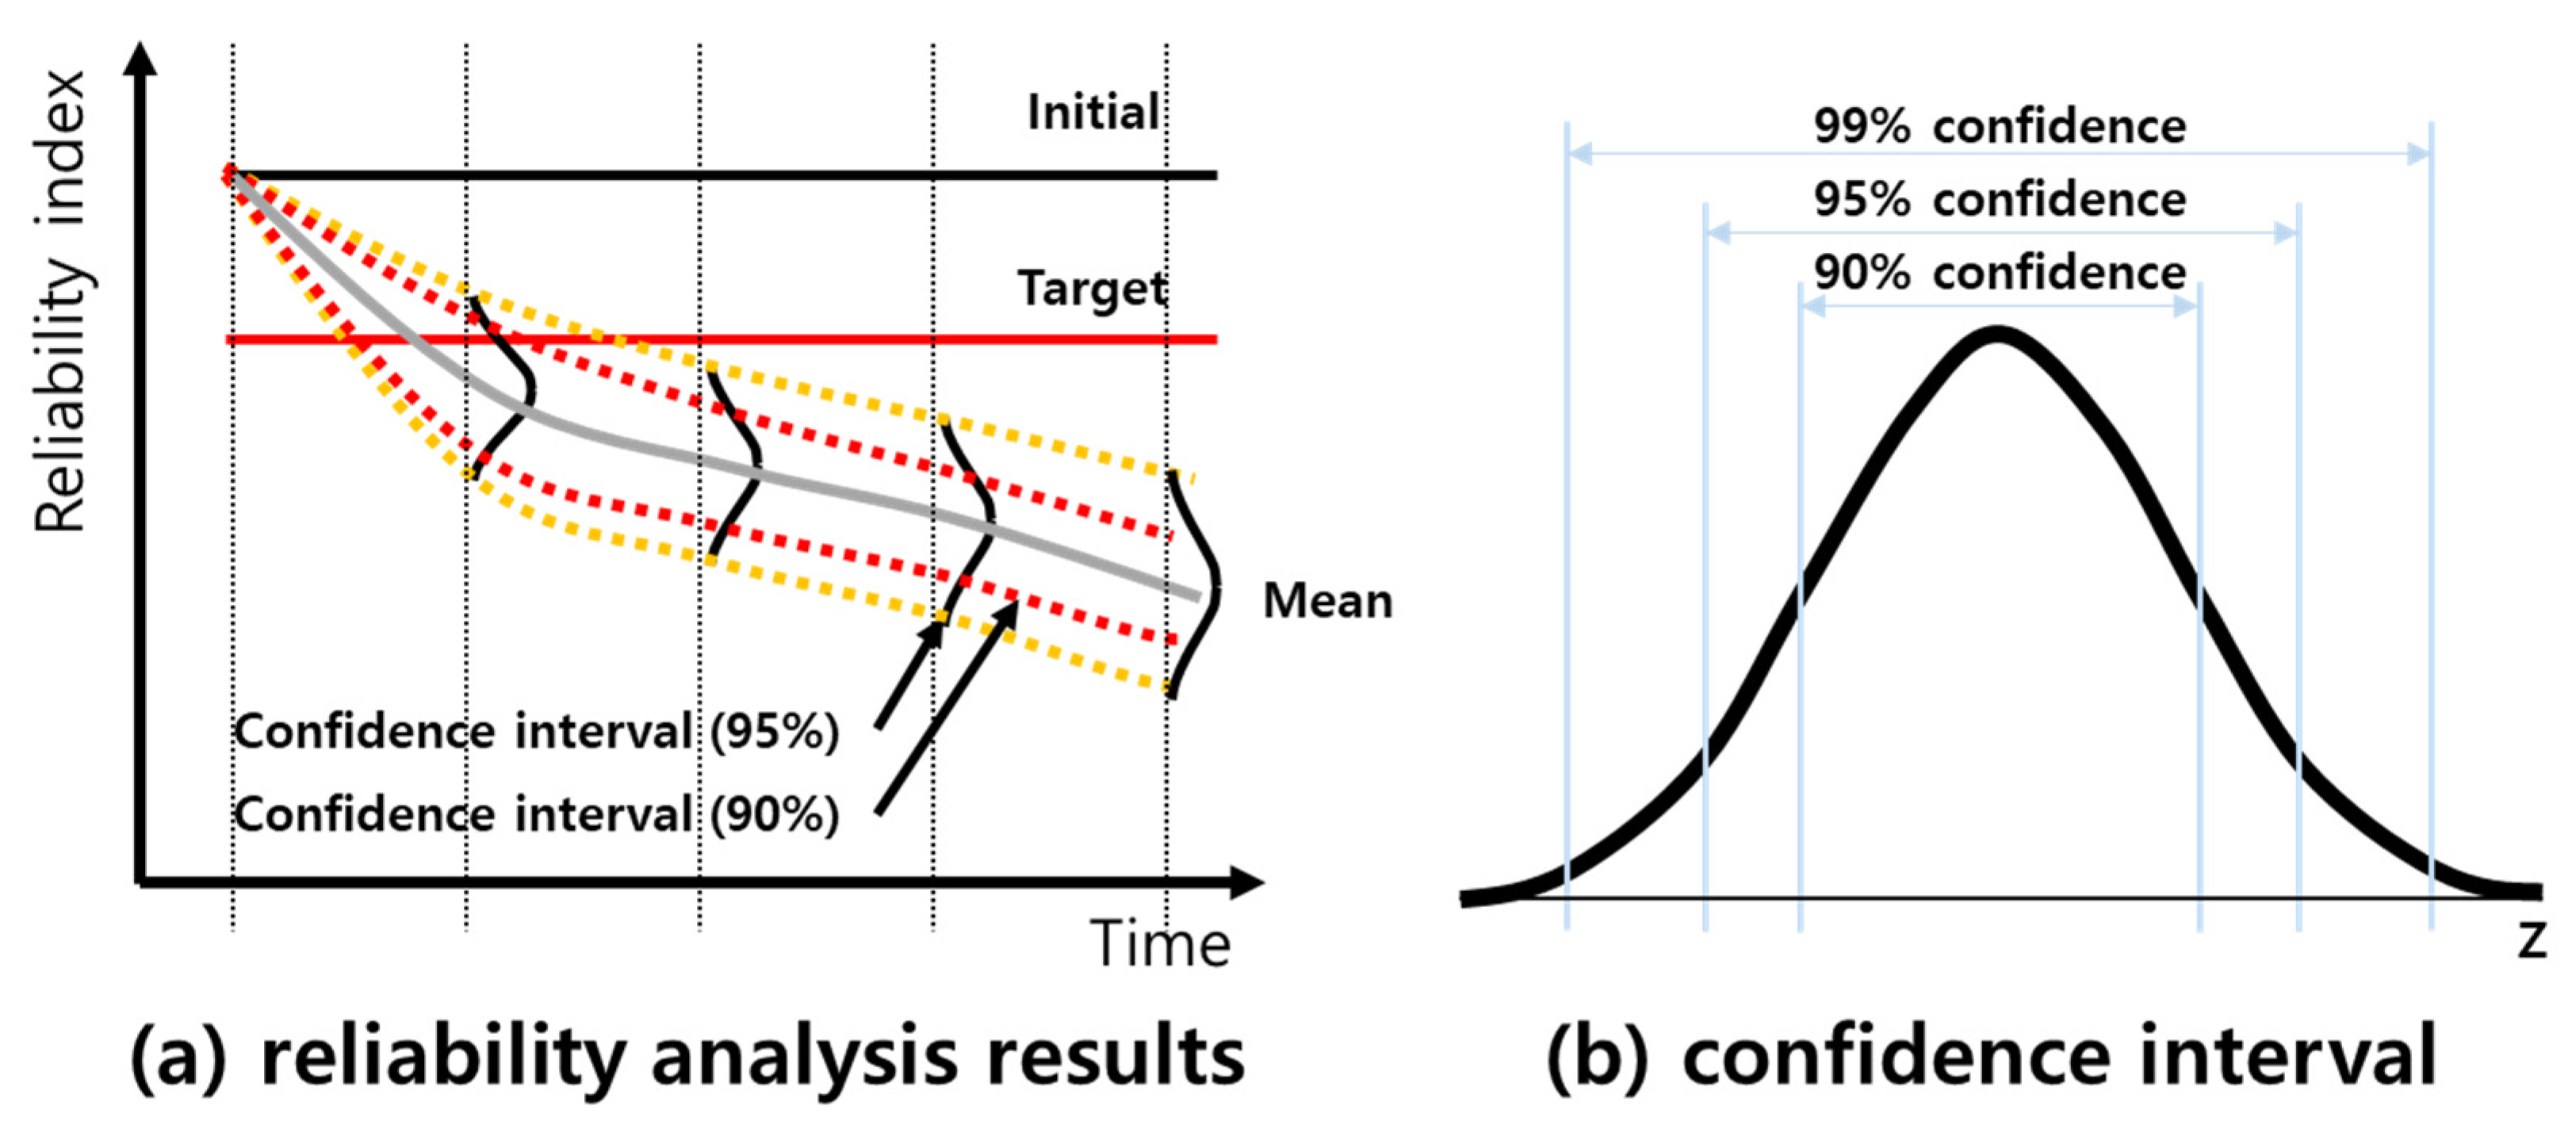
In the case of the reliability index, as shown in Figure 8b, it was found that a certain probability distribution was followed. Through this, the result graph as Figure 11a can be obtained through the mean and standard deviation values of the reliability index. In this study, due to the random seeding of pitting corrosion, it is necessary to analyze whether the reliability index has reached the target value. The concept of the confidence interval is necessary for this interpretation.
As shown in Figure 11b, the confidence interval determines how much the standard deviation from the mean has a range of values. When set to a high confidence interval, a more conservative result is obtained, and the value of the low reliability index is predicted. Accordingly, a faster inspection or a slightly thicker corrosion allowance is required. Conversely, when a low confidence interval is selected, it requires a slow inspection time and thin corrosion allowance compared to the mean value. In this way, in the reflection of the reliability index, how to finally reflect it in the design, the value of the reliability index must follow the probability distribution and the confidence interval should be set first.
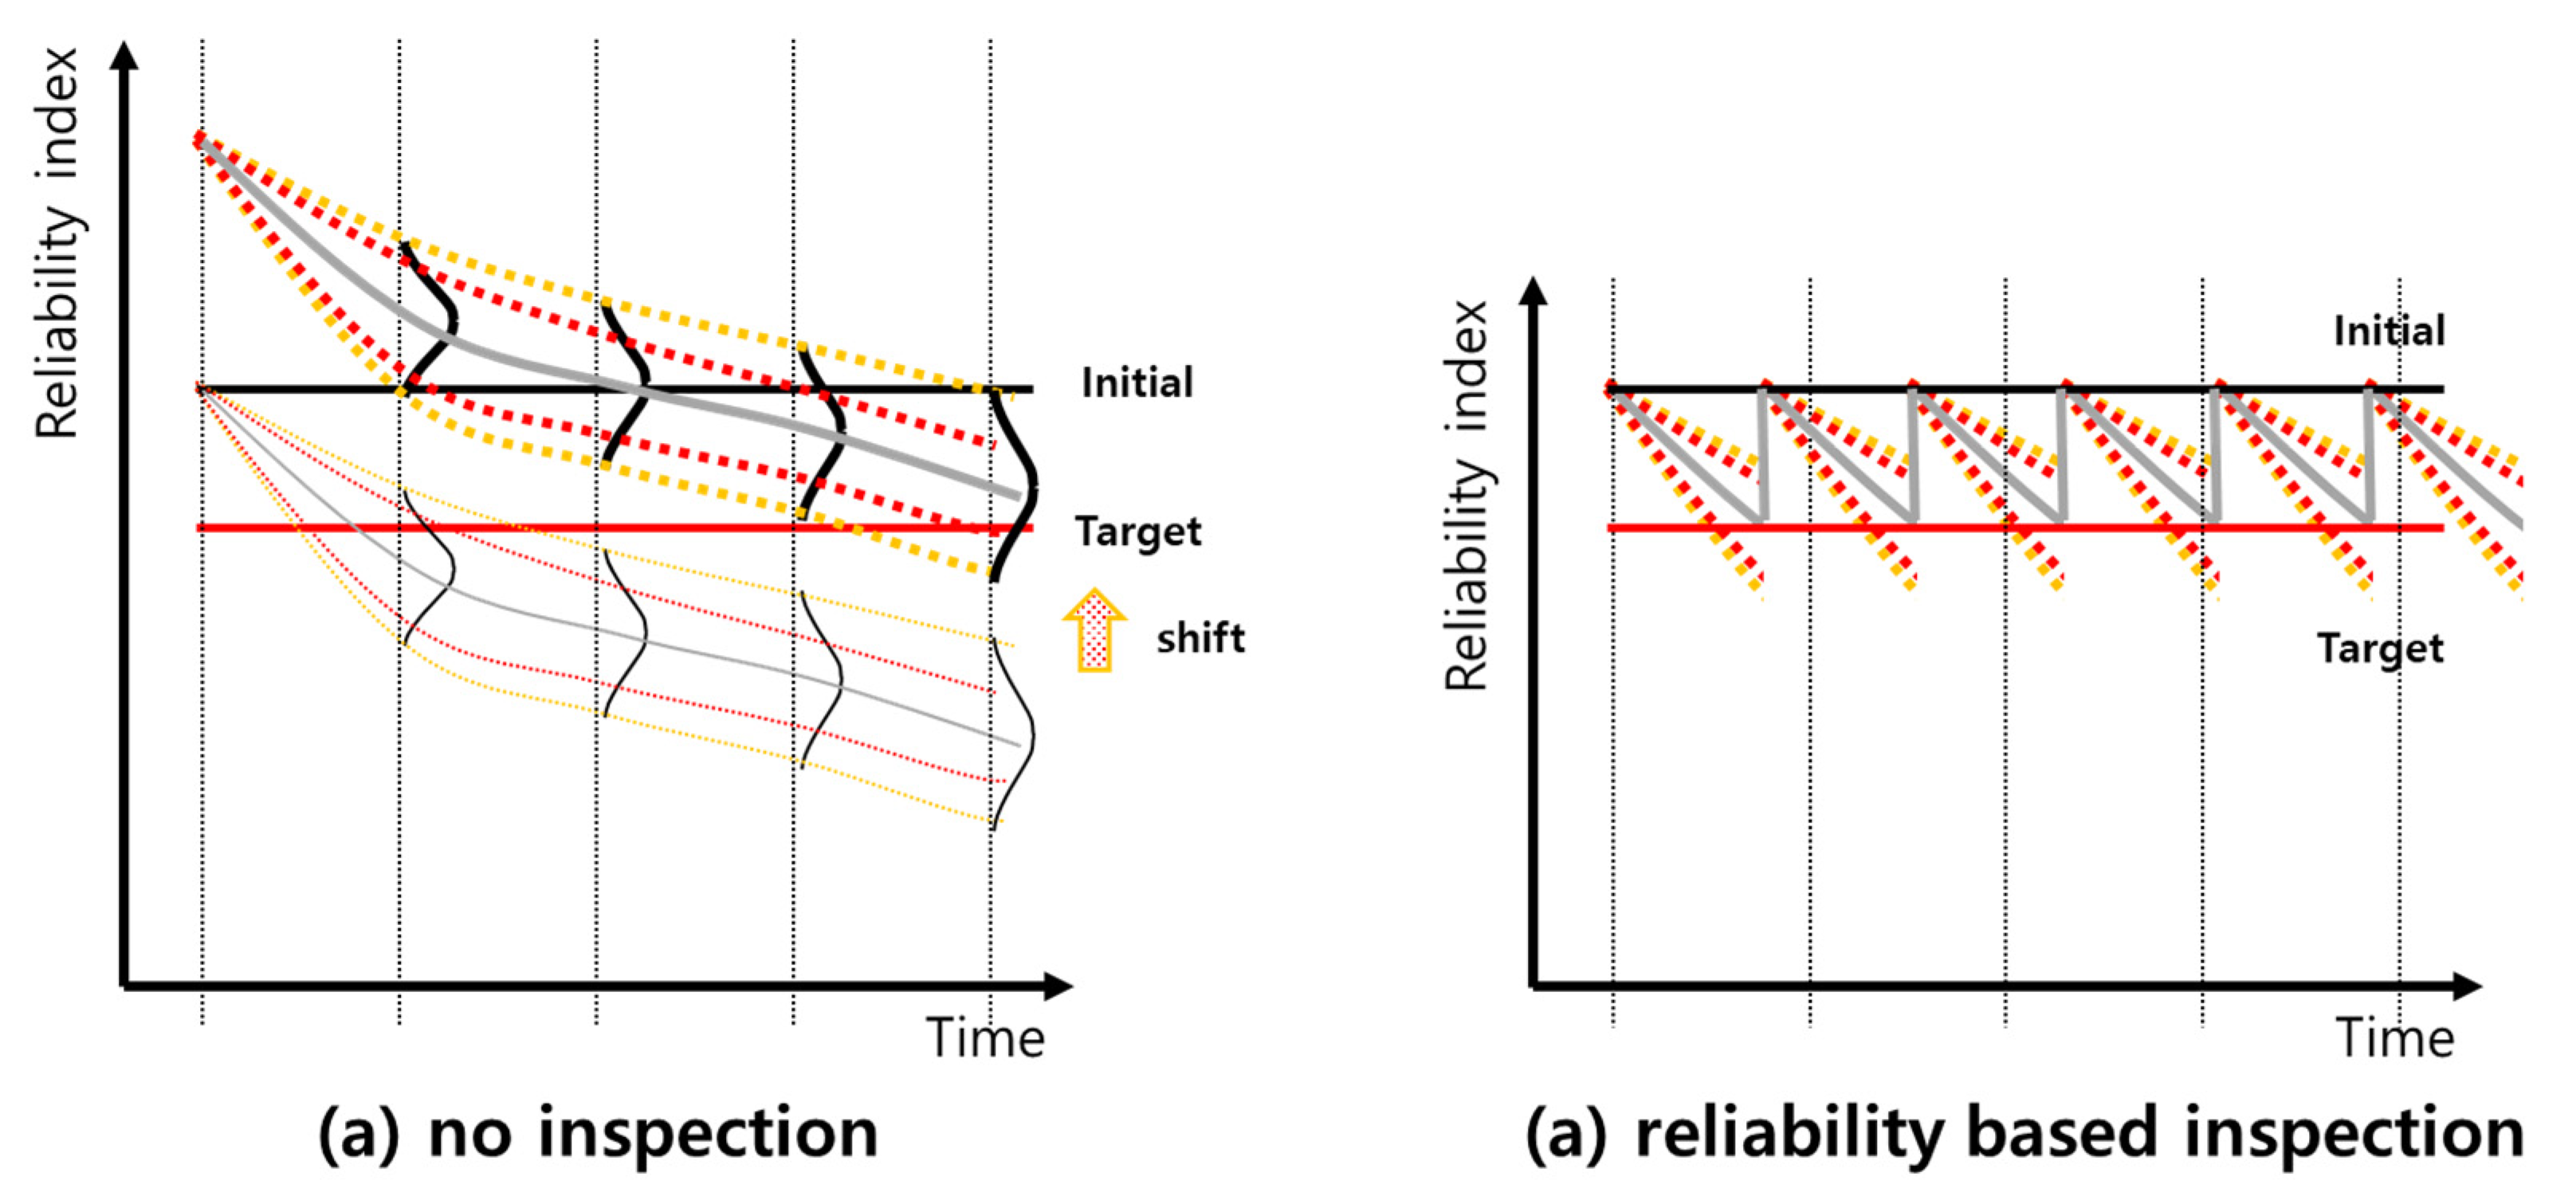
There are two strategies to reflect in the design. Depending on the presence/absence of inspection on the target system during lifetime, there is no inspection in the first place, and if corrosion allowance is given, in the second case, inspection is given.
First, when the corrosion allowance is given, a thickness margin due to corrosion is predicted in advance during a predicted lifetime by giving a certain margin to the thickness when manufacturing the target system. Reliability index is changed according to the thickness change of the target system. If the thickness loss is reflected in advance, the overall result graph will be shifted in the y-axis direction as shown in Figure 12a. In this case, because the thickness is thick, additional costs may occur due to the increased thickness, and the cost is initially high, so when considering the lifetime cost, the CAPEX part should be considered.
The second case is inspection. The reliability index is lowered due to corrosion during lifetime, and when it reaches the target reliability index limit (or setting the service limit) as shown in Figure 12b, repair is performed to increase the reliability index in the y-axis direction. In this case, it is necessary to predict the inspection time based on reliability, so that the value of the reliability index always exists above the desired reliability standard. Unlike the first case, the CAPEX can be lowered because the design can be satisfied by using a design with a small thickness. Considering OPEX and CAPEX at the same time, it should be considered as LCC.
5. Conclusions
A novel plate-stiffened prismatic pressure vessel was developed in this study; it is a pressure vessel with a rectangular cross-section and has a structure in which the internal load-bearing structure is repeated. In conventional pressure vessels, design is performed using empirical safety factors. For the novel plate-stiffened prismatic pressure vessel, a method for evaluating reliability is required because it lacked the rules for obtaining reliability or manufacturing experience. In this study, the structural reliability of the plate-stiffened prismatic pressure vessel over time was investigated. The structural reliability of the time-stiffened plate prismatic pressure vessel was investigated, in which the RSM based on the time-dependent structural reliability method was utilized.
When corrosion occurred on the outer shell of the plate-stiffened prismatic pressure vessel, which was the target structure, and the corrosion depth increased over time, the thickness of the outer shell changed. The repeated structure was modeled as a strip, and structural reliability analysis was performed to identify the changes in the reliability index when general corrosion and pitting corrosion occurred in the outer shell. Structural reliability analysis was conducted using a total ten of random variables, and a performance function of a plate-stiffened prismatic pressure vessel was fabricated using the RSM.
A random distribution was imposed on the pitting corrosion on the outer shell, and the reliability index according to the change in the DOP and time was analyzed. Since the locations where pitting corrosion occurs are randomly distributed, each performance function was obtained through 100 repetitive trials, and the uncertainty was confirmed by obtaining the distribution of the reliability index.
First, we examined how the reliability index of the initial structure changes over time when only general corrosion acts. The change over time in 5, 10, 15, and 20 y was examined. As the time changed, the thickness of the outer shell changed, and the reliability index decreased almost linearly. When only general corrosion acted, it was confirmed that the target reliability index, which is the standard even after 5 y, was satisfied.
Second, when only general corrosion acted and pitting corrosion acted as general corrosion, comparative analysis was performed. Pitting corrosion had a random distribution, and it was compared with the case where only general corrosion acts using the average and standard deviation. As a result, it was confirmed that the average of the reliability index has a smaller value when pitting corrosion acts simultaneously than when only general corrosion acts as a whole. In particular, when pitting corrosion occurred, the reliability index changed according to the occurrence location and exhibited a normal distribution. However, because corrosion occurred partially in the region of approximately 10%, the reliability index did not differ significantly even when the corrosion depth differed by approximately four times.
Finally, the effect of pitting corrosion according to the change of DOP was analyzed by changing the DOP at 0–10%, 2% intervals. As a result, until there was 2% DOP, there was little difference compared to the case where only general corrosion acted, and it was confirmed that there was an effect of DOP from when more than 4% DOP occurred. When the pitting corrosion was applied for 20 y, no dramatic difference was seen. However, when the reliability was set at 98%, the minimum reliability index was very low, so it was confirmed that pitting corrosion should be considered very important.
In this study, a method for structural reliability analysis according to the change of time applying general and pitting corrosion was proposed, and it is confirmed that the proposed method is applicable to novel structure plate-stiffened prismatic pressure vessels. Furthermore, through the analysis of the effect of each corrosion action, change of time, and DOP, variables that may affect the reliability index were identified. Based on this study, it was judged that time-dependent structural reliability analysis could be applied to novel structures.
Author Contributions
Conceptualization, Y.C.; methodology, Y.C.; software, Y.C.; validation, Y.C. and J.A.; formal analysis, Y.C. and J.A.; investigation, Y.C. and J.A.; resources, Y.C.; data curation, Y.C.; writing—original draft preparation, Y.C.; writing—review and editing, Y.C. and J.A.; visualization, Y.C.; supervision, Y.C. and D.C.; project administration, D.C.; funding acquisition, D.C. All authors have read and agreed to the published version of the manuscript.
Funding
This research was funded by BK21 Plus Program.
Institutional Review Board Statement
Not applicable.
Informed Consent Statement
Not applicable.
Data Availability Statement
Not applicable.
Conflicts of Interest
The authors declare no conflict of interest.
Nomenclature
| Probability of failure | |
| Values of the standard normal distribution | |
| Reliability | |
| Resistance function, ( = random variables, = time) | |
| Strength function, ( = random variables, = time) | |
| Limit state function, ( = random variables, = time) | |
| Response surface function, ( = random variables, = time) | |
| Coefficient vector of response surface | |
| Coefficients of response surface (i = 0, 1 … n, 11 … nn) | |
| Coefficient matrix of design variables | |
| Mean of design variables | |
| Standard deviation of variables | |
| Standard cumulative normal distribution function | |
| Reliability index | |
| Corrosion thickness | |
| Number of iterations | |
| Barg | Unit of gauge pressure |
| Position ratio of the point away from the mean | |
| Number of random variables | |
| Model parameter 1 for general and pitting corrosion | |
| Model parameter 2 for general and pitting corrosion | |
| Model parameter 3 for general and pitting corrosion | |
| Model parameter 4 for general and pitting corrosion | |
| Model parameter 5 for general and pitting corrosion | |
| Model parameter 6 for general and pitting corrosion | |
| Model parameter 7 for general and pitting corrosion | |
| Model parameter 8 for general and pitting corrosion | |
| Length of the plate-stiffened prismatic pressure vessel | |
| Breadth of the plate-stiffened prismatic pressure vessel | |
| Height of the plate-stiffened prismatic pressure vessel | |
| Temperature | |
| Vertical plate thickness | |
| Parallel plate thickness | |
| ab-stiffener thickness | |
| bc-stiffener thickness | |
| ac-stiffener thickness | |
| Shell thickness (general corrosion) | |
| Shell thickness (pitting corrosion) | |
| Internal pressure | |
| Young’s modulus of material | |
| Allowable stress of material | |
| Poisson’s ratio of material | |
| DOP | Degree of pit |
| FORM | First order reliability method |
| SORM | Second order reliability method |
| MCS | Monte Carlo simulation |
| RSM | Response surface method |
| FPSO | Floating production storage and offloading |
| API | American Petroleum Institute |
| FEM | Finite element method |
| LNG | Liquefied natural gas |
| LCC | Life cycle cost |
| CAPEX | CAPital EXpenditures |
| OPEX | OPerating EXpenditures |
References
- Ditlevsen, O.; Madsen, H.O. Structural Reliability Method; Wiley: Hoboken, NJ, USA, 1996. [Google Scholar]
- DNV. Structural Reliability Analysis of Marine Structures Classification Notes 30.6; Det Norske Veritas: Bærum, Norway, 1992. [Google Scholar]
- Hasofer, A.M.; Lind, L.C. Exact and invariant second moment code format. J. Eng. Mech. Div. 1974, 100, 111–121. [Google Scholar] [CrossRef]
- Fiessler, B.; Neumann, H.-J.; Rackwitz, R. Quadratic Limit States in Structural Reliability. J. Eng. Mech. Div. 1979, 105, 661–676. [Google Scholar] [CrossRef]
- Joung, T.H.; Lee, J.H.; Nho, I.S.; Kim, B.J.; Han, S.H.; Park, S.H.; Lee, C.M.; Lee, P.M.; Sammut, K.; He, F. A study on the design and manufacturing of a deep-sea unmanned underwater vehicle based on structural reliability analysis. Ships Offshore Struct. 2009, 4, 19–29. [Google Scholar] [CrossRef]
- Elsayed, T.; El-Shaib, M.; Gbr, K. Reliability of fixed offshore jacket platform against earthquake collapse. Ships Offshore Struct. 2016, 11, 167–181. [Google Scholar] [CrossRef]
- Wei, K.; Arwade, S.R.; Myers, A.T.; Valamanesh, V. Directional effects on the reliability of non-axisymmetric support structures for offshore wind turbines under extreme wind and wave loadings. Eng. Struct. 2016, 106, 68–79. [Google Scholar] [CrossRef] [Green Version]
- Morató, A.; Sriramula, S.; Walls, L.; Revie, M.; Bedford, T. Reliability analysis of offshore wind turbine support structures using Kriging models. In Proceedings of the Risk, Reliability and Safety: Innovating Theory and Practice, Glasgow, Scotland, 25–29 September 2016; pp. 1425–1431. [Google Scholar]
- Montes-Iturrizaga, R.; Heredia-Zavoni, E. Reliability analysis of mooring lines using copulas to model statistical dependence of environmental variables. Appl. Ocean Res. 2016, 59, 564–576. [Google Scholar] [CrossRef]
- Joung, T.H.; Kim, Y.Y.; Kim, B.J.; Park, B.J.; Jung, H.W.; Jung, D.H.; Sung, H.G. Reliability analysis of a load-out support frame in offshore installations. Ships Offshore Struct. 2017, 12, S200–S208. [Google Scholar] [CrossRef]
- Liu, Y.; Frangopol, D.M. Time-dependent reliability assessment of ship structures under progressive and shock deteriorations. Reliab. Eng. Syst. Saf. 2018, 173, 116–128. [Google Scholar] [CrossRef]
- Dong, Y.; Frangopol, D. Risk-informed life-cycle optimum inspection and maintenance of ship structures considering corrosion and fatigue. Ocean. Eng. 2015, 101, 161–171. [Google Scholar] [CrossRef]
- Paik, J.K.; Wang, G.; Thayamballi, A.K.; Lee, J.M.; Park, Y.I. Time-dependent risk assessment of aging ships accounting for general/pit corrosion, fatigue cracking and local denting damage. Trans. Soc. Nav. Archit. Mar. Eng. 2003, 111, 159–197. [Google Scholar]
- Melchers, R.E. Structural Reliability Analysis and Prediction; Wiley: Hoboken, NJ, USA, 1999. [Google Scholar]
- Guedes Soares, C.; Garbatov, Y. Reliability of maintained ship hulls subjected to corrosion and fatigue under combined loading. J. Constr. Steel Res. 1999, 52, 93–115. [Google Scholar] [CrossRef]
- Sun, H.-H.; Bai, Y. Time-variant reliability assessment of FPSO hull girders. Mar. Struct. 2003, 16, 219–253. [Google Scholar] [CrossRef]
- Bai, Y.; Yan, H.-B.; Cao, Y.; Kim, Y.; Yang, Y.-Y.; Jiang, H. Time-dependent reliability assessment of offshore jacket platforms. Ships Offshore Struct. 2016, 11, 591–602. [Google Scholar] [CrossRef]
- Hou, X.; Wang, Y.; Zhang, P.; Qin, G. Non-Probabilistic Time-Varying Reliability-Based Analysis of Corroded Pipelines Considering the Interaction of Multiple Uncertainty Variables. Energies 2019, 12, 1965. [Google Scholar] [CrossRef] [Green Version]
- Melchers, R.; Jiang, X. Estimation of models for durability of epoxy coatings in water ballast tanks. J. Ships Offshore Struct. 2006, 1, 61–70. [Google Scholar] [CrossRef]
- Emi, H.; Kumano, A.; Baba, N.; Tamamoto, N.; Nakamura, Y.; Shihara, H. A study on life assessment of ships and offshore structures (Part 1: Basic study). J. Soc. Nav. Archit. Jpn. 1991, 169, 443–454. [Google Scholar] [CrossRef]
- Emi, H.; Yuasa, M.; Kumano, A.; Kumamoto, N.; Yamamoto, N.; Matsunaga, M. A study on life assessment of ships and offshore structures (2nd report: Risk assessment of fatigue failures of hull structures). J. Soc. Nav. Archit. Jpn. 1992, 172, 627–635. [Google Scholar] [CrossRef]
- Emi, H.; Yuasa, M.; Kumano, A.; Arima, T.; Yamamoto, N.; Umino, M. A study on life assessment of ships and offshore structures (3rd report: Corrosion control and condition evaluation for a long life service of the ship). J. Soc. Nav. Archit. Jpn. 1993, 174, 734–744. [Google Scholar]
- Melchers, R. Development of new applied models for steel corrosion in marine applications including shipping. Ships Offshore Struct. 2008, 3, 135–144. [Google Scholar] [CrossRef]
- Choi, Y.; Ahn, J. Structural Reliability of Fluid Storage Tank based on Probabilistic Analysis. J. Korea Air Force Acad. 2016, 67, 269–283. [Google Scholar]
- Lee, S.; Jo, C.; Bergan, P.G.; Pettersen, B.; Chang, D. Life-cycle cost-based design procedure to determine the optimal environmental design load and target reliability in offshore installations. Struct. Saf. 2016, 59, 96–107. [Google Scholar] [CrossRef]
- Mohd, M.H.; Kim, K.; Kim, D.W.; Paik, J.K. A time-variant corrosion wastage model for subsea gas pipelines. Ships Offshore Struct. 2014, 10, 1. [Google Scholar] [CrossRef]
- Melchers, R.E. Probabilistic Models for Corrosion in Structural Reliability Assessment—Part 2: Models Based on Mechanics. J. Offshore Mech. Arct. Eng. 2003, 125, 272–280. [Google Scholar] [CrossRef]
- Melchers, R.E. A Review of Trends for Corrosion Loss and Pit Depth in Longer-Term Exposures. Corros. Mater. Degrad. 2018, 1, 42–58. [Google Scholar] [CrossRef] [Green Version]
- Ahn, J.; Choi, Y.; Jo, C.; Cho, Y.; Chang, D.; Chung, H.; Bergan, P.G. Design of a prismatic pressure vessel with internal X-beam structures for application in ships. Ships Offshore Struct. 2016, 12, 781–792. [Google Scholar] [CrossRef]
- Choi, Y.; Ahn, J.; You, H.; Jo, C.; Cho, Y.; Noh, Y.; Chang, D.; Chung, H.; Bergan, P.G. Numerical and experimental study of a plate-stiffened prismatic pressure vessel. Ocean Eng. 2018, 164, 367–376. [Google Scholar] [CrossRef]
- Choi, Y.; Ahn, J.; Jo, C.; Chang, D. Prismatic pressure vessel with stiffened-plate structures for fuel storage in LNG-fueled ship. Ocean Eng. 2020, 196, 106829. [Google Scholar] [CrossRef]
- Ming, Q.; Weichen, X.; Lihui, Y.; Yanato, L. Corrosion behavior of 9% Ni steel for LNG storage tanks in 3.4 wt.% NaCl solution. Int. J. Electrochem. Sci. 2018, 13, 6537–6549. [Google Scholar]
- DNVGL. Class Guideline Finite Element Analysis; DNVGL-CG-0127; DNVGL: Oslo, Norway, 2015. [Google Scholar]
Figure 1.
Flow chart of time-dependent reliability analysis.

Figure 2.
General and pitting corrosion model curves.

Figure 3.
Configuration of plate-stiffened prismatic pressure vessel.

Figure 4.
Strip model of plate-stiffened prismatic pressure vessel.

Figure 5.
Configuration of pitting corrosion in outer shell.

Figure 6.
Results of finite element analysis.

Figure 7.
Results of structural reliability analysis with general corrosion.

Figure 8.
Results of structural reliability analysis with pitting corrosion; (a) reliability index; (b) distribution of reliability index.
Figure 8.
Results of structural reliability analysis with pitting corrosion; (a) reliability index; (b) distribution of reliability index.

Figure 9.
Results of structural reliability analysis with DOP change.

Figure 10.
Corrosion depth change by temperature; (a) general corrosion; (b) pitting corrosion.

Figure 11.
(a) Reliability analysis results with confidence interval; (b) confidence interval.

Figure 12.
Reliability-based corrosion allowance and inspection; (a) no inspection case; (b) inspection case.
Figure 12.
Reliability-based corrosion allowance and inspection; (a) no inspection case; (b) inspection case.


| Model Parameter | Unit | General Corrosion | Pitting Corrosion |
|---|---|---|---|
| y | |||
| mm/y | |||
| mm | |||
| y | |||
| y | |||
| mm/y | |||
| mm | |||
| mm/y |
Table 2.
Design variables for time-dependent structural reliability analysis.
| Variable | Mean Value | Unit | COV | Probability Distribution |
|---|---|---|---|---|
| 45 | mm | 0.01 | Normal | |
| 45 | mm | 0.01 | Normal | |
| 30 | mm | 0.01 | Normal | |
| 30 | mm | 0.01 | Normal | |
| 30 | mm | 0.01 | Normal | |
| 45 | mm | 0.01 | Normal | |
| 45 | mm | 0.01 | Normal | |
| 0.6 | MPa | 0.15 | Lognormal | |
| 185,000 | MPa | 0.1 | Normal | |
| 230 | MPa | 0.01 | Lognormal | |
| 0.3 | Deterministic |
Publisher’s Note: MDPI stays neutral with regard to jurisdictional claims in published maps and institutional affiliations. |
© 2021 by the authors. Licensee MDPI, Basel, Switzerland. This article is an open access article distributed under the terms and conditions of the Creative Commons Attribution (CC BY) license (https://creativecommons.org/licenses/by/4.0/).
Share and Cite
MDPI and ACS Style
Choi, Y.; Ahn, J.; Chang, D. Time-Dependent Reliability Analysis of Plate-Stiffened Prismatic Pressure Vessel with Corrosion. Mathematics 2021, 9, 1544. https://0-doi-org.brum.beds.ac.uk/10.3390/math9131544
AMA Style
Choi Y, Ahn J, Chang D. Time-Dependent Reliability Analysis of Plate-Stiffened Prismatic Pressure Vessel with Corrosion. Mathematics. 2021; 9(13):1544. https://0-doi-org.brum.beds.ac.uk/10.3390/math9131544
Chicago/Turabian StyleChoi, Younseok, Junkeon Ahn, and Daejun Chang. 2021. "Time-Dependent Reliability Analysis of Plate-Stiffened Prismatic Pressure Vessel with Corrosion" Mathematics 9, no. 13: 1544. https://0-doi-org.brum.beds.ac.uk/10.3390/math9131544
Note that from the first issue of 2016, this journal uses article numbers instead of page numbers. See further details here.