Article

Learning Mathematics of Financial Operations during the COVID-19 Era: An Assessment with Partial Least Squares Structural Equation Modeling

by
María del Carmen Valls Martínez
*,
Pedro Antonio Martín-Cervantes
,
Ana María Sánchez Pérez
and
María del Carmen Martínez Victoria
Department of Economics and Business, University of Almería, 04120 Almeria, Spain
*
Author to whom correspondence should be addressed.
Submission received: 5 August 2021 / Revised: 24 August 2021 / Accepted: 26 August 2021 / Published: 1 September 2021

Abstract

:
The COVID-19 pandemic has affected all walks of life, including education. Universities have been forced to teach in a blended or online environment, which has led professors to adapt their traditional teaching–learning methodologies. The professors of Mathematics of Financial Operations at the University of Almeria (Spain) have created video tutorials so that students can autonomously prepare the theoretical part of the subject, leaving the face-to-face classes for practical exercises. This article aims to analyze the effectiveness of video tutorials and the autonomy finally achieved by students in their learning. For this purpose, a questionnaire was carried out in which, through 21 questions, the constructs Autonomy, Effectiveness, Depth, Format, Challenge, and Use were assessed. Based on these six latent variables, the proposed model using the Partial Least Squares Structural Equation Modeling (PLS-SEM) methodology revealed that students considered the Format and Depth of the video tutorials crucial for genuinely effective performance learning and promoting their autonomy. On the other hand, the variables Challenge and Use were poorly rated. This article presents an original valuation model, which has the virtue of achieving a prediction of 78.6% and, in addition, has high predictive power.

1. Introduction

At this point, practically everything may have been said about the global expansion of COVID-19 [1], although sadly, there is still a long way to its definitive eradication [2]. As an irony of the destiny, the global expansion of this pandemic followed an expansive pattern quite similar to the black plague of the 14th century, with which it presents a series of resemblances [3]. In a certain sense, it is also comparable with the effects that the Spanish flu brought to world economies and societies at the beginning of the 20th century [4], slowing down its growth and drastically paralyzing any human activity. Even though the World Health Organization decreed on 11 March 2020 that COVID-19 was a global pandemic and previously warned of the seriousness of its potential menace [5], the early-warning mechanisms inexplicably failed during the first two weeks of March 2020 in all countries, contributing to the spreading of the pandemic around the world.
Regardless of the complexities of this problem, essential human activities such as education could under no circumstances cease; hence, public authorities adopted different measures in order to combat the outbreak while trying to ensure the continuation, as far as possible, of normal daily life prior to the pandemic. In this context, the Spanish government opted for declaring a State of Emergency [6], guaranteeing the non-interruption of education through online instruction.
One of the key subjects in the holistic development of students is mathematics [7], as outlined by Inglis and Foster [8] in their semi-centennial perspective. Nevertheless, the entry of the COVID-19 on the scene has meant a redefinition of the student–professor relationship compared to before the pandemic [9]. Hence, the teaching of this field of knowledge given the current scenario has been denominated as a “Historical Disadvantage” by Chirinda et al. [10]. In fact, compared to very recent times in which the evaluation of mathematics learning support could only take the face-to-face mode into account in daily teaching [11], the difficulties caused by the pandemic have represented a disruptive phenomenon with respect to traditional teaching, and, even more so in the teaching of mathematics, since it has resulted not only in the quasi-obligatory decision to opt for online teaching but also in the implementation of practically any element of support coming from the new technologies [12]. In this sense, online teaching of mathematics has been successfully introduced in all educational stages or cycles such as primary school [13], secondary education [10,12,14,15,16], or at the university level, where these types of initiatives can be found around the world at university systems of countries that are geographically distant and sociocultural heterogeneous, such as the United States [17], Indonesia [18], South Africa [19], or Slovakia [20]. It follows from these facts that the teaching of mathematics from the advent of the COVID-19 onwards is likely to be restricted to automated teaching such that humans will have to limit themselves to interacting with all kinds of technological means [21].
The Spanish universities precisely took this path after the enactment of the State of Emergency [6], under which the faculty as a whole had to take charge of the urgent situation, like their colleagues in other latitudes, by carrying out their teaching via online and applying as teaching resources all technological means available at their disposal. In this context was subsumed the Department of Business and Economics of the University of Almería, Spain, when it was necessary not to cease the educative process; hence it was decided to elaborate video tutorials to support the implementation of the subject Mathematics of Financial Operations, part of which was taught online.
Thus, at the end of the 2020–2021 academic year, a strictly anonymous online questionnaire was distributed among the entire student body. The professors sought to analyze the impact of video tutorials elaborated ad hoc on the students’ final performance of this academic discipline. This survey was designed by considering the three elementary dimensions schematized by Glass and Sue [22], emphasizing the student’s preferences, satisfaction, and degree of self-learning. All surveys were tabulated and modeled according to the Partial Least Squares Structural Equation Modelling methodology (also known as PLS-SEM) [23,24,25], a set of procedures that derive from three prior lines of research: the iterative models aimed at obtaining solutions for single-component, multi-component models, and canonical correlations [26], the nonlinear iterative partial least squares (NIPALS) algorithm [27] and from other pre-existing models that opted for the inclusion of latent variables [28].
Although the initial scope of application of this methodology was originally focused on marketing [28], today it is applied to multiple areas of business and economics [29], such as finance [30] or management accounting [25] and other domains of knowledge such as the information sciences [31], based on its versatility and flexibility. It has been designed, according to Hair et al. [32], as a “silver bullet” of quantitative research that can be used both for exploratory and predictive purposes, being especially reliable when it comes to validating models or verifying hypotheses [31]. Most of the works that have previously analyzed the incidence of explanatory videos in the learning process of mathematics start from a purely exploratory perspective [18]. However, our work also applies a predictive dimension, since the model obtained has been optimally adjusted to the employed sample through the PLS-SEM methodology. To the best of our knowledge, this approach has been used for the first time in the analysis of a questionnaire related to the performance of mathematics teaching during the COVID-19 era, highlighting eminently positive feedback from students who consider that video tutorials have been helpful to shortening their study hours, giving priority to factors such as the visual aspect and the format of videos produced by the professors in charge of this unforgettable pilot experience.
This research is structured as follows: First, Section 2 contextualizes the repercussions and effects of the employment of video tutorials in the contemporary teaching–learning process, establishing the hypotheses involved in this research. Next, Section 3 defines the dataset and scale used and the constructs and indicators elaborated, defining the existing interrelationships between the different variables. Subsequently, Section 4 gathers the results obtained from applying the PLS-SEM methodology on the starting dataset, ending with Section 5, which detail the main discussions and conclusions reached in light of this manuscript.

2. Theoretical Background

Technological progress is a reality in the higher education field, not least since the COVID-19 pandemic. Most universities moved to online learning environments to replace face-to-face classes [33]. The concept of e-learning includes the use of new technologies and the Internet to improve the quality of learning by facilitating access to resources as well as remote exchanges and collaboration [34].
Today, technology is mainly used in virtual and asynchronous environments, while its inclusion with face-to-face classes is known as blended learning. Focusing on the use of asynchronous videos, extant literature has displayed its upsides [33]. Generally speaking, video tutorials tend to have a positive effect on students’ performance. In this vein, videos improve student’s motivation and autonomy [35] and allow them to regulate their workload by re-watching the classes whenever they want [36].

2.1. Impact of Video Tutorials on the Effectiveness

The effectiveness of videos depends on various factors [37]. In accordance with the cognitive theory of multimedia learning (CTML), which is how multimedia learning affects students’ cognitive processes regarding the assimilation of knowledge [38], students need to be actively processing incoming information for learning to occur. In this sense, visual (such as an image on the screen) and verbal (the professor’s voice) stimuli are addressed separately in two channels. It has been empirically proved that video and audio input simultaneously increase the student’s engagement and therefore lead to better performance [39,40,41].
Furthermore, it is necessary to keep in mind that, given that the human capacity to attend to all the information presented is limited, too much information inhibits student’s knowledge acquisition. Several authors [40,42] have highlighted that the instructor’s presence does not necessarily bring about better engagement, satisfaction, or perceived learning in the students. Moreover, other authors [39,43] state that there is no optimal format for video tutorials.
In addition, the availability of video tutorials, where its visualization may be repeated (e.g., rewinding complex concepts), catching up on missed classes, is a positive advantage for students’ learning process [44,45]. Furthermore, Koumi [46] say that “video by itself will not prove effective and will fail to achieve this potential if it is designed badly”. Videos need to be pedagogically effective to achieve student learning. Thus, they have to be designed for cognitive engagement and constructive reflection [47]. However, as remarked in the empirical study done by Miner and Stefaniak [48], video should not replace direct teaching but should be a complement of it. In this line, Means, Toyama, Murphy, and Baki [49] demonstrated that a blended-learning method is more effective than entirely face-to-face classes. However, they found similar levels of effectiveness between purely online classes and face-to-face.
Based on this understanding, we propose the following hypotheses:
Hypothesis 1 (H1).
Format is positively related to Effectiveness.
Hypothesis 2 (H2).
Usage is positively related to Effectiveness.
The effectiveness of videos is based on deep knowledge [50,51]. The application of e-learning techniques in the mathematics field increases the memorization, comprehension, and internalization of contents [52]. In this way, it is important to highlight that “it is not enough for students to reproduce the knowledge faithfully; they must have a good command of the structure and existing interrelations and give coherence to the knowledge” [37].
In this sense, an in-depth understanding by using investigation methods and reflective and critical thinking is related to learning effectiveness [37]. According to Dede [53], an asynchronous method develops thoughtful and reflective thinking among students, improving the learning process [54]. Similarly, in order to a effectiveness in the learning process, it is essential to implement learning tasks of a challenging nature. Complex problems requiring divergent thinking can improve creativity and forge significant relationships and connections in learning [37].
Therefore, we propose the following hypotheses:
Hypothesis 3 (H3).
Depth is positively related to Effectiveness.
Hypothesis 4 (H4).
Challenge is positively related to Effectiveness.

2.2. Impact of Video Tutorials on Autonomy

Learner autonomy is the ability to control one’s learning by defining one’s goals and strategies for knowing and evaluating their development. In e-learning, where professors’ intervention is not direct, motivation, environment, tasks, educators, and materials play an essential role in making students learn autonomously [55].
As we mentioned before, the use of the video tutorial format promotes students’ autonomy [35]. Specifically, the video format gives students the possibility to choose when to participate, which is perceived as a tool that increases the students’ degree of autonomy [56]. These findings are in line with [57], where it is indicated that videos are effective when allowing for autonomous learning, use vivid multimedia instruction, and enhance professor–learner communication [48].
Usually, e-learning methods have a positive impact because they favor self-regulation and allow students to develop their own learning processes [58]. As is said by Moreno-Guerrero et al. [52], “Autonomy is the dimension where there is a greater contrast when comparing the expository-traditional method with the e-learning method. This fact may be mainly due to the fact that the e-learning method favors self-regulation of learning”. Learning autonomy allows each student to save study time by managing his/her rhythm and space to tailor to his/her educational needs. Thus, learning efficiency is related to autonomy [55].
Based on the aforementioned literature, we propose the following hypotheses:
Hypothesis 5 (H5).
Format is positively related to Autonomy.
Hypothesis 6 (H6).
Effectiveness is positively related to Autonomy.
Reflective and critical thinking leads to a deep formation. In this sense, students’ inference abilities when using video tutorials, combined with self-assessment, where they may learn from their own errors, implies that depth learning is associated with improved motivation and autonomy [59].
Moreno-Guerrero et al. [52] also showed that these techniques favor students’ inference, increasing their participation and interest in the contents while the professor becomes a guide. Moreover, they found that video tutorials directly influence autonomy and, in the same way, may lead to an acquisition of mathematical concepts and results. In this sense, autonomy permits students to coordinate the activities to be developed to achieve effective learning of the concepts, giving place to formative challenges.
In this way, the following hypotheses are proposed:
Hypothesis 7 (H7).
Challenge is positively related to Autonomy.
Hypothesis 8 (H8).
Depth is positively related to Autonomy.

2.3. Moderating Effects

Previous studies demonstrate that videos’ effectiveness is influenced by a variety of characteristics: depth, challenge, format and usage. However, these studies do not capture the effectiveness’s contribution to the relationship between previous constructs and students’ autonomy. In this sense, we are referring to the moderating effect of effectiveness.
There is a large stream of literature demonstrating that variables such as gender [60,61], educational context [62], format [49], or study discipline [63] have a moderating effect on the effectiveness of online courses and blended learning.
In the same way, there is a large amount of meta-analysis research that included several possible moderators of videos’ effectiveness. For example, Van Alten, Phielix, Janssen, and Kester [64] and Spanjers et al. [65] found that the inclusion of design characteristics such as quizzes, lecture activities, or small group assignments increases the effectiveness of sessions. Müller and Mildenberger [66] analyzed as moderating effects of the educational research, study condition (study, level), and methods, finding differences in the effectiveness between blended and conventional classes. Meanwhile, Means et al. [49] included several moderator variables explaining differences in outcomes between online learning and face-to-face environments. Müller and Mildenberger [66] also revealed similar moderating results. They did not find a significant effect of these variables. Vo et al. [63] tested the moderating effects of disciplines and the final evaluation method on students’ outcomes. STEM disciplines had a more significant impact on students’ outcomes.
Consequently, we hypothesized about the existence of moderating effects of effectiveness in the learning of Financial Mathematics.
Keeping in mind these studies, we postulate the following hypotheses:
Hypothesis 9 (H9).
Effectiveness positively moderates the link between Format and Autonomy.
Hypothesis 10 (H10).
Effectiveness positively moderates the link between Depth and Autonomy.
Hypothesis 11 (H11).
Effectiveness positively moderates the link between Challenge and Autonomy.

3. Materials and Methods

The data used in the empirical part of this work are primary since they were obtained through a direct survey of students.
The authors are professors of the subject Mathematics of Financial Operations, corresponding to the second year of the Finance and Accounting degree at the University of Almeria, in Spain. The course is compulsory for students of this degree. In addition, it is offered as a third-year elective for students of the Mathematics degree in order to obtain a special recognition named “Mention in Mathematics and Finance”. During the 2020–2021 academic year, the course was scheduled to be taught in blended learning, although it was actually taught entirely online due to the pandemic caused by COVID-19. However, following the initial spirit of blended learning, half of the online theoretical classes were taught in asynchronous mode, and the rest of the classes, including the practical classes, were in synchronous mode.
With the Camtasia 2020 software, the professors recorded video tutorials on the theoretical contents of the subject. At the end of the course, an anonymous questionnaire was sent to the students. Professors want to determine their opinion on the learning process with video tutorials. A total of six latent variables (constructs) were analyzed, all considered composites, and measured by between 2 and 5 manifest variables (indicators), which indicate different dimensions of the construct. Table 1 summarizes all the variables analyzed: constructs and corresponding indicators.
A total of 21 indicators were considered, all measured on a Likert scale ranging from 1 to 7, as shown in Table 2. The Effectiveness construct was estimated in reflective mode, considering the covariation of its indicators. However, the rest of the constructs were estimated in a formative mode, considering a causal relationship of the indicators on the construct.
Three indicators were considered to measure the Autonomy achieved by the student with the use of video tutorials: strengthening of autonomous learning (A1), improvement in the management of study time (A2), and the possibility of resolving doubts without the need to attend face-to-face tutorials (A3). It should be noted that blended learning requires students to compensate for the professor’s presence with their autonomous capacity in a more or less extensive part of the course.
The level of Effectiveness of the video tutorials translates into the degree of autonomy achieved by the student. If the video tutorials are useful for learning the subject (E1), if they help to understand the contents better (E2), and if they save time in the study (E3), they will be more effective.
In turn, the time the student has devoted to the video tutorials, both individually (U1) and in relation to peers (U2), determines their Usage, which will influence effectiveness.
If video tutorials are challenging for the learner, this should encourage students’ autonomy. Video tutorials will be a Challenge when they help them to relate the subject matter meaningfully (C1), to coordinate the learning activities to be developed (C2), to seek alternative perspectives (C3), and to be creative in finding solutions (C4).
The Depth of the video tutorials will be conducive to learner autonomy. A video tutorial will be deep when it leads to questioning and the use of research methods (D1), helps to deepen the understanding of fundamental concepts and ideas (D2), relates fundamental concepts (D3), and develops critical and reflective thinking (D4).
Finally, the Format of the video tutorials, i.e., the way they are made, will also influence the student’s autonomy. In this sense, the variety or not of the professors that appear in them (F1), the length of the subject matter covered in each video tutorial (F2), its duration (F3), its visual aspect (F4), and the clarity and precision of the explanations (F5) will be decisive in the student learning and, ultimately, in the autonomy achieved.
The constructs Depth and Challenge are based on the ATAE questionnaire for the analysis of assessment tasks [37]. The constructs Effectiveness, Format, and Autonomy were based on the survey conducted by Financial Mathematics professors in a previous course [67], while Use was newly created.
Figure 1 shows all the study variables developed and the relationships between them derived from the previously described hypotheses, namely the conceptual research model known as a nomogram. It should be noted that the model presented is absolutely original.
The relationships between each construct and its indicators constitute what is known as the measurement model. The relationships between the different constructs constitute the structural model. The assessment of both models was carried out using the statistical methodology of Partial Least Squares Structural Equation Modeling (PLS-SEM), implemented by the software SmartPLS (v.3.3.2.) [68].
PLS-SEM does not require the data to have a normal distribution, since it uses a non-parametric bootstrap technique to test the significance of the coefficients [69,70,71]. In this analysis, 10,000 samples with replacement were considered.
The PLS algorithm involves four stages. In the first stage, the structural model weights and latent variable scores are determined through a four-step iterative process [72,73,74]:
  • Preliminary outside estimation of the latent variables scores through the linear combination of their manifest variables:
    ξ j , n : = k j w ˜ k j x k j , n ,
    where ξ j is the latent variable, j = 1 , , J ; x k i is the manifest variable k of the latent variable i, k = 1 , , K ; w ˜ k j is the estimated outer weight of the indicator x k i ; n is the specific observation, n = 1 , , N .
  • Inner weights estimation of the latent variable, by using the factor weighting scheme and according to the sign of the correlations between latent variables:
    v j , i = cov ( ξ j , ξ i ) ,   if   ξ j   and   ξ i   are   adjacent   0   ,   otherwise
  • Internal estimation of latent variable scores by linear combination of their adjacent variables, by using the inner weights of the previous step:
    ξ ˜ j : = i β j , i ξ i .
  • Outer weights estimation, which are calculated differently depending on whether the constructs are estimated in a formative or reflective mode:
    Formative   ( mode   B )   ξ ˜ j , n = k j w ˜ k j x k j , n + δ j , n Reflective   ( mode   A )   x k j , n = w ˜ k j ξ ˜ j , n + e k j , n
    where δ j , n is the error term from a multiple regression and e k j , n is the error term from a bivariate regression.
The algorithm is iterative and terminates when the weights in Step 4 experience a marginal variation between two consecutive iterations, or when the maximum number of iterations is reached.
Based on the latent variable scores obtained in Stage 1 and through a series of ordinary least squares regressions in Stages 2 and 3, the external weights and loadings of the manifest variables, the path coefficients, and a series of parameters, such as the direct and indirect effects, the coefficient of determination R2 of the endogenous latent variables and different evaluation criteria of the model are determined.
Finally, in stage 4, the non-parametric bootstrapping procedure (sampling technique with replacement) is applied to test the significance of the model parameters.
The assessment of the measurement model requires different treatment of the reflective and formative constructs. To evaluate the reflective composite, it is necessary to contrast the reliability of each of its indicators as well as the reliability of the construct and its convergent and discriminant validity. Additionally, the evaluation of the formative composite involves studying the multicollinearity between the different indicators, as well as the relevance and significance of the weights of each indicator.
Composite reliability [72], which should range from 0.7 to 0.95, is the lower limit of internal consistency reliability of the reflective construct. This measure is determined by
ρ c = k = 1 K l k 2 k = 1 K l k 2 + k = 1 K var ( e k ) ,
where l k is the outer loading of the manifest variable k corresponding to a latent variable measured with K indicators; e k is the measurement error of k; and var ( e k ) corresponds to the measurement error variance and it is calculated as 1 l k 2 .
Cronbach’s alpha is the upper limit of internal consistency reliability
Cronbach s   α = K r ¯ 1 + ( K 1 ) r ¯ ,
where r ¯ is the mean of the triangular correlation matrix.
The Dijkstra–Henseler’s Rho usually stands between the two previous measures [75]:
ρ A : = w ^ w ^ 2 w ^ S diag S w ^ ´ w ^ w ^ w ^ diag w ^ w ^ w ^ ,
where w ^ is the estimated weight vector of the construct and S is the empirical covariance matrix of the manifest variables.
The average variance extracted (AVE) is a measure of the convergent validity [76]:
AVE = k = 1 K l k 2 K .
It is considered acceptable when its value exceeds 0.5, which means that the construct explains more than 50% of its manifest variables’ variance.
In the formative constructs, collinearity is analyzed through the variance inflation factor (VIF) of each indicator [77]:
VIF k = 1 1 R k 2 .
If the VIF of an indicator is greater than 5, it indicates that there are problems of collinearity with other indicators of the construct, so it should be eliminated [78].
On the other hand, the assessment of the structural model involves determining the absence of collinearity problems between the constructs; evaluating the sign, magnitude, and statistical significance of the path coefficients; assessing the effect sizes; and, finally, determining the in-sample predictive power by means of the blindfolding procedure. Moreover, the out-of-sample predictive power will be analyzed by utilizing holdout samples [29].
The total number of students enrolled in the course was 162, of whom 23 students did not attend class and did not take the exams. Therefore, the actual sample was 139 students. Students were asked to answer the survey, completely voluntarily and anonymously, using the university’s teaching platform through which the classes had been given. A total of 118 students responded, which represented an 85% response rate. Once the responses had been analyzed, 7 observations had to be eliminated, since inappropriate patterns of behavior were observed—for example, all responses had the same score. Consequently, the final sample was 111 observations, which represented 80% of the students who had taken the course, thus ensuring its representativeness.
The number of observations to reach acceptable levels of statistical power in PLS-SEM and a quality measurement model is 100 [78]. On the other hand, considering a mean effect size of 0.15, a significance level of 0.05, and a statistical power of 0.8, using the statistical software G*Power (v. 3.1.9.6., Kiel, Germany) [79] for the proposed model, the necessary sample size is 85. Therefore, since 111 responses were obtained in the study, the sample considered was adequate.

4. Results

Table 3 shows the main descriptive statistics of the sample. The students’ opinion has been very mixed, as all but four of the indicators cover the full range between 1 and 7. The students’ evaluation of the video tutorials is positive, since the average score exceeds 4. It is only below 4, with a value of 3.937, for their appreciation of the time of use (U2). The students consider that they have spent less time than their peers studying with video tutorials.
With an average of 5.622 and a minimum value of 3, the best-rated aspect was the visual aspect, considering that the video tutorials are attractive and clear. The highest-rated construct, overall, and with a smaller range of variation, was Format, indicating that the design of the video tutorials by the professors was appropriate.
Figure 2 depicts a global vision of the measurement and structural models.

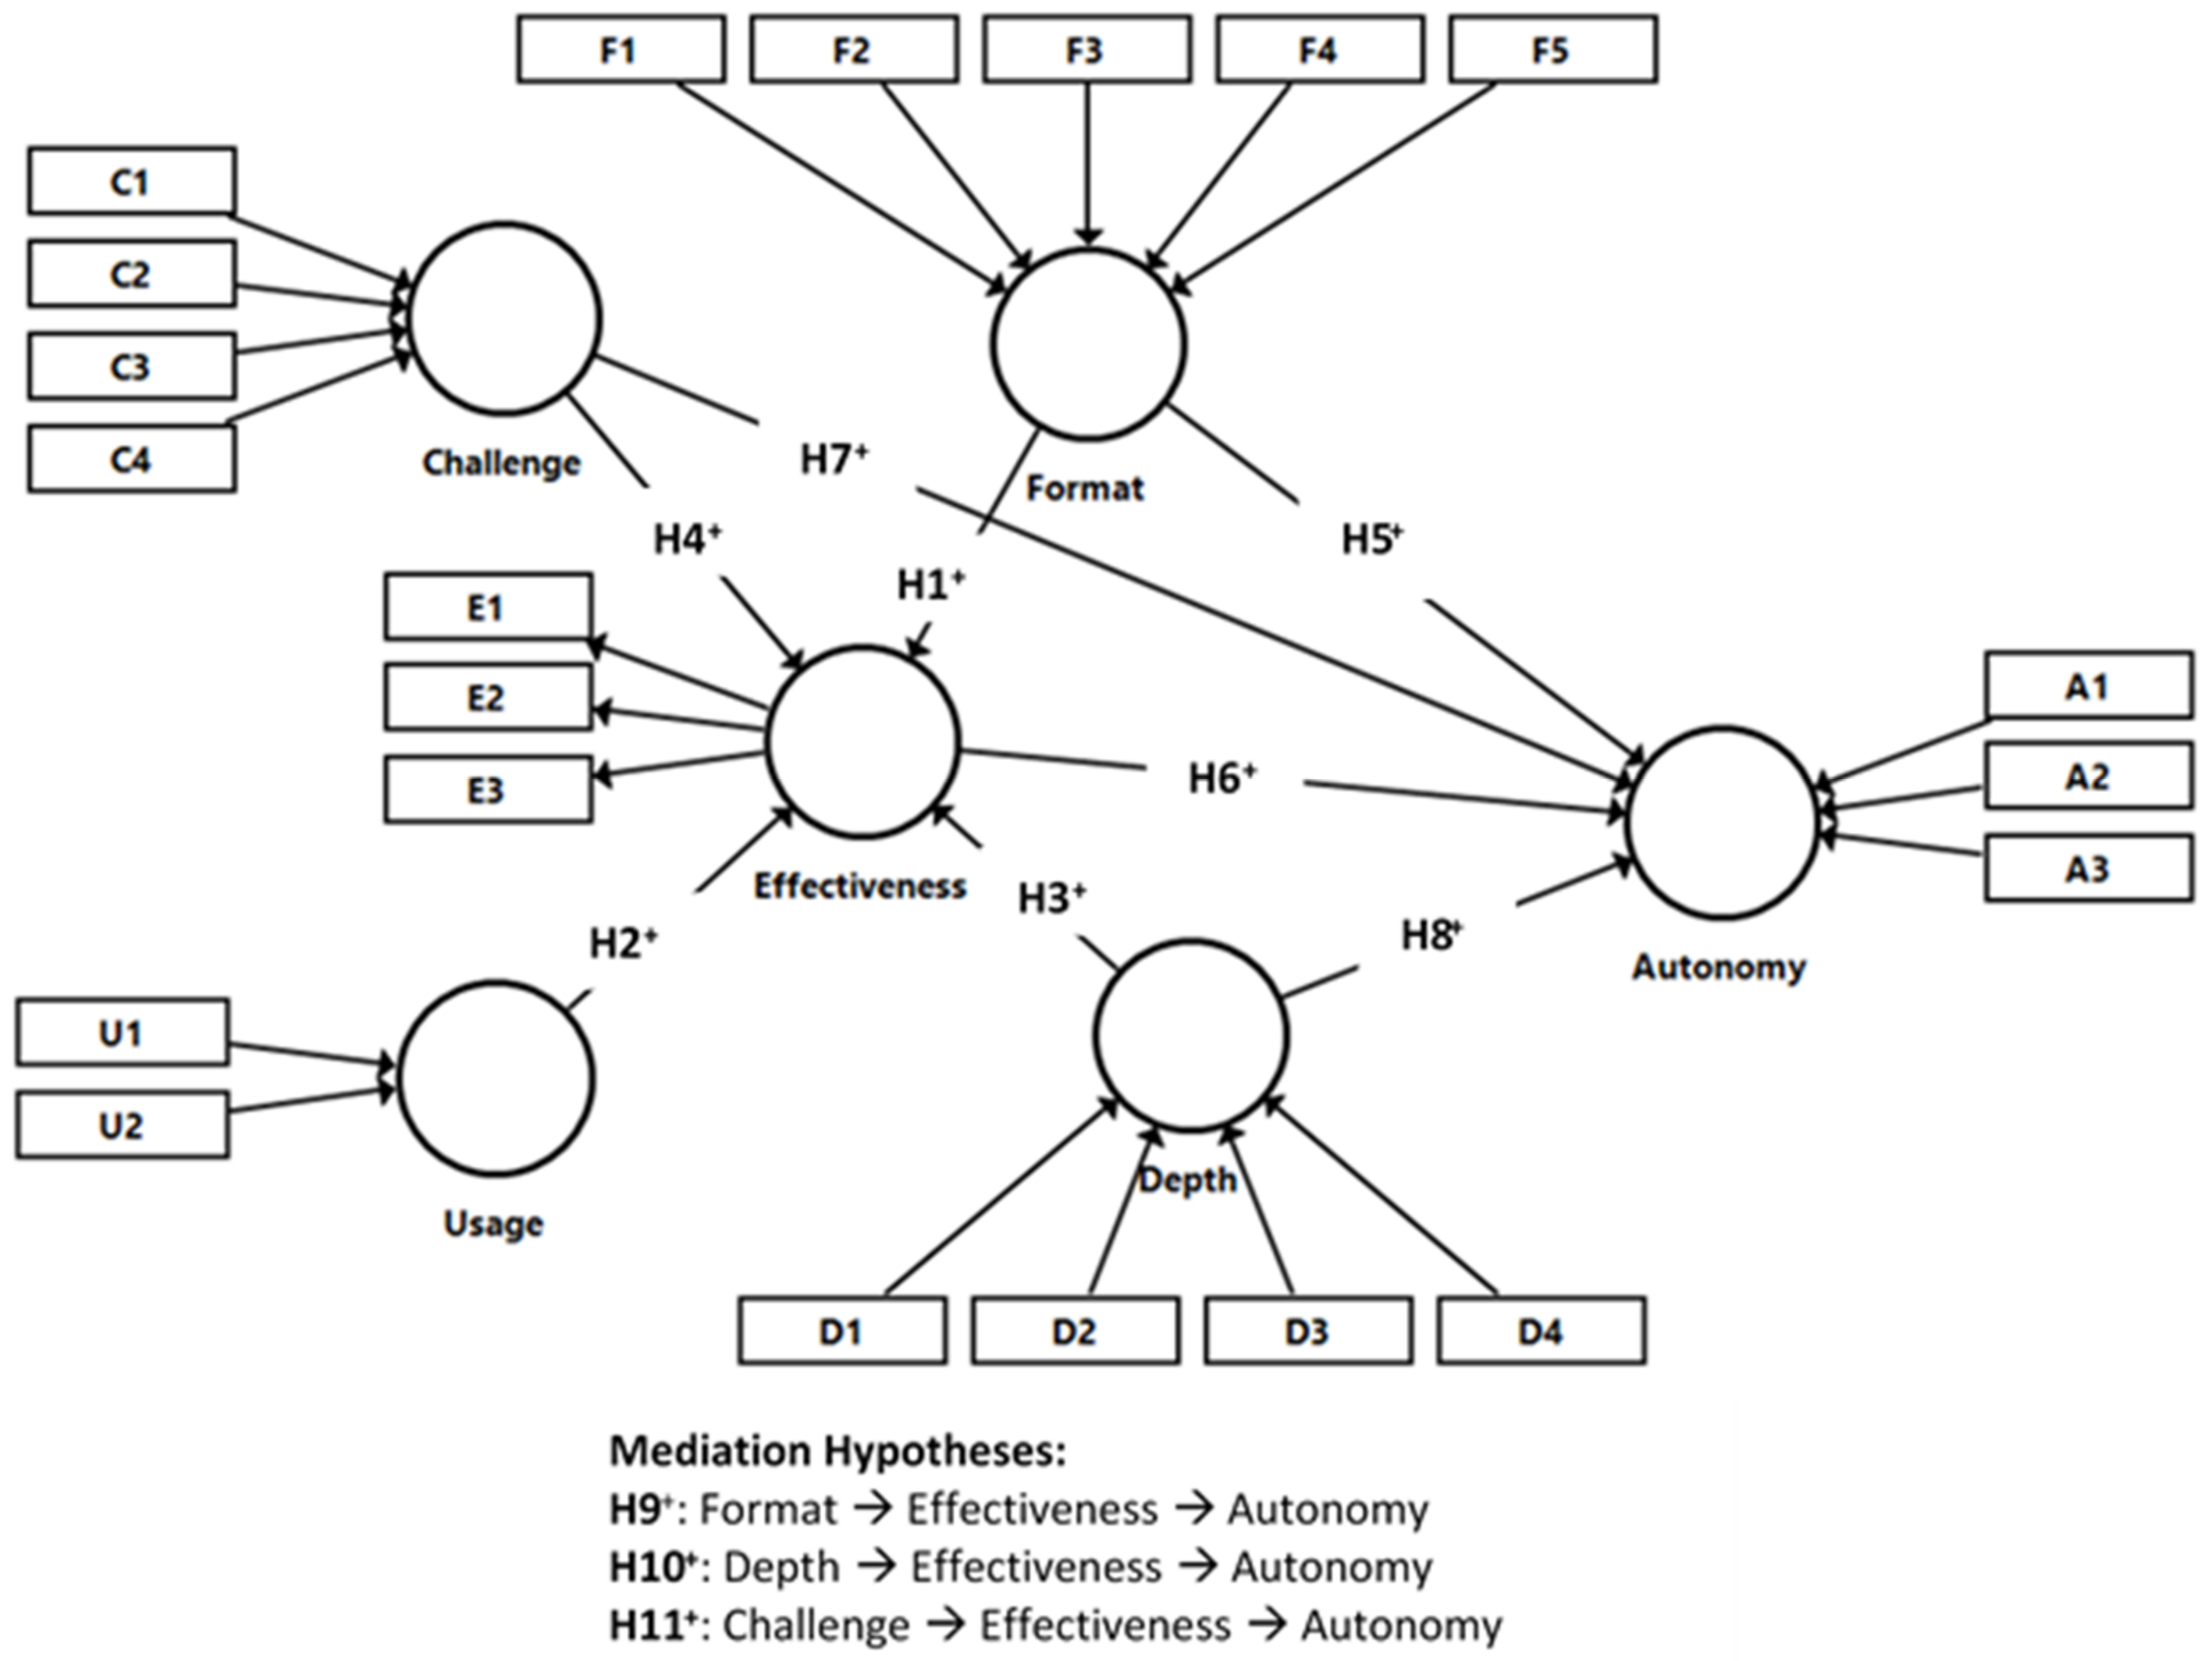
4.1. Measurement Model

Table 4 shows the results corresponding to measurement model assessment.
First, Panel A displays the validation data for the reflective construct, Effectiveness. The construct indicators are valid when their loadings (λ) are ≥0.707 [80], which is verified in E1, E2, and E3 (Panel A1), and implies that the variance shared between the construct and its indicators is greater than the variance due to error. The commonality of the indicators (λ2) indicates that their variation is explained between 66.59% and 75.69% by the construct.
On the other hand, construct reliability or internal consistency is guaranteed as long as Cronbach’s alpha coefficient, composite reliability [81], and Dijkstra–Henseler’s Rho (Panel A2) are ≥0.7 [75]. In this study, stricter reliability was found, with values >0.8, corresponding to more advanced research stages [82]. Furthermore, the 95% confidence intervals, obtained with a bootstrapping of 10,000 samples, verified that the lower limit is >0.7 and the upper limit is <0.95 [29].
In addition, convergent validity is determined by the average variance extracted (AVE), which must be ≥0.5 [83]. In this case, Effectiveness explains, on average, 72.2% of the indicators’ variance.
Lastly, the discriminant validity of Effectiveness was tested by the Fornell–Larcker Criterion (Panel A3), according to which the square root of the AVE (0.850, highlighted in bold on the diagonal) must be greater than the construct correlation with the rest of the constructs (the values horizontally and vertically located on the same line) [23].
Second, Panel B reflects the evaluation results of the formative constructs. All variance inflation factors are <3, so there are no collinearity problems between the indicators [29,84]. It is important to note that the value of the weights indicates the indicator contribution to the corresponding construct. The six indicators with non-significant weights remained in the model, U2, C3, C4, and F3 had loadings >0.5; F1 and F4, whose loadings were <0.5, showed significant loadings [23]. The most highly rated indicators in each latent variable were A1, U1, C2, D3, and F5.

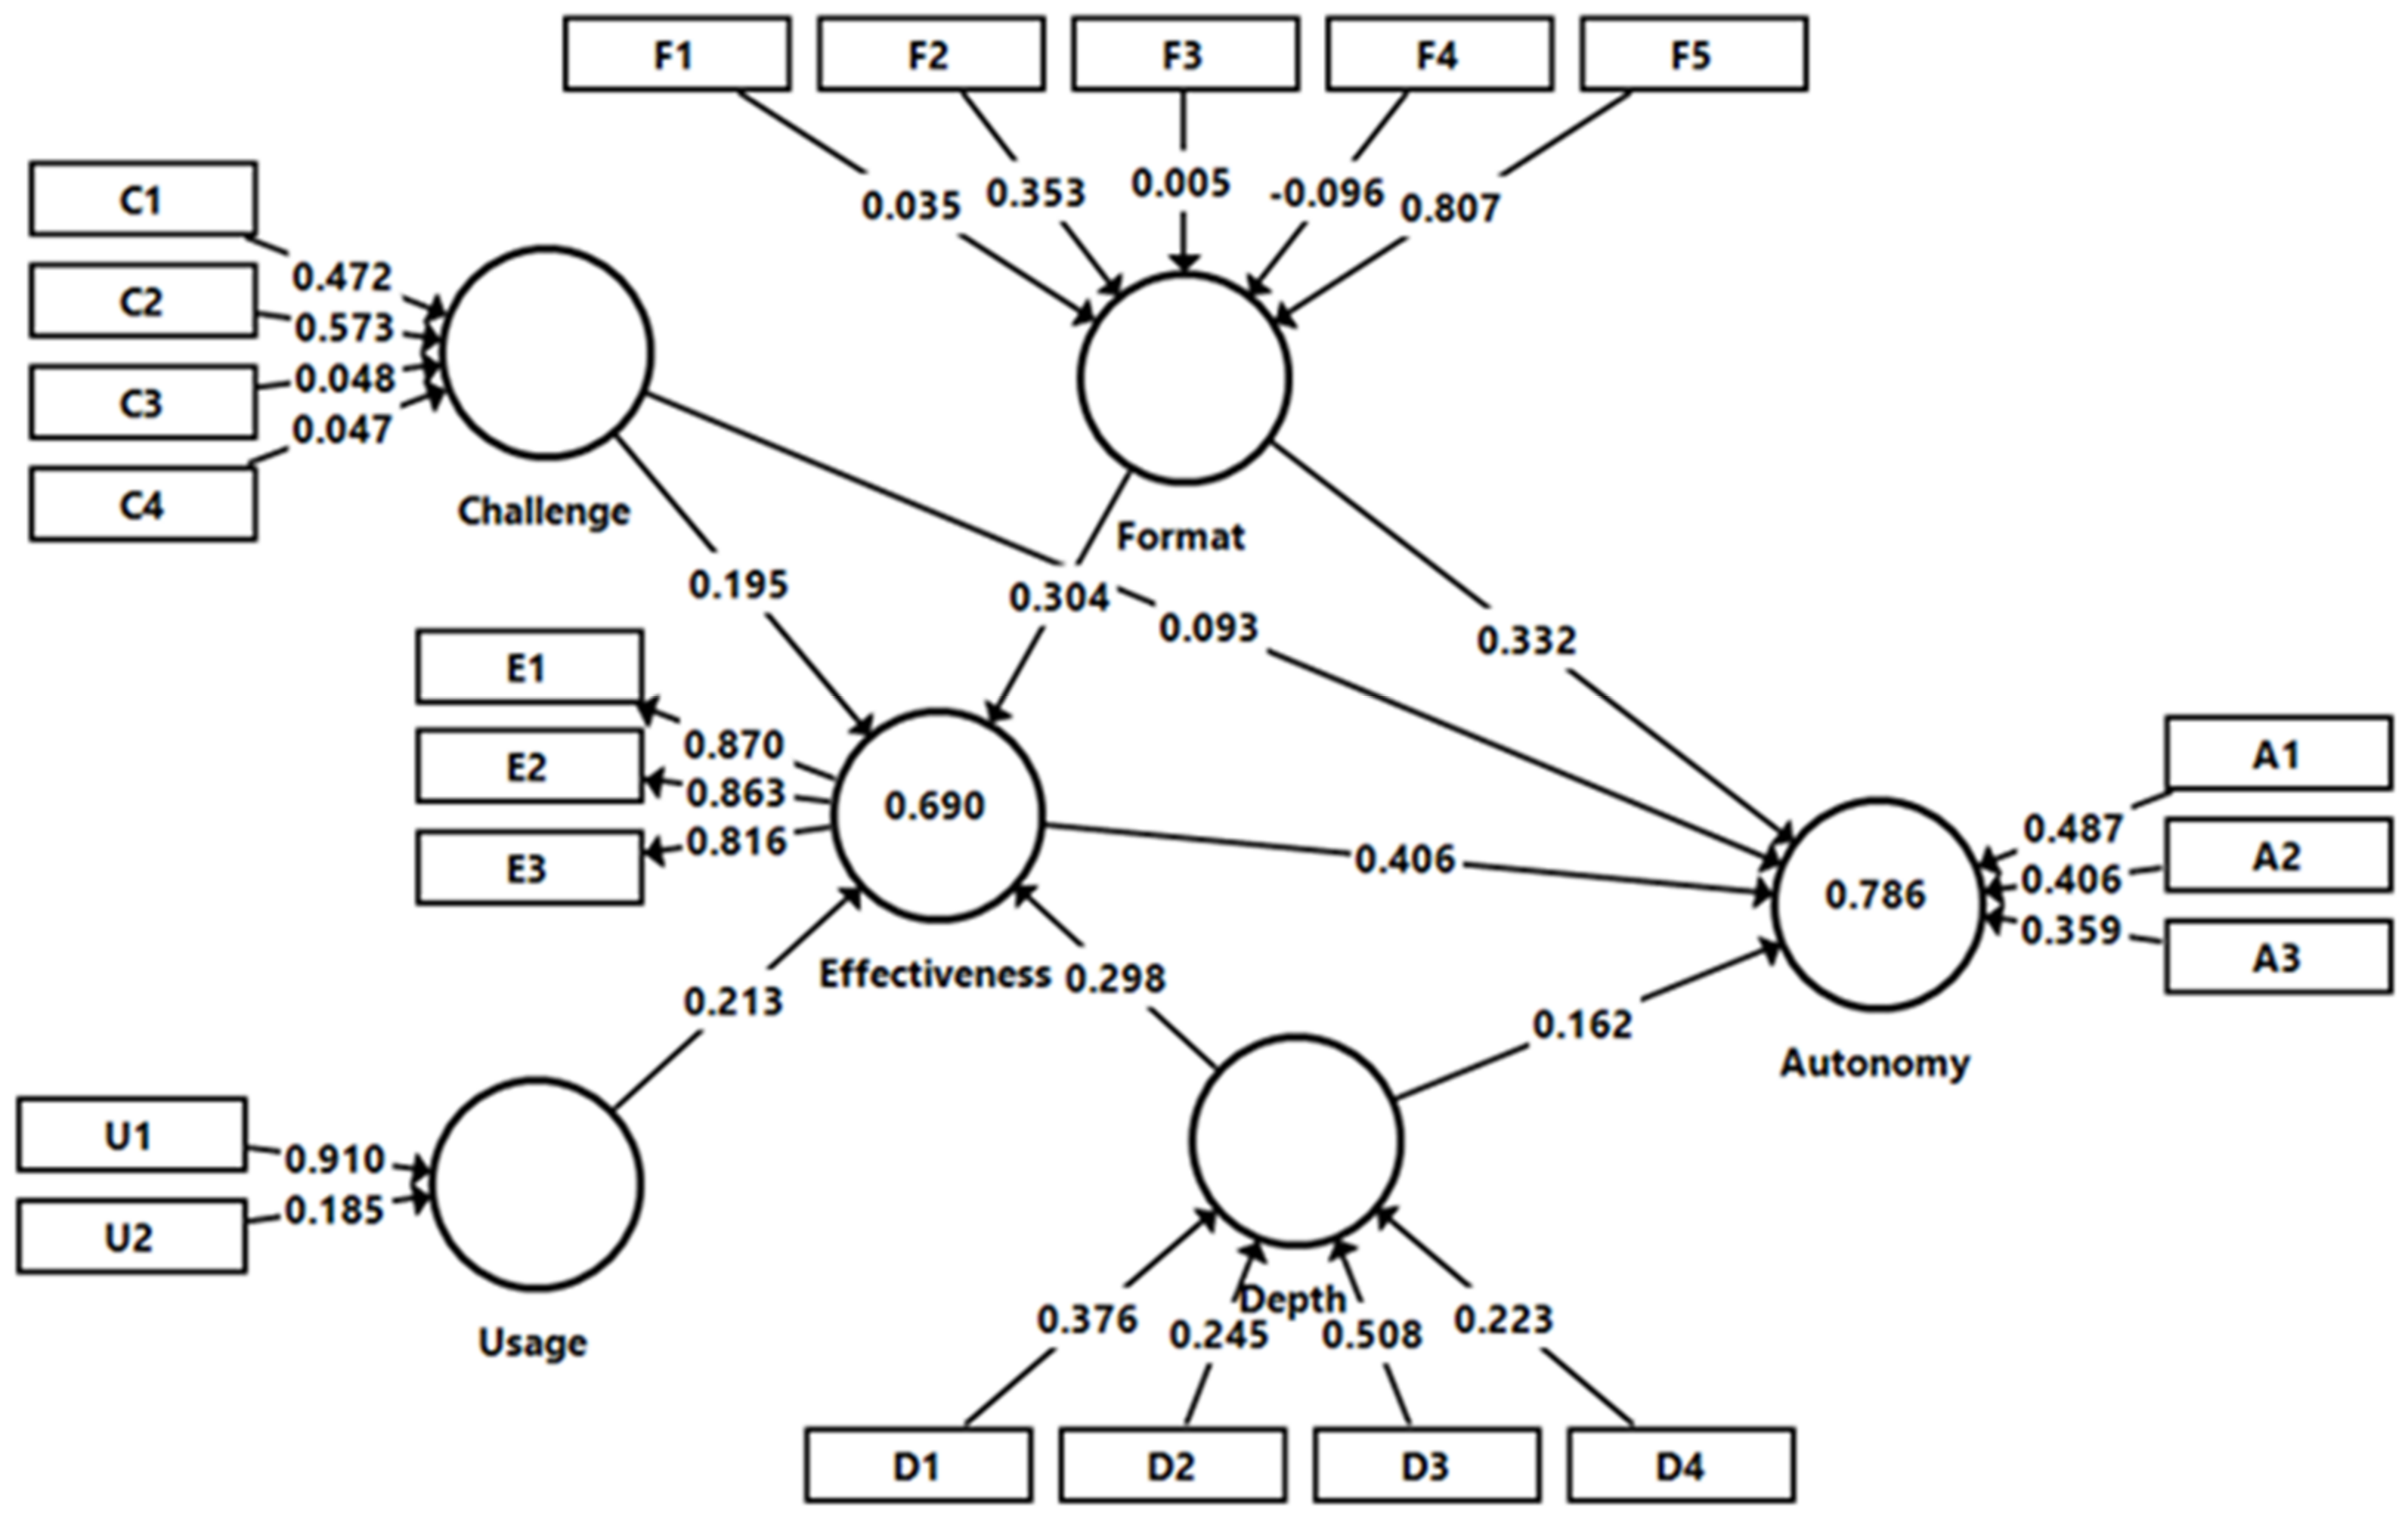
4.2. Structural Model

Table 5 presents the main parameters related to the assessment of the structural model. All the VIF values are ≤3, so the model did not present collinearity problems [29]. It should be noted that, as the path coefficients are shown as standardized values, their possible values range from +1 to −1. In this case, a one-tailed bootstrapping was considered for testing the hypotheses with their corresponding sign [85]. According to the latest requirements, the number of samples considered was 10,000 [86].
The results showed that Format, Usage, and Depth positively influenced Effectiveness with a significance level of 99% (p = 0.001, 0.000, and 0.002, respectively), while Challenge did so at 95% (p = 0.024), which confirmed the hypotheses H1, H2, H3, and H4. Likewise, Format and Effectiveness positively influenced Autonomy, with a significance level of 99% (p = 0.000 in both cases), while Depth did so at 95% (p = 0.018) and Challenge did not present a significant influence (p = 0.149), so hypotheses H5, H6, and H8 were confirmed, but hypothesis H7 was not confirmed.
Concerning the mediation hypotheses, the indirect effects indicate that a partial mediation of Effectiveness between Depth and Autonomy was verified, with a significance level of 99% (p = 0.006), thus verifying hypothesis H10. Similarly, Effectiveness exerted a partial mediation, with a significance of 95% (p = 0.015), between Format and Autonomy, verifying hypothesis H9. In addition, with a significance of 90% (p = 0.061), Effectiveness fully mediated between Challenge and Autonomy, validating hypothesis H11.
Finally, Usage exerted a positive and significant influence on Autonomy through Effectiveness, with a significance of 99% (p = 0.003).
The coefficient of determination R2 gives the explained variance of the latent dependent variables. Table 6 shows how much of that variance is explained by each preceding construct.
Effectiveness was explained by 69%, and the constructs that contributed most were Depth (22.2%) and Format (21.2%), followed by Challenge (14.2%) and Usage (11.4%). Regarding the final dependent variable, Autonomy, the model explained 78.6% of its variance. In this case, the most influential construct was Effectiveness (33.6%), followed by Format (26%), Depth (12.2%), and Challenge (6.9%). Therefore, the explanatory power of the model is substantial [23,87].
The value of f2 gives the effect size of the exogenous constructs on the endogenous constructs. By considering that 0.02 ≤ f2 < 0.15 is a small effect, that 0.15 ≤ f2 < 0.35 is a moderate effect, and that f2 ≥ 0.35 is a large effect [88], the latent variables Effectiveness and Format were found to exert a moderate effect on Autonomy (f2 = 0.266 and 0.224, respectively), while the rest of the effects were found to be small.
Finally, in-sample predictive relevance of Effectiveness (reflective dependent construct) is given by the Stone–Geisser test [83], which yields a value of 0.475, indicating a prediction that could be considered high.

4.3. Out-of-Sample Prediction

The model analyzed also shows a high out-of-sample predictive power, as evidenced by the results in Table 7, which derive from a holdout sample procedure [89] implemented in SmartPLS. Therefore, the model is powerful enough to predict the results values of a new case, that is, cases not included in the sample analyzed. Indeed, this can be deduced from the fact that the PLS-LM difference is negative for all indicators.

5. Discussion and Conclusions

As universities moved to teach in a blended or online environment, the use of video tutorials turned into a leading tool in higher education. The present research is a great step in the design and study of videos at the university level of Financial Mathematics. This research is motivated by the call for more extensive research into the effectiveness of video tutorials [33], [35], or [39]. To the best of our knowledge, previous studies that analyze the effectiveness of videos employing PLS-SEM methodology are scarce. Specifically, it is necessary to highlight the recent study of Ibarra-Sáiz and Rodríguez-Gómez [37], which makes an evaluation of the assessment system validated with PLS-SEM. Thus far, there is a gap in the empirical research because they have not used this methodology in the mathematics learning process during the COVID-19 era at the university level. Specifically, previous studies have not considered effectiveness as a moderating variable in the learning process. Following this argument, we highlight the articles [37,49,52] that deserve particular attention given that they are related to and support our paper’s contribution.
As we mentioned before, to study the impact of video tutorials on learning efficiency, it is necessary to mention the study of Ibarra-Sáiz and Rodríguez-Gómez [37]. This paper is focused on analyzing the most effective way to learn. With respect to Format and Usage, in [37] it is claimed that it is not enough for students to reproduce the knowledge faithfully; they must have a good command of the structure and existing interrelations and give coherence to the knowledge. Regarding Depth, they claim that learning effectiveness is related to an in-depth understanding by using investigation methods and reflective and critical thinking. With respect to Challenge, complex problems requiring divergent thinking can improve creativity and forge significant relationships and connections in learning [37].
In this sense, our results are in line with their ones given that we confirm that in video tutorials, Format, Usage, Depth, and Challenge positively influence Effectiveness with a significance level higher than of 95% (p = 0.001, 0.000, 0.002, and 0.024, respectively). In particular, the descriptive statistics (see Table 3) reveal that the lowest score level given in the questionnaire corresponds to the U2 indicator (construct Usage), which leads us to infer that the students consider that they have spent less time than their peers with the video tutorials, recognizing that they do not dedicate enough time to study. However, in U1 (sufficient and suitable study time) they have an average of 4.568. Among all the constructs obtained, Format is the most prominent, which suggests that the students have satisfactorily evaluated the audio-visual presentation contained in the video tutorials, even though the mean of F1 (preference for recording by several professors rather than a single professor) is one of the lowest. This factor may result from students not being entirely satisfied with the video tutorials prepared by several professors, instead of a single one, or even by the same professor who previously taught the subject in the classroom mode. It might also be due to the existence of students who still miss the face-to-face mode or who have not been able to assimilate the transition from the traditional classroom to the online mode [19].
What is more, Format, Effectiveness, Depth and Autonomy, are also the constructs with the greatest degree of dispersion among the student responses. Such heterogeneity may be a direct consequence of the fact that the questionnaires were fulfilled entirely freely and anonymously, allowing the students to express themselves with complete freedom. Hence, the interactivity offered by the video tutorials has had particularly positive effects, one of the aspects to be encouraged in the post-COVID-19 teaching era as reported by Rey Lopez et al. [17] in pedagogical research in which the interviewees were the professors themselves. Moreover, Usage presents the lowest degree of acceptance among the students, which may be derived because the students prefer to interact with the professor through online streaming or simply because many prefer to write personally on the blackboard in the classroom [20,90].
On the other hand, to study the impact of video tutorials on autonomy, it is necessary to remark the research of Moreno-Guerrero et al. [52], where, as in our article, the effectiveness of a e-learning experience in the teaching of mathematics is studied (the difference resides in that this experience is in adult high school, while in our study it is at university). The present study’s results for blended learning using video tutorials show that the Format, Effectiveness, and Depth positively influence Autonomy with a significance level of more than 95%. In this vein, our findings indicate that videos help to identify the key concepts of the subject and to coordinate the learning activities essential for its assimilation (see Panel B, Table 4). In line with our study, Moreno-Guerrero et al. [52] remark that the application of e-learning techniques in the mathematics field increases the memorization, comprehension, and internalization of contents. They focus on Autonomy, given that this dimension shows an enormous contrast when comparing the face-to-face method with the e-learning method, because the latter approach favors self-regulation of learning. Our results also show that students found the instructions to be clear and precise, considering that the time spent in their study was sufficient and adequate. Note that the considerations made by the students had already been foreseen by the professors beforehand, especially those that value that the explanations are clear and precise or do not give much importance to the length of each video. Both issues are justified by the fact that the professors designed each video in itself as a “knowledge pill” whose content summarized and condensed each of the subject’s themes. In other words, the content of the videos was intended to be limited and condensed.
The model reveals the relationships between the different latent variables. For video tutorials to be effective in the teaching–learning process, it is essential that their content has depth and that the format (color, font, length, speed of explanation, etc.) in which they are made is appropriate. These results are in line with [47,57]. Although to a lesser extent, it is also important that the content is explained in a way that challenges the student. Finally, students rated the frequency of use as less critical. Therefore, we can conclude that students do not need to watch the video tutorials repeatedly for learning if they are well designed.
With respect to the desired objective of Autonomy in student learning, which was 78.6% explained, the most important variables are, in this order, Effectiveness and Format, as also indicated [35,57]. Depth also plays an essential role in achieving learner autonomy. However, the fact that the video tutorials challenge the students made a small contribution. In sum, we can state that the Format and Depth of the content have central importance in studying with video tutorials. Furthermore, in this particular case, the students positively valued the work done by the professors in the recorded video tutorials, considering that the format chosen was quite adequate.
Finally, our findings confirm the moderating effects of effectiveness in the learning of Financial Mathematics. The indirect effects of Effectiveness are new, since previous studies [60,61,62,63,64,65,66] just select gender, educational context, or study discipline as moderating variables. In this sense, we want to comment on Means et al.’s [49] contribution, where the effectiveness of online and blended learning through a meta-analysis of the empirical literature is analyzed. In this sense, the authors of [49] study several moderator variables explaining differences in outcomes between online learning and face-to-face environments, with the main results being in line with our paper outcome: a blended-learning method is more effective than entirely face-to-face classes. This is explained given that blending learning also involves additional learning time by using more instructional resources and course elements that encourage interactions among learners. This idea, initially proposed in [49], is developed and confirmed experimentally in our paper.
Another significant aspect to highlight is the predictive character of the model generated. In practice, the application of the PLS-SEM methodology only ensures that the adjusted model is exploratory or explanatory for the sample under consideration. Only in some cases is it guaranteed that the fitted model will have predictive relevance “out of the sample”. However, given that values of Q2 are greater than 0 [23], and because the PLS-LM difference is negative for all indicators (Table 7), the model obtained can be considered entirely predictive. In line with the work of Karmila et al. [18], the results of this study demonstrate that the employment of video tutorials has served to improve three critical aspects of the teaching-learning process of the subject Mathematics of Financial Operations in the midst of the COVID-19 epoch: improving students’ conceptual understanding skills and their learning outcomes while increasing their motivation and interest in the subject.
Similarly, several analogies with previous works can be observed. For example, the results of the four dimensions of the Adversity Quotient (AQ) developed by Anggraini and Mahmudi [91] among Indonesian students are analogous in terms of the degree of satisfaction manifested in the same way that its usability is also rated very positively. It also presents some parallelisms with Cassibba et al. [92], who applied a different methodological spectrum (Mathematics Teacher’s Specialized Knowledge (MTSK)), implying that Sicilian teachers in charge of teaching mathematics did not experience a significant difference between online and traditional or classical teaching, a fact that is confirmed in our research from the students’ perspective due to the high impact of the variables Effectiveness and Autonomy.
The relevance of this last variable is also noted by Fakhrunisa and Prabawanto [93] emphasizing the potential for independent and flexible learning, depending on the needs and circumstances of each student. Regarding the practical usefulness of this study, it should be taken into account that the quality and objectivity of the answers obtained from the learners, besides allowing us to obtain a PLS-SEM model of predictive nature, indirectly resulted in an analysis of the strength of the cognitive abilities of each student quite close to Hidayah et al. [94]. More specifically, it has mainly reinforced memory-related and visual-spatial skills (Effectiveness, Depth, and Format variables). It is essential to underline that, although students tend to prefer asynchronous online teaching [95], our methodological proposal in no way presupposes dispensing with it but rather complementing it, increasing the autonomous initiative of the e-learners in the field of mathematics.
Any innovative and groundbreaking methodological proposal, such as the one presented in this research work, can be implemented in other subjects, universities, and countries if the appropriate circumstances are fulfilled. Possible barriers include the lack of material or economic means, such as those detected by Mohammadi, Mohibbi, and Hedayati [96] in the establishment of HELMS (Higher Education Learning Management System) in Afghanistan, or the preparation, facilities, and infrastructure available for the teaching staff responsible for online teaching as reported by Kamsurya [97]. Another aspect to highlight for this approach to materialize in other classrooms is the need for coordination between schools or faculties, students, and professors [98], always bearing in mind the opinion and needs of the students [99].
Whatever the objections that may be raised, this approach to teaching develops the educational suggestions of international institutions such as UNESCO, since it implies the creation of methods, processes, and feedback analysis of each component involved in the educational process [100]. As Lockee [101] states, the new generations coming after the pandemic will be faced with an educational environment diametrically opposed to the classical one, in which online teaching will be predominant and will rely on methods and models that are more flexible with the reality of the times: COVID-19 has only accelerated this process that is yet to come.
The main limitation of this work lies in the sample used, since it corresponds to students of a given subject at a single university. In the future, it would be interesting to obtain data from students from other universities with the same video tutorials. It would also be desirable to extend the study to other subjects, in which case new video tutorials adapted to the subject would have to be developed. All this would make it possible to compare the results and, therefore, to give greater firmness to the conclusions reached.

Author Contributions

Conceptualization, methodology, and formal analysis, M.d.C.V.M.; data curation, M.d.C.V.M., P.A.M.-C., A.M.S.P. and M.d.C.M.V.; writing—original draft preparation, M.d.C.V.M., P.A.M.-C., A.M.S.P. and M.d.C.M.V.; writing—review and editing M.d.C.V.M., P.A.M.-C., A.M.S.P. and M.d.C.M.V.; project administration, M.d.C.V.M. All authors have read and agreed to the published version of the manuscript.

Funding

The APC was funded by VICERRECTORADO DE ORDENACIÓN ACADÉMICA DE LA UNIVERSIDAD DE ALMERÍA, Grupo Docente 20_21_4_05C (Docencia online de Matemáticas de las Operaciones Financieras).

Institutional Review Board Statement

Not applicable.

Informed Consent Statement

Not applicable.

Data Availability Statement

Not applicable.

Conflicts of Interest

The authors declare no conflict of interest.

References

  1. Sasidharan, S.; Dhillon, H.S.; Singh, D.H.; Manalikuzhiyil, B. COVID-19: Pan(info)demic. Turk. J. Anaesthesiol. Reanim. 2020, 48, 438–442. [Google Scholar] [CrossRef]
  2. Torjesen, I. Covid-19 will become endemic but with decreased potency over time, scientists believe. BMJ 2021, 372, n494. [Google Scholar] [CrossRef]
  3. Shamekh, A.; Mahmoodpoor, A.; Sanaie, S. COVID-19: Is it the black death of the 21st century? Health Promot. Perspect. 2020, 10, 166–167. [Google Scholar] [CrossRef] [PubMed]
  4. King, P.T.; Londrigan, S.L. The 1918 influenza and COVID-19 pandemics: The effect of age on outcomes. Respirology 2021, 26, 840–841. [Google Scholar] [CrossRef] [PubMed]
  5. Cucinotta, D.; Vanelli, M. WHO Declares COVID-19 a Pandemic. Acta Bio Med. Atenei Parm. 2020, 91, 157–160. [Google Scholar]
  6. Council of Ministers. Government Decrees State of Emergency to Stop Spread of Coronavirus COVID-19. 2020. Available online: https://www.lamoncloa.gob.es/lang/en/gobierno/councilministers/Paginas/2020/20200314council-extr.aspx (accessed on 5 August 2021).
  7. Sun, K.L. Brief Report: The Role of Mathematics Teaching in Fostering Student Growth Mindset. J. Res. Math. Educ. 2018, 49, 330–335. [Google Scholar] [CrossRef]
  8. Inglis, M.; Foster, C. Five Decades of Mathematics Education Research. J. Res. Math. Educ. 2018, 49, 462–500. [Google Scholar] [CrossRef]
  9. Carr, M.E. Student and/or Teacher Valuing in Mathematics Classrooms: Where Are We Now, and Where Should We Go? In Values and Valuing in Mathematics Education: Scanning and Scoping the Territory; Clarkson, P., Seah, W.T., Pang, J., Eds.; Springer International Publishing: Cham, Switzerland, 2019. [Google Scholar]
  10. Chirinda, B.; Ndlovu, M.; Spangenberg, E. Teaching Mathematics during the COVID-19 Lockdown in a Context of Historical Disadvantage. Educ. Sci. 2021, 11, 177. [Google Scholar] [CrossRef]
  11. O’Sullivan, C.; an Bhaird, C.M.; Fitzmaurice, O.; Ní Fhloinn, E. An Irish Mathematics Learning Support. Network (IMLSN) Report on Student Evaluation of Mathematics Learning Support: Insights from a Large Scale Multi-Institutional Survey; Technical Report for National Centre for Excellence in Mathematics and Science Teaching and Learning (NCE-MSTL): Limerick, Ireland, September 2014. [Google Scholar]
  12. Alabdulaziz, M.S. COVID-19 and the use of digital technology in mathematics education. Educ. Inf. Technol. 2021, 1–25. [Google Scholar] [CrossRef]
  13. Kalogeropoulos, P.; Roche, A.; Russo, J.; Vats, S.; Russo, T. Learning Mathematics From Home During COVID-19: Insights from Two Inquiry-Focussed Primary Schools. Eurasia J. Math. Sci. Technol. Educ. 2021, 17, em1957. [Google Scholar] [CrossRef]
  14. Almarashdi, H.; Jarrah, A.M. Mathematics Distance Learning amid the COVID-19 Pandemic in the UAE: High School Students’ Perspectives. Int. J. Learn. Teach. Educ. Res. 2021, 20, 292–307. [Google Scholar] [CrossRef]
  15. Fitzmaurice, O.; Fhloinn, E.N. Alternative mathematics assessment during university closures due to COVID-19. Ir. Educ. Stud. 2021, 40, 187–195. [Google Scholar] [CrossRef]
  16. Hodgen, J.; Taylor, B.; Jacques, L.; Tereshchenko, A.; Kwok, R.; Cockerill, M. Remote Mathematics Teaching during COVID-19: Intentions, Practices and Equity; UCL Institute of Education: London, UK, 2020. [Google Scholar]
  17. Rey Lopez, S.; Bruun, G.R.; Mader, M.J.; Reardon, R.F. The Pandemic Pivot: The Impact of COVID-19 on Mathematics and Statistics Post-Secondary Educators. Int. J. Cross-Discip. Subj. Educ. 2021, 12, 4369–4378. [Google Scholar]
  18. Karmila, D.; Putri, D.M.; Berlian, M.; Pratama, D.O.; Fatrima. The Role of Interactive Videos in Mathematics Learning Activities During the Covid-19 Pandemic. In Proceedings of the International Conference on Educational Sciences and Teacher Profession (ICETeP 2020), Bengkulu, Indonesia, 7 November 2020; Atlantis Press: Amsterdam, The Netherlands, 2021. [Google Scholar] [CrossRef]
  19. Chisadza, C.; Clance, M.; Mthembu, T.; Nicholls, N.; Yitbarek, E. Online and face-to-face learning: Evidence from students’ performance during the Covid-19 pandemic. Afr. Dev. Rev. 2021, 33, S114–S125. [Google Scholar] [CrossRef]
  20. Pócsová, J.; Mojžišová, A.; Takáč, M.; Klein, D. The Impact of the COVID-19 Pandemic on Teaching Mathematics and Students’ Knowledge, Skills, and Grades. Educ. Sci. 2021, 11, 225. [Google Scholar] [CrossRef]
  21. Borba, M.C. The future of mathematics education since COVID-19: Humans-with-media or humans-with-non-living-things. Educ. Stud. Math. 2021, 1–16. [Google Scholar] [CrossRef]
  22. Glass, J.; Sue, V. Student preferences, satisfaction, and perceived learning in an online mathematics class. MERLOT J. Online Learn. Teach. 2008, 4, 325–338. [Google Scholar]
  23. Hair, J.; Hult, G.; Ringle, C.; Sarstedt, M. A Primer on Partial Least Squares Structural Equation Modeling (PLS-SEM), 2nd ed.; Sage Publications: Southend Oaks, CA, USA, 2017. [Google Scholar]
  24. Hair, J.F.; Sarstedt, M.; Ringle, C.M.; Gudergan, S.P. Advanced Issues in Partial Least Squares Structural Equation Modeling; Sage Publications: Thousand Oaks, CA, USA, 2018. [Google Scholar]
  25. Nitzl, C. The use of partial least squares structural equation modelling (PLS-SEM) in management accounting research: Directions for future theory development. J. Account. Lit. 2016, 37, 19–35. [Google Scholar] [CrossRef]
  26. Wold, H. Estimation of principal components and related methods by iterative least squares. In Multivariate Analysis; Krishnaiah, P.R., Ed.; Academic Press: New York, NY, USA, 1966; pp. 391–420. [Google Scholar]
  27. Wold, H. Nonlinear iterative partial least squares (NIPALS) modeling: Some current developments. In Multivariate Analysis III; Krishnaiah, P.R., Ed.; Academic Press: New York, NY, USA, 1973; pp. 383–407. [Google Scholar]
  28. Hair, J.F.; Sarstedt, M.; Ringle, C.M.; Mena, J.A. An assessment of the use of partial least squares structural equation modeling in marketing research. J. Acad. Mark. Sci. 2012, 40, 414–433. [Google Scholar] [CrossRef]
  29. Sarstedt, M.; Ringle, C.M.; Smith, D.; Reams, R.; Hair, J.F. Partial least squares structural equation modeling (PLS-SEM): A useful tool for family business researchers. J. Fam. Bus. Strateg. 2014, 5, 105–115. [Google Scholar] [CrossRef]
  30. Avkiran, N.K. Rise of the Partial Least Squares Structural Equation Modeling: An Application in Banking. Handb. Healthc. Logist. 2018, 267, 1–29. [Google Scholar] [CrossRef]
  31. Romo-González, J.R.; Tarango, J.; Machin-Mastromatteo, J.D. PLS SEM, a quantitative methodology to test theoretical models from library and information science. Inf. Dev. 2018, 34, 526–531. [Google Scholar] [CrossRef]
  32. Hair, J.F.; Ringle, C.M.; Sarstedt, M. PLS-SEM: Indeed a Silver Bullet. J. Mark. Theory Pract. 2011, 19, 139–152. [Google Scholar] [CrossRef]
  33. Noetel, M.; Griffith, S.; Delaney, O.; Sanders, T.; Parker, P.; Cruz, B.D.P.; Lonsdale, C. Video Improves Learning in Higher Education: A Systematic Review. Rev. Educ. Res. 2021, 91, 204–236. [Google Scholar] [CrossRef]
  34. Commission of the European Communities. The eLearning Action Plan. Designing Tomorrow’s Education; Commission of the European Communities: Brussels, Belgium, 2001. [Google Scholar]
  35. Aelterman, N.; Vansteenkiste, M.; Haerens, L.; Soenens, B.; Fontaine, J.R.J.; Reeve, J. Toward an integrative and fine-grained insight in motivating and demotivating teaching styles: The merits of a circumplex approach. J. Educ. Psychol. 2019, 111, 497–521. [Google Scholar] [CrossRef]
  36. McNulty, J.A.; Hoyt, A.; Chandrasekhar, A.J.; Gruener, G.; Price, R., Jr.; Naheedy, R. A Three-year Study of Lecture Multimedia Utilization in the Medical Curriculum: Associations with Performances in the Basic Sciences. Med. Sci. Educ. 2011, 21, 29–36. [Google Scholar] [CrossRef]
  37. Ibarra-Sáiz, M.S.; Rodríguez-Gómez, G. Evaluating Assessment. Validation with PLS-SEM of ATAE Scale for the Analysis of Assessment Tasks. Relieve Rev. ELectrón. Investig. EVal. Educ. 2020, 26, 6. [Google Scholar]
  38. Mayer, R.E. Cognitive Theory of Multimedia Learning. In The Cambridge Handbook of Multimedia Learning; Cambridge University Press: Cambridge, UK, 2014; pp. 31–48. [Google Scholar]
  39. Lackmann, S.; Léger, P.-M.; Charland, P.; Aubé, C.; Talbot, J. The Influence of Video Format on Engagement and Performance in Online Learning. Brain Sci. 2021, 11, 128. [Google Scholar] [CrossRef]
  40. Homer, B.D.; Plass, J.L.; Blake, L. The effects of video on cognitive load and social presence in multimedia-learning. Comput. Hum. Behav. 2008, 24, 786–797. [Google Scholar] [CrossRef]
  41. Korving, H.; Hernández, M.; de Groot, E. Look at me and pay attention! A study on the relation between visibility and attention in weblectures. Comput. Educ. 2016, 94, 151–161. [Google Scholar] [CrossRef]
  42. Wang, J.; Antonenko, P.D. Instructor presence in instructional video: Effects on visual attention, recall, and perceived learning. Comput. Hum. Behav. 2017, 71, 79–89. [Google Scholar] [CrossRef] [Green Version]
  43. Ilioudi, C.; Giannakos, M.N.; Chorianopoulos, K. Investigating Differences among the Commonly Used Video Lecture Styles. CEUR Workshop Proc. 2013, 983, 21–26. [Google Scholar] [CrossRef]
  44. Al-Samarrie, H. A Scoping Review of Videoconferencing Systems in Higher Education: Learning Paradigms, Opportunities, and Challenges. Int. Rev. Res. Open Distrib. Learn. 2019, 20, 121–140. [Google Scholar]
  45. Moore, W.A.; Smith, A.R. Effects of video podcasting on psychomotor and cognitive performance, attitudes and study behaviour of student physical therapists. Innov. Educ. Teach. Int. 2012, 49, 401–414. [Google Scholar] [CrossRef]
  46. Koumi, J. Potent Pedagogic Roles for Video. Available online: http://association.media-and-learning.eu/portal/resource/potent-pedagogic-roles-video (accessed on 5 August 2021).
  47. Woolfitt, Z. The Effective Use of Videos in Medical Education. Acad. Med. 2015, 1, 45. [Google Scholar]
  48. Miner, S.; Stefaniak, J.E. Learning via video in higher education: An exploration of instructor and student perceptions. J. Univ. Teach. Learn. Pract. 2018, 15, 2. [Google Scholar]
  49. Means, B.; Toyama, Y.; Murphy, R.; Baki, M. The effectiveness of online and blended learning: A meta-analysis of the empirical literature. Teach. Coll. Rec. 2013, 115, 030303. [Google Scholar]
  50. Entwistle, N.; McArthur, J. Perceptions of assessment and their influences on learning. In Advances and Innovations in University Assessment and Feedback; Edinburgh UP: Edinburgh, UK, 2014. [Google Scholar]
  51. O’Donovan, B. How student beliefs about knowledge and knowing influence their satisfaction with assessment and feedback. High. Educ. 2016, 74, 617–633. [Google Scholar] [CrossRef]
  52. Moreno-Guerrero, A.J.; Aznar-Díaz, I.; Cáceres-Reche, P.; Alonso-García, S. E-learning in the teaching of mathematics: An educational experience in adult high school. Mathematics 2020, 8, 840. [Google Scholar] [CrossRef]
  53. Dede, C. Emerging influences of information technology on school curriculum. J. Curric. Stud. 2000, 32, 281–303. [Google Scholar] [CrossRef]
  54. Veerman, A.; Veldhuis-Diermanse, E. Collaborative learning through computer-mediated communication in academic education. Euro CSCL 2001, 2001, 625–632. [Google Scholar]
  55. Warni, S.; Aziz, T.A.; Febriawan, D. The use of technology in English as a foreign language learning outside the classroom: An insight into learner autonomy. LLT J. 2018, 21, 148–156. [Google Scholar]
  56. Poot, R.; de Kleijn, R.A.M.; van Rijen, H.V.M.; van Tartwijk, J. Students generate items for an online formative assessment: Is it motivating? Med. Teach. 2017, 39, 315–320. [Google Scholar] [CrossRef] [Green Version]
  57. Liaw, S.-S.; Huang, H.-M.; Chen, G.-D. Surveying instructor and learner attitudes toward e-learning. Comput. Educ. 2007, 49, 1066–1080. [Google Scholar] [CrossRef]
  58. Akugizibwe, E.; Ahn, J.Y. Perspectives for effective integration of e-learning tools in university mathematics instruction for developing countries. Educ. Inf. Technol. 2019, 25, 889–903. [Google Scholar] [CrossRef] [Green Version]
  59. García Pujals, A. The effect of formative assessment and instructional feedback on perception of learning, autonomy and motivation of German students of Spanish as a foreign language: A didactic proposal. Ph.D. Thesis, University of the Basque Country, Biscay, Spain, 14 June 2019. Available online: https://addi.ehu.es/handle/10810/35325 (accessed on 5 August 2021).
  60. Zhang, Y.G.; Dang, M.Y. Understanding Essential Factors in Influencing Technology-Supported Learning: A Model toward Blended Learning Success. J. Inf. Technol. Educ. Res. 2020, 19, 489–510. [Google Scholar] [CrossRef]
  61. Wongwatkit, C.; Panjaburee, P.; Srisawasdi, N.; Seprum, P. Moderating effects of gender differences on the relationships between perceived learning support, intention to use, and learning performance in a personalized e-learning. J. Comput. Educ. 2020, 7, 229–255. [Google Scholar] [CrossRef]
  62. Strelan, P.; Osborn, A.; Palmer, E. The flipped classroom: A meta-analysis of effects on student performance across disciplines and education levels. Educ. Res. Rev. 2020, 30, 100314. [Google Scholar] [CrossRef]
  63. Vo, H.M.; Zhu, C.; Diep, A.N. The effect of blended learning on student performance at course-level in higher education: A meta-analysis. Stud. Educ. Eval. 2017, 53, 17–28. [Google Scholar] [CrossRef]
  64. Van Alten, D.C.D.; Phielix, C.; Janssen, J.; Kester, L. Effects of flipping the classroom on learning outcomes and satisfaction: A metaanalysis. Educ. Res. Rev. 2019, 28, 1–18. [Google Scholar] [CrossRef]
  65. Spanjers, I.A.; Könings, K.; Leppink, J.; Verstegen, D.M.; de Jong, N.; Czabanowska, K.; van Merriënboer, J.J. The promised land of blended learning: Quizzes as a moderator. Educ. Res. Rev. 2015, 15, 59–74. [Google Scholar] [CrossRef]
  66. Müller, C.; Mildenberger, T. Facilitating Flexible Learning by Replacing Classroom Time with an Online Learning Environment: A Systematic Review of Blended Learning in Higher Education. Educ. Res. Rev. 2021, 34, 100394. [Google Scholar] [CrossRef]
  67. Valls Martínez, M.C.; Cruz Rambaud, S.; Muñoz Torrecillas, M.J.; Ramírez Orellana, A.; García Pérez, J. Presentaciones interactivas y videotutoriales en asignaturas de Finanzas y Contabilidad. In VII Memoria Sobre Innovación Docente en la University of Almería (Curso Académico 2012–2013); Universidad de Almería, Servicio de Publicaciones: Almería, Spain, 2014. [Google Scholar]
  68. Ringle, C.M.; Wende, S.; Becker, J.-M. SmartPLS 3; SmartPLS GmbH: Boenningstedt, Germany, 2015; Available online: http://www.smartpls.com (accessed on 5 August 2021).
  69. Davison, A.C.; Hinkley, D.V. Bootstrap Method and Their Application; Cambridge University Press: Cambridge, UK, 1997. [Google Scholar]
  70. Efron, B.; Tibshirani, R. Bootstrap Methods for Standard Errors, Confidence Intervals, and Other Measures of Statistical Accuracy. Stat. Sci. 1986, 1, 54–75. [Google Scholar] [CrossRef]
  71. Debashis, K. Bootstrap Methods and Their Application. Tecnnometrics 2000, 42, 216–217. [Google Scholar]
  72. Sarstedt, M.; Ringle, C.M.; Hair, J.F. Partial least squares structural equation modeling. In Handbook of Market Research; Homburg, C., Klarmann, M., Vomberg, A., Eds.; Springer: Cham, Switzerland, 2017. [Google Scholar]
  73. Henseler, J.; Hubona, G.; Ray, P.A. Using PLS path modeling in new technology research: Updated guidelines. Ind. Manag. Data Syst. 2016, 116, 2–20. [Google Scholar] [CrossRef]
  74. Henseler, J. On the convergence of the partial least squares path modeling algorithm. Comput. Stat. 2009, 25, 107–120. [Google Scholar] [CrossRef] [Green Version]
  75. Dijkstra, T.K.; Henseler, J. Consistent Partial Least Squares Path Modeling. MIS Q. 2015, 39, 297–316. [Google Scholar] [CrossRef]
  76. Henseler, J.; Ringle, C.M.; Sarstedt, M. A new criterion for assessing discriminant validity in variance-based structural equation modeling. J. Acad. Mark. Sci. 2015, 43, 115–135. [Google Scholar] [CrossRef] [Green Version]
  77. Hair, J.F.; Risher, J.J.; Sarstedt, M.; Ringle, C.M. When to use and how to report the results of PLS-SEM. Eur. Bus. Rev. 2019, 31, 2–24. [Google Scholar] [CrossRef]
  78. Reinartz, W.; Haenlein, M.; Henseler, J. An empirical comparison of the efficacy of covariance-based and variance-based SEM. Int. J. Res. Mark. 2009, 26, 332–344. [Google Scholar] [CrossRef] [Green Version]
  79. Faul, F.; Erdfelder, E.; Buchner, A.; Lang, A.-G. Statistical power analyses using G*Power 3.1: Tests for correlation and regression analyses. Behav. Res. Methods 2009, 41, 1149–1160. [Google Scholar] [CrossRef] [Green Version]
  80. Carmines, E.G.; Zeller, R.A. Reliability and Validity Assessment; Sage Publications: London, UK, 1979. [Google Scholar]
  81. Werts, C.E.; Linn, R.L.; Jöreskog, K.G. Interclass Reliability Estimates: Testing Structural Assumptions. Educ. Psychol. Meas. 1974, 34, 25–33. [Google Scholar] [CrossRef]
  82. Nunnally, J.; Bernstein, I.H. Psychometric Theory, 3rd ed.; McGraw-Hill: New York, NY, USA, 1994. [Google Scholar]
  83. Fornell, C.; Larcker, D.F. Evaluating structural equation models with unobservable variables and measurement error. J. Mark. Res. 1981, 18, 39–50. [Google Scholar] [CrossRef]
  84. Diamantopoulos, A.; Siguaw, J.A. Formative Versus Reflective Indicators in Organizational Measure Development: A Comparison and Empirical Illustration. Br. J. Manag. 2006, 17, 263–282. [Google Scholar] [CrossRef]
  85. Kock, N. One-Tailed or Two-Tailed P Values in PLS-SEM? Int. J. e-Collab. 2015, 11, 1–7. [Google Scholar] [CrossRef]
  86. Streukens, S.; Leroi-Werelds, S. Bootstrapping and PLS-SEM: A step-by-step guide to get more out of your bootstrap results. Eur. Manag. J. 2016, 34, 618–632. [Google Scholar] [CrossRef]
  87. Chin, X.W. The partial least squares approach to structural equation modeling. In Modern Methods for Business Research; Marcoulides, G., Ed.; Lawrence Erlbaum Associates: London, UK, 1998. [Google Scholar]
  88. Cohen, J. Statistical Power Analysis for the Behavioral Sciences, 2nd ed.; Routledge Academic: New York, NY, USA, 1988. [Google Scholar]
  89. Shmueli, G.; Ray, S.; Estrada, J.M.V.; Chatla, S.B. The elephant in the room: Predictive performance of PLS models. J. Bus. Res. 2016, 69, 4552–4564. [Google Scholar] [CrossRef]
  90. Busto, S.; Dumbser, M.; Gaburro, E. A Simple but Efficient Concept of Blended Teaching of Mathematics for Engineering Students during the COVID-19 Pandemic. Educ. Sci. 2021, 11, 56. [Google Scholar] [CrossRef]
  91. Anggraini, T.W.; Mahmudi, A. Exploring the students’ adversity quotient in online mathematics learning during the Covid-19 pandemic. J. Res. Adv. Math. Educ. 2021, 6, 221–238. [Google Scholar] [CrossRef]
  92. Cassibba, R.; Ferrarello, D.; Mammana, M.F.; Musso, P.; Pennisi, M.; Taranto, E. Teaching Mathematics at Distance: A Challenge for Universities. Educ. Sci. 2020, 11, 1. [Google Scholar] [CrossRef]
  93. Fakhrunisa, F.; Prabawanto, S. Online Learning in COVID-19 Pandemic: An Investigation of Mathematics Teachers’ Perception. In Proceedings of the 2020 The 4th International Conference on Education and E-Learning, Yamanashi, Japan, 6–8 November 2020; pp. 207–213. [Google Scholar]
  94. Hidayah, I.N.; Sa’Dijah, C.; Subanji, S. The students’ cognitive engagement in online mathematics learning in the pandemic Covid-19 era. In Proceedings of the 4th International Conference on Mathematics and Science Education (ICoMSE) 2020: Innovative Research in Science and Mathematics Education in The Disruptive Era, Malang, Indonesia, 25–26 August 2021. [Google Scholar]
  95. Libasin, Z.; Azudin, A.R.; Idris, N.A.; Rahman, M.S.A.; Umar, N. Comparison of Students’ Academic Performance in Mathematics Course with Synchronous and Asynchronous Online Learning Environments during COVID-19 Crisis. Int. J. Acad. Res. Prog. Educ. Dev. 2021, 10, 492–501. [Google Scholar]
  96. Mohammadi, M.K.; Mohibbi, A.A.; Hedayati, M.H. Investigating the challenges and factors influencing the use of the learning management system during the Covid-19 pandemic in Afghanistan. Educ. Inf. Technol. 2021, 26, 5165–5198. [Google Scholar] [CrossRef] [PubMed]
  97. Kamsurya, R. Learning Evaluation of Mathematics during the Pandemic Period COVID-19 in Jakarta. Int. J. Pedagog. Dev. Lifelong Learn. 2020, 1, ep2008. [Google Scholar] [CrossRef]
  98. Yohannes, Y.; Juandi, D.; Diana, N.; Sukma, Y. Mathematics Teachers’ Difficulties in Implementing Online Learning during the COVID-19 Pandemic. J. Hunan Univ. Nat. Sci. 2021, 48, 1–12. [Google Scholar]
  99. Wardani, E.R.; Mardiyana; Saputro, D.R.S. Online Mathematics Learning during the Covid-19 Pandemic. J. Phys. Conf. Ser. 2021, 1808, 012044. [Google Scholar] [CrossRef]
  100. ECLAC-UNESCO. Education in the Time of COVID-19. Available online: https://repositorio.cepal.org/bitstream/handle/11362/45905/1/S2000509_en.pdf (accessed on 5 August 2021).
  101. Lockee, B.B. Online education in the post-COVID era. Nat. Electron. 2021, 4, 5–6. [Google Scholar] [CrossRef]
Figure 1. Research model and hypotheses. C: Challenge, U: Usage, E: Effectiveness, F: Format, D: Depth, A: Autonomy.
Mathematics 09 02120 g001
Figure 2. Model results.
Mathematics 09 02120 g002
Table 1. Constructs and indicators.
ConstructIndicatorDescription
Autonomy
(Formative)
A1Video tutorials favour my autonomous learning
A2Video tutorials help me to manage my study time better
A3Video tutorials allow me to solve doubts without the need to attend face-to-face tutorials
Usage
(Formative)
U1The time I have spent studying with the video tutorials has been sufficient and suitable
U2I feel that I have spent more time than my peers studying with the video tutorials
Challenge
(Formative)
C1Video tutorials help me to establish meaningful relationships between the different parts of the subject matter
C2Video tutorials help me to coordinate the activities to be developed to achieve effective learning of the concepts
C3Video tutorials help me look for solutions or alternative perspectives
C4Video tutorials help me to be more creative in finding solutions
Effectiveness
(Reflective)
E1Video tutorials help learn the subject
E2Video tutorials have helped me to know the subject better
E3Video tutorials have helped me to save time in the study of the subject
Depth
(Formative)
D1Video tutorials help me use questioning and research methods
D2Video tutorials help me gain a deeper understanding of fundamental concepts and ideas
D3Video tutorials help me to relate the fundamental concepts of the subject
D4Video tutorials help me develop reflective and critical thinking
Format
(Formative)
F1I prefer video tutorials to be developed by several professors rather than a single professor
F2The extent of the subject matter covered in each video tutorial is adequate
F3The length of each video tutorial is adequate
F4I found the visual aspect (design, font size, etc.) of the video tutorials attractive and clear
F5I found the explanations of the video tutorials to be clear and accurate
Table 2. Likert scale.
ValueMeaning
1I fully disagree
2I quite disagree
3I disagree
4Neither agree nor disagree (neutral)
5I Agree
6I quite agree
7I fully agree
Table 3. Descriptive Statistics.
ConstructIndicatorMeanStandard DeviationMinimumMaximum
Autonomy
(Formative)
A14.9821.39517
A24.7661.57117
A34.2161.36517
Usage
(Formative)
U14.5681.31317
U23.9371.24717
Challenge
(Formative)
C14.9431.26217
C24.8111.34617
C34.6491.20517
C44.4231.39917
Effectiveness
(Reflective)
E15.1441.32117
E24.9011.34217
E34.3601.55317
Depth
(Formative)
D14.2611.25017
D24.6221.44017
D35.0541.18427
D44.5771.22017
Format
(Formative)
F14.3421.67917
F25.0361.28727
F34.9371.23217
F45.6221.16337
F55.0541.19927
Sample size: 111 interviews.
Table 4. Valuation of the Measurement Model.
Panel A. Reflective Construct (Effectiveness)
Panel A1. Outer Loadings
IndicatorLoading (λ)CI 2.5%CI 97.5%p-Value
E10.8700.8080.9130.000
E20.8630.7950.9130.000
E30.8160.7350.8710.000
Panel A2. Construct Reliability and Average Variance Extracted
CriterionValueCI 2.5%CI 97.5%p-Value
Cronbach’s Alpha0.8070.7340.8600.000
Dijkstra–Henseler’s Rho0.8090.7390.8640.000
Composite Reliability0.8860.8490.9150.000
AVE0.7220.6530.7820.000
Panel A3. Discriminant Validity (Fornell-Larcker Criterion)
ConstructAutonomyChallengeDepthEffectiv.FormatUsage
Challenge0.739n.a.
Depth0.7510.751n.a.
Effectiveness0.8260.7250.7460.850
Format0.7840.6930.6490.696n.a.
Usage0.4470.4480.4920.5370.298n.a.
Panel B. Formative Constructs
ConstructIndicatorVIFWeightCI 2.5%CI 97.5%t-Stat.Loading
AutonomyA11.670.487 ***0.3160.6445.7460.878 **
A21.360.406 ***0.2500.5694.9660.766 **
A31.350.359 ***0.2000.5044.6520.730 **
UsageU11.190.910 ***0.6471.0598.3860.986 **
U21.190.185 ns−0.1890.5460.9830.556 **
ChallengeC11.770.472 ***0.2450.6804.2610.876 **
C21.950.573 ***0.3540.7635.5400.919 **
C31.890.048 ns−0.2030.2920.3770.608 **
C42.040.047 ns−0.2020.2980.3670.646 **
DepthD11.720.376 ***0.1650.6053.3350.687 **
D21.730.245 **0.0070.4452.2010.727 **
D31.690.508 ***0.3120.7284.7880.807 **
D41.810.223 **0.0200.4062.2390.684 **
FormatF11.120.035 ns−0.1200.1810.4570.236 *
F21.580.353 ***0.0840.5932.6860.744 **
F31.600.005 ns−0.2130.2380.0430.534 **
F41.35−0.096 ns−0.2910.0990.9550.388 **
F51.790.807 ***0.5660.9827.5850.945 **
n.a. denotes not applicable; ns denotes not significant; * p-value < 0.10; ** p-value < 0.05; *** p-value < 0.01.
Table 5. Valuation of the Structural Model.
Panel A. Direct Effects
PathtCI 5%CI 95%f2VIF
Challenge → Autonomy0.093 ns1.040−0.0530.2400.0142.930
Depth → Autonomy0.162 **2.1030.0420.2950.0432.894
Effectiveness → Autonomy0.406 ***3.5220.2280.6090.2662.909
Format → Autonomy0.332 ***3.4300.1610.4790.2242.300
Challenge → Effectiveness0.195 **1.9710.0400.3660.0432.831
Depth → Effectiveness0.298 ***3.2380.1370.4390.1062.680
Format → Effectiveness0.304 ***3.4850.1680.4550.1422.096
Usage → Effectiveness0.213 ***2.8350.0880.3380.1081.358
Panel B. Indirect Effects
EffecttCI 5%CI 95%
Challenge → Autonomy0.079 *1.5460.0130.180
Depth → Autonomy0.121 ***2.5220.0470.202
Format → Autonomy0.124 **2.1820.0500.234
Usage → Autonomy0.087 ***2.7720.0350.138
Panel C. Total Effects
EffecttCI 5%CI 95%
Challenge → Autonomy0.172 **1.9560.0330.323
Depth → Autonomy0.283 ***3.7250.1630.410
Effectiveness → Autonomy0.406 ***3.5220.2280.609
Format → Autonomy0.455 ***6.0550.3290.578
Usage → Autonomy0.087 ***2.7720.0350.138
Challenge → Effectiveness0.195 **1.9710.0400.366
Depth → Effectiveness0.298 ***3.2380.1370.439
Format → Effectiveness0.304 ***3.4850.1680.455
Usage → Effectiveness0.213 ***2.8350.0880.338
* p-value < 0.10; ** p-value < 0.05; *** p-value < 0.01; ns denotes not significant.
Table 6. Decomposition of the explained variance.
Dependent VariableR2Antecedents VariablesPath CoefficientsCorrelationsExplained Variance
Autonomy0.786Challenge0.0930.7390.069
Depth0.1620.7510.122
Effectiveness0.4060.8260.336
Format0.3320.7840.260
Effectiveness0.690Challenge0.1950.7250.142
Depth0.2980.7460.222
Format0.3040.6960.212
Usage0.2130.5370.114
Table 7. PLS predict valuation.
Panel A. Construct Prediction Summary
Q2
Autonomy0.669
Effectiveness0.631
Panel B. Indicator Prediction Summary
PLSLMPLS-LM
RMSEMAEQ2RMSEMAEQ2RMSEMAEQ2
A10.9910.7660.5021.0950.8540.393−0.104−0.0880.109
A21.2851.0520.3421.4331.1420.182−0.148−0.0900.160
A31.0540.8660.4191.2500.9940.182−0.196−0.1280.237
E10.9830.6870.4601.0680.7820.363−0.085−0.0950.097
E20.9900.7720.4671.0730.8550.373−0.083−0.0830.094
E31.1840.9710.4311.2911.0140.324−0.107−0.0430.107
PLS: Partial Least Squares Path Model; LM: Linear Regression Model; RMSE: Root Mean Squared Error; MAE: Mean Absolute Error.
Publisher’s Note: MDPI stays neutral with regard to jurisdictional claims in published maps and institutional affiliations.

