
A Fuzzy Inference System for Management Control Tools


1
Departamento de Administración, Facultad de administración y Economía, Universidad de Santiago de Chile (USACH), Santiago 9170022, Chile
2
Escuela de Auditoría, Universidad de Valparaíso, Valparaiso 2362700, Chile
3
Facultat d’Economia i Empresa, Universitat de Barcelona, 08034 Barcelona, Spain
*
Author to whom correspondence should be addressed.
Mathematics 2021, 9(17), 2145; https://0-doi-org.brum.beds.ac.uk/10.3390/math9172145
Submission received: 4 August 2021
/
Revised: 25 August 2021
/
Accepted: 29 August 2021
/
Published: 2 September 2021
(This article belongs to the Special Issue Fuzzy Logic and Soft Computing – Dedicated to the Centenary of the Birth of Lotfi A. Zadeh (1921-2017))
Abstract
:Despite the importance of the role of small and medium enterprises (SMEs) in developing and growing economies, little is known regarding the use of management control tools in them. In management control in SMEs, a holistic system needs to be modeled to enable a careful study of how each lever (belief systems, boundary systems, interactive control systems, and diagnostic control systems) affects the organizational performance of SMEs. In this article, a fuzzy logic approach is proposed for the decision-making system in management control in small and medium enterprises. C. Mamdani fuzzy inference system (MFIS) was applied as a decision-making technique to explore the influence of the use of management control tools on the organizational performance of SMEs. Perceptions data analysis is obtained through empirical research.
1. Introduction
On the one hand, according to the fifth longitudinal survey of companies of the Chilean Ministry of Economy, small companies are extremely important for the national economy, as they represent 52.5% of all companies and employ 38.7% of all workers. These companies have many problems, often lacking the time, resources, or necessary information to deal with organizational performance [1].
On the other hand, management control is the process that managers use to aid the decision-making of the members within an organization. This eases the application and alignment of chosen strategies in the organization, thus achieving the pre-established objectives and benefiting the overall performance of the company [2,3,4].
Notwithstanding, the international literature recognizes that management control tools are fundamental for the efficient and effective management of any business [5], while information and planning systems are useful tools to obtain corporate strategic objectives [6]. When they are met, the goals and reason of existence of companies are achieved, making them an important aspect of improving organizational performance [4,5,7,8].
Besides, evidence shows that the level of use of financial management tools directly affects performance, with the most common ones (according to literature, and interpreted as levers) being budget, long-term planning, support systems for decision making, and financial and non-financial performance [7,8]. There is limited literature regarding the existence of a holistic system that aggregates all these tools, which would allow for the careful study on how each lever (pack of tools) affects the organizational performance of SMEs (Small and Medium-sized companies). In addition, there are limited empirical studies based on scientific data that examine how financial management practices affect SMEs [9]. Nonetheless, existing literature shows a positive outcome of the use of management control tools in SMEs to maximize opportunities, operational efficiency, profit, reliability of administrative information, and finances [10].
The purpose of this investigation is to explore the influence of the use of management control tools on the organizational performance of SMEs. According to the latter, the question of this research is: How do we apply an MFIS in Management Control Tools? What is the degree of use of each control lever in Chilean SMEs?
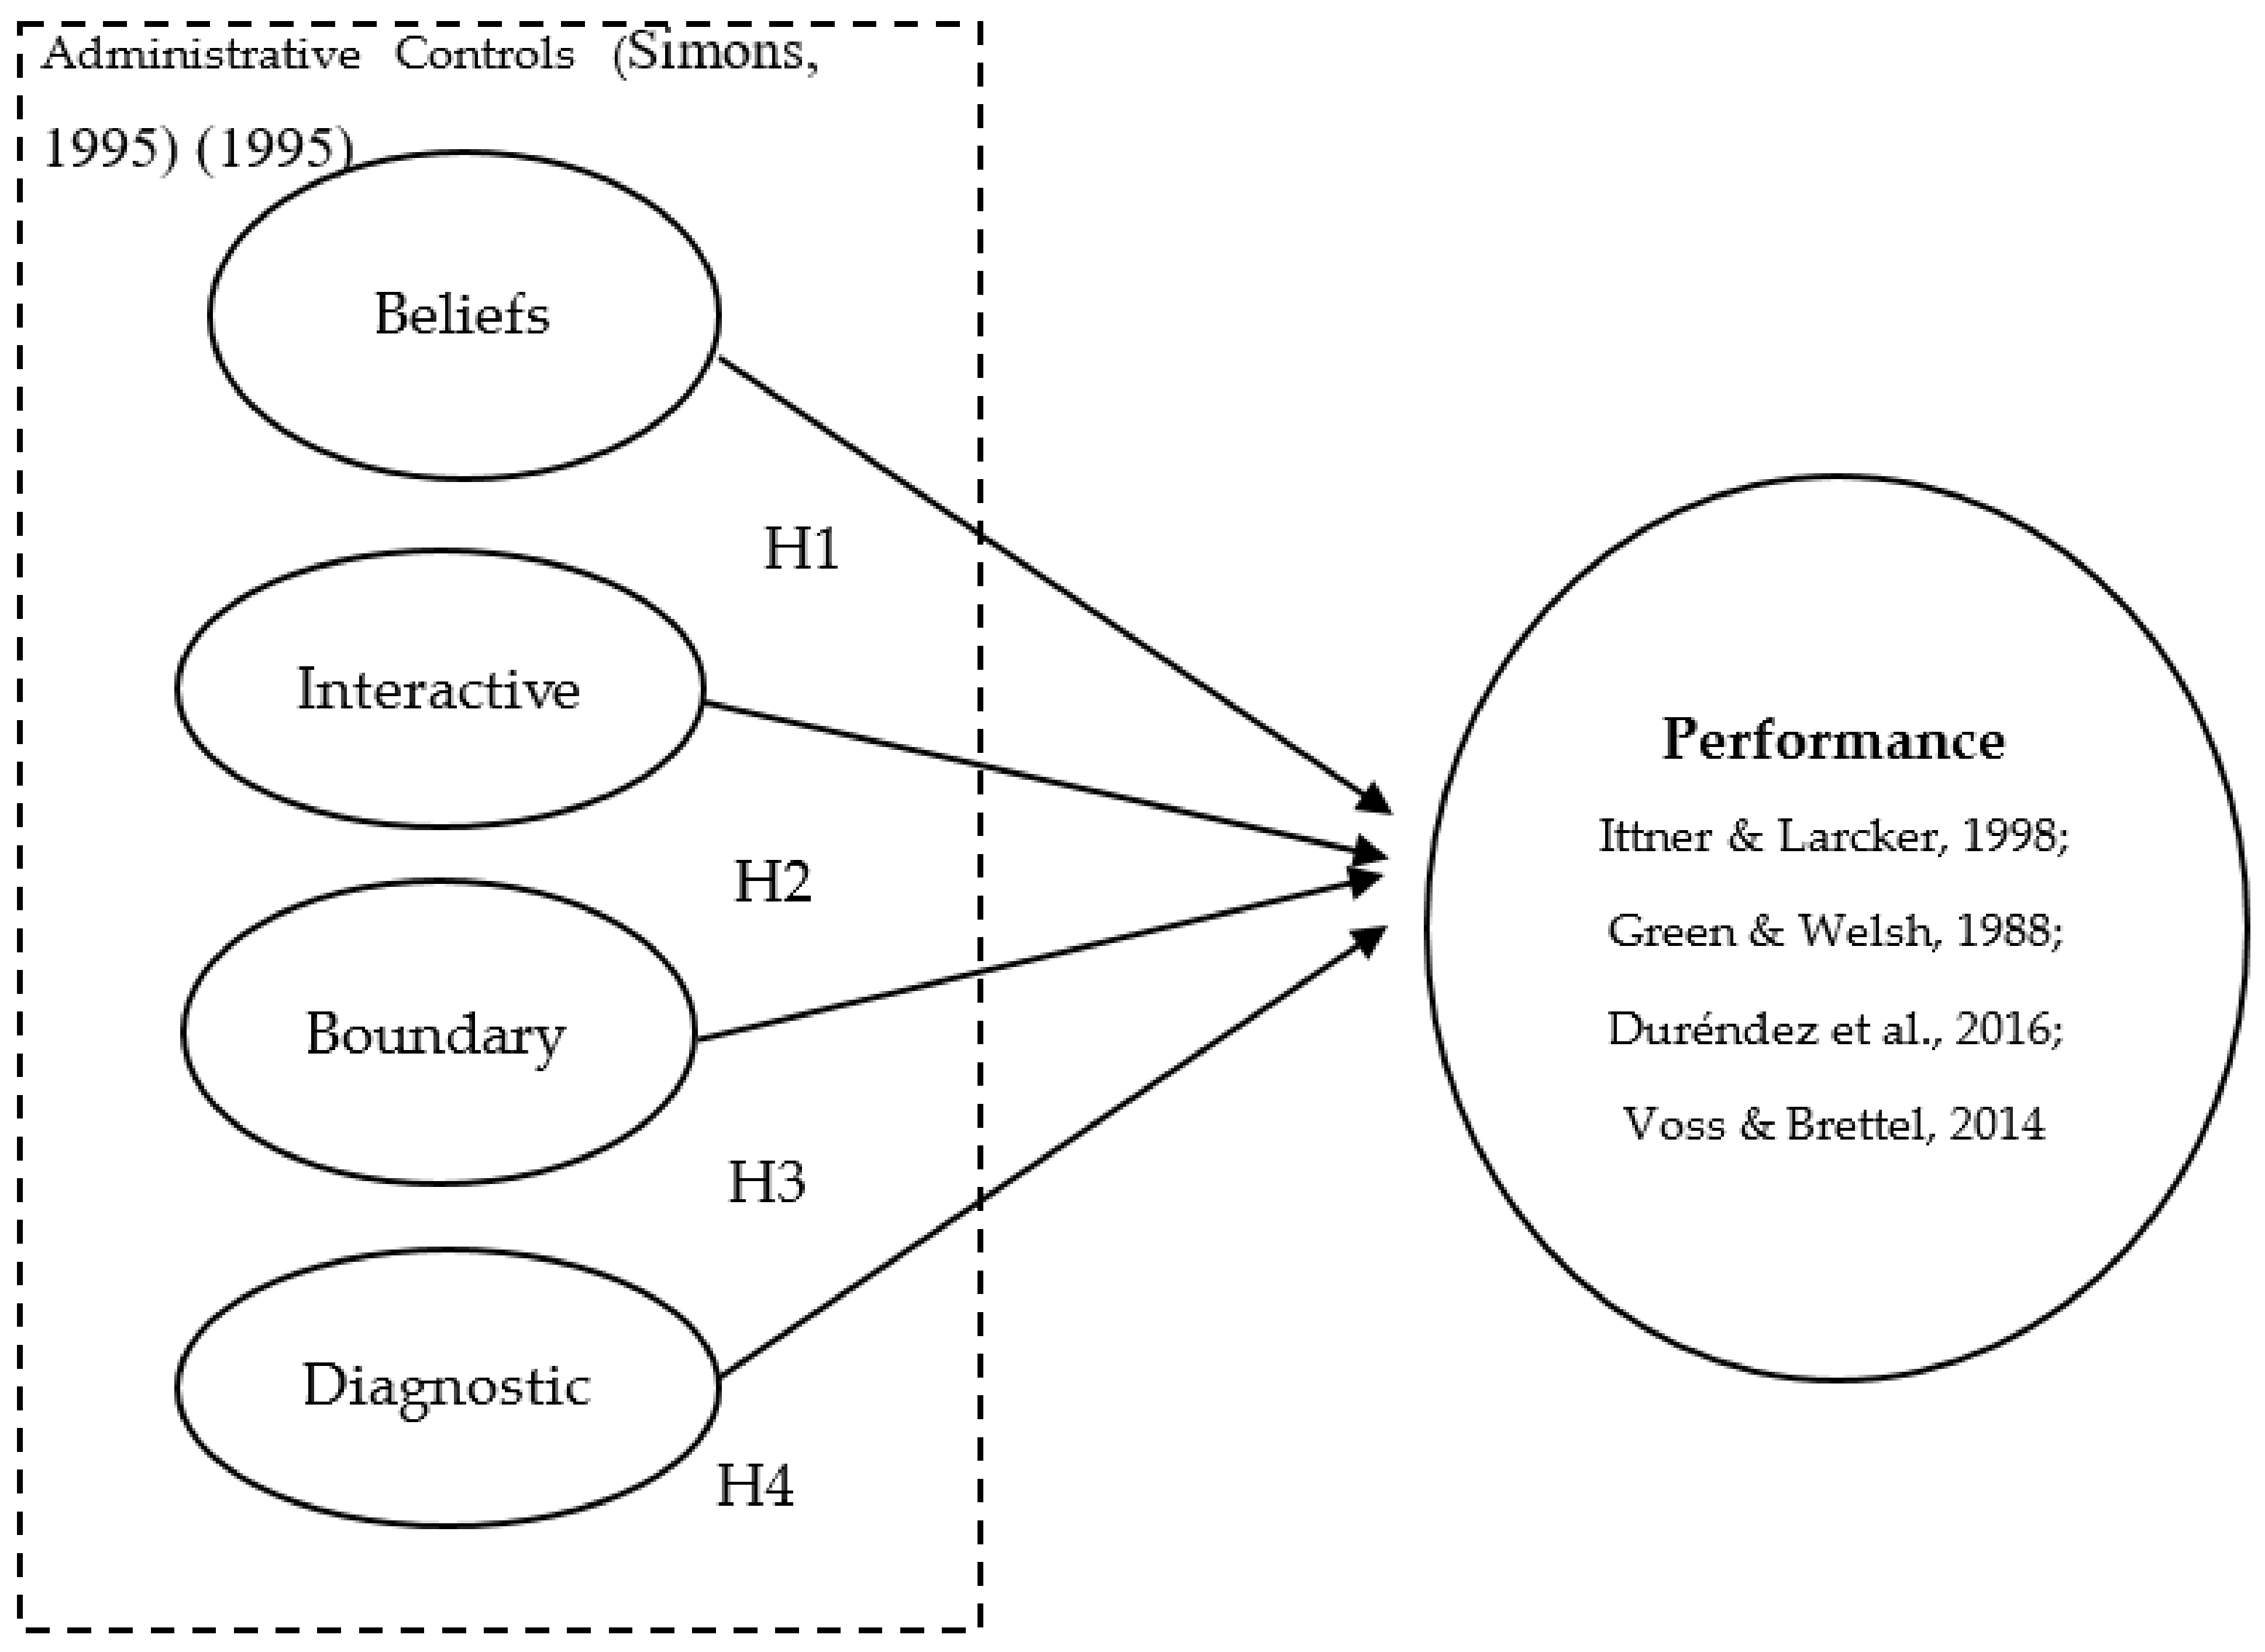
The present research explores, for the first time, the use of four levers of management control tools in SMEs (belief systems, boundary systems, interactive control systems, and diagnostic control systems) [11]. The individual influence of each of these tools on performance make up the four hypotheses of the research:
Hypothesis 1 (H1).
The beliefs lever is present as a management control tool in SMEs.
Hypothesis 2 (H2).
The boundary lever is present as a management control tool in SMEs.
Hypothesis 3 (H3).
The diagnostics control lever is present as a management control tool in SMEs.
Hypothesis 4 (H4).
The interactive control lever is present as a management control tool in SMEs.
The methodological approach taken in this study is a mixed methodology based on factorial analysis and Mamdani fuzzy inference system (MFIS). This fuzzy model is built around the MATLAB Software and its Fuzzy Logic Toolbox. The investigation is empirically applied in Chile, and the proposed fuzzy model is used to evaluate the degree of presence of these levers in SMEs, as well as their relationship with the levels of financial and non-financial performance.
Fuzzy inference systems (FIS) are methodologies that express knowledge and inaccurate data; in Web of Science, there are 1,314 records on the topic. FIS are studied mainly in computer science artificial intelligence (27%), electrical electronic engineering (20%), interdisciplinary computer science applications (10%), and others ( 43%). The authors with the highest number of publications are P. Melin, O. Castillo, and O. Kisi (Web of Science).
Mamdani fuzzy inference system (MFIS) shows 92 records on the topic; the main areas studied are computer science artificial intelligence (25%), electrical electronic engineering (15%), computer science theory methods (12%), environmental sciences (12%), and applied mathematics (12%). The authors with the highest number of publications in mathematics categories are B. Jayaram and M. Stepnicka (Web of Science).
Unlike other studies that apply MFIS in management, this paper proposes a diagnostic model of the four levers of management control in a holistic view; other studies are focused on customer requests or specific tools, such as the Balanced Scorecard (BSC) [12].
The importance and originality of this study are that it explores and applies the fuzzy inference system with linguistic control rules to measure the use of the management control tools in SMEs and their relationship with financial and non-financial performance. Mamdani’s fuzzy inference system is advantageous for this study since it is intuitive, well-suited to human inputs, more interpretable and rule-based, and has widespread acceptance [13].
This study contributes to management control field and SMEs, which are companies that have survived the start-up stage and they are currently in the positioning and growth stages [14]. In addition, as established at the beginning, these companies are important for the national economy since they provide many jobs. From the area of management control, we can help them to continue growing by supporting them in understanding the importance of applying certain management control tools. Furthermore, this type of research helps other SMEs incorporate management tools in order to improve their organizational performance. It must also be noted that similar studies elaborated in Latin America as a whole are scarce.
The main issues addressed in this paper are: Section 1 of this paper will review the literature on management control and management control research in SMEs with fuzzy logic; Section 2 gives a brief overview of the recent methodology; Section 3 presents the results of the research, focusing on the three key themes that are: Descriptive Analysis, Measurement Scale, Fuzzy Inference Systems and Parameterization of Membership Functions, Summary of Fuzzy Indicators; Finally, the Discussion and Conclusions are presented.
2. Literature Review
Various studies identify the structural weaknesses of SMEs regarding their lack in the use of tools to create strategies that can manage projects in the medium and long term [6,7,9,10]. In addition, their methods in management control, administration, finances, accounting, and operations are done in an informal and intuitive manner, disregarding the use of decision-making tools. This is because many of them are created by the experience of staff who have worked in other companies, thus bringing with them technical but not administrative knowledge [15]. In retrospect, SMEs usually lack time, resources, or necessary information (or the skill set required to collect and evaluate this information) to measure organizational performance [1].
However, SMEs possess crucial competitive advantages: (1) Their size allows them to respond rapidly to changes in their environment, easing their integration into the productive chain, (2) They tend to be efficient providers of intermediate or final goods and services. They do, however, have the following disadvantages: (1) They are vulnerable to recessive cycles and slow economic growth, (2) They cannot surpass technical and non-technical barriers of market entry on their own, (3) They are unable to develop barriers to protect their income in specific market segments and niches [16].
2.1. Management Control
Management control is the process that managers use to aid the decision-making of the members within an organization. This eases the application and alignment of chosen strategies on the organization, thus achieving the pre-established objectives and benefiting the firm’s overall performance [2,3,4]. Management control systems influence human behavior so that they are aligned to the goals, i.e., companies ensure that the individual’s actions to achieve personal goals are aligned with the institution’s corporate goals [17].
Among the various management control models, the most prominent ones are the closed cycle model from execution premium [4], which is mostly used in large and complex organizations, and the levers of control model [11], which segments management control into four levers to ensure effective management control within the organization. Diagnostics systems are used to monitor goals, which help monitor the progress of indicators, and if these are aligned with the plan, include tools such as budget, control panel, information systems, cost systems, among others. The diagnostic control by itself is not adequate to achieve effective control as tampering actions can be done to achieve objectives. This can be a risk to the organization, hence the need to couple diagnostics with other control systems [11].
Belief systems attempt to articulate organizational values with direction so that employees accomplish the objectives. They must inspire and promote behavior that aligns with the organizational values, mission, and vision [11]. In addition, boundary systems control all the behavior that workers should refrain from by defining limits and avoiding risky or negative practices (i.e., manuals, policies, contracts, documentation process, among others) [11]. Interactive control systems are used when managers obtain employee information mainly through informal means to explore the impact of certain practices, strategies, or programs to take advantage of possible opportunities. [11] Exposes the dynamic tension between the four control levers, where all must be in balance to bring forth organizational performance. Hence, there must be a holistic approach in the four levers to promote better organizational performance [11,18].
2.2. Management Control in Small and Medium Enterprises
Despite the importance of the role of SMEs in developing and growing economies, little is known regarding the use of management control tools in them [9,14], as most are used in large companies, or utilize specialized tools such as balanced scorecards and indicators to improve financial performance [18]. In addition, there is scarce research that studies management control tools as a holistic packet (which has now gained importance in the literature).
Studies regarding the influence of control tools in SMEs have mainly been elaborated in Australia, Canada, and Asia [14,19]. Research analyzing the situation in Australia, Hong Kong, Malaysia, and Singapore shows the limited use of management tools in SMEs [20]. The most utilized tools are environmental analysis tools (Strength, Weaknesses, Opportunities, Threats, Policies, Environment, Society, and Technology), forecast tools, cost-benefit tools, and budget tools.
Research reveals that the existence of control in SMEs affects different parts of the company by maximizing opportunity, operational efficiency, profit, reliability of administrative information, and finances [10]. After studying 165 industrial firms in New Zealand, [21] it was proven that applying management control improves profitability. The findings in [6] also support the idea that using management control tools has a positive impact on corporate performance, which is consistent with the literature. A study of 151 microenterprises in Malaysia discovered that performance and success in small firms are significantly affected by management initiatives [22], further adding that microenterprises should implement management training.
Medium-sized businesses use more control lever tool groups than smaller companies, which can increase their performance as indicated by the practical and theoretical hypotheses [4,11,17] and other related studies [6,10,14,20,21]. The main difference between small and medium-sized companies lies in the use of the diagnostic lever on the non-financial side (the use of strategic maps, control panel indicators, balanced scorecards, etc.). What is usually employed to plan operations from the organizational strategy [4] is coherent with the growth of companies and the literature.
There is a study elaborated by CIMA (Chartered Institute of Management Accountants) in the United Kingdom [23] that explains the practices of SMEs in the region. The results show that the use of management tools tends to be used mainly to control information rather than to make decisions. In addition, it reveals that in small companies, control tools are managed by the owners and/or managers, making it a high opportunity cost for the firm.
Literature evidence also identifies the difference in employing management control tools between family-run and non-family-run firms. In the former, management tends to use informal and subjective control systems rather than formal systems [6], largely due to the fact that family-SMEs also possess non-economic objectives. The theory also suggests that family-run businesses are based on goals that surpass financial aims, focusing on non-financial goals which influence the control methods that they employ [23]. Further evidence shows that control systems in family-run firms are mostly informal and subjective in nature [24]. The aforementioned study [6] analyzed 900 Spanish companies, of which 70.4% were family-run, and proved the hypothesis that family-run companies used inferior levels of control systems in comparison to non-family-run firms as the organizational objectives between these two differ at their core.
2.3. Management Control Research in SMEs with Fuzzy Logic
Based on fuzzy sets literature on management and performance control, it has been demonstrated that SMEs are still unsure of the value of management tools, and they still do not possess the necessary resources to be competitive in this field of knowledge. In addition, a negative relationship has been found between the number of management tools employed and the intensity (level) of their use [25]. Another fuzzy analysis in business was elaborated from the perspective of innovation and entrepreneurship, where a positive relationship between innovation and company growth was found [26]. As further evidence regarding Knowledge Management Performance Measurement shows the lack of research in this area, 49 metrics have been validated to evaluate knowledge and performance management through fuzzy methodology. This is appropriate as SMEs act in uncertain environments, and fuzzy analysis has better reach for this type of study [27]. There is literature on fuzzy analysis indicators in the Supply Chain Management of SMEs in Iran, who find themselves in an uncertain position [1]. Data suggests that SMEs in Iran take into account financial and non-financial indicators yet lack a universal consensus in the use of a balanced scorecard that is incomplete and inconsistent in its metrics and indicators. Furthermore, the correct number of metrics to effectively monitor SMEs is poorly understood. Scarce literature has been found on fuzzy analysis for the monitoring of a holistic management control system in SMEs, which happens to be the focus of this study.
2.4. Development of Hypotheses
Management control theory indicates that it has a positive influence on performance. In addition, various studies in SMEs show a positive influence of the use of management control tools on organizational performance. Henceforth, the hypothesis of the investigation is the following:
HT.
The use of management control tools has a positive influence on the organizational performance of SMEs.
Common management tools analyzed in the literature include budget, long-term planning, decision-making support systems, and financial and non-financial performance support systems [7,8]. There is little literature that groups the tools in control levers to explore how each influences organizational performance in SMEs. Based on [11] control lever model where each of the four levers is defined (beliefs, boundary, diagnostics, interactive), we expect to find strong positive influence in financial and non-financial organizational performance through the use of control tools on each lever.
Thus, four additional hypotheses to analyze how each control lever affects organizational performance in SMEs will be employed:
Hypothesis 1 (H1).
The beliefs lever is present as a management control tool in SMEs.
Hypothesis 2 (H2).
The boundary lever is present as a management control tool in SMEs.
Hypothesis 3 (H3).
The diagnostics control lever is present as a management control tool in SMEs.
Hypothesis 4 (H4).
The interactive control lever is present as a management control tool in SMEs.
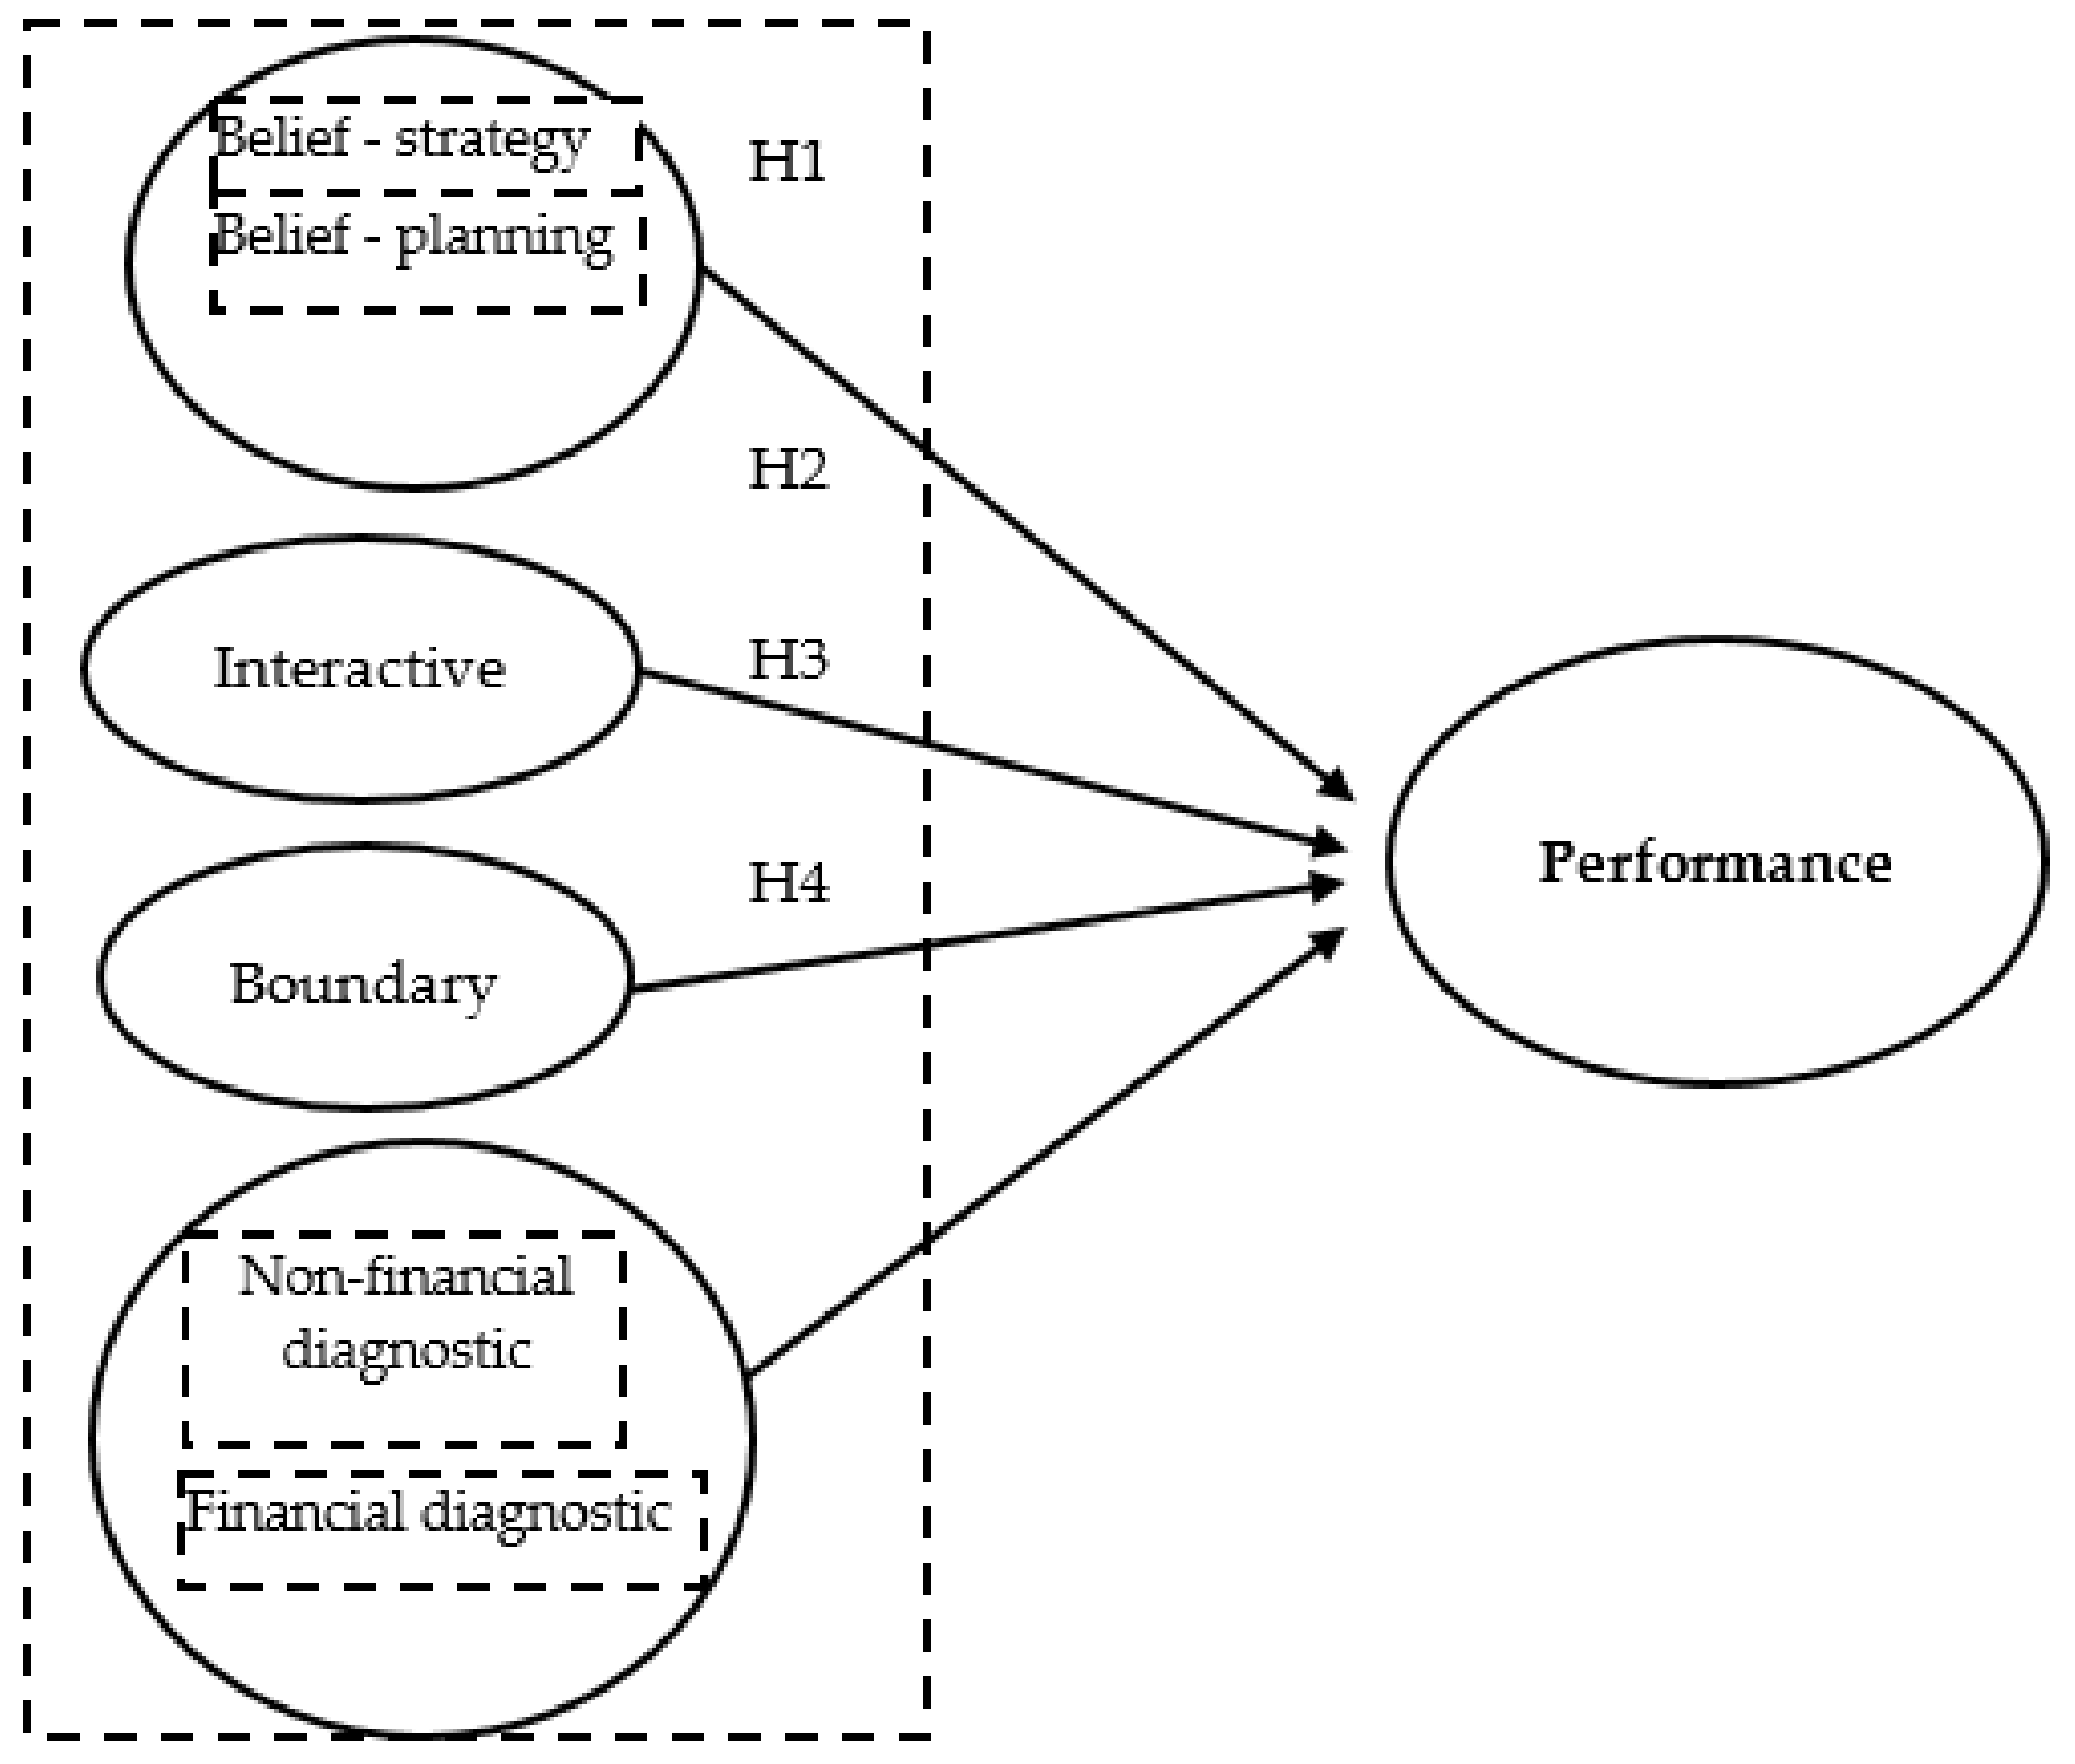
The development of each lever will be analyzed by measuring the degree of use of certain tools that are assigned to each lever. The measurement model is shown in Figure 1.
3. Methodology
In order to fulfill the objective of the research and to prove the model showed in Figure 1, we implement a fuzzy inference evaluation system, thus evaluating the degree of relationship between [11] management control indicators and financial and non-financial performance. This is done by generating a fuzzy logic analysis, whose model is coupled with MATLAB’s software to take advantage of the Fuzzy Logic Toolbox tool. The application of this was done on Chilean SMEs, and the fuzzy inference system (FIS) is based on [28] and the Mamdani method for fuzzification [13].
3.1. Fuzzy Inference System in Management
The origins of fuzzy logic stem from [29,30,31] research, Professor at the University of Carolina (USA), in his article “Fuzzy Sets”. Zadeh proposed a mathematical framework for imprecise data, breaking paradigms by shifting from Boolean logic (0–1; white–black, true-false) to fuzzy logic, which implies that the elements belong to a set to a certain degree. As a consequence, a large variety of greys emerged from the traditional black and white [32,33]. In the field of social sciences, fuzzy logic delivers management techniques in an environment that has imprecision, uncertainty, incomplete information, conflictive information, truth bias, and possibility bias [34]. When discussing fuzzy logic, it must be understood that the basic underlying concepts are linguistic variables, which are variables whose values are expressed by words and not numbers. In effect, fuzzy logic must mainly be seen as a methodology to calculate words instead of numbers [28].
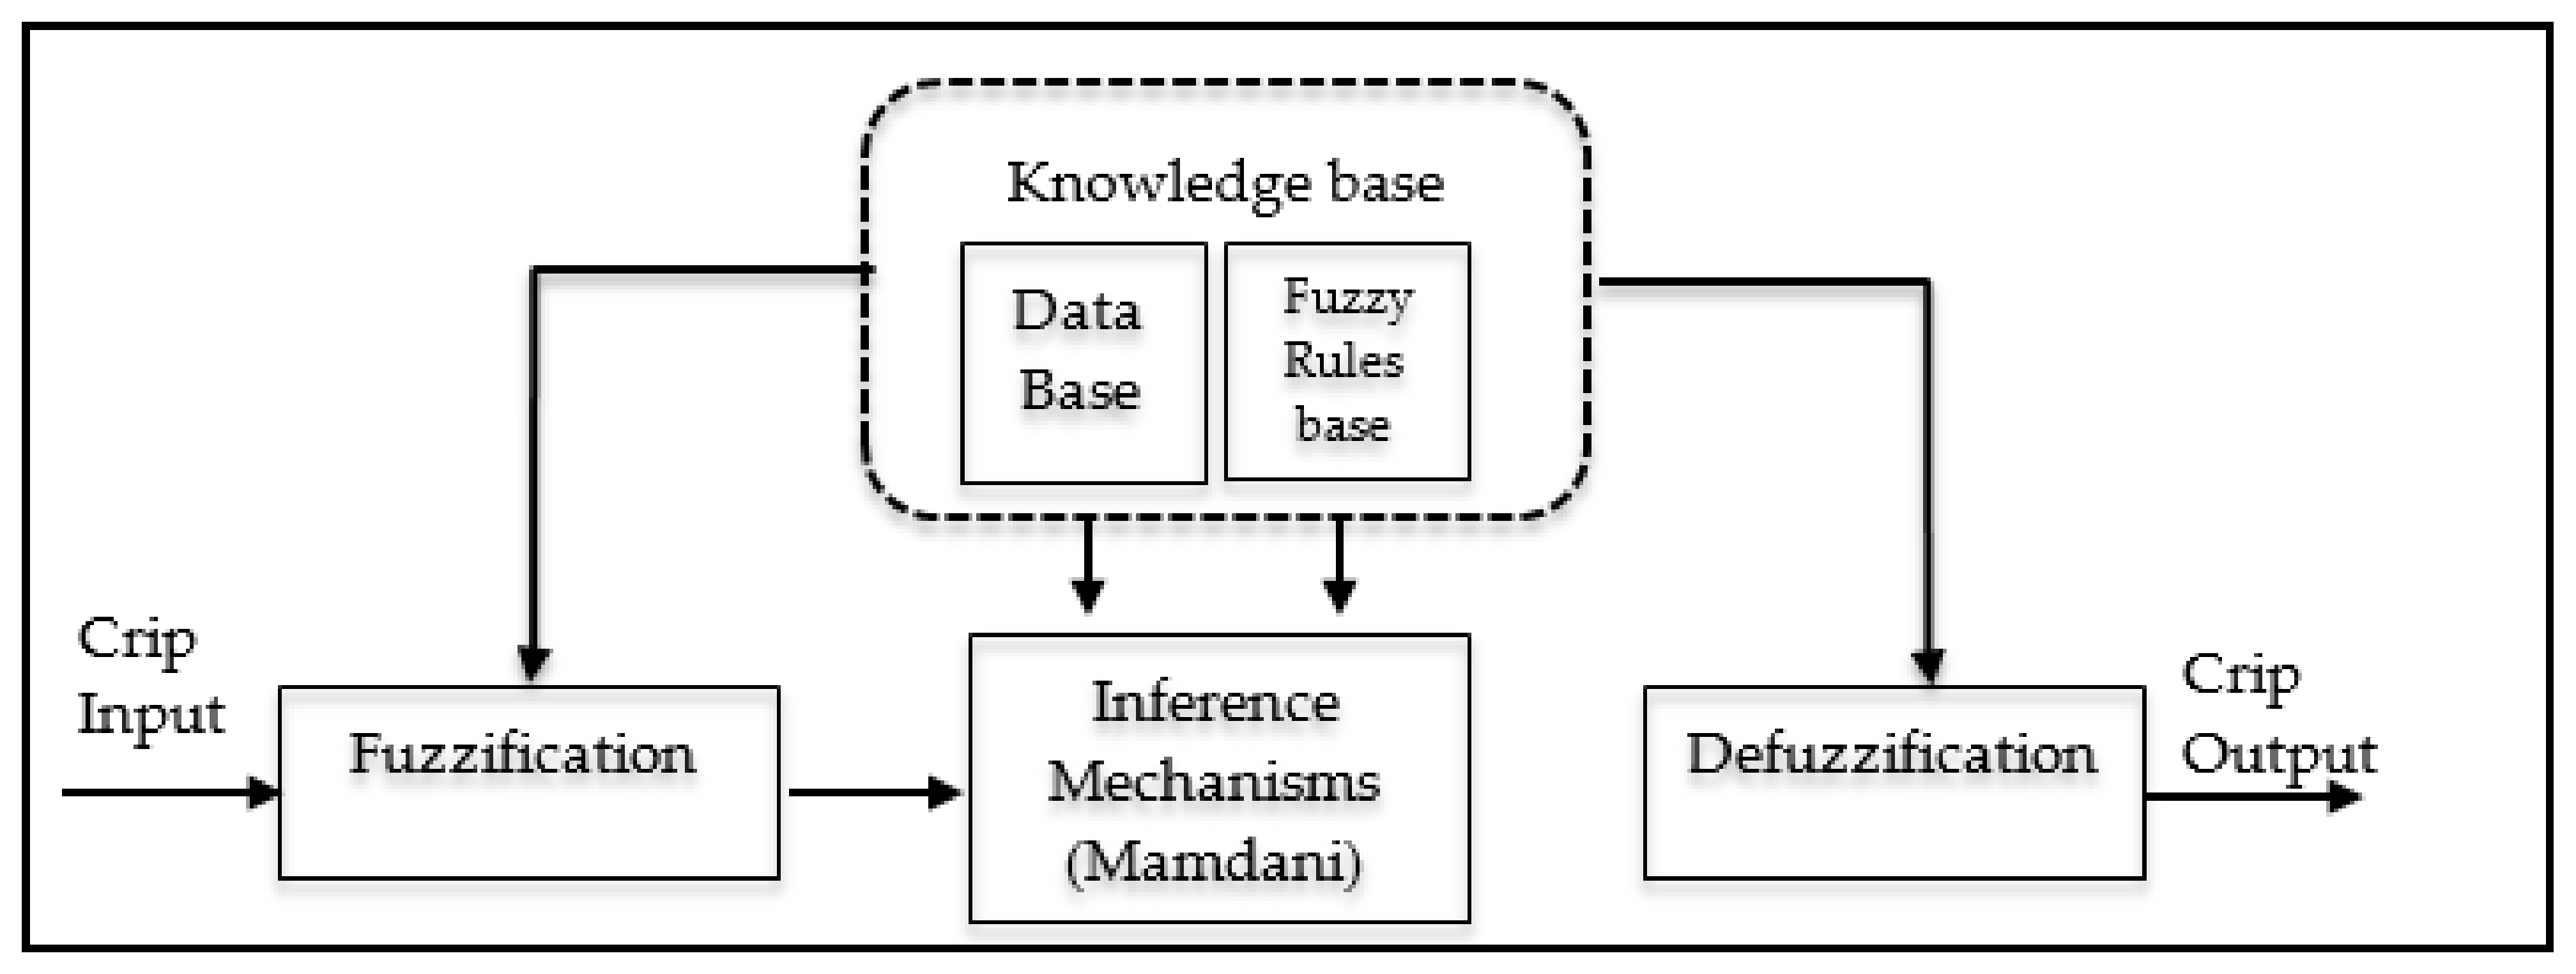
Fuzzy inference systems (FIS) are methodologies that express knowledge and inaccurate data, which is very representative of human thought. Therefore, this method is best employed to give answers to problems that have latent variables instead of observed variables [35]. It defines a non-linear relationship between one or more input variables and an output variable. This provides a starting point for decision-making to take place [36]. Phases:
- -
- Fuzzification: defines the linguistic input and output variables; the linguistic and membership values.
- -
- Fuzzy rules: specify the input and output of a fuzzy set. Fuzzy relationships show the degree of belonging or absence of association or interaction between elements from two or more sets. The fuzzy rules system uses linguistic variables as antecedents and consequent.
- -
- Inference mechanism: Approximate Reasoning is an inference procedure used to derive conclusions from a set of fuzzy rules of the type “IF-THEN” and one (or more) input data by using the Max-Min composition, or the Max-Product composition [37,38]. “AND” or “OR” connectors are used to create the necessary rules for decision-making [13].
- -
- Aggregation: The outputs of each rule are cross-related to obtain a unique fuzzy set.
- -
- Defuzzification: The final stage of the process, where a precise or exact value is obtained from the fuzzy set. Defuzzification methods include centroid, bisector, mean peak, smallest of the maximum, and largest of the maximum [28].
3.2. Mamdani-Fuzzy Rule Type-Based Modelling
There are different fuzzy inference models, and their use depends on the type of problem that needs to be solved. The main difference between models lies in the consequences of the rules and in the aggregation and fuzzification methods [28]. Consequently, the research applies Mamdani’s [13] model because the inputs and outputs are linguistic rules. This investigator used [29] proposal as a base regarding fuzzy algorithms for complex systems and decision-making processes [28].
Mamdani’s model proposes the IF-THEN rules. This implies a series of rules. Input (regressions) matrix and as an output vector are defined as follows:
Hence, the Mamdani fuzzy model is made of fuzzy propositions in its antecedents and consequents. The general rule is IF-THEN [39]:
- Ri: if x is Ai then y is Bi; i = 1; 2; …; K
- Ri is the rule number.
- Ai and Bi are the fuzzy sets.
- x is the antecedent variable representing the input in the fuzzy system.
- y is the consequent variable related to the output of the fuzzy system.
The study employs triangular fuzzy membership and trapezoidal fuzzy membership functions. This study elaborates fuzzy inference for each control lever as proposed by [11], also analyzing the distance that exists between their use and performance in SMEs.
Measuring the use of the management control tools in SMEs is a difficult and complex task to convert into quantitative values as they are partially composed of qualitative data. This implies the need to measure multiple attributes such as the existence of a mission, vision, values, holding meetings, and definition of organizational structure, among others. Hence, FIS serves as a reliable tool to tackle uncertainty in an environment rife with imperfect information.
The analysis also implies measuring the “performance” variable in a company, taking into account a variety of indicators that are impossible to measure at a unidimensional level.
Mamdani’s model is built by considering a series of linguistic proposals and by elaborating different rules measured from observed data. Information is obtained by means of a survey structure that proposes a measuring tool for the levers through fuzzy inference systems.
The software employed in the research is MATLAB–Fuzzy Logic Toolbox. These are grouped in the following levers: beliefs, boundary, interactive, and diagnostics. “Performance” is also measured by considering Financial (liquidity, debt, capability to pay providers, utility) and Non-financial (organizational environment, sense of business control, improved decision making) aspects.
3.3. Sample Characteristics
The target population of this study is composed of Chilean SMEs (medium: 51 to 200 workers; small: 1 to 50 workers) that are part of the 2018 database of the Federation of Chilean Industry SOFOFA (Sociedad de Fomento Fabril) published with 4000 enterprise members. In Chile, SMEs represent 96.8% of the total companies in the country, 220,000 are SMEs, and nearly 680,000 are small businesses.
Final sample size n = 86, with a response rate of 7.1%. The sampling used is not probabilistic, which limits the conclusions of this article.
Table 1 summarizes the descriptive statistics of the surveys. This research employed SPSS to code the survey and to elaborate an exploratory factorial analysis, which is shown in the first part of this investigation.
From the previous table, we can identify that the majority of companies that answered the survey are of small size, with a mode of 10 employees, and are mostly from the commercial sector of the Metropolitan Region.
Of the individuals who responded to our survey, the average work experience is 16 years, and 46% have higher education. Most of the surveys were answered by the CEO; hence, it can be foreseen that they have a high degree of knowledge of their companies.
3.4. Construction of the Variable Measurement Survey
To measure the variables in the study, we developed a structured survey to collect the empirical data. The survey design first required an exhaustive literature review on the Web of Science–Clarivate Analytics database. Following the review of published works, no empirical study was found pertaining to these variables and scales intended to measure the constructs. Hence, a proposed measuring scale for each dimension in the research is presented in Table 2. The validity of the content of the initial survey proposal was evaluated by experts in the field of management control and market research, with an additional random sample of 10 SMEs to evaluate content. An exhaustive review was elaborated to achieve a good level of acceptance of the survey in its draft, number of questions, and design. We received comments that helped us improve the design of the survey, focusing on internal validity and content, giving us an acceptable measuring scale. This allowed us to attain internal coherence for all the dimensions in the study model.
The measurement scale for the dimensions is management controls, human resources, and organizational performance measured with a Likert scale from “1” (strongly disagree) to “5” (strongly agree). The latter was selected as it is more suitable in evaluating degrees of difference rather than employing dichotomous variables to indicate the presence or absence of a particular practice. Other variables related to the questions in the study aim to define the company profiles. Each question had its own specific scale designed for its subject, producing the following variables: type of generic strategy, degree of ICT use, software used, the existence of a role in management control, types of control tools employed, questions pertaining to culture and organizational structure, number of employees, range of annual sales, sector, among others (see Appendix A.1).
The survey application method is multichannel (personal, telephone, and online). It was applied to company managers throughout the months of September and October of 2018. The process consisted of sending an email invitation to all the mentioned databases, specifically to 1200 SMEs at the national level. The objectives of the study were explained, and the participants were informed by email regarding the structured survey addressed to company managers. In the second stage of the process, an access link to the survey was sent, followed by telephone calls and corporate visits, with the aim of improving the survey response rate.
3.5. Variables Measurement
Management control variables [10] and performance [11,40,41,42] are measured through linguistic sentences, as proposed in the study. Given the lack of empirical research with the proposed verbal sentences to measure what the study requires, each dimension has been coupled with several authors (see Appendix A.2).
The scale employed in the survey is the Likert scale: strongly agree, agree, neither agree nor disagree, disagree, and strongly disagree. To proceed with fuzzification and defuzzification, the output tags are high improvement, medium improvement, and no improvement, respectively (see Table 2).
Appendix A.1 shows the fuzzy inference input variables. There are 25 variables that represent “Management control” grouped in: Beliefs, Interactive Control, Diagnostics, and Performance. Following [11] works and seven variables to measure “Performance” [11,40,41,42], all variables are qualitative. Their evaluation depends on the perception of experts. Given their nature and characteristics, fuzzy analysis is the most suitable means to measure them [43].
Thus, by evaluating the control management levers used in SMEs, the degree of truth for each linguistic sentence is measured within the [0, 1] range. This is conducted through a diagnostic instrument applied to company directors.
4. Results
In order to achieve the general objective of this research, we first present a descriptive diagnosis of the management tools used in Chilean SMEs. This is followed by a proposal to implement a fuzzy inference system of diagnosis towards management control tools.
4.1. Descriptive Analysis
The sample is diverse when compared to the generic strategy: Leader in costs: 24%, Differentiation: 22%, Focus: 14%, Mixed: 29%, Doesn’t know: 11%, Management profile. 60% claim to have defined their strategic objectives.
In addition, 54% state that they are a family-run business, 55% base their decision-making process on results, and 50% have a functional structure. Regarding decision-making, 84% indicate that they have a centralized system, 68% have defined their mission and/or vision, and 73% have their organizational values well defined. The analysis demonstrates that the majority of SMEs in the beliefs lever understand and have well-defined strategies, mission, vision, values, and strategic objectives. Furthermore, the diagnostics show that 69% of decision-making is based on rational and financial quantitative information. This is linked to the large number of organizational cultures that focus on results.
In retrospect, the values and answers in the boundary lever have weaker data as the majority of managers and directors who answered explained that role hierarchy does not apply in their organization. In fact, barely more than half of the sample define role profiles to their employees and take part in formalizing roles. The interactive lever highlights that the vast majority of decision-making (84%) is centralized and that slightly more than half include staff participation in the process. Similar numbers are found in the practice of benchmarking activities. Lastly, the diagnostics system could be improved by developing navigation routes and plans based on strategic maps, increasing knowledge of the results of the company, nurturing knowledge of the state of results, and developing budget and inventory systems. According to data, the latter is the most developed.
Taking into account performance, the financial field shows improvement with 64% of answers asseverating increased utility after using management control tools within the last two years. In addition, 57% consider that their liquidity has improved, and less than half report improved levels of debt (lower debt levels). The non-financial performance indicates that 65% report improvement in the organizational environment after implementing management control tools, while 58.2% feel that their sense of control has improved due to these applications.
By segmenting SMEs into two groups (small companies and medium-sized companies), we can appreciate the difference in the use of management control tools between them. The larger a company grows, the higher the rate of use of these tools. A clear example in the beliefs lever is the important increase from 54.8% to 86% on employing strategic objectives to define strategy between small and medium-sized companies, respectively.
The interactive lever also demonstrates this difference in the section of “survey and investigate the activities of the competition”, where only 58.7% of small companies do this compared to 70.3% of medium-sized companies. More interesting data pertains to the formalization of work contracts and the use of policies and procedures manuals between businesses. As observed, only 67% of small companies do this compared to 84.5% of medium-sized companies.
In the diagnostics lever the differences are very apparent in the use of costing systems (small: 56%, medium: 69%), state of results (small: 59.6%, medium: 76%), and budget (small: 68.4%, medium: 82.6%).
4.2. Measurement Scale
Before proceeding with fuzzy logic analysis, it is important to determine whether the tools employed are appropriate to measure the levers of the study. This is done by proving the reliability and validity of the chosen scale. The survey’s internal consistency serves to estimate reliability using Cronbach’s Alpha [44], while the scale’s validity is proven through factorial analysis to evaluate whether each scale measures a single concept. The KMO statistics (Kaiser–Meyer–Olkin) is applied, and for this research, the minimum value of the limits selected for the analysis to be acceptable is 0.5 [45].
Using Bartlett’s test of sphericity to evaluate the presence of correlations among variables, we obtain a level that is significantly inferior to 0.05 [45]. In the case of Cronbach’s Alpha, the accepted inferior limit is 0.7, and 0.6 for new scales [46]. In retrospect, as all results are satisfactory, a factorial analysis is convenient.
Hence, the “Belief” dimension’s Cronbach Alpha value is 0.935, which is a higher value than the advised minimum. For the Kaiser–Meyer–Olkin (KMO) method, the investigation obtained satisfactory results of 0.764 > 0.5. Bartlett’s test returns a chi-squared range (497.57, 549.95), and p = 0.000. This corroborates once again the recommendation of employing factorial analysis. The results return three factors; thus, it is recommended to (1) eliminate the following items: q3_5 and q3_11. (2) Use the remaining two factors to define two new belief variables (Strategy and Belief, Planning).
The “Interactive Control” dimension returns a Cronbach Alpha value of 0.692, which is within the acceptable limits (given that this scale is new and created specifically during this research). The KMO value is 0.596, and Bartlett’s test returns a chi-squared range of (35.77, 37.56). Both results are satisfactory, and the factorial analysis identified two different factors, which makes it recommendable to eliminate item Q6_4 and keep only one factor.
Regarding the “Boundary” dimension, the Cronbach Alpha value is 08.10 while KMO is 0.787. Bartlett’s test returns a chi-squared range of (76.07, 84.08). The factorial analysis identified one factor, confirming that the scale measures one “Boundary” dimension.
The “Diagnostics” dimension has a Cronbach Alpha value of 0.882, KMO of 0.743, and Bartlett’s test of chi-squared range (271.17, 299.73). Factorial analysis reveals the existence of three factors; thus, it is recommended to eliminate: q8_6, q8_7, and q8_9. The other two factors are defined as ‘Diagnostic-financial’ (q8_4, q8_5, q8_8, q8_10, q8_11) and ‘Diagnostic-non-financial’ (q8_1, q8_2, q8_3).
Lastly, the “Performance” variable has a Cronbach Alpha value of 0.859 and a KMO of 0.812. Bartlett’s test results give a chi-squared range of (278.92, 308.28). Factorial analysis reveals the existence of one factor, confirming that the scale measures a “Performance” dimension.
4.3. Fuzzy Inference Systems and Parameterization of Membership Functions
This research has analyzed the proposed measurement tools for evaluating the presence of levers [10]) in SMEs while defining input and output variables, Table 2. The next step is to present the fuzzy inference surfaces that are present in each management control lever related to organizational performance. This is accomplished by using Fuzzy Inference Systems (FIS) with regard to their fuzzy sets and membership functions.
The proposed methodology is based on [33], where the structure stems from Mamdani’s fuzzy system. The process of analysis returns a fuzzy indicator that allows us to make strategic recommendations for SMEs.
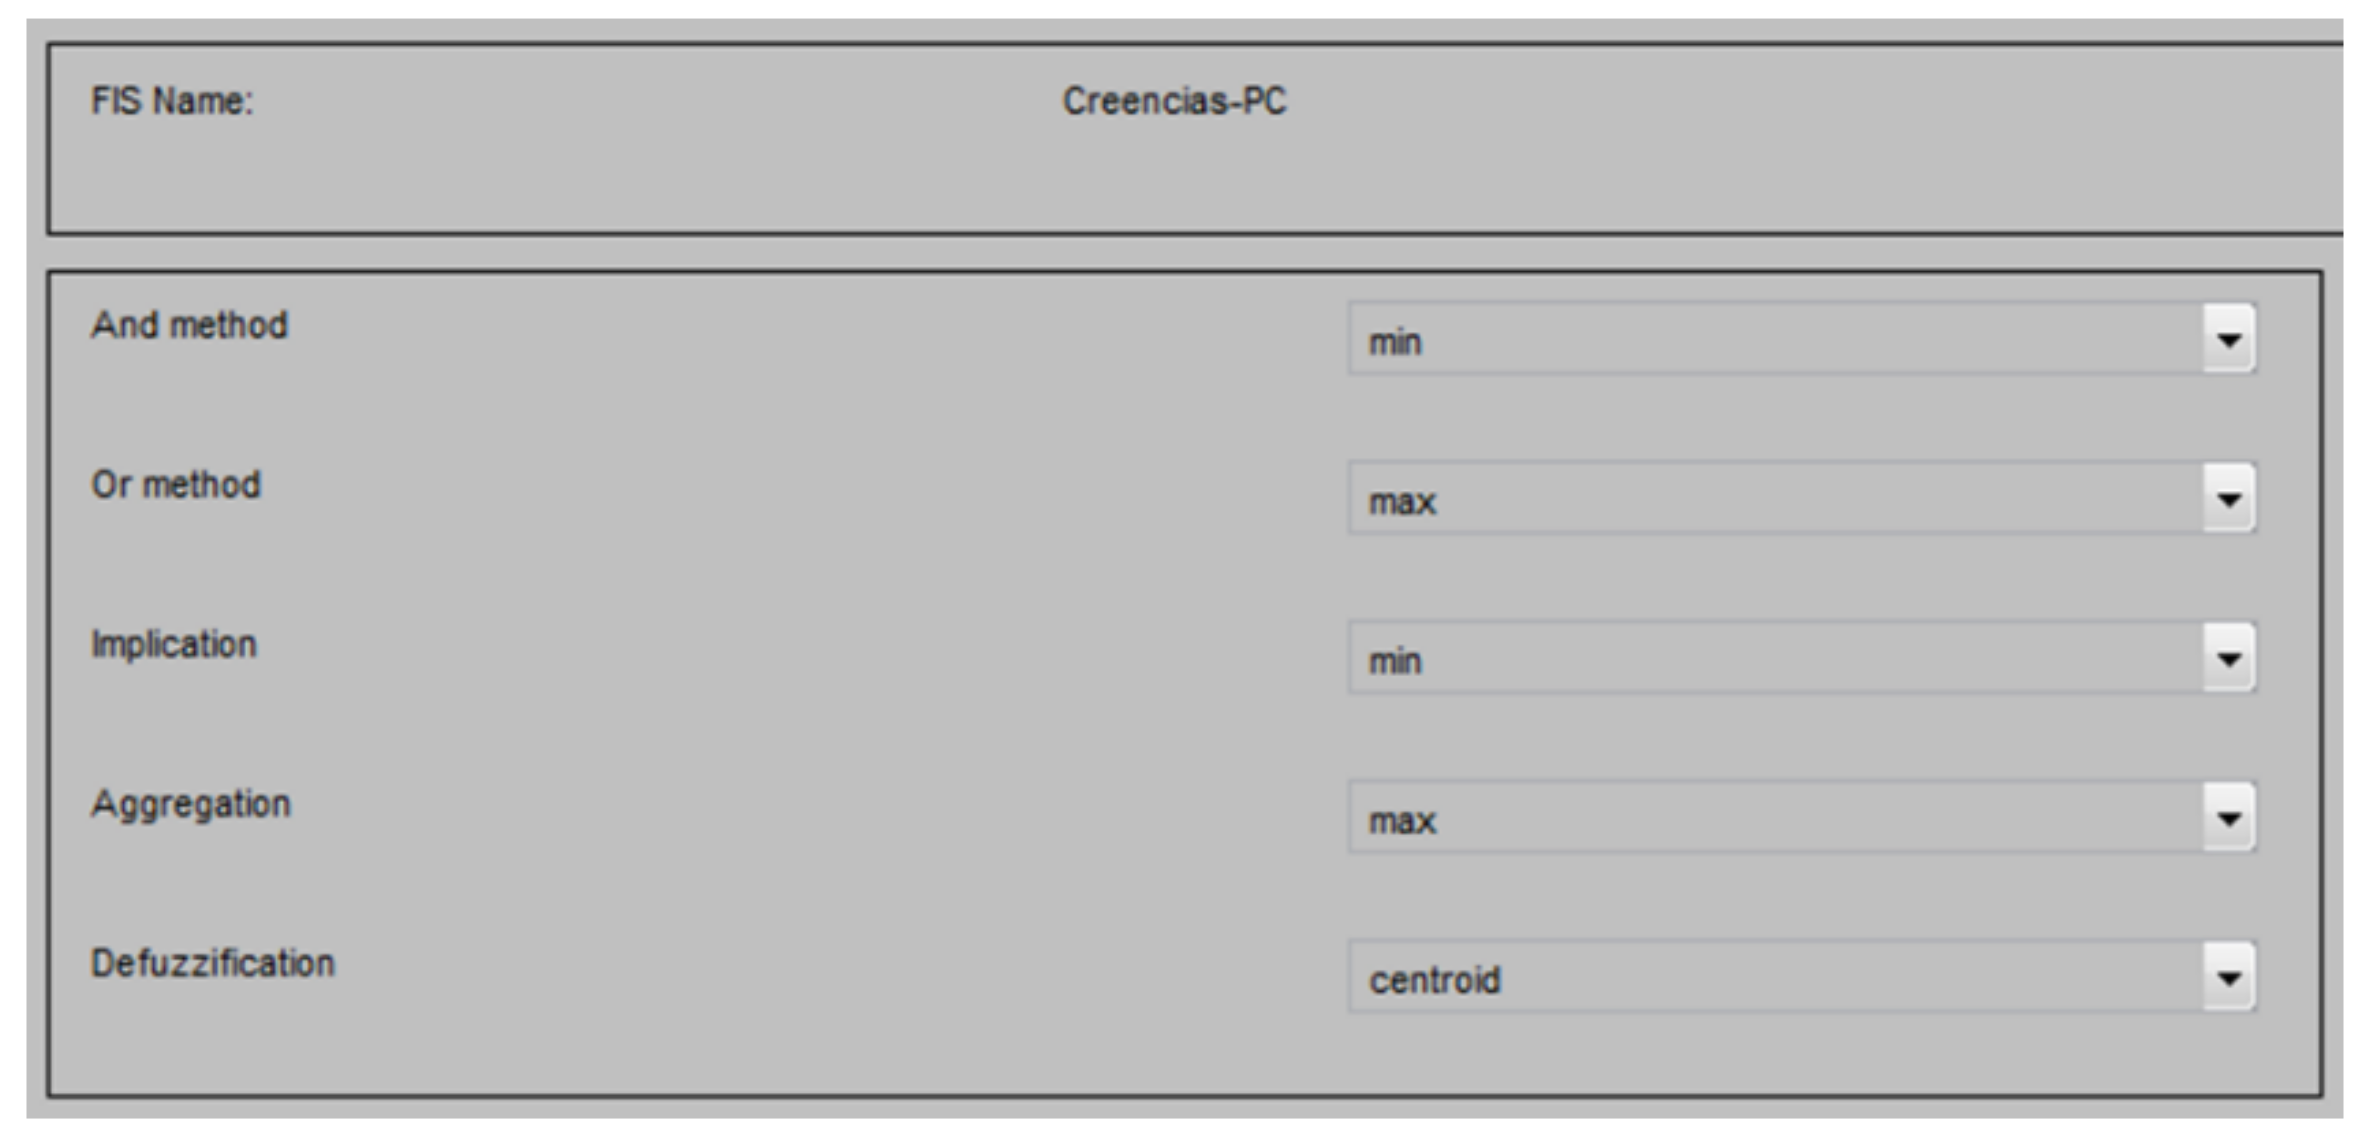
The inference mechanism output is a fuzzy output. To ensure that the output of the fuzzy system can be interpreted only by elements that process numerical information, the fuzzy output from the inference mechanism must be converted in a process called defuzzification. The output of the inference mechanism comes as a fuzzy set. A numerical value can be generated from these sets through various means, such as through Centroid (Center of Gravity), which was used in this case. The fuzzy controller employed comes from [12]. This research is elaborated through the MATLAB module and the Fuzzy Logic Toolbox, and the process was applied to all dimensions of the model in the study.
The selection of relevant fuzzy membership functions considered the extremes as trapezoidal functions as this considers them as tolerance in case an interval increases or decreases beyond the limits. For all other functions, the research used triangular functions (quad-triangular) due to their higher adaptability to the research and variables as well as increased simplicity for interpretation. Considering the different degrees of membership returned by the fuzzification process, these must be processed to generate fuzzy output.
This is achieved by the inference system, which, based on the rules, can generate the output of a fuzzy system. Fuzzy membership function of output variables, where: High improvement: [25%; 100%], Medium improvement: [50%; −50%], No improvement: [−100%; −25%]. Hence, the following analysis develops the stages demonstrated in Figure 2. As a visual example, the FIS is presented for Beliefs.
4.3.1. FIS for Beliefs
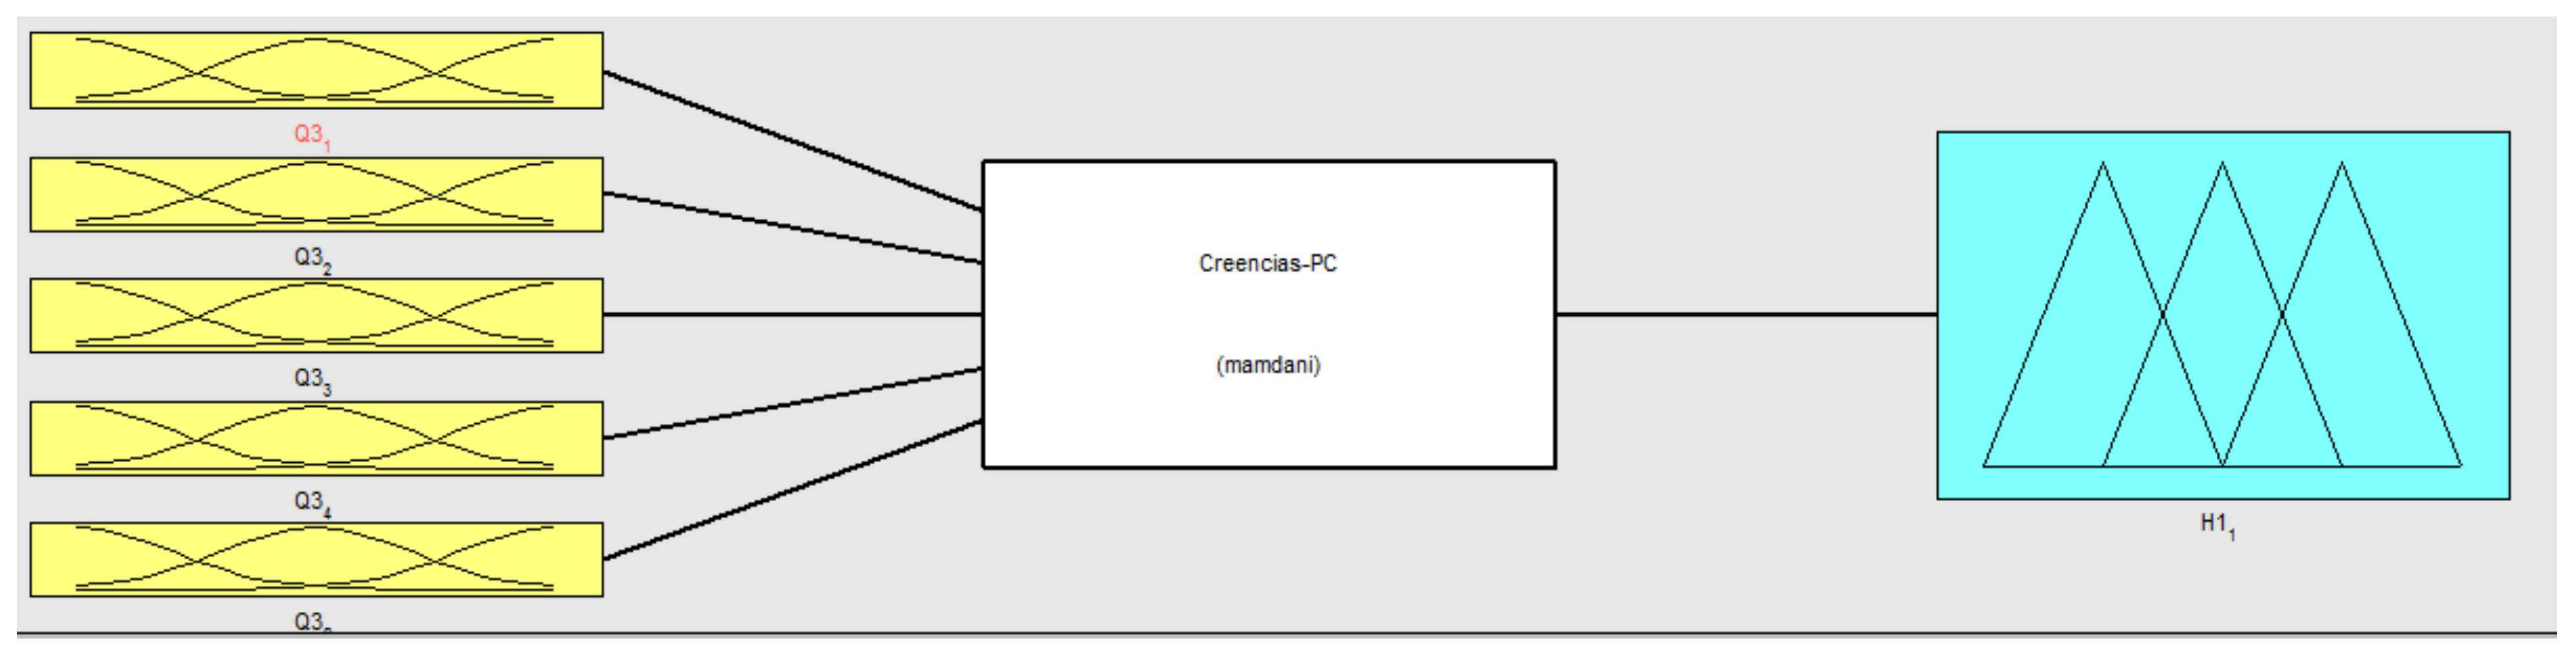
The Fuzzy Inference Systems (FIS) for Beliefs and their respective fuzzy sets (with the membership parameters) are presented as follows: After factorial analysis, the dimension was divided into: “Beliefs = Corporate pillar”: q3_1, q3_2, q3_3, q3_4, q3_8, and “Beliefs = Strategic proposal”: q3_6, q3_7, q3_9, q3_10. The output variables are H1(1) and H1(2), respectively, as shown in Figure 3, Figure 4, Figure 5 and Figure 6. The input and output variable membership functions are displayed in Figure 2: Parameterization of Fuzzy Sets for Beliefs.
4.3.2. CP-Beliefs (Corporate Pillar) Beliefs
The CP-Beliefs lever has the following management tools: definition of mission, vision, and values. FIS analysis reveals that these are used at an average level (30.4512) by SMEs, as demonstrated in Figure 3. The presence or absence of a variable affects the stability of the Beliefs lever.
Figure 3 shows the fuzzy model structure for the CP-Beliefs dimension. It is composed of five input variables (q3_1, q3_2, q3_3,q3_4, q3_8) and an output variable H1(1).
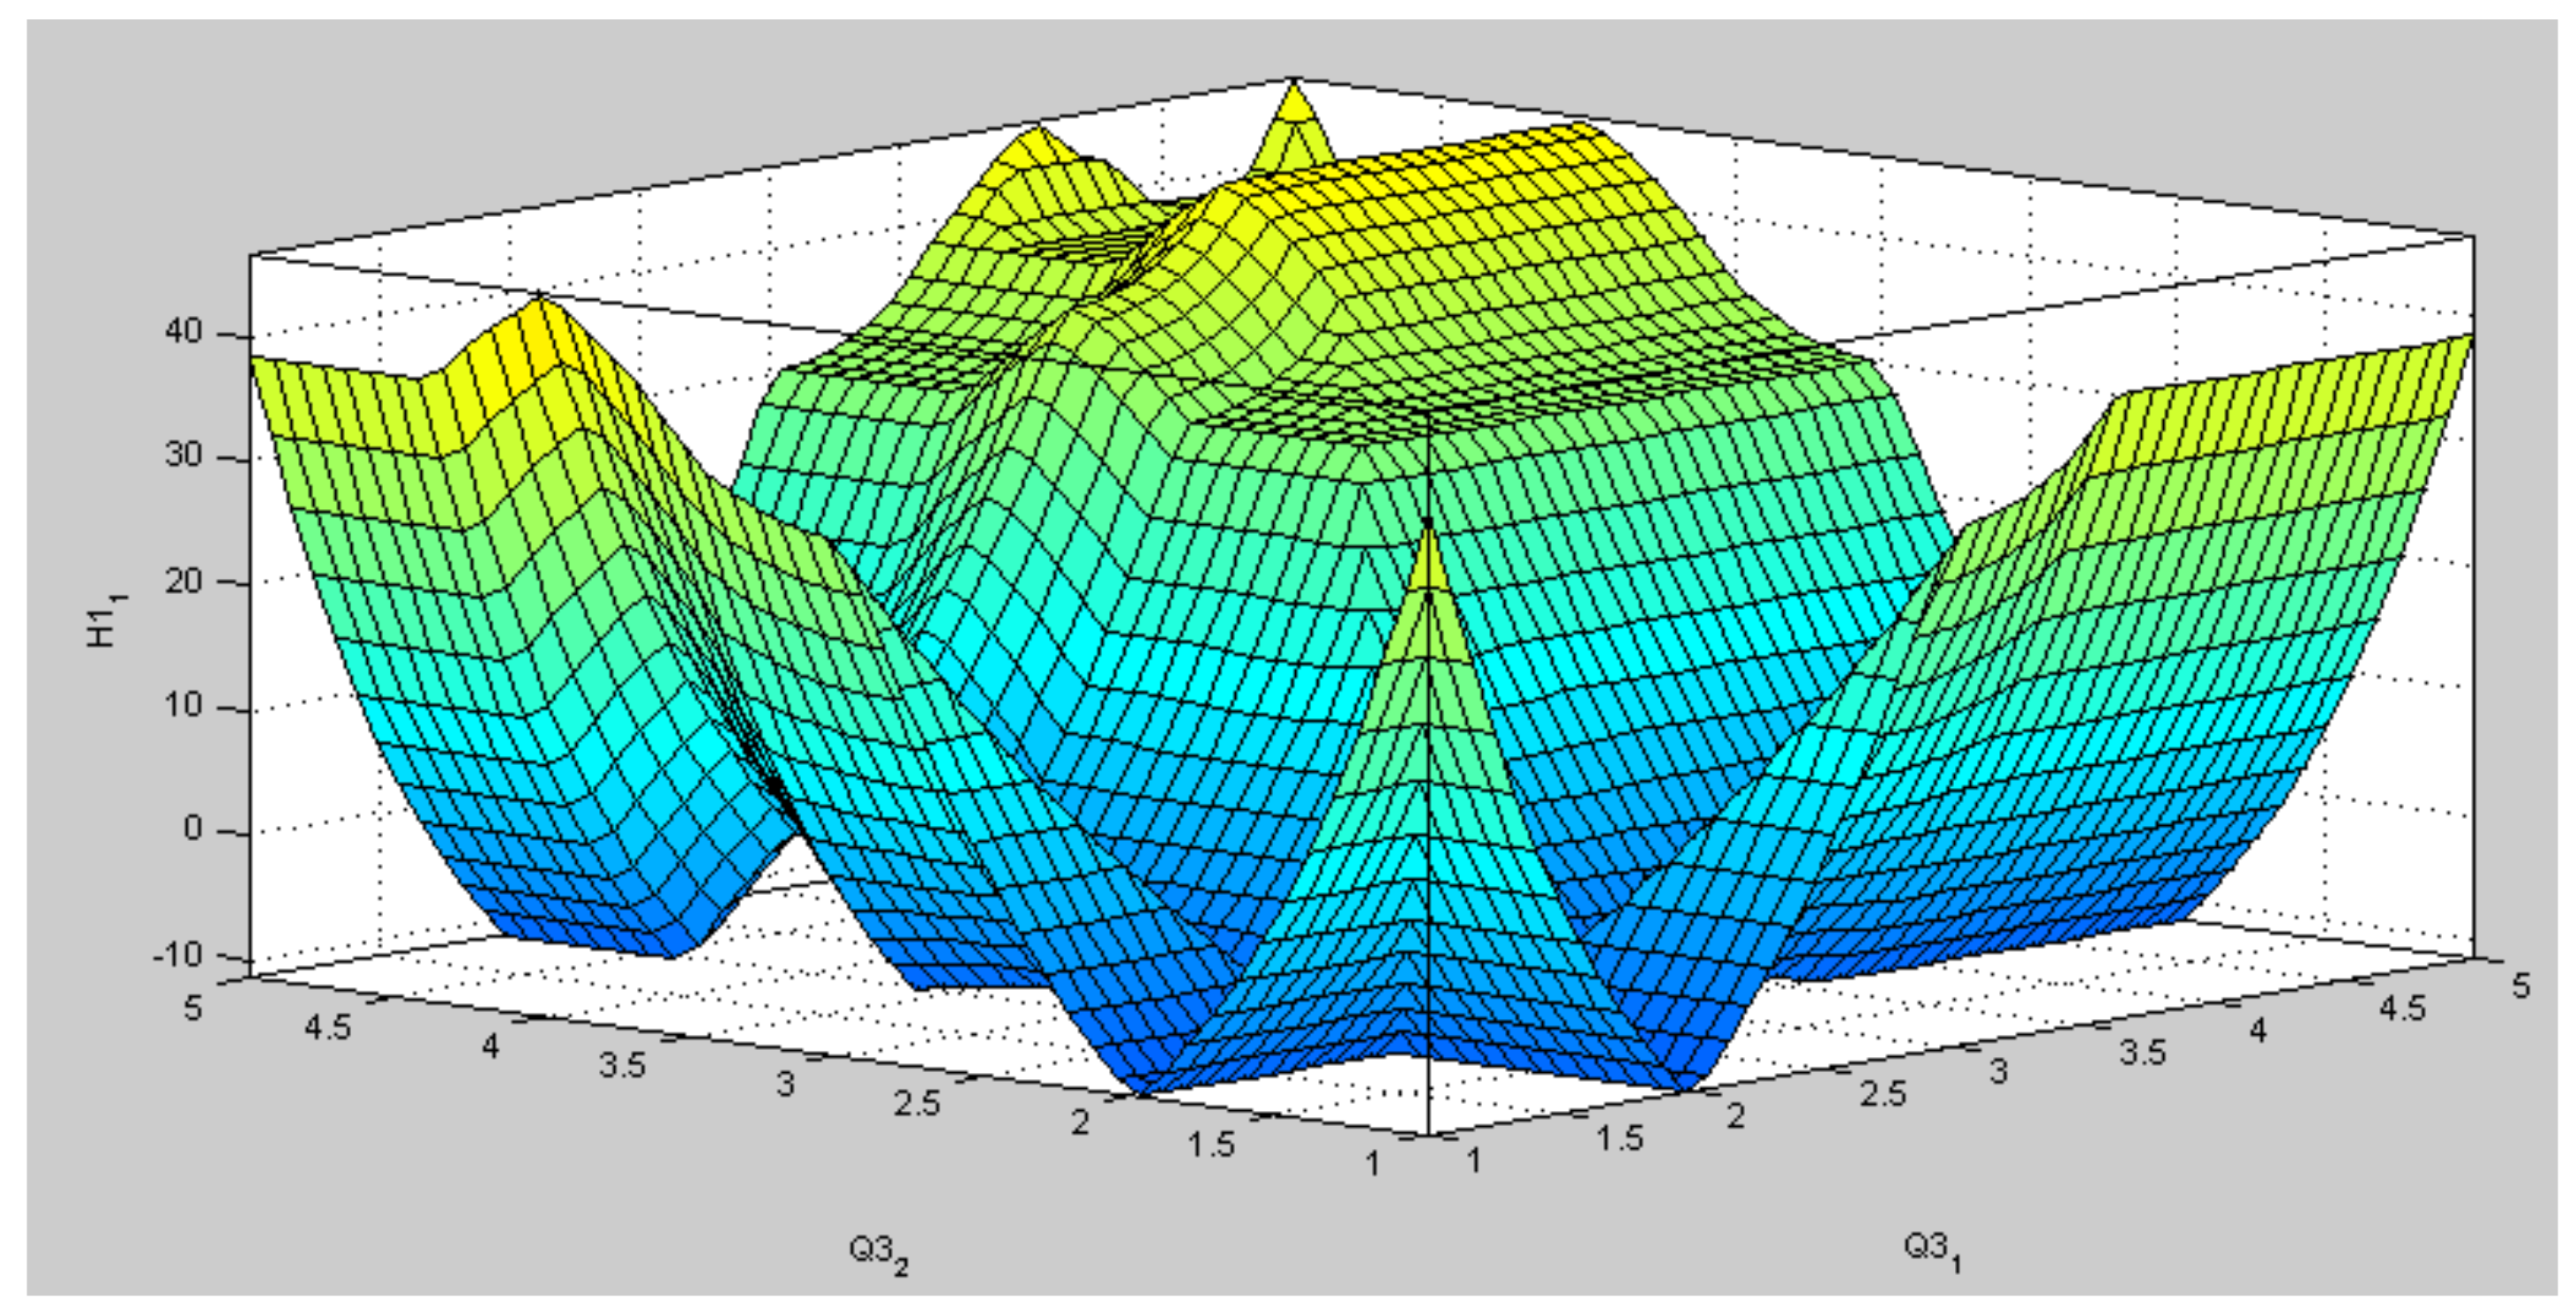
The following, through MATLAB, considers the output variable membership function for the CP-Beliefs dimension. It is seen that the use of the lever “CP-Beliefs” has a value of “medium”, highlighting the positive (30.4512). Figure 5 has two inputs and one output, which shows the output surface of the system. By default, this output was plotted with the two initial input variables.
- F (x) = 30.4512. A: medium level
- X(Input): Q3_1
- Y(input): Q3_2
- Z(output): H1_1
As shown in Figure 5, the relationship between input variables Q3_1 and Q3_2 are displayed as a large volume close to the interval 2–5, returning a result of approximately 30.45%.
For the following variables under study, Appendix A can be reviewed.
4.4. Summary of Fuzzy Indicators
Table 3 shows a summary of the fuzzy indicators obtained in this research. Observations note a considerable degree of difference between small and medium-sized companies on the presence of management control tools on their administration. Small businesses have a positive yet lower degree of presence than medium-sized companies. Both segments have weaknesses, particularly in describing role profiles, the hierarchy of roles, organizational structure, use of policies and procedure manuals, and the use of formal contracts (in general, they both hit the ‘medium’ level).
5. Discussion
The descriptive analysis allowed us to identify that the SMEs studied perceived that their management control tools were well defined (69%). In addition, decision-making based on rational and financial quantitative information was employed, which focuses organizational culture towards results. Regarding performance, the financial area shows improvement, with 64% of answers positively asserting that utility increased after employing management control tools for two years. Furthermore, 57% consider that their liquidity level improved, and slightly less than half report that their debt levels lowered. Regarding non-financial performance, 65% report improvements to the organizational environment after employing the tools, while 58.2% claim to sense better control in decision-making processes.
As a business grows, the use of control tools increases. A clear example can be seen in the beliefs lever values that spiked up to 54.8% and 86% in using strategic objectives to define strategy among small and medium-sized companies, respectively. It must be noted that the interactive lever clearly shows strategic surveillance strategies in the competition, with 58.7% of small companies and 70.3% of medium-sized companies practicing this activity.
Interestingly, the boundary lever is the least used among the SMEs that employ it. The values are similar to the previous results, with 67% coming from small companies and 84.5% from medium-sized companies. In retrospect, the diagnostics lever has clearer differences between small and medium-sized companies in costing system (56% vs. 69%), state of results (59.6% vs. 76%), and use of budget (68.4% vs. 86.2%).
The analysis contributes to what is highlighted in the literature regarding the structural weaknesses to create management strategies for medium and long-term projections due to a scarcity of tools. In addition, management of administration, finances, accounting, and operations is very informal and is done in an intuitive manner where few management control tools are employed in decision-making [15]. Furthermore, there is evidence of the low use of management control tools by small companies, which does improve when viewing medium-sized companies in agreement with the studies by Frost [20].
Nonetheless, we can perceive that using management tools does improve performance without substantial difference between financial and non-financial performance. This reinforces the literature that states that the use of management control tools has a positive impact on organizational performance [6,10,22]. In regard to the measuring scale employed in this study, it had been validated as it returned a high level of internal data consistency through the Cronbach Alpha [44], satisfactory statistical values with the Kaiser–Meyer–Olkin method, and acceptable numbers in Bartlett’s test. Lastly, the factorial analysis identified factors that recommended that we eliminate certain variables, keeping the original theoretical model for the one that was finally used. This separated beliefs into strategy and planning and separated the diagnostics lever into financial and non-financial diagnostics. These were analyzed by means of fuzzy logic, as indicated in Figure 6.
Fuzzy Inference System (FIS) for Management Control Tool Levers
The fuzzy inference system revealed that all levers were used at ‘medium’ capacity by SMEs, see Table 3. The least employed lever was “Boundary”, which includes the use of formal contracts, profile descriptions, manuals, organizational structure, and role hierarchy. Results show that the degree of membership was −7 without significant change between small and medium-sized companies (see Table 3). This indicator remained stable as the other variables of the lever remained in ‘medium’ use, but with a negative trend. In retrospect, the other levers have positive use led by interactive control, followed by diagnostics control, and lastly by beliefs. Performance is valued as ‘medium’ due to the median use of management control tools, grouped in control levers (Simons, 1995) by SMEs based on the literature.
We recommend training mainly the boundary lever, as it is compared to the other levers (see Table 3), as also shown in the descriptive analysis. As mentioned in the literature, it is recommended that entrepreneurs and businesspersons are trained on how to use management control tools. It is recommended that management control tools be provided to small companies. This would increase the degree of membership for medium-sized companies in all levers, including the diagnostics group, but excluding the boundary group, which remains low in all SMEs. The fuzzy inference system also revealed that the degree of membership for the beliefs lever is ‘medium’, which is of concern in small companies (FIS = 6.0376). Due to its positive relationship with level of performance, it is recommended to train SMEs in these control tools, as different variations (of use) may imply a highly unstable variable behavior. In addition, the fuzzy inference system explains similar results found in the descriptive analysis, where the least used lever by SMEs is “Boundary”, not showing differences in degrees of membership regarding financial and non-financial performance.
Lastly, the study suggests that management control tools in SMEs have a mid-level of use or degree of membership. “Boundary” was the least used, followed by “Beliefs”, “Diagnostics”, and “Interactive” (as the most used). This may be because SMEs follow horizontal and organic structures, which causes information to flow and generate team collaboration for decision-making. In retrospect, it is necessary to implement training in management control for businesspersons that lead SMEs, as it could increase the company’s performance and keep them sustainable over time.
6. Conclusions
The importance of the proposed system for management control in SMEs is understood by showing how the analysis with Mamdani’s fuzzy inference system (MFIS) is flexible and can be adapted to the information of each organization. It considers the context of SMEs, where all the data is not always available, and several evaluations are based on the perception of the CEOs.
The second major finding was that Mamdani’s model was ideal for the evaluation as the qualitative variables for analysis were ideological and linguistic.
Evaluation using fuzzy IF-THEN rules enables adjusting the analysis to the needs and available data, so the number of rules can vary, allowing for different results. These characteristics of MFIS make it widely applicable in different scenarios or countries.
The boundary lever shows the highest level of weakness in SMEs and must be given more attention as it returned a negative degree of presence in the business model. It is necessary to implement training in management control for businesspersons who run SMEs as this could increase company performance and keep them sustainable over time.
The belief, diagnostic, and interactive levers show mid-level results (of use) with a positive trend. This specifically means that in SMEs that employed the tools, in belief, tools such as the formal definition of mission, vision, and strategy. Diagnostics tools related to budget and inventory systems, whereas interactive obtains information from employees that most interact with clients to use the feedback for the future of the organization. There was no significant difference between financial and non-financial performance. Furthermore, medium-sized businesses employ more management control tools than small-sized ones, which is expected.
One of the main restrictions of the study is the sample size, which consisted of only 86 SMEs, with more belonging to small companies rather than medium-sized entities. In addition, the complexity of defining rules must be taken into account, considering the number of variables and the importance of a good team of experts to define the fuzzy rules.
This implies that future research should focus on an economic sector that would allow us to specify the degree of use of the management control tools by industry. Nevertheless, we consider the results to open a path of study and analysis to develop and apply fuzzy methodologies to the field of management accounting.
Author Contributions
Conceptualization, Formal analysis, Investigation, Methodology, Project administration, Writing—original draft, Writing—review & editing, C.N.; Formal analysis, Investigation, Writing—original draft, Writing—review & editing, J.M.; Formal analysis, Methodology, Writing—original draft, Writing—review & editing, F.-J.A.-C. All authors have read and agreed to the published version of the manuscript.
Funding
This research received no external funding.
Institutional Review Board Statement
Not applicable.
Informed Consent Statement
Not applicable.
Data Availability Statement
The data presented in this study are available on request from the corresponding author.
Conflicts of Interest
The authors declare no conflict of interest.
Appendix A
Appendix A.1. Input Variables
| Beliefs | |
| Q3_1 | The company’s mission/vision is correctly defined. |
| Q3_2 | The company’s values are correctly defined. |
| Q3_3 | I apply the institution’s values in the management and decision-making of the company. |
| Q3_4 | The generic strategy of the company is correctly defined (i.e., Cost leadership, Differentiation, or Focus). |
| Q3_5 | The personnel is strongly committed to the company’s defined strategy. |
| Q3_6 | The strategic objectives of the company are well defined. |
| Q3_7 | I use the strategic objectives in the management and decision-making of the company. |
| Q3_8 | I use the strategic declarations (mission/vision) for the decision-making of the company. |
| Q3_9 | The personnel is committed to the company’s strategic declarations (mission/vision). |
| Q3_10 | The personnel is committed to the company’s strategic objectives (mission/vision). |
| Q3_11 | Point out which generic strategy is the one that most resembles your business model. (Leadership in Costs, Differentiation, or Approach). |
| Interactive Control | |
| Q6_1 | I host constant general team meetings. |
| Q6_2 | I use various channels for internal communication. |
| Q6_3 | I constantly stimulate personnel participation in the development of ideas to improve organizational practices (competitions, suggestion box, innovation, etc.). |
| Q6_4 | I constantly research the competition’s practices in decision-making. |
| Limits | |
| Q7_1 | We use formal contracts for all personnel in this SME. |
| Q7_2 | We use formal role profile descriptions in this SME. |
| Q7_3 | We use policies, procedures, and/or manuals at the formal level in this SME. |
| Q7_4 | We use a specific organizational structure in this SME. |
| Q7_5 | The role hierarchy is well established in this SME. |
| Diagnostics | |
| Q8_1 | I use the control panel or the balanced scorecard (indicators) to control management in my SME. |
| Q8_2 | I use strategic maps to control management in my SME. |
| Q8_3 | I use some information system to control management in my SME (i.e., Softland, SAP, Defontana, etc.). |
| Q8_4 | I use product or service costing systems to control management in my SME. |
| Q8_5 | I use inventory or stock surveillance to control management in my SME. |
| Q8_6 | I use internal audits to control management in my SME. |
| Q8_7 | I use analysis of the state of results to control management in my SME. |
| Q8_8 | I use budgets to control management in my SME. |
| Q8_9 | I use quality control (quality norms) to control management in my SME. |
| Q8_10 | I know the mix of the most profitable products (volume/price) of my SME. |
| Q8_11 | I use forecasts and demand estimations to control management in my SME. |
| Performance | |
| Q12_1 | Liquidity (capability that an entity possess to obtain cash) |
| Q12_2 | Level of debt (Total passives/Net assets, it is estimated that a healthy value is 30%). |
| Q12_3 | Capability to pay providers. |
| Q12_4 | Utility. |
| Q12_5 | Organizational environment. |
| Q12_6 | Business control. |
| Q12_7 | Decision-making of the company. |
Appendix A.2. Variables and Constructs Used in the Model
| Management control | Simons, R. (1995). Kaplan, R. S., and Norton, D. P., (1996, 2004, 2008)., Anthony, R. N., and Govindarajan, V., (2008)., Frost, (2003), Widener, 2007. Krius et al., 2016. | Belief lever (defining values, strategic declarations, strategic objectives, organizational culture); Boundary lever (personal contracts, role description, policies or procedures, formal structure); Diagnostics lever (control panel, balanced scorecard, strategic maps, management information systems, costing systems, inventory, analysis of the state of results, analysis of financial situation, budget analysis, forecast); Interactive Control lever (use of communication channels with employees, regular meetings, mechanisms for individual participation, strategic surveillance). |
| Performance | Ittner, C. D., and Larcker, D. F. (1998). Green, S. G., and Welsh, M. A. (1988). Duréndez et al., (2016). Voss and Brettel, 2014. | Financial (liquidity, debt, capability to pay suppliers, and utility); Non-financial (organizational environment, sense of business control, improvement in decision making). |
| Source: Prepared by the authors. | ||
References
- Nia, A.S.; Saparauskas, J.; Ghorabaee, M.K. A Fuzzy ARAS method for Supply Chain Management performance measurement in SMEs under uncertainty. Transform. Bus. Econ. 2017, 16, 41. [Google Scholar]
- Kaplan, R.S.; Norton, D.P. The Balanced Scorecard: Translating Strategy into Action; Harvard Business School Press: Boston, MA, USA, 1996. [Google Scholar]
- Kaplan, R.S.; Norton, D.P. Strategy Maps: Converting Intangible Assets into Tangible Outcomes; Harvard Business Press: Boston, MA, USA, 2004. [Google Scholar]
- Kaplan, R.S.; Norton, D.P. The Execution Premium; Harvard Business School Press: Boston, MA, USA, 2008. [Google Scholar]
- Melnyk, S.A.; Bititci, U.; Platts, K.; Jutta, T.; Andersen, B. Is performance measurement and management fit for the future? Manag. Account. Res. 2014, 255, 173–186. [Google Scholar] [CrossRef]
- Duréndez, A.; Ruíz-Palomo, D.; García-Pérez-de-Lema, D.; Diéguez-soto, J. Management control systems and performance in small and medium family firms. Eur. J. Fam. Bus. 2016, 6, 10–20. [Google Scholar] [CrossRef] [Green Version]
- Andersen, J.; Samuelsson, J. Resource organization and firm performance: How entrepreneurial orientation and management accounting influence the profitability of growing and non-growing SMEs. Int. J. Entrep. Behav. Res. 2016, 22, 466–484. [Google Scholar] [CrossRef] [Green Version]
- Chenhall, R.H.; Langfield-Smith, K. Adoption and benefits of management accounting practices: An Australian study. Manag. Account. Res. 1998, 9, 1–19. [Google Scholar] [CrossRef]
- Ahmad, K.; Zabri, S.M. Factors explaining the use of management accounting practices in Malaysian medium-sized firms. J. Small Bus. Enterp. Dev. 2015, 22, 762–781. [Google Scholar] [CrossRef] [Green Version]
- Obispo, D. Caracterización del control interno en la gestión de las empresas comerciales del Perú 2013. Crescendo 2015, 6, 64–73. [Google Scholar] [CrossRef]
- Simons, R. Control in an Age of Empowerment; Harvard Business Review Press: Boston, MA, USA, 1995; pp. 80–88. [Google Scholar]
- Nicolas, C.; Gil-Lafuente, J.; Urrutia, A.; Valenzuela, L. Fuzzy Logic Approach Applied into Balanced Scorecard. In Advances in Intelligent Systems and Computing; Applied Mathematics and Computational Intelligence; FIM 2015; Gil-Lafuente, A., Merigó, J., Dass, B., Verma, R., Eds.; Springer: Cham, Switzerland, 2018; Volume 730. [Google Scholar]
- Mamdani, E.; Assilian, S. An experiment in linguistic synthesis with a fuzzy logic controller. Int. J. Man-Mach. Stud. 1975, 7, 1–13. [Google Scholar] [CrossRef]
- Armitage, H.M.; Webb, A.; Glynn, J. The Use of Management Accounting Techniques by Small and Medium-Sized Enterprises: A Field Study of Canadian and Australian Practice. Account. Perspect. 2016, 15, 31–69. [Google Scholar] [CrossRef] [Green Version]
- Castañeda, L. Los sistemas de control interno en las Mipymes y su impacto en la efectividad empresarial. En-Contexto 2014, 2, 129–146. [Google Scholar]
- Castellanos, J.G. Pymes innovadoras. Cambio de estrategias e instrumentos. Rev. Esc. Adm. Neg. 2003, 47, 10–33. [Google Scholar]
- Anthony, R.N.; Govindarajan, V. Sistemas de Control Gerencial; McGraw Hill: Madrid, Spain, 2008. [Google Scholar]
- Baird, K.; Su, S. The association between controls, performance measures and performance. Int. J. Product. Perform. Manag. 2018, 67, 967–984. [Google Scholar] [CrossRef]
- Malagueño, R.; Lopez-Valeiras, E.; Gomez-Conde, J. Balanced scorecard in SMEs: Effects on innovation and financial performance. Small Bus. Econ. 2017, 51, 221–244. [Google Scholar] [CrossRef]
- Frost, F.A. The use of strategic tools by small and medium-sized enterprises: An Australasian study. Strat. Chang. 2003, 12, 49–62. [Google Scholar] [CrossRef]
- Adler, R.; Everett, A.; Waldrom, M. Advanced management accounting techniques in manufacturing: Utilization, benefits and barriers to implementation. Manag. Account. Res. 2000, 24, 131–150. [Google Scholar] [CrossRef]
- Munoz, J.M.; Welsh, D.H.B.; Chan, S.H.; Raven, P.V. Microenterprises in Malaysia: A preliminary study of the factors for management success. Int. Entrep. Manag. J. 2014, 11, 673–694. [Google Scholar] [CrossRef]
- Charteres Institute of Management Accountants (CIMA). Management Accounting Practices of UK Small-Medium-Sized Enterprises (SMEs). Improving SME Performance through Management Accounting Education; CIMA: London, UK, 2003; Volume 9. [Google Scholar]
- Senftlechner, D.; Martin, R.W.; Hiebl, M.R.Q. Management accounting and management control in family businesses: Past accomplishments and future opportunities. J. Account. Organ. Chang. 2015, 11, 573–606. [Google Scholar] [CrossRef]
- Hopper, T.; Tsamenyi, M.; Uddin, S.; Wickramasinghe, D. Management accounting in less developed countries: What is known and needs knowing. Account. Audit. Account. J. 2009, 22, 469–514. [Google Scholar] [CrossRef]
- Cerchione, R.; Esposito, E. Using knowledge management systems: A taxonomy of SME strategies. Int. J. Inf. Manag. 2017, 37, 1551–1562. [Google Scholar] [CrossRef]
- Lee, C.S.; Wong, K.Y. A Fuzzy Logic-Based Knowledge Management Performance Measurement System for SMEs. Cybern. Syst. 2017, 7, 1–26. [Google Scholar] [CrossRef]
- Nicolas, C. Indicadores Clave de Gestión Sobre la Experiencia del Cliente: Un Estudio Basado en Fuzzy Text Mining; Universidad de Barcelona: Barcelona, Spain, 2014. [Google Scholar]
- Zadeh, L.A. The concept of a linguistic variable and its application to approximate reasoning (Part I). Inf. Sci. 1975, 8, 199–249. [Google Scholar] [CrossRef]
- Zadeh, L.A. The concept of a linguistic variable and its application to approximate reasoning (Part II). Inf. Sci. 1975, 8, 301–357. [Google Scholar] [CrossRef]
- Zadeh, L.A. The concept of a linguistic variable and its application to approximate reasoning (Part III). Inf. Sci. 1976, 9, 43–80. [Google Scholar] [CrossRef]
- Gil-Aluja, J. Elements for a Theory of Decision in Uncertainty; Springer Science & Business Media: Berlin/Heidelberg, Germany, 1999. [Google Scholar] [CrossRef]
- Gil Lafuente, J. Marketing Para el Nuevo Milenio. Nuevas Técnicas Para la Gestión Comercial en la Incertidumbre; Pirámide: Madrid, Spain, 1997. [Google Scholar]
- Zadeh, L.A. Is there a need for fuzzy logic? Inf. Sci. 2008, 178, 2751–2779. [Google Scholar] [CrossRef]
- Fiss, P.C. A set-theoretic approach to organizational configurations. Acad. Manag. Rev. 2007, 32, 1180–1198. [Google Scholar] [CrossRef] [Green Version]
- Jang, J.-S.; Sun, C.-T. Neuro-fuzzy modeling and control. Proc. IEEE 1995, 83, 378–406. [Google Scholar] [CrossRef]
- Jang, J.S.R.; Sun, C.T.; Mizutani, E. Neuro Fuzzy and Soft Computing; Prentice-Hall: Upper Saddle River, NJ, USA, 1997. [Google Scholar]
- Medina, S. Estado de la cuestión acerca del uso de la lógica difusa en problemas financieros. Cuad. Adm. 2006, 19, 195–223. [Google Scholar]
- Tutmez, B.; Tercan, A.E. Assessment of Uncertainty in Geological Sites Based on Data Clustering and Conditional Prob-abilities. J. Uncertain Syst. 2007, 1, 207–221. [Google Scholar]
- Ittner, C.D.; Larcker, D.F. Are Nonfinancial Measures Leading Indicators of Financial Performance? An Analysis of Customer Satisfaction. J. Account. Res. 1998, 36, 1–35. [Google Scholar] [CrossRef]
- Green, S.G.; Welsh, M.A. Cybernetics and dependence: Reframing the control concept. Acad. Manag. Rev. 1988, 13, 287–301. [Google Scholar] [CrossRef]
- Voss, U.; Brettel, M. The effectiveness of Management Control in Small Firms: Perspectives from Resource Dependence Theory. J. Small Bus. Manag. 2014, 52, 569–587. [Google Scholar] [CrossRef]
- Serrano-García, J.; Acevedo-Alvarez, C.A.; Castelblanco-Gomez, J.M.; Arbelaez-Toro, J.J. Measuring organizational capabilities for technological innovation through a fuzzy inference system. Technol. Soc. 2017, 50, 93–109. [Google Scholar] [CrossRef]
- Cronbach, L.J. Coefficient alpha and the internal structure of tests. Psychometrika 1951, 16, 297–334. [Google Scholar] [CrossRef] [Green Version]
- Field, A. Discovering Statistics Using SPSS for Windows; Sage Publications: London, UK, 2000. [Google Scholar]
- Nunnally, J.C. Psychometric Theory, 2nd ed.; McGraw-Hill: New York, NY, USA, 1978. [Google Scholar]
Figure 1.
Theoretical model. Based on Simons, R. (1995) and Ittner and Larcker, 1998; Green and Welsh, 1988; Duréndez et al., 2016; Voss and Brettel, 2014.
Figure 1.
Theoretical model. Based on Simons, R. (1995) and Ittner and Larcker, 1998; Green and Welsh, 1988; Duréndez et al., 2016; Voss and Brettel, 2014.

Figure 2.
Stages of a Fuzzy Inference System.

Figure 3.
Inference system H1(1): Fuzzy model for Beliefs-CP dimension.

Figure 4.
Employment of Centroid Defuzzification.

Figure 5.
Surface of Fuzzy Inference for CP_Beliefs.

Figure 6.
Proposed Final Model.


Table 1.
Profile of sample companies.
| Company Profile | |
|---|---|
| Average N° of Employees | Average: 35 employees Mode: 10 employees Max: 800, Min: 2 |
| Average Range of Annual Sales | Small 1: 2.400,01 uf a 5.000 uf.: 28% Small 2: 5.000,01 uf a 10.000 uf.: 19% Small 3: 10.000,01 uf a 25.000 uf.: 20% Medium 1: 25.000,01 uf a 50.000 uf.: 16% Medium 2: 50.000,01 uf a 100.000 uf.: 12% Other 5% |
| Main Sector/Industry | Commerce: 52% Agriculture: 8% Construction: 6% Hotel/Restaurant: 7% |
| Main Geographical Location | Metropolitan Region: 77% |
Source: Prepared by the authors.
Table 2.
Measurement Scales.
| Input | Output | ||
|---|---|---|---|
| DB Survey Code | Input Tag | DB Survey Code | Output Tag |
| 1 | Strongly disagree | 1–2 | No improvement |
| 2 | Disagree | ||
| 3 | Neither agree nor disagree | 3 | Medium improvement |
| 4 | Agree | 4–5 | High improvement |
| 5 | Strongly agree | ||
Source: Prepared by the authors.
Table 3.
Summary of Fuzzy Indicators, SMEs (Small and Medium-sized companies).
| Lever | FIS—SMEs | FIS—Small | FIS—Medium |
|---|---|---|---|
| Beliefs | |||
| Beliefs—Strategic | 30.4512 | 17.3919 | 41.3900 |
| Beliefs—Planning | 24.5564 | 15.7527 | 48.7993 |
| Interactive Control | 32.4552 | 26.7419 | 39.5948 |
| Boundary | −7.9801 | −8.1384 | −7.4093 |
| Diagnostics | 12.0115 | 34.5589 | |
| Diagnostics—F | 23.4046 | 17.9972 | 36.6432 |
| Diagnostics—N.F | 0.8003 | −6.5001 | 21.9388 |
| Performance | 12.3180 | 9.7492 | 17.3669 |
Source: Self-elaboration.
Publisher’s Note: MDPI stays neutral with regard to jurisdictional claims in published maps and institutional affiliations. |
© 2021 by the authors. Licensee MDPI, Basel, Switzerland. This article is an open access article distributed under the terms and conditions of the Creative Commons Attribution (CC BY) license (https://creativecommons.org/licenses/by/4.0/).
Share and Cite
MDPI and ACS Style
Nicolas, C.; Müller, J.; Arroyo-Cañada, F.-J. A Fuzzy Inference System for Management Control Tools. Mathematics 2021, 9, 2145. https://0-doi-org.brum.beds.ac.uk/10.3390/math9172145
AMA Style
Nicolas C, Müller J, Arroyo-Cañada F-J. A Fuzzy Inference System for Management Control Tools. Mathematics. 2021; 9(17):2145. https://0-doi-org.brum.beds.ac.uk/10.3390/math9172145
Chicago/Turabian StyleNicolas, Carolina, Javiera Müller, and Francisco-Javier Arroyo-Cañada. 2021. "A Fuzzy Inference System for Management Control Tools" Mathematics 9, no. 17: 2145. https://0-doi-org.brum.beds.ac.uk/10.3390/math9172145
Note that from the first issue of 2016, this journal uses article numbers instead of page numbers. See further details here.