1. Introduction
The high energy intensity of modern industry makes it necessary to improve the energy efficiency of production processes. About 70% of the electricity generated worldwide is consumed by electric motors, the most significant part of which is powered directly from the electrical grid [
1]. Electric motors connected directly to the AC mains consume both real and reactive power. Reactive power does not produce any useful work, but a reactive current creates additional losses in supply cables and transformers. Therefore, to reduce the power consumption of an electric drive, the reactive power must be compensated [
2]. Many studies have been devoted to the analysis of the feasibility of reactive power compensation for electric motors powered directly from the grid. The following methods for improving the power factor have been proposed [
2,
3]:
- −
reduction in the motor voltage at partial load operation (
Figure 1a);
- −
the use of a double motor winding, one section of which is connected to the grid, and capacitors are connected to the second. Capacitors can be connected in series (Wanlass connection,
Figure 1b) or in parallel to the winding (Roberts’ connection,
Figure 1c);
- −
the use of static capacitors at the motor terminals (
Figure 1d);
- −
the use of semiconductor devices for reactive power compensation.
Figure 1.
Reactive power compensation methods for low power AC motors: (a) reducing the voltage at the motor terminals; (b) Wanlass connection motor winding; (c) Roberts’ connection motor winding; (d) Static capacitors at the motor terminals.
Figure 1.
Reactive power compensation methods for low power AC motors: (a) reducing the voltage at the motor terminals; (b) Wanlass connection motor winding; (c) Roberts’ connection motor winding; (d) Static capacitors at the motor terminals.
A particular and most common case of voltage reduction schemes is switching the winding connection from triangle to star (Δ/Y) [
4]. However, such a solution provides an effective increase in the power factor only when the motor is running at low loads. Therefore, it will not be effective in most applications [
2].
Existing dual-winding solutions (
Figure 1b,c) can effectively improve the power factor of the motor, however, the overall motor losses increase significantly. In addition, the motor cost increases, and the reliability deteriorates. Therefore, motors with double windings have not found wide application [
2,
3]. The Roberts’ connection was also proposed for direct-on-line synchronous motors, however, such solutions also did not find wide practical application [
3,
5,
6].
Another possible way to increase the power factor is to use a semiconductor device connected in parallel with the motor, or an induction machine with a wound rotor, the stator of which is directly connected to the mains, and the wound rotor is connected to two static inverters with a common DC-link (doubly fed induction machine). This method is effective, but not suitable for low-power motors due to its high cost [
7,
8].
Static capacitors have long been used for reactive power compensation and are the most effective method of the above [
2]. Non-switchable and switchable capacitor banks can be used [
9]. However, the feasibility analysis of the use of capacitors for various types of motors, including modern DOL-SynRM and DOL-PMSM, is still poorly covered in the literature.
A number of studies are devoted to the analysis of energy savings in a pumping station due to an increase in the power factor of electric motors. In [
10], energy savings are calculated when using capacitors to compensate for the reactive power of a pumping station with eight pumps equipped with induction motors. A different number of simultaneously operating pumps is considered. It has been shown that when the station is fully loaded, the capacitors will have a very short payback period: about 2 weeks. However, the absolute value of losses in the transmission line, taking into account the parameters of the cable and transformer, is not calculated. Only the percentage reduction in losses in the transmission line and an approximate reduction in electricity costs according to the formula for large consumers in Egypt are estimated, which is not universal and is not suitable for the case of small consumers.
In [
11], the energy savings of the pump drive were estimated, taking into account the losses in the cable without taking into account the losses in the transformer. The article compares annual energy savings and lifetime energy savings for induction motors (IM) of different efficiency classes, direct-on-line permanent magnet synchronous motor (DOL PMSM) and direct-on-line synchronous reluctance motor (DOL SynRM) (
Figure 2).
All three types of motors under consideration have approximately the same stator design, but different rotor designs. IM operates in an asynchronous steady-state mode and has significant electrical losses in the rotor. DOL PMSM and DOL SynRM usually have a higher efficiency than IM due to the absence of electrical losses in the rotor from the first (fundamental) current harmonic when operating in a synchronous steady-state mode. In [
11], it is shown that the power factor of the motor has a significant effect on the cable losses, but the losses in the transformer are not taken into account. However, transformer losses also significantly depend on the reactive component (power factor) of the load current.
Paper [
12] also discusses a comparison of the energy consumption of IM, DOL PMSM and DOL SynRM in a pumping application. In this case, the influence of the motor power factor on the losses in the cable and transformer is taken into account. It has been shown that the increased power factor can significantly increase energy savings, shorten the payback period and make the use of DOL PMSM most profitable after several years, despite its higher cost compared to IM and DOL SynRM and its lower efficiency compared to DOL SynRM.
This article, in contrast to [
11,
12], evaluates the energy savings when using static capacitors for reactive power compensation of various types of motors (IM of energy efficiency classes IE2 and IE3, DOL PMSM, DOL SynRM) in a pumping application. The energy savings when using motors of 3.7 kW, 60 Hz, four poles of various types in a pumping station and their payback period are assessed. Various characteristics of the motors are taken into account, including their cost, efficiency and power factor. The cost of capacitors and their effect on cable and transformer losses are also taken into account.
2. Evaluating Pump Station Power Consumption
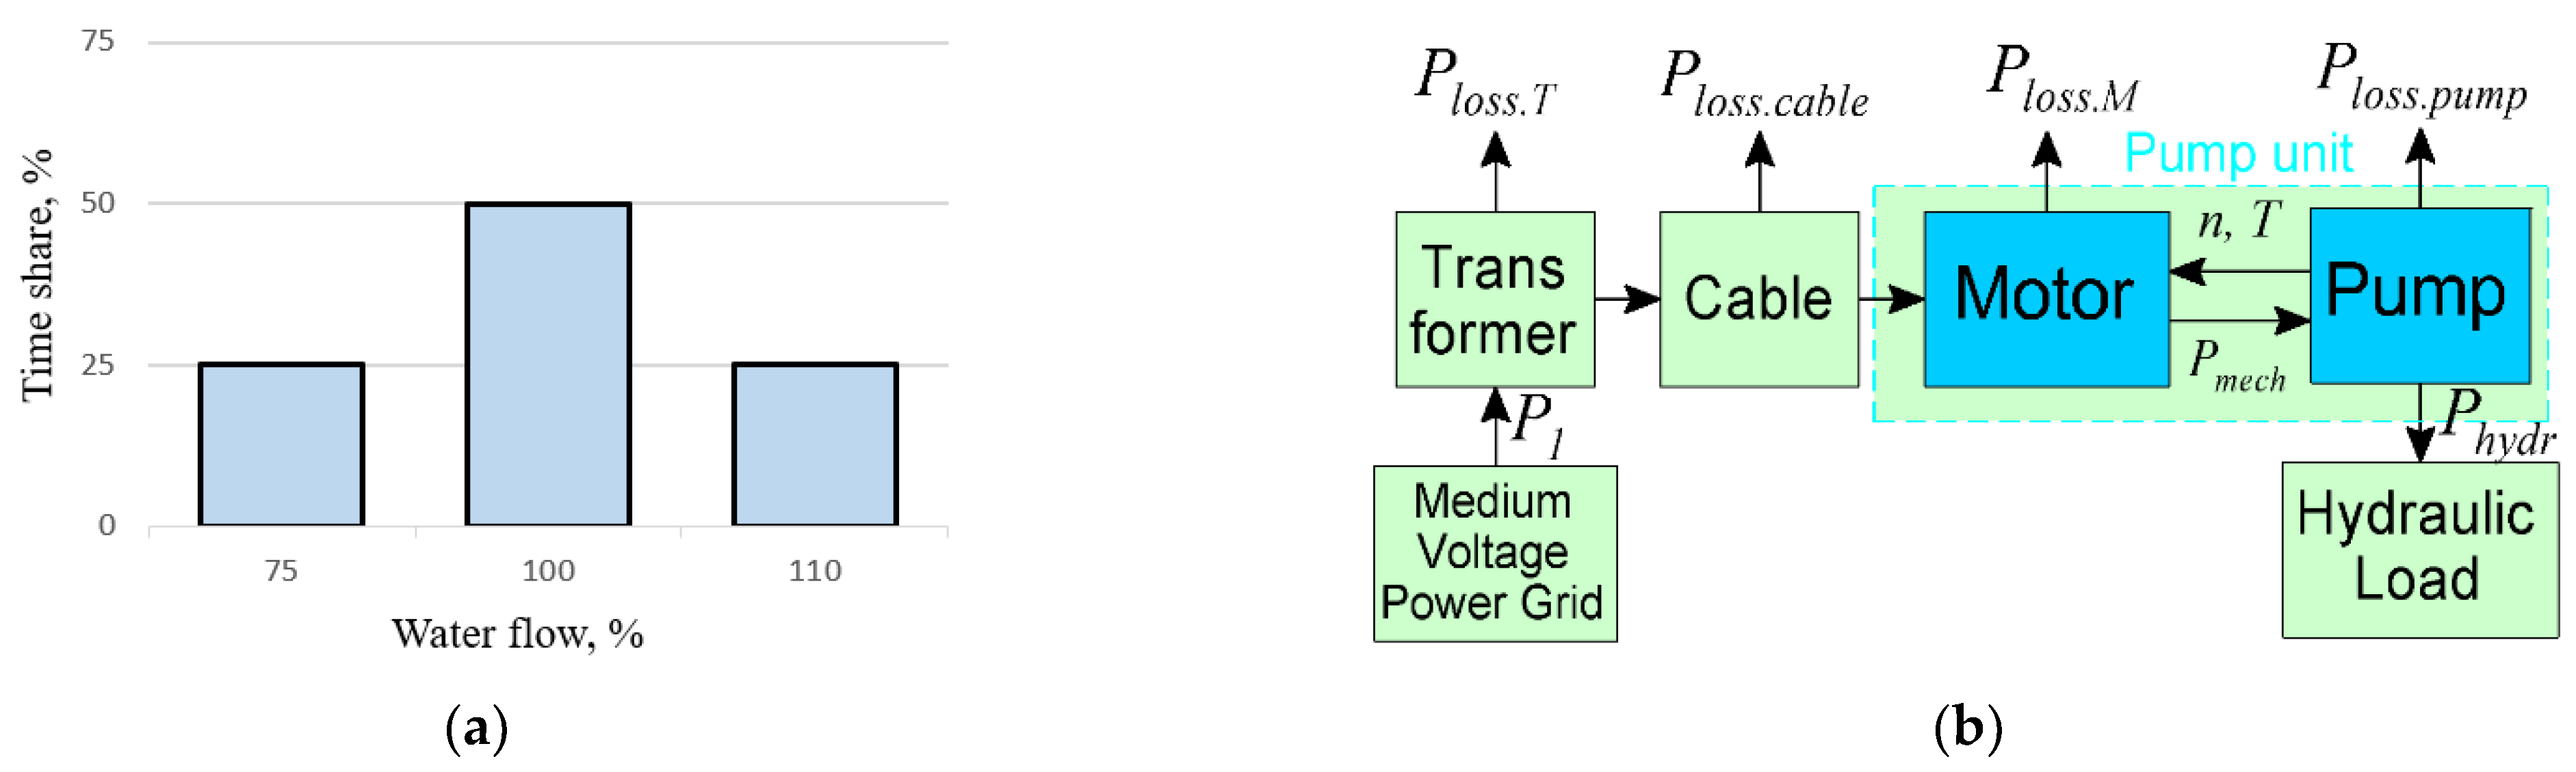
The article compares the power consumption of a pumping station when using different motors with a cyclical law of change in flow, shown in
Figure 3a. It is shown in [
13] that this flow-time diagram is typical for pumps without a variable speed drive (VSD). It is assumed that 100% flow demand corresponds to the best efficiency point (BEP) of the pump. This choice is justified by the fact that if the pump is chosen in such a way that its BEP corresponds to this flow rate, then the pump efficiency will be maximum, and the wear of the pump components will be minimal [
14].
Figure 3b shows a diagram of the losses in a pumping unit. To calculate the electrical power
P1 consumed from the mains, it is necessary to calculate the mechanical power
Pmech on the motor shaft at a certain flow rate
Q, as well as the corresponding value of the power losses in the motor, cable and transformer.
Figure 4 shows the diagram of the pumping station. Five pumps are connected to the mains through one transformer and cable. Each of the motors has the rated power of 3.7 kW, the rated frequency of 60 Hz and four poles.
The mechanical power of the motor is calculated using the dependence
Pmech(Q) provided in the catalog of the pump manufacturer. For the calculation, a pump of the HV105 type, 1800 rpm is considered (
Figure 5) [
15].
The real electrical power consumed by the pumping station from the grid can be calculated as:
where
Pmech is the input mechanical power of the pump;
ηmotor is the motor efficiency;
pcable is the electrical loss in the cable;
pT is the electrical loss in the transformer;
N1 = 5 is the number of motors of the pumping station;
P1 is the real power consumed by an individual motor of the pumping station.
The motor efficiency is determined by polynomial interpolation of the catalog data depending on the mechanical power. The losses
pcable and
pT depend on the load current:
where
Iload is the loading current of the cable and the transformer;
Rcable = 0.12 Ohm is the cable phase resistance;
IT rate = 43.4 A is the rated phase current of the transformer;
A = 121 W and
B = 568 W are determined based on the value of the transformer losses at
Iload = 0 and
Iload =
IT rate A (121 and 689 W, correspondingly, according to [
16]).
For the calculation, a cable with a cross section of 16 mm
2 and a length of 100 m and a transformer with a power rating of 30 kVA were considered (
Figure 4). The total load current is the sum of the currents of all motors of the pumping station:
The single motor current without capacitive compensation is calculated as:
3. Reactive Power Compensation Using Capacitors
The paper evaluates the reduction in power consumption of motors when using static capacitors to compensate for reactive power. The capacitors are assumed to be delta connected (
Figure 1d). The reactive power generated by the capacitors is calculated by the formula:
where
m = 3 is the number of phases of the capacitor bank; ω = 2·π·
f rad/s is the angular electric frequency;
f = 60 Hz is the electric frequency;
C is the line-to-line capacity of the capacitor bank;
V = 400 V is the linear voltage.
The reactive power generated by the motor at a certain load is calculated using the formula:
Therefore, the capacitance
C required for full compensation of the reactive power at a certain motor load can be calculated as:
The current with which the motor loads the cable and the transformer, taking into account the capacitance compensation, is calculated by the formula:
4. Motor Performances in the Pump Operating Cycle
For the calculation, the characteristics of four different motors were considered: DOL-PMSM (manufacturer WEG [
17]), IE3-IM (manufacturer WEG [
18]), IE2-IM (manufacturer WEG [
19]) DOL-SynRM (characteristics taken from the article [
20]) (
Figure 2).
Table 1 and
Table 2 and
Figure 6 show the characteristics of the considered motors.
The characteristics of motors for a certain value of mechanical power are determined using polynomial interpolation of the data shown in
Figure 6. The characteristics of the motors calculated in this way at the considered three operating points of the pump (
Figure 3a) are shown in
Table 3.
When using delta-connected capacitors at the motor terminals (
Figure 1d), the efficiency of the motor does not change, but the magnitude of the current with which the motor loads the cable and transformer, and, consequently, losses in these elements change, which also affects the total energy consumption. The phase capacitance of the capacitor bank is calculated according to the formula (8) in order to fully compensate for the reactive power of the motor at
Q = 100% (the longest loading condition, according to the diagram in
Figure 3a). For the IE3 IM case, the phase capacitance of the compensating device (the capacitance of a separate capacitor) is 16 μF. For the IE2 IM case, the capacitance is 17 μF. For DOL SynRM the capacitance is 20.5 μF. For the DOL PMSM case the capacitance is 9.55 μF. At
Q = 75% and
Q = 110%, a slight undercompensation or overcompensation of reactive power is obtained.
Table 4 shows a comparison of the current with which the motor loads the cable and transformer, with and without capacitors.
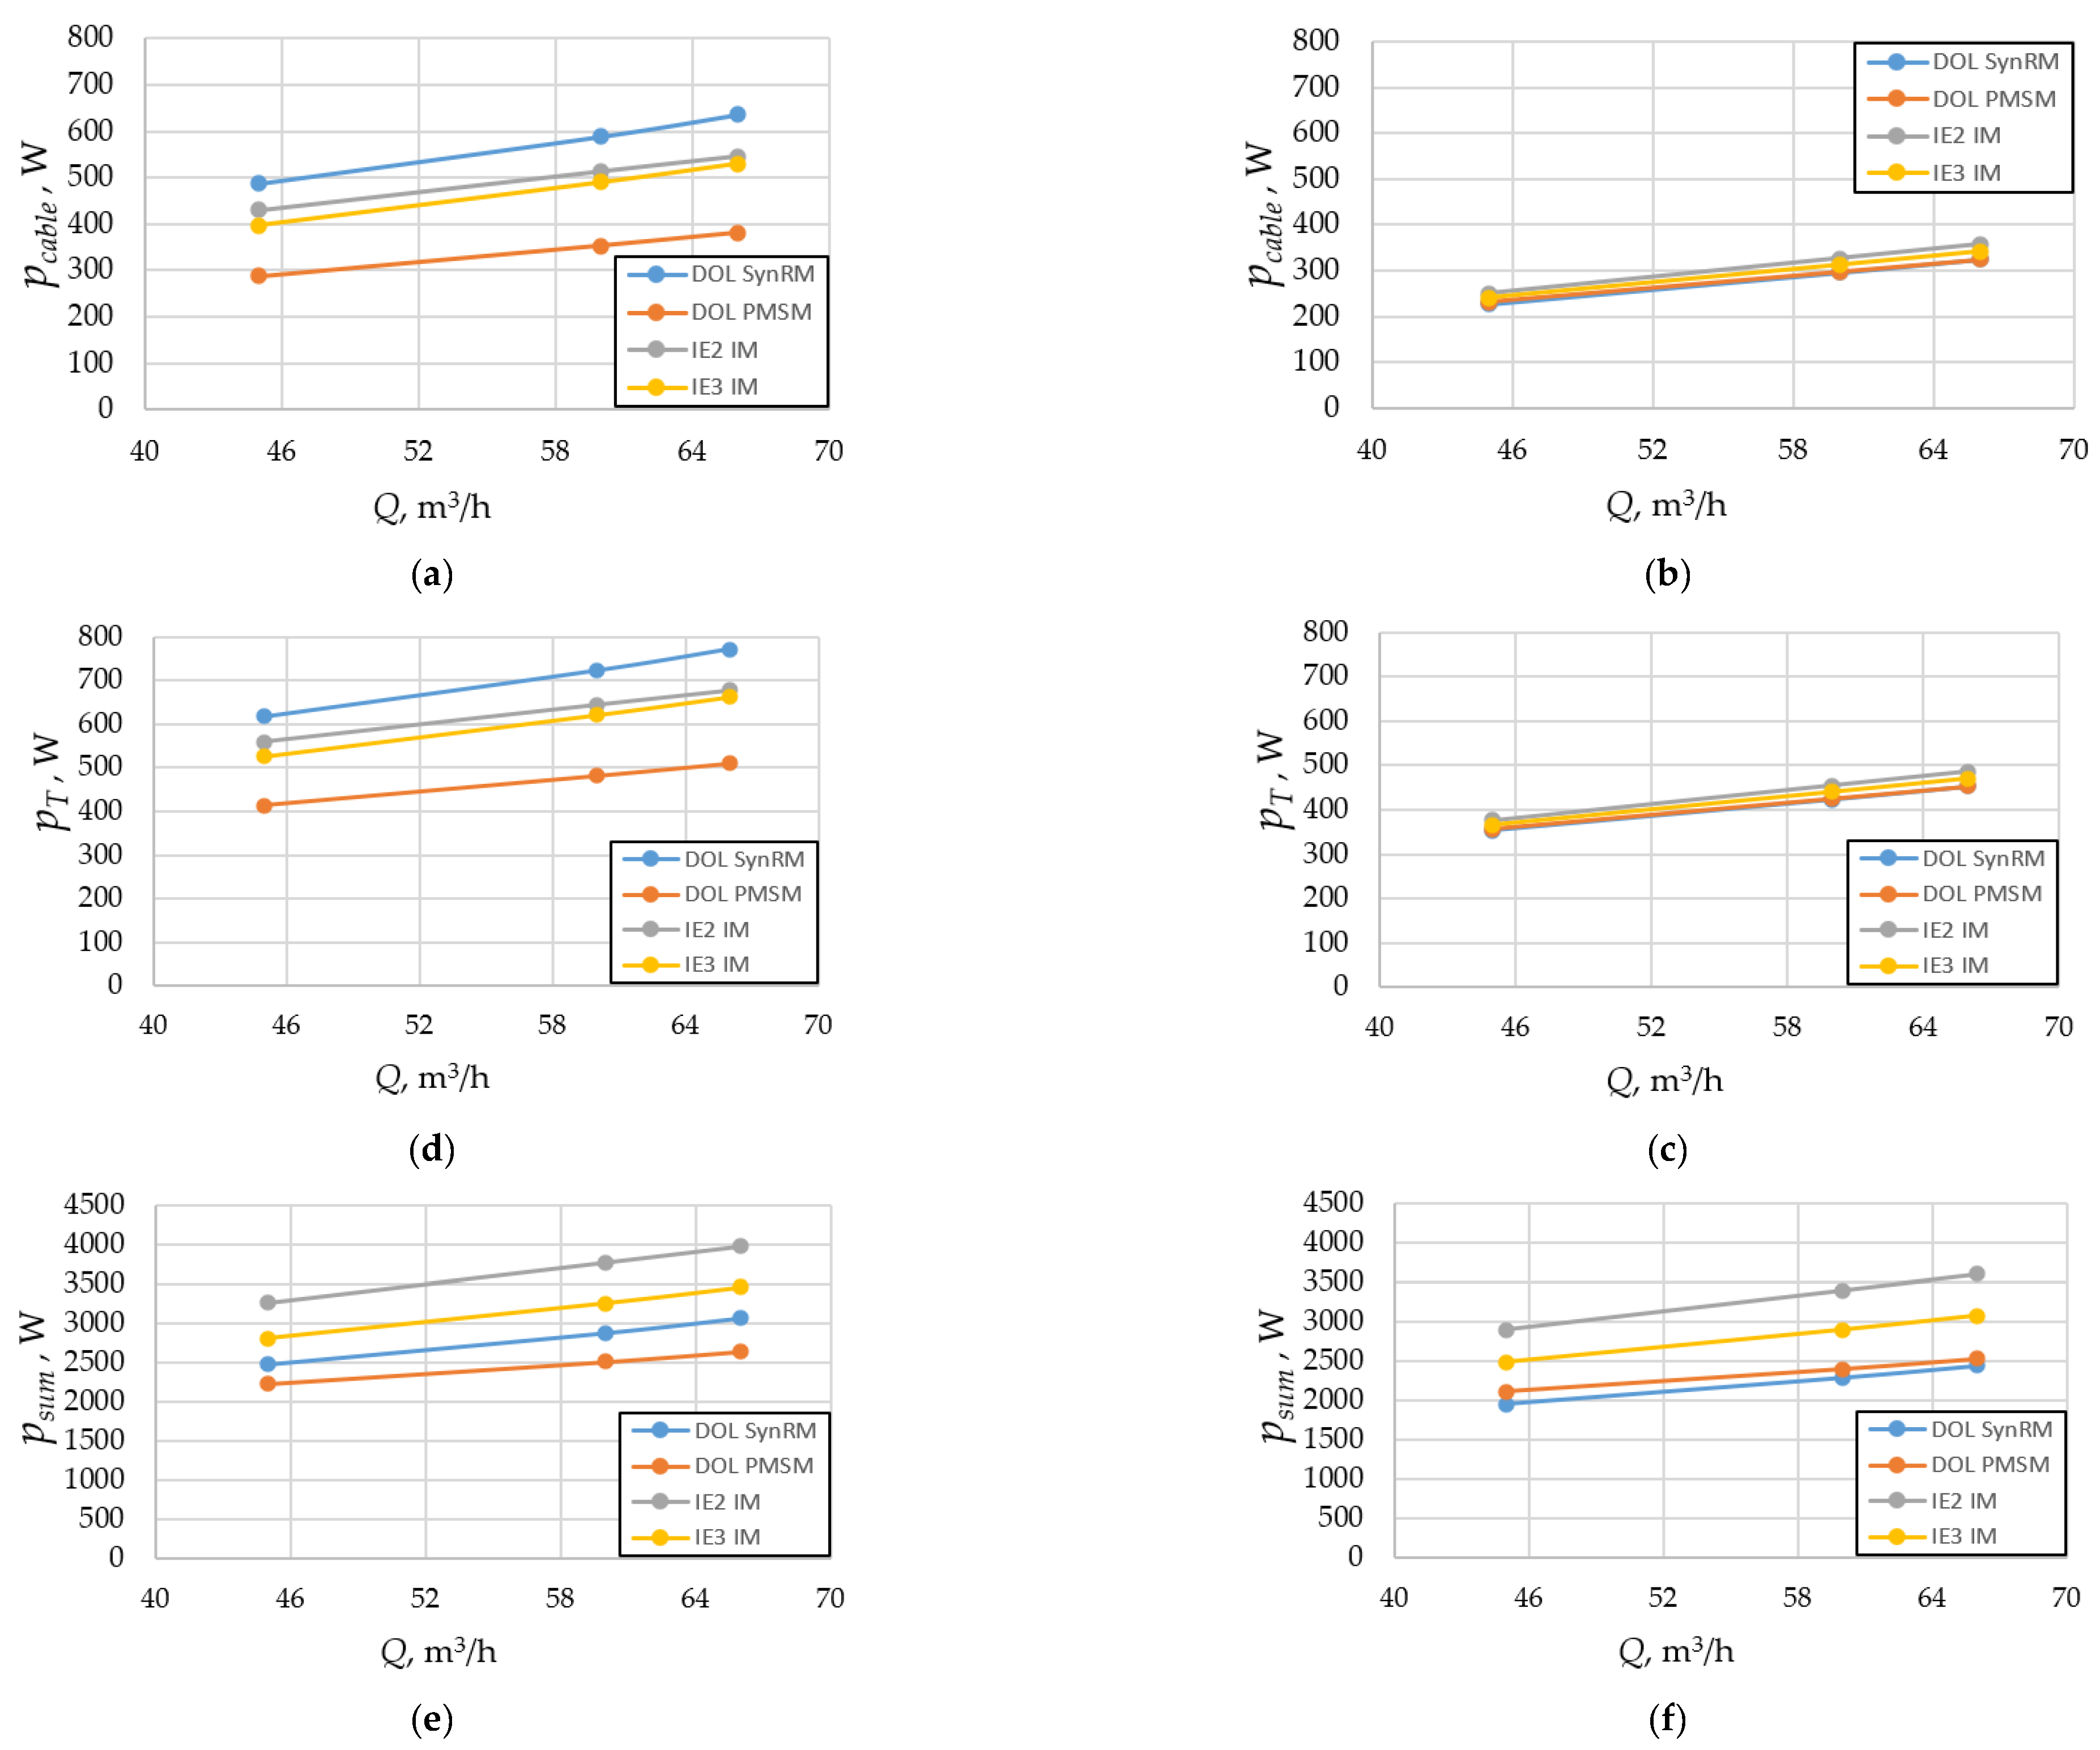
5. Cable and Transformer Losses
When calculating the losses of a station of five pumps (
Figure 4), the losses in the cable and transformer are taken into account. For the calculation, the parameters of a 30 kVA transformer from the catalog [
16] and the parameters of a cable with a cross-section of 16 mm
2 and a length of 100 m were selected. The cross-section of the cable was selected according [
21]. The losses in the cable
pcable were calculated using formula (2). The losses in the transformer
pT were calculated using the formula (3).
Figure 7 shows the results of calculating the cable and transformer losses. Total loss in the pumping station is also shown.
Figure 7a,c compare cable and transformer losses for various motor types without capacitive compensation.
Figure 7b,d compare the cable and transformer losses for various motor types using capacitive compensation. It can be seen that the use of capacitive compensation significantly reduces these losses for the induction motors and for the DOL SynRM, and that the losses in the cable and transformer become approximately the same for all types of motors when using capacitors. Since the DOL PMSM initially has a high power factor, capacitive compensation does not reduce
pcable and
pT significantly in the case of the DOL PMSM.
Figure 7e,f compare the total losses of the pumping station (five motors (
N1 = 5), cable and transformer)
psum =
P1Σ −
N1 ·
Pmech with and without using capacitors. It can be concluded that the use of capacitive compensation significantly reduces the total losses of the pumping station in the case of the induction motors and DOL SynRM. When using capacitors, the lowest losses are provided by using the DOL SynRM.
Considering all types of losses, the power P1Σ consumed by the pumping station from the grid can be calculated using the formula (1).
6. Lifetime Energy Savings Using Different Motors
Based on the calculated results on the power
P1Σ consumed from the medium voltage network by the pumping station and the power
P1 consumed by an individual motor, a comparison was carried out for the lifetime electricity savings for various considered variants of the electric drive. Daily electricity consumption is calculated using the formula:
where
i = 1 … 3 is the index of a loading point;
P1i is the eclectic power
P1 in
i-th loading point;
ti is the operation time of a loading point;
tΣ is the whole time period (24 h).
Then the annual energy consumption can be obtained as:
The cost of electricity consumed (in Euro), considering the applied grid tariffs
GT = 0.2036 €/kW·h for non-household consumers [
22] for Germany in the second half of 2019, was calculated as follows:
The expected lifetime of a pump is often evaluated to be about 20 years [
23]. In this section, the energy cost is estimated for a service life of
n = 20 years, excluding maintenance costs and the initial cost of the motors. The net present value (NPV) of the lifecycle cost was obtained as follows:
where
Cyear j is the energy cost of
jth year;
y is the interest rate (
y = 0.04);
p is the expected annual inflation (
p = 0.02);
n is the lifetime of the pump unit (
n = 20 years) [
23].
Lifecycle cost savings
SLCC for a given motor is calculated as:
where
CLCC is the lifecycle electricity cost of the considered motor;
CLCCIE2 is the lifecycle electricity cost of the IE2 IM without capacitors.
SLCC percentage is calculated as:
Table 5 and
Figure 8 show the results of the calculation of the lifecycle energy savings for various motor types. The savings are calculated compared to IE2 IM motor without capacitors.
It can be concluded that the DOL SynRM without capacitors consumes more energy than the DOL PMSM. At the same time, the energy savings of the DOL SynRM without capacitors are significantly higher than that of the IE3 IM without capacitors. If using the capacitors, the power consumption of the DOL SynRM is lower than that of the DOL PMSM. The savings when using IE3 IM with capacitors are almost the same as when using the DOL SynRM without capacitors. The savings when adding capacitors to the IE2 IM are slightly less than those of the IE3 IM without capacitors.
7. Payback Period of the Motors and Capacitors
Since different motors under consideration have different initial costs, it is necessary to compare not only the energy savings they provide, but also their payback periods. The payback period is calculated for all motors in case of replacement of the IE2 IM without capacitors. For this purpose, the data on the market prices of IE2 IM [
24] and AC capacitors of various capacities [
25] were used.
Studies [
26,
27] show that the difference in the market value of the IMs of neighboring energy efficiency classes is usually in the range of 15–30%. A comparison of market price information for specific IM models confirms these findings. For this calculation, we will assume that the IE3 IM price is 22.5% higher than the IE2 IM price. Let us also assume that the IE4 IM price is 22.5% higher than the IE3 IM price.
In the literature, there are various estimates of the increase in the cost of the DOL PMSM in comparison to the IE3 IM. Thus, in [
26] it is said the increase in cost is about 100%. However, the authors of this paper see no objective reason for such a large increase in cost. Comparison of information on market prices for specific models, as a rule, leads to a difference in the price of IE3 IMs and DOL PMSMs in the range of 30–40%. For this calculation, we will assume that the price of the DOL PMSM is 35% higher than the price of the IE3 IM. Many studies point out that there are no objective reasons for a significant difference in the cost of DOL SynRMs and IE3 IMs [
26,
28,
29]. For this calculation, we will assume that the DOL SynRM price is equal to the IE3 IM price (see
Table 6).
To compensate for reactive power, capacitors can be installed either individually for each motor (
Figure 9a) or connected to the common connection point for all motors (
Figure 9b). Capacitor banks (
Figure 9a) connected individually to the motor terminals have the advantage that individual pump units can be taken out of operation without generating excess capacitive power (“reactive power overcompensation”). In the considered application, this need can appear if the flow rate of the pumping station changes significantly over time [
30].
Similarly interesting is the case of connecting one large capacitor bank with linear capacitance
N1·C to the common connection point of the motors (
Figure 9b). In this case, the total current in the cable and transformer will be the same as when using individual capacitor banks on each of the
N1 motors with linear capacitance
C. However, the final cost of the capacitor bank will be lower, because as the rated capacitance of a capacitor increases, its cost per capacitance unit decreases, based on market price analysis [
25]. This makes it possible to shorten the payback period, in comparison with the case of installing capacitors on each motor, if the pumping station has an approximately constant flow rate, as in the case under consideration.
Table 6 also shows the prices for capacitor banks for the cases under consideration. For ease of comparison, all prices are for one motor, that is, in the case shown in
Figure 9b, the capacitor bank price is divided by the number of motors. For the case of
Figure 9b, the cost of the capacitor bank in terms of one motor turns out to be much less, which also makes it possible to significantly reduce the cost of the entire electric drive of the pumping station.
Based on the initial cost of motors and capacitors, as well as the annual energy savings (
Table 5), the payback period was calculated for different types of motors for the pumping station drive (
Table 7,
Figure 10). The results are shown for both the case without capacitors (
Figure 4) and for the two cases with capacitors (
Figure 9).
Without considering the possibility of installing capacitors, the most profitable solution is the DOL PMSM, which in this case provides the greatest savings and the shortest payback period, despite its highest initial cost. Due to its lower initial cost, the DOL SynRM without capacitors has approximately the same payback period as the DOL PMSM without capacitors, but provides significantly less savings over the lifetime (
Figure 8).
The IE3 IM without capacitors has the longest payback period of 2.75 years, which is significantly higher than DOL PMSM and DOL SynRM without capacitors. Comparing the options for installing capacitors, it can be concluded that the solution with installing capacitors on IE2 IM has the shortest payback period. With a limited upgrade budget, this is the most cost-effective solution.
However, in the long term, the most profitable is the use of the DOL SynRM with capacitors, providing the most energy savings. When using capacitors, the payback periods of the IE3 IM and DOL SynRM are significantly reduced. The payback period of the DOL PMSM varies little with using capacitors.
8. Discussion
This article investigated the impact of using static capacitive compensation on energy consumption and payback period for energy efficient electric motors in a pumping application. Compared to the IE2 induction motor, motors such as the IE3 induction motor, direct-on permanent magnet synchronous motor and direct-on-line synchronous reluctance motor are considered.
The comparison considers not only the efficiency of the motors, but also their power factor, on which the losses in the cable and transformer supplying the pumping station depend. The possibility of installing static capacitors to compensate for the reactive power of motors is also taken into account. The analysis takes into account that the motors have different initial costs, and also takes into account the cost of capacitors.
Without taking into account the possibility of using capacitors, the DOL PMSM has the shortest payback period (1.549 years), despite the highest cost, due to its high efficiency and high power factor, which can significantly reduce losses in the cable and transformer. The payback period of the DOL SynRM (1.553 years) is approximately equal to the payback period of DOL PMSM due to its higher efficiency and lower initial cost. At the same time, the payback periods of the DOL PMSM and DOL SynRM are significantly lower than that of IE3 IM (2.75 years).
The analysis shows that considering the possibility of installing static capacitors can significantly affect the results of comparing different motors in the application under consideration. Capacitors have a low initial cost compared to the price of motors, however, they allow you to compensate for the reactive component of the motor current, eliminate losses from this component in the cable and transformer, and therefore significantly reduce total losses. When using capacitors, the DOL SynRM has the shortest payback period (1.07 years).
The use of static capacitors will shorten the payback period of all the motors under consideration. When installing them, the payback period for the IE3 IM decreases most significantly (from 2.75 to 1.75 years). The DOL SynRM payback decreases from 1.553 to 1.07 years. The payback period of the DOL PMSM also decreases, but only slightly (from 1.549 to 1.52 years), since the DOL PMSM has a high power factor even without capacitive compensation.
If a pumping station has an approximately constant flow rate without the need for frequent shutdown of individual pump units, then installing one capacitor bank at the common connection point of the motors is more profitable than installing separate batteries of smaller capacity for each motor.
It is also shown that in the absence of the possibility of replacing the IE2 motor with more energy efficient ones, installing static capacitors on the terminals of the IE2 motor can be a good energy saving solution with a short payback period. In this case, the payback period of the capacitors is only 0.38 years.
The results of this study can be applied not only to pumps, but also to other mechanisms in which electric motors are powered directly from the AC mains and operate for a long time with little changing load, for example, fans, blowers, compressors, mixers, etc.
Author Contributions
Conceptual approach, V.K. and V.P.; data curation, S.O. and V.D.; software, S.O. and V.K.; calculations and modeling, S.O., V.K. and V.P.; writing—original draft, S.O., V.D., V.K. and V.P.; visualization, V.D. and V.K.; review and editing, S.O., V.D., V.K. and V.P. All authors have read and agreed to the published version of the manuscript.
Funding
The work was partially supported by the Ministry of Science and Higher Education of the Russian Federation (through the basic part of the government mandate, Project No. FEUZ-2020-0060).
Institutional Review Board Statement
Not applicable.
Informed Consent Statement
Not applicable.
Data Availability Statement
All data are contained within the article.
Acknowledgments
The authors thank the editors and reviewers for their careful reading and constructive comments.
Conflicts of Interest
The authors declare no conflict of interest.
References
- Stoffel, B. Assessing the energy efficiency of pumps and pump units. In Background and Methodology; Elsevier: Amsterdam, The Netherlands, 2015. [Google Scholar]
- Spee, R.; Wallace, A. Comparative evaluation of power factor improvement techniques for squirrel cage induction motors. IEEE Trans. Ind. Appl. 1992, 28, 381–386. [Google Scholar] [CrossRef]
- Obe, E. Steady-state performance of a line-start synchronous reluctance motor with capacitive assistance. Electr. Power Syst. Res. 2010, 80, 1240–1246. [Google Scholar] [CrossRef]
- Ferreira, F.; de Almeida, A. Method for in-field evaluation of the stator winding connection of three-phase induction motors to maximize efficiency and power factor. IEEE Trans. Energy Convers. 2006, 21, 370–379. [Google Scholar] [CrossRef]
- Tola, O.; Obe, E.; Anih, L. Modeling and analysis of dual stator windings permanent magnet synchronous motor. In Proceedings of the 2017 IEEE 3rd International Conference on Electro-Technology for National Development (NIGERCON), Owerri, Nigeria, 7–10 October 2017; pp. 861–871. [Google Scholar]
- Ogunjuyigbe, A.; Jimoh, A.; Nicolae, D.; Obe, E. Analysis of synchronous reluctance machine with magnetically coupled three-phase windings and reactive power compensation. IET Electr. Power Appl. 2010, 4, 291–303. [Google Scholar] [CrossRef] [Green Version]
- Yao, Y.; Cosic, A.; Sadarangani, C. Power factor improvement and dynamic performance of an induction machine with a novel concept of a converter-fed rotor. IEEE Trans. Energy Convers. 2016, 31, 769–775. [Google Scholar] [CrossRef]
- Ad’doweesh, K.; Smiai, M.; Haque, S. Power factor improvement of induction motor using microprocessor controlled FC-TCR compensator. J. King Saud Univ.-Eng. Sci. 1990, 2, 33–41. [Google Scholar] [CrossRef]
- Pereira, M.; Fitiwi, D.; Santos, S.; Catalão, J. Managing RES uncertainty and stability issues in distribution systems via energy storage systems and switchable reactive power sources. In Proceedings of the 2017 IEEE International Conference on Environment and Electrical Engineering and 2017 IEEE Industrial and Commercial Power Systems Europe (EEEIC/I&CPS Europe), Milan, Italy, 6–9 June 2017; pp. 1–6. [Google Scholar]
- Mohamad, M.; El-gawad, A.; Ramadan, H. Power factor improvement for pumping stations using capacitor banks. Int. J. Emerg. Electr. Power Syst. 2016, 17, 597–605. [Google Scholar] [CrossRef]
- Kazakbaev, V.; Prakht, V.; Dmitrievskii, V.; Oshurbekov, S.; Golovanov, D. Life cycle energy cost assessment for pump units with various types of line-start operating motors including cable losses. Energies 2020, 13, 3546. [Google Scholar] [CrossRef]
- Kazakbaev, V.; Prakht, V.; Dmitrievskii, V.; Golovanov, D. Feasibility study of pump units with various direct-on-line electric motors considering cable and transformer losses. Appl. Sci. 2020, 10, 8120. [Google Scholar] [CrossRef]
- Extended Product Approach for Pumps, Europump. 2014. Available online: http://europump.net/uploads/Extended%20Product%20Approach%20for%20Pumps%20-%20A%20Europump%20guide%20(27OCT2014).pdf (accessed on 29 July 2021).
- Barringer, H.P. A life cycle cost summary. In Proceedings of the International Conference Maintenance Societies, Perth, WA, Australia, 20–23 May 2003; pp. 20–23. [Google Scholar]
- Neptuno Oumps, Engineered Pump Catalog 60 Hz Perfomance Curves, Neptuno Fluid Technology Ltd., 026016 Edition, Document Number NP-PPC-6016R3. Available online: https://neptunopumps.com/wp-content/uploads/2021/02/neptuno-pumps-60-hz-vtp-perfomance-curves.pdf (accessed on 29 July 2021).
- Design Guide DG009001EN, Dry-Type Distribution Transformers−General Purpose, Eaton, February 2020. Available online: https://www.eaton.com/content/dam/eaton/products/design-guides---consultant-audience/eaton-dtdt-general-purpose-design-guide-dg009001en.pdf (accessed on 29 July 2021).
- Wquattro Super Premium Efficiency 5 HP 4P 182/4T 3Ph 230/460 V 60 Hz IC411-TEFC. Product Details. Available online: https://www.weg.net/catalog/weg/HT/en/Electric-Motors/AC-Motors---NEMA/General-Purpose-ODP-TEFC/TEFC-Cast-Iron/WQuattro-IE4-Super-Premium/Wquattro-Super-Premium-Efficiency-5-HP-4P-182-4T-3Ph-230-460-V-60-Hz-IC411---TEFC---Foot-mounted/p/13044694 (accessed on 29 July 2021).
- W22 IE3 5 HP 4P 112M 3Ph 220/440 V 60 Hz IC411-TEFC. Product Details. Available online: https://www.weg.net/catalog/weg/HT/en/Electric-Motors/AC-Motors---IEC/General-Purpose/Cast-Iron-Frame/TEFC-W22-IE2/W22-IE3-5-HP-4P-112M-3Ph-220-440-V-60-Hz-IC411---TEFC---B14L%28D%29/p/13063142 (accessed on 29 July 2021).
- W22 High Efficiency 5 HP 4P 182/4T 3Ph 230/460//380 V 60 Hz IC411-TEFC. Product Details. Available online: https://www.weg.net/catalog/weg/HR/en/Electric-Motors/Low-Voltage-NEMA-Motors/General-Purpose-ODP-TEFC/Cast-Iron-TEFC-General-Purpose/W22/W22-High-Efficiency-5-HP-4P-182-4T-3Ph-230-460-380-V-60-Hz-IC411---TEFC---Foot-mounted/p/11605508 (accessed on 29 July 2021).
- Liu, H.; Lee, J. Optimum design of an IE4 line-start synchronous reluctance motor considering manufacturing process loss effect. IEEE Trans. Ind. Electron. 2018, 65, 3104–3114. [Google Scholar] [CrossRef]
- IEC. Electrical Installations in Buildings—Part. 5-52: Selection and Erection of Electrical Equipment—Wiring Systems, Is the IEC Standard Governing Cable Sizing; IEC 60364-5-52; IEC: Geneva, Switzerland, 2009; Available online: https://webstore.iec.ch/publication/1878 (accessed on 29 July 2021).
- Eurostat Data for the Industrial Consumers in Germany. Available online: http://ec.europa.eu/eurostat/statistics-explained/index.php/Electricity_price_statistics#Electricity_prices_for_industrial_consumers (accessed on 29 July 2021).
- Waghmode, L.; Sahasrabudhe, A. A comparative study of life cycle cost analysis of pumps. In Proceedings of the ASME 2010 International Design Engineering Technical Conferences and Computers and Information in Engineering Conference (ASME 2010), Montreal, QC, Canada, 15–18 August 2010; pp. 491–500. [Google Scholar]
- Hindustan 5HP 3.7KW 4 Pole 1500 RPM B5 Flange MTG FR 112M 400V 60HZ IE2 Motor. Product Details. Available online: https://vashielectricals.com/p/hindustan-5hp-3-7kw-4-pole-1500-rpm-b5-flange-mtg-fr-112m-400v-60hz-ie2-motor/ (accessed on 29 July 2021).
- CAPACITOR 400V 450V 500V 25 Micro Farad Capacitor. Product Details. Available online: https://eclats-antivols.fr/en/condenser/1688-capacitor-400v-450v-500v-25-micro-farad-capacitor-5412810204809.html (accessed on 31 August 2021).
- Almeida, A. Motor Systems Technology Developments. In Proceedings of the 8th Motor Summit for Energy Efficient Motor Driven Systems Powered by Impact Energy, Zurich, Switzerland, 14–15 November 2018. [Google Scholar]
- European Commission Staff Working Document, Brussels, Impact Assessment Accompanying the Directive 2009/125/EC, 1.10.2019 SWD (2019) 343 Final. Available online: https://ec.europa.eu/transparency/regdoc/rep/10102/2019/EN/SWD-2019-343-F1-EN-MAIN-PART-1.PDF (accessed on 29 July 2021).
- Kersten, A.; Liu, Y.; Pehrman, D.; Thiringer, T. Rotor design of line-start synchronous reluctance machine with round bars. IEEE Trans. Ind. Appl. 2019, 55. [Google Scholar] [CrossRef]
- Hu, Y.; Chen, B.; Xiao, Y.; Shi, J.; Li, L. Study on the Influence of design and optimization of rotor bars on parameters of a line-start synchronous reluctance motor. IEEE Trans. Ind. Appl. 2020, 56, 1368–1376. [Google Scholar] [CrossRef]
- Koor, M.; Vassiljev, A.; Koppel, T. Optimal pump count prediction algorithm for identical pumps working in parallel mode. Procedia Eng. 2014, 70, 951–958. [Google Scholar] [CrossRef] [Green Version]
| Publisher’s Note: MDPI stays neutral with regard to jurisdictional claims in published maps and institutional affiliations. |
© 2021 by the authors. Licensee MDPI, Basel, Switzerland. This article is an open access article distributed under the terms and conditions of the Creative Commons Attribution (CC BY) license (https://creativecommons.org/licenses/by/4.0/).


