Recognizing Human Races through Machine Learning—A Multi-Network, Multi-Features Study


1
Computer Science Department, Babes Bolyai University, 1st Mihail Kogălniceanu Street, 400084 Cluj-Napoca, Romania
2
Computer Science Department, Technical University of Cluj-Napoca, 28th George Baritiu Street, 400027 Cluj-Napoca, Romania
*
Author to whom correspondence should be addressed.
†
These authors contributed equally to this work.
Mathematics 2021, 9(2), 195; https://0-doi-org.brum.beds.ac.uk/10.3390/math9020195
Submission received: 14 December 2020
/
Revised: 28 December 2020
/
Accepted: 15 January 2021
/
Published: 19 January 2021
(This article belongs to the Special Issue Recent Advances in Data Mining and Their Applications)
Abstract
:The human face holds a privileged position in multi-disciplinary research as it conveys much information—demographical attributes (age, race, gender, ethnicity), social signals, emotion expression, and so forth. Studies have shown that due to the distribution of ethnicity/race in training datasets, biometric algorithms suffer from “cross race effect”—their performance is better on subjects closer to the “country of origin” of the algorithm. The contributions of this paper are two-fold: (a) first, we gathered, annotated and made public a large-scale database of (over 175,000) facial images by automatically crawling the Internet for celebrities’ images belonging to various ethnicity/races, and (b) we trained and compared four state of the art convolutional neural networks on the problem of race and ethnicity classification. To the best of our knowledge, this is the largest, data-balanced, publicly-available face database annotated with race and ethnicity information. We also studied the impact of various face traits and image characteristics on the race/ethnicity deep learning classification methods and compared the obtained results with the ones extracted from psychological studies and anthropomorphic studies. Extensive tests were performed in order to determine the facial features to which the networks are sensitive to. These tests and a recognition rate of 96.64% on the problem of human race classification demonstrate the effectiveness of the proposed solution.
1. Introduction
The definition and taxonomy of human races is complex, subjective and fluid, as there are many paradigms that can be used when defining them. Generally speaking, the context of race is related to biological traits, such as (facial) bone structure, or hair, eyes and skin colour In Encyclopaedia Britannica [1] the concept of human race is defined as the “the idea that the human species is divided into distinct groups on the basis of inherited physical and behavioural differences”. The idea of human race, as known today, arose in the period of European colonization, when the colonizers took contact with local populations with different physical traits, languages, traditions and culture. However, up to this day, scientists have not reached a consensus regarding the definition or even existence of human races, the number of taxons or the features that can be used to discriminate between the races. For example, the anthropologist Charles Darwin [2], argued that the human races “graduate into each other” and therefore it is almost impossible to find cues that can clearly taxonomize the human race.
A standard taxonomy for human races was never established. For computer vision based recognition, the seven most commonly accepted racial groups are: “African/African American, Caucasian, East Asian, Native American/American Indian, Pacific Islander, Asian Indian and Hispanic/Latino” [3]. However several works, perform a rough classification into only two groups (European vs Mongolian race) based on the idea that race must be associated with large, separable geographic regions.
The “cross race effect” was first documented in the early 20th century and it refers to the fact that humans are better at recognizing faces of their own race than other races. This phenomenon emerges early in life, but it is not present at birth [4], and it seems to be influenced by the fact that the infant is predominantly exposed to faces belonging to its own race, and it adapts so that it can more accurately recognize faces from its own group [5]. These studies sustain the face representation model proposed by Valentine [6]: the faces are represented into an n dimensional space according to their deviation from a prototypical average computed from the average of all faces that person has been exposed to. Moreover, the “cross race effect” is encountered even for state of the art automatic face recognition algorithms. In [7], several face recognition algorithms developed in Western countries were compared to algorithms developed in East Asian Countries. Surprisingly, the algorithms developed in Western countries performed better on Caucasian faces than on Asian faces, while the East Asian algorithms performed better on Asian faces. This problem can be more simply explained in the case of machine learning: as the “knowledge” of an algorithm lies in the training data, the cross-race effect could be overcome by training the algorithms with subjects belonging to different races. Therefore, race balanced training and test datasets are crucial for the learning algorithm’s performance.
However, people constantly classify the human beings they encounter into numerous categories based on physical traits, tradition, language and so forth. These classification schemes used to create social groups and categories are crucial in understanding several concepts in human interaction, such as group polarization, social influence, social identity theory, just to name a few.
This work focuses on finding the best Convolutional Neural Network (CNN)-based solution for distinguishing between ethnic groups, and on establishing the most relevant facial regions that influence the classification process.
Automatic recognition of race and ethnic groups has great implications in a wide variety of disciplines, such as medicine, human computer interaction (HCI), biometrics, surveillance systems, visagisme and so forth. For example, race-based medicine and race targeted pharmacogenomics promote the use of race information in the diagnosis and treatment of several medical conditions that have specific responses from organisms of different races. Soft biometrics information (thus including race) can be embedded into video surveillance systems to improve the accuracy of person identification, and to narrow down the possible matches. Also, racial information can be used in HCI and targeted advertising systems in order to provide users ethnically adequate services, and thus avoiding the possibility of being offended by cultural taboos. A novel concept, visagisme, arise in the fields of fashion and optometry. The main purpose of visagisme is to determine the appropriate accessories in order to attenuate or, on the contrary, to highlight features of the face. The race information provides important cues for this task. Of course, numerous other applications can be envisioned.
This work will highlight the following contributions:
- The gathering of a large-scale “in the wild” face dataset (FaceARG) annotated with race and ethnicity information. To our knowledge, we gathered the largest available face database (of more than 175,000 images) annotated with race, age, gender and accessories information.
- The training and comparison of four state of the art convolutional neural networks (CNN) on the specific use case of racial classification. The taxonomy we propose contains four racial labels: Asian, Black, Caucasian and Indian.
- Finally, multiple facial image corruption experiments are employed in order to understand what facial features the networks see as relevant in perceiving race, and to compare the way the race is perceived by humans and the convolutional networks. These experiments show an agreement of the human perception with the computer based classification, but they also show that the CNN based systems are robust, largely invariant to missing facial features or regions.
The remainder of this work is organized as follows—in Section 2 we present various anthropomorphic features that might be used to distinguish between racial groups and some theories regarding how humans perceive race. In Section 3 relevant works from the scientific literature that tackle the problem of race classification are presented. Section 4 details the proposed solution and Section 5 describes the training and test dataset (their gathering and the augmentation process). In Section 4 we mention some implementation details and in Section 5 we discuss the experimental results we performed. Section 5.4 presents various visualizations techniques of the CNNs and their relation to how humans perceive the race. Finally, Section 6 concludes this work.
2. Related Works
A detailed survey on racial and ethnical classification from facial images is presented in [3]. The problem of race classification is discussed from the fundamental and analytical understanding of race based on an interdisciplinary expertise (psychology, cognitive neuroscience, anthropometry etc.), with emphasis on the various racial feature representations; also, the most relevant works in the field of automatic race classification from facial images are presented and compared.
From the perspective of racial features used, the state of the art methods use either chromatic information [8], global features [9], local features [10] or a combination of the above methods [10]. Chromatic based methods are usually based on the skin tone and are highly sensible to illumination conditions. Global based methods are the most commonly used and exploit the interrelations between different facial regions to establish the racial belonging. On the other hand, local features based methods categorize the race based on lower level features, such as Gabor filters [10] of histograms of gradient directions. Finally, hybrid methods combine some or all of the above presented methods to obtain the optimal representation for race classification.
None of these methods are suitable for all use cases—for degraded, low resolution facial images, the face should be treated as a whole object and the chromatic information can bring important information. On the other hand, for high resolution images geometrical and local feature models would be more appropriate.
Recently, with the emergence of deep learning, several works address the problem of race and ethnicity recognition using convolutional neural networks (CNN). In [11], the authors propose a deep network to classify visible and multi-distance near-infrared images solely into Asian or Caucasian race groups, as well as Male and Female groups. The network is trained and tested on images belonging to only 203 subjects and for the task of race classification it achieves an accuracy of 95%. In [12], the authors train and evaluate a deep learning race and ethnicity classification approach on three scenarios: (a) the recognition of white and black subjects, (b) the recognition of Chinese and Non-Chinese subjects, and (c) the classification of Han, Uyghurs and Non-Chinese people.
Some works attempted a more fine-grained classification, by classifying humans into ethnic groups. An analysis of both human and machine performance on a challenging ethnical classification task of Indian faces is presented in [13]. The authors gathered the Centre for Neuroscience Indian Face Dataset (CNSIFC) which consist of 1650 faces labelled with ethnicity (South vs. North Indian). Several classifiers were trained for this binary ethnic classification problem using spatial intensity features, local shape features or CNN based features. The best attained accuracy is 62% using CNN based features.
InclusiveFaceNet [14] learns gender and race attributes from a held-out dataset; the race and gender labels are not explicitly specified, just that the dataset contains two gender identities and four ethnic groups. Then, these learned representations are transferred to face attribute recognition models, allowing them to leverage ethical and gender representation without having to predict these attributes on the subject.
In [15], the authors gathered the Racial Faces in the Wild (RFW) dataset, consisting of 4K images divided into four ethnic groups—Caucasian, Asian, Indian and African. The database comprises images from MS-Celeb-1M [16], which where labelled with Face++ API [17] or the ethnic group was selected based on the information available on a list of celebrities. Using this benchmark, the study confirmed the racial bias of state of the art face recognition system. To overcome the racial bias problem the authors proposed a deep information maximization adaptation network by using Caucasian as source domain and other races as target domains.
Another work that addresses the problem of racial bias for face recognition is [18]. The authors authors envisioned an image generation method, which transfers racial characteristics, while preserving the identity features. The main idea of this image augmentation method is to make the racial related features irrelevant to the identity recognition problem.
3. Race and Gender Faces in the Wild
The gathering of training data–a time consuming process that also requires domain specific knowledge–is a crucial process in the context of machine learning. The training data determines what the network learns to recognize before being applied to unseen data. Nowadays, multiple facial image databases are publicly available and they made a significant contribution to the progress of machine learning, as they are used to train and evaluate the performance of machine learning algorithms.
However, datasets have received some criticism as they often narrow the focus of object recognition research by reducing it to a single benchmark performance number. In [19], the authors triggered a warning signal about database bias, a subject that has not received the appropriate attention from the scientific community. Starting from the fact that a scientist can easily (with 75% accuracy) determine the database from which an image came from, the study analyses the different kind of biases that can appear in the datasets, as well as the impact of this bias to the performance of the detection and classification accuracy. Four types of biases were identified: capture bias (dataset contain images captured in similar conditions), selection bias (datasets often contain some particular type of images: for example, street images), category bias (semantic labels are subjective and can be interpreted differently by labelers) and negative bias (what the dataset defines as the “the rest of the world”).
Since the publicly available image databases are rarely annotated with race information, we decided to gather a large dataset of public personalities annotated with race, gender, age and accessories (eyeglasses) information. With the observations from [19] in mind, we collected several lists of famous celebrities (actors, singers, athletes, politicians and mathematicians) belonging to each race class and automatically crawled the Internet for their images.
We collected lists of famous Afro-American, Asian, Caucasian and Indian subjects, and we grouped the images by race and gender. Faces were detected and cropped from all the images as described below (Section 3). As some images contain multiple faces, there human labelers carefully analysed the downloaded data, and annotated it with age and accessories information (eyeglasses). Also, the labelers discarded the false positive faces reported by the face detector. This dataset will be made public.
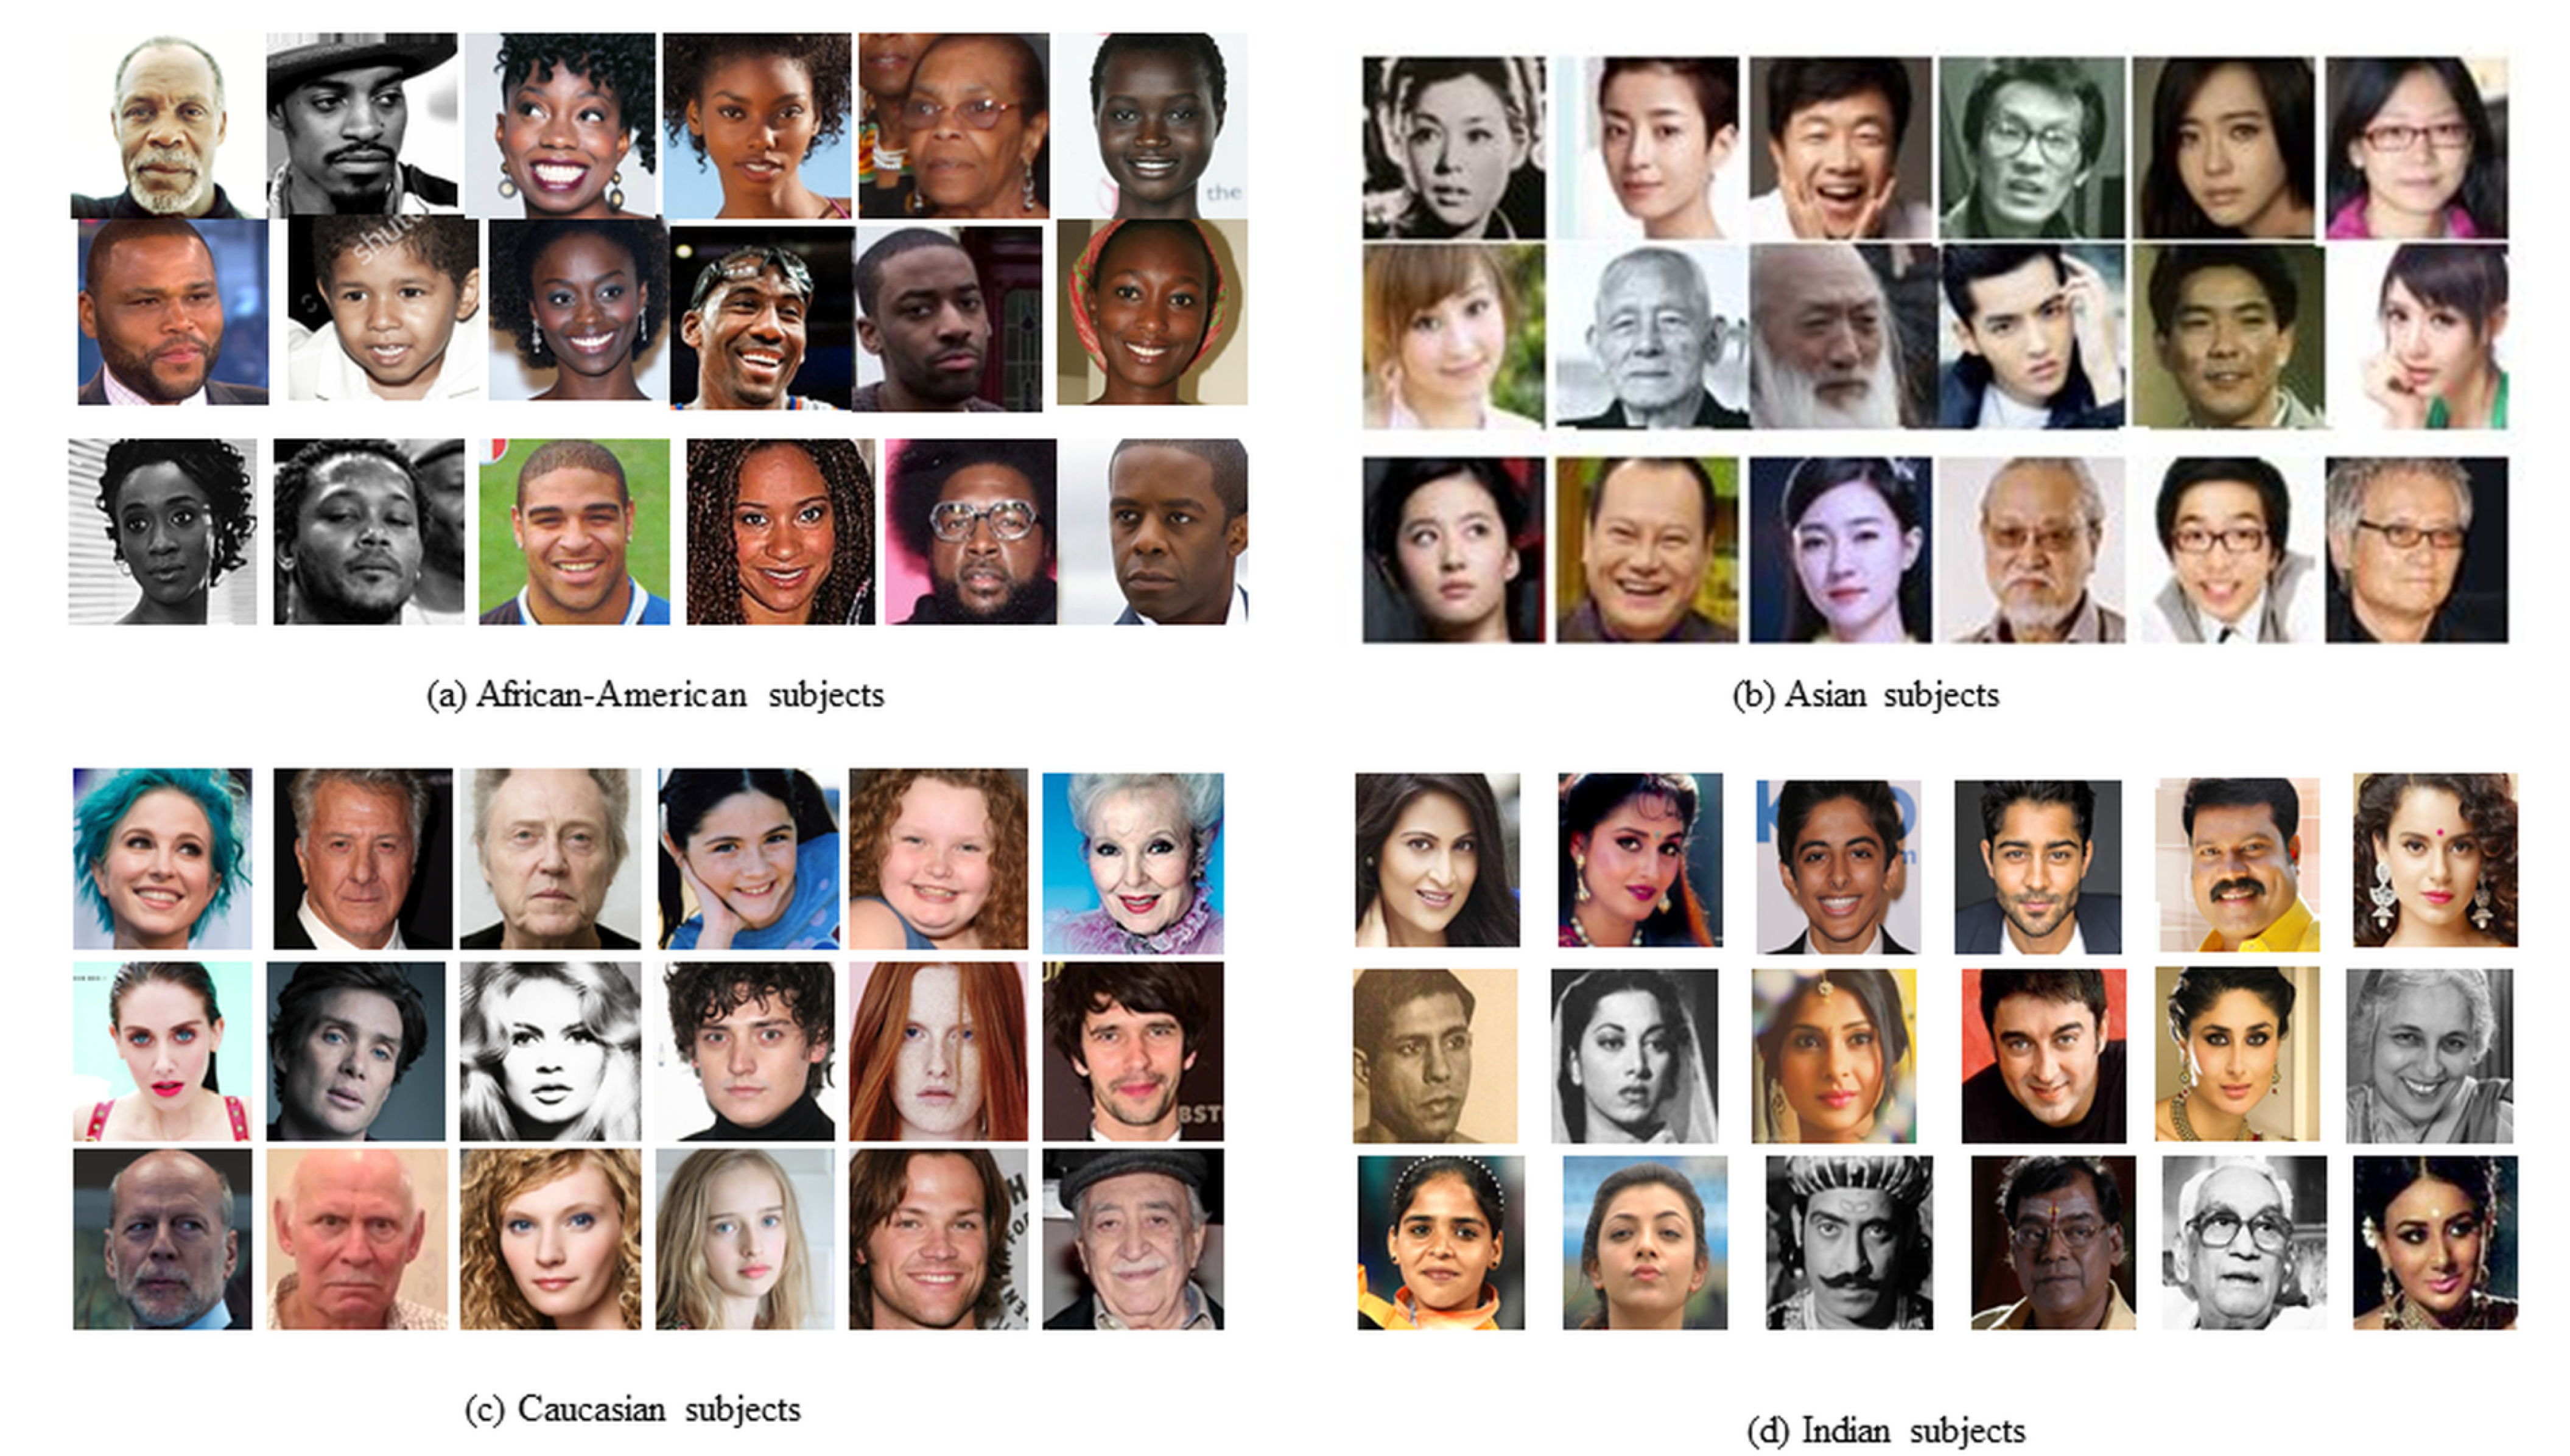
The face database we gathered contains approximately 175,000 facial images labelled with four race labels (African-American, Asian, Caucasian and Indian), gender, age and face accessories (eyeglasses) information (Figure 1). The number of images belonging to each race is approximately the same (24.02% African-American, 25.60% Asian, 24.42% Caucasian and 25.94% Indian).
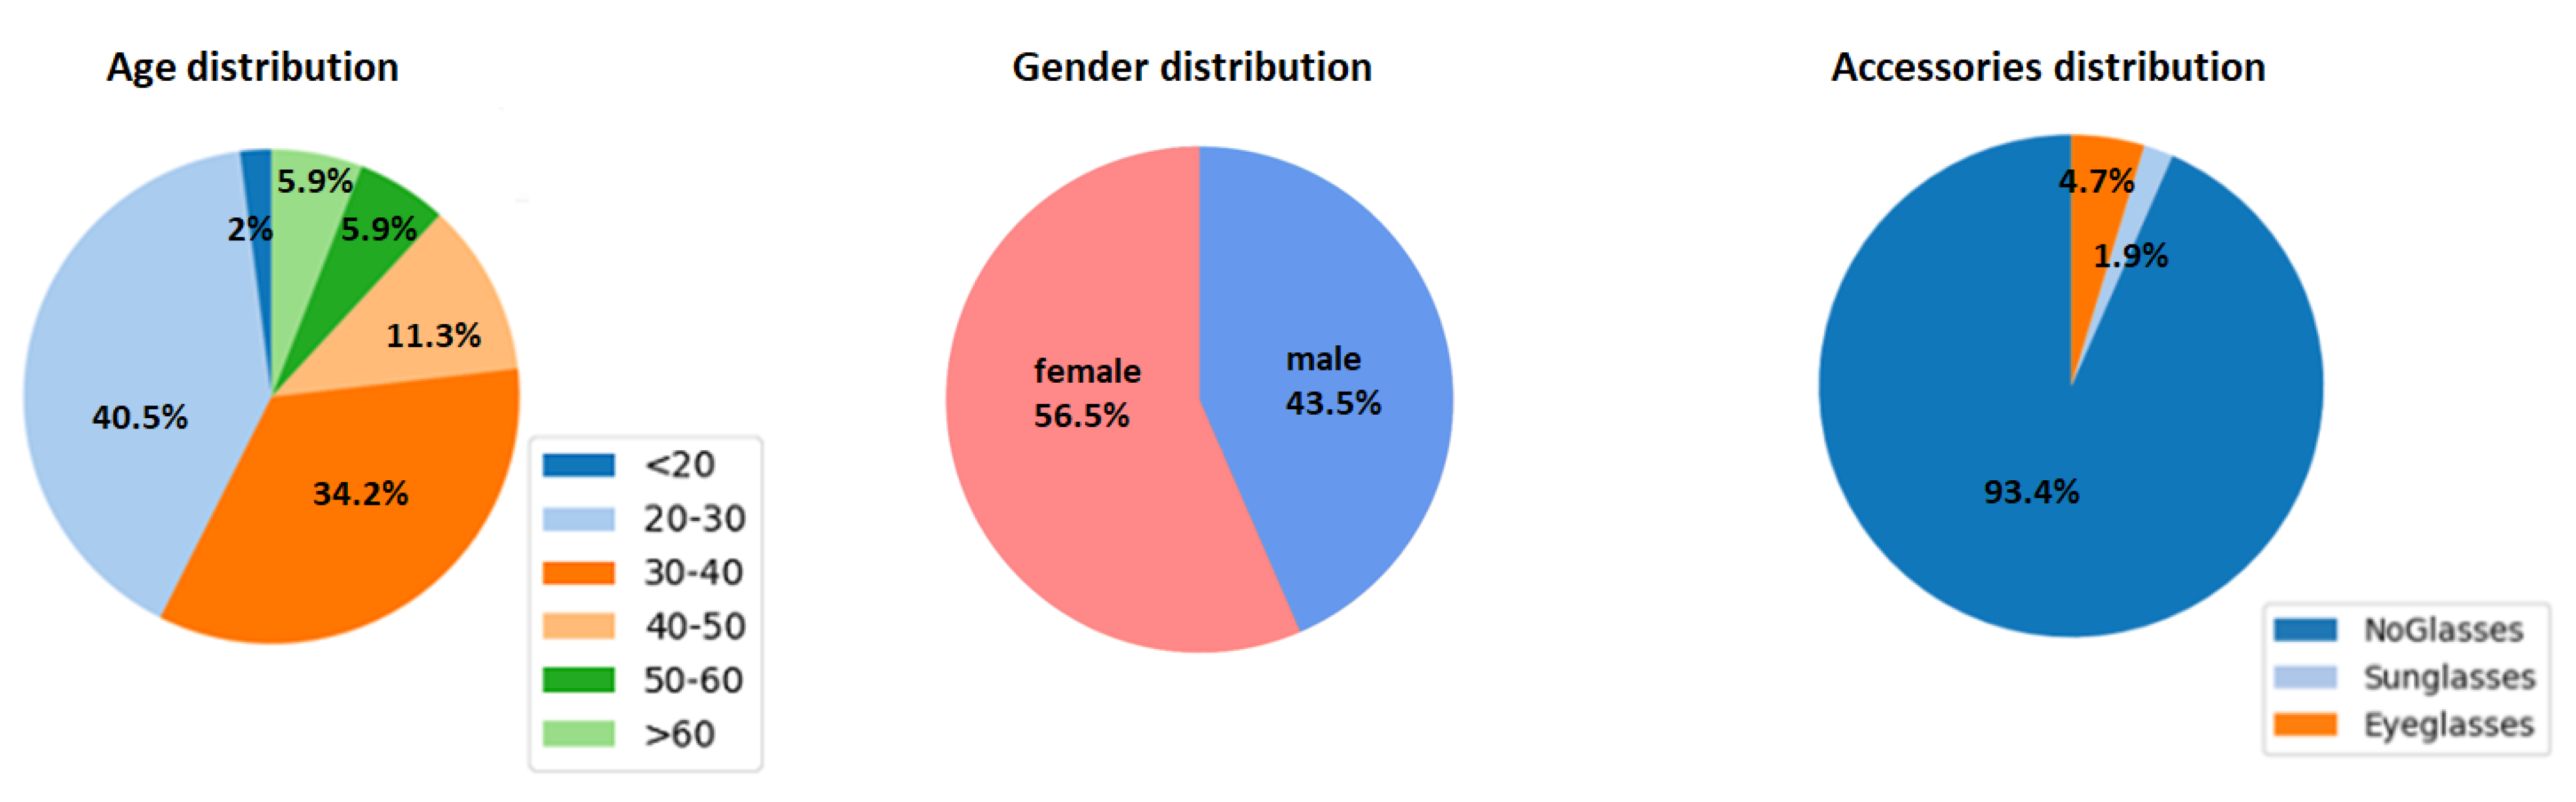
The distribution of the other labels in the dataset is depicted in Figure 2.
We argue that our training dataset minimizes the selection and capture bias as the images are collected automatically from the Internet, and were captured in different scenarios and with different camera. The problem of negative bias does not occur because the first step is to detect the face in the input image, and only then the images is labeled.
The racial belonging is subjective, especially in the case of multiracial subjects, and we tried to address the category bias using three independent human labelers. In order to further correct the database capture bias (that arises from the fact that photographers tend to capture pictures in similar ways) and to enlarge the dataset, we also performed several data augmentation techniques: random horizontal flips, applying small affine transformations, altering the brightness and contrast of the image and generating random horizontal crops.
For the validation of the proposed algorithm, we used a leave one subject out methodology: we selected images of persons which were not seen by the network and only these images were used to determine the performance of the classifier. In order to make the network to be equally discriminative for all classes, we equalized the race distribution for training.
4. Race Detection Using Convolutional Neural Networks
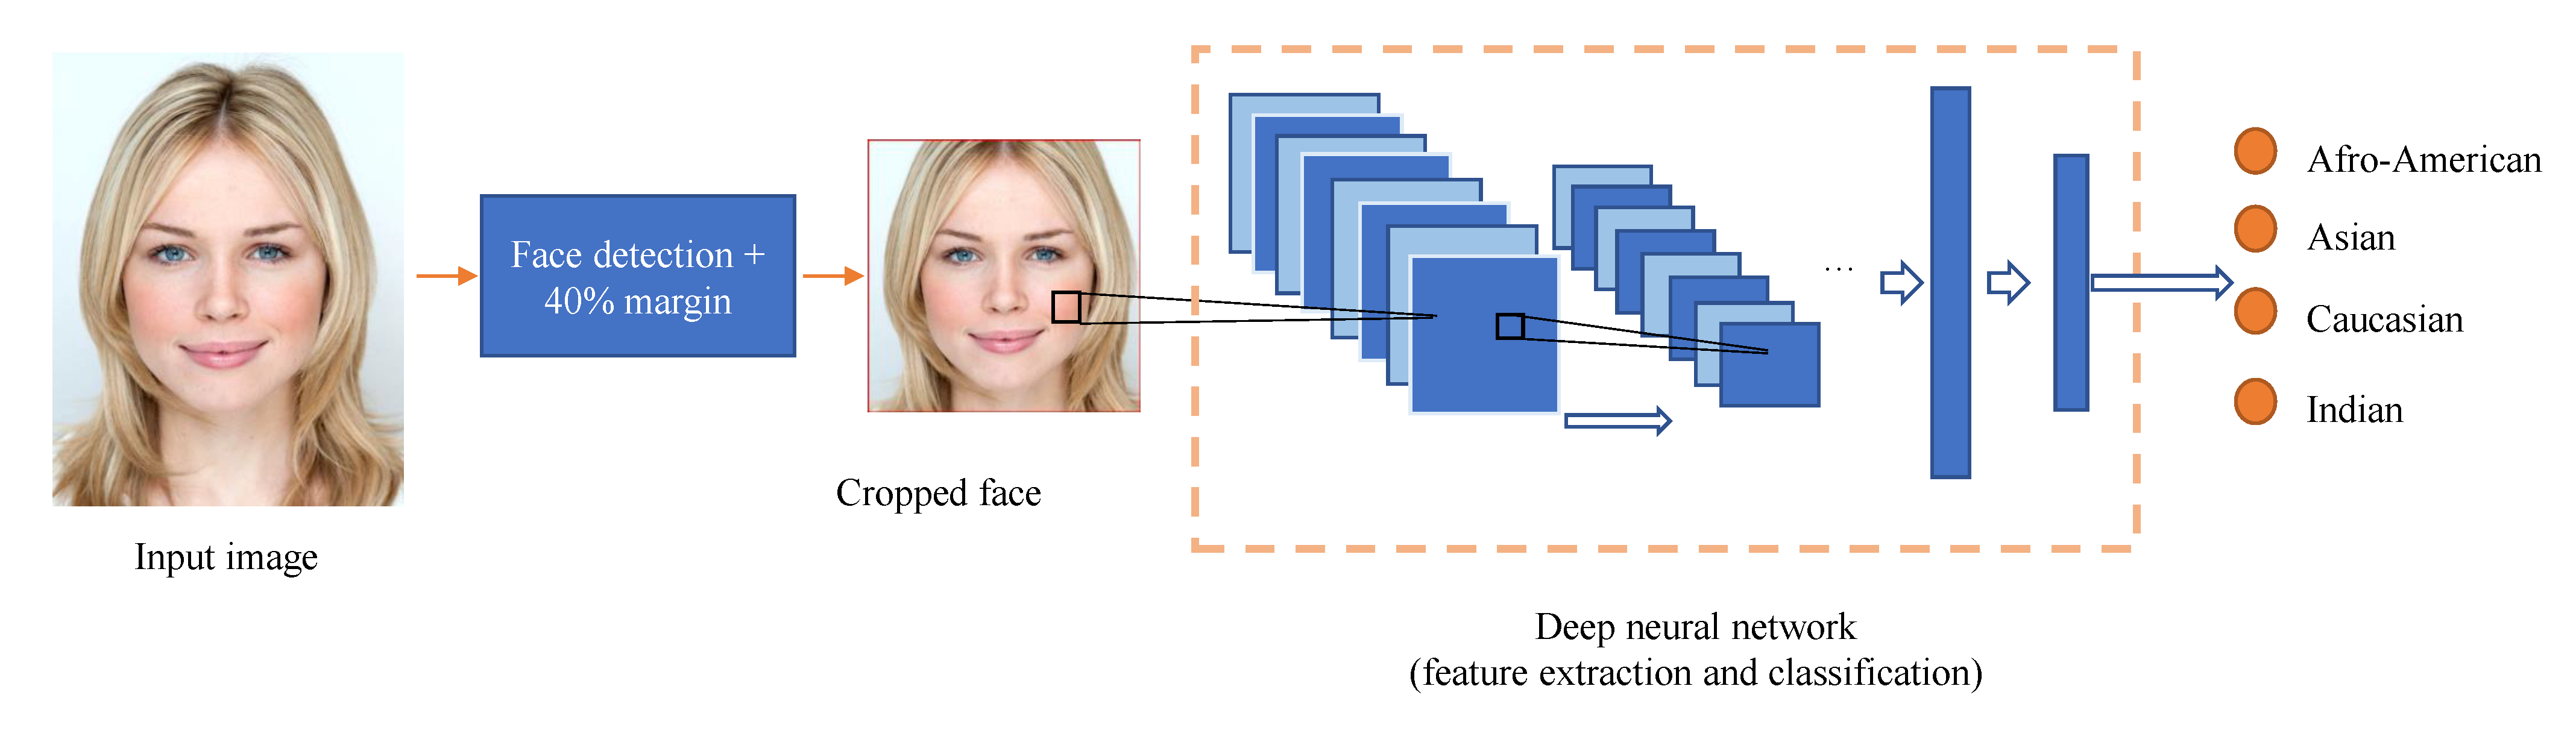
After gathering the data, we trained several convolutional neural networks to recognize the race classes in these images, such that we can establish the performance of state of the art algorithms for this problem. The outline of this basic framework is depicted in Figure 3.
The first step of the algorithm is to locate the face area in the input image. As opposed to other methods, that use complex alignment operations [20], we use a fast and simple normalization procedure. An off the shelf face detector [21] is used to find a square region corresponding to the face area. We heuristically determined that the area around the face (such as the hair structure and texture) contains valuable information, so the face region is also enlarged by 40% on width and on height. If the face is too large, the resulting image is clamped to edge. Finally, all the images are resized to a standard size as dictated by the input of the network architecture.
We chose to train and compare four different convolutional neural network (CNN) architectures to classify the input images into one of the four race categories—Afro-American, Asian, Caucasian and Indian: VGG19 [22], Inception ResNet v2 [23], Se-ResNet [24] and Mobilenet V3 [25].
Convolutional neural networks achieved near human performance to multiple computer vision tasks and since then nearly all computer vision tasks have been re-examined from a deep learning perspective [26,27,28]. Recently, significant progress has been made due to new paradigms and improved network architectures. Multiple attempts have been made to improve the accuracy of CNNs. The Visual Geometry Group (VGG) from the Oxford University [22] performed a thorough evaluation of CNNs and their performance, by modifying and evaluating the performance of the VGG architecture by iteratively increasing its depth, that is, adding more convolutional layers (up to 19 layers). In order to make this approach feasible, the size of the convolutional layers was significantly reduced (to 3 × 3 convolutional filters with 1 stride in all layers, as opposed to 11 × 11 receptive field with stride 4 in [29]). It can be easily observed that by stacking two 3 × 3 convolutional filters, the same effect as applying one filter with 5 × 5 receptive field is obtained. However, in the VGG case, two nonlinearities are applied, so the decision function is more discriminative. In addition, the number of parameters is much decreased.
The “network in network” architecture [30] replaces the traditional convolutional layers of CNN, by building mico-networks to abstract the data within the receptive field; each micro-network is instantiated with a multilayer perceptron. Based on this work, Google developed the Inception model [31] and proposed GoogLeNet, a 22 layer convolutional neural network, which won the ILSVRC 2014, with a top 5 error of 6.7%. The network achieved very good performance, at a relatively low computational cost and with fewer parameters. The main contributions introduced by GoogLeNet feature: the use of Inception modules—which perform multiple convolutions (with different filter sizes) in parallel and concatenate the resulting feature maps—stacked on top of each other and the use 1 × 1 convolutions before more expensive (3 × 3 or 5 × 5) convolution as a mean of dimensionality reduction. Using these concepts, the depth of the network is increased without an uncontrolled increase in the computational complexity. In addition, it also allows the visual information to be processed at different scales and then aggregated so the future layers can analyze features at different scales simultaneously. The original architecture was iteratively improved [32,33], until the latest version Inception-v4 [23], which achieved 3.08% top-5 error on the ILSVRC classification challenge. A similar performance was achieved by Inception ResNet v2 [23], an architecture that combines Inception modules with residual connections [34]; their main advantage is that they can significantly speed up the training time.
SENet architecture [24] is ranked first in the ImageNet Large Scale Visual Recognition Challenge (ILSVRC) in 2017 [26], bringing a relative improvement of roughly 25% over the winner of the previous year. The main contribution of SENet is the Squeeze and Excitation block (SE block), which models channel-wise feature-feature dependencies to increase the representational power of the network. A SE block is composed of two parts: the squeeze and excitation. The purpose of the squeeze step is the capture the global spatial information of a feature map into a channel descriptor; a global average pooling layer is used to generate channel-wise statistics. The output of this squeeze step is later fed into the excitation block, which will compute a set of specific channel weights, and therefore modelling channel-wise dependencies. This is achieved by a simple gating mechanism with a sigmoid activation.
This SE block can be incorporated into classical convolutional neural network architecture. To this end, we experimented with SE-ResNet architecture, in which the SE block is inserted into the ResNet [34] architecture right before the summation with the identity branch.
Finally, the last neural network that we trained and evaluated for the problem of race classification is Mobilenet V3 [25]. MobileNets are lighter architectures which are more suitable to be run on devices with limited computational power, such as embedded systems or mobile devices. Mobilenet V1 proposed depthwise separable convolutions (a depthwise convolution, followed by a part base convolution) to improve the computational efficiency of the networks. Its successor, Mobilenet v2 [35] further improves the by introducing the inverted residual block. Recently, reinforcement learning has been used to improve and automate the convolutional neural architecture design process [36,37,38]. This is the case for Mobilenet V3 [25], in which the network is generated by a combination of hardware-aware network architecture search combined with NetAdapt algorithm [38]. Also, Mobilenet V3 features some network improvements in the first and final layers and introduces the h-swish nonlinearity, a faster version and more “quantization-friendly” activation than the introduced swish function.
5. Experimental Results
5.1. Training
We also added images from several face databases [39,40,41,42], which were collected in constrained environments.
The Chicago Face Database [39] contains high-resolution, standardized images of 158 participants with ages between 18 and 40 years and extensive data about the subjects: race (Asian, Black, Hispanic/Latino, White), gender, facial attributes (feminine, attractive, baby-faced etc.). The labels of this dataset were converted to our taxonomy using the following rules: Asian-Asian, Black-African-American, Hispanic/Latino-Caucasian, White-Caucasian.
The Minear-Park [40] face database contains frontal face images from 575 individuals, with ages ranging from 18 to 93; the majority of participants are Caucasian (76%), followed by African-Americans (16%) and the remaining 8% are Asian, South Asian and Hispanic. The labels of this dataset were converted to our taxonomy using the following rules: Asian-Asian, African-American- African-American, Hispanic-Caucasian, Caucasian-Caucasian, South Asian-Indian.
The Japanese Female Facial Expression (JAFFE) [41] database contains 213 images of 7 facial expression posed by 10 Japanese female models. All the images from this dataset were added to the training data and labeled with the Asian class.
The Multi-Racial Mega-Resolution (MR2) [42] face database contains high quality, high resolution images of 74 European, African and East Asian subjects captured in a professional photography studio. The subjects have facial features that unambiguously place them in one of the racial categories and don’t have any unnatural hair colour or accessories. The labels of this dataset were converted to our taxonomy using the following rules: East Asian-Asian, African-African American, European-Caucasian.
Several other databases that contain thousands of images annotated with ethnic and/or racial labels are available. The Indian Movie Face Database (IMFDB) [43] contains more than 34,000 images of Indian actors that were manually selected and cropped from 100 indian movies. All the images are annotated with age, pose, gender, expression and the presence of occlusions. The main disadvantage of this database is that the images are cropped to a tight bounding box (from the forehead to the chin) and so they do not meet the requirements of the proposed solution. Another ethnic face database is the Korean Face Database (KFDB) [44]; it contains videos and images of approximately 1000 Korean subjects captured in controlled scenarios over a period of 3 years. However, this database is not publicly available. Morph face database [45] is a large scale longitudinal face database with meta-data (gender, race and age) collected over a lifespan of 8 years. The tagged racial labels are: African, European, Asian, Hispanic and Other. This database is not available free of charge; in addition, the database is unbalanced as more than 70% of the samples are of African subjects.
The code was written in python, and the CNNs were trained on Nvidia Tesla K40 GPUs using Google’s tensorflow framework [46]. Training the network took around 10 days.
We used the same training procedure for all the trained networks. The training is performed using the rmsprop optimizer [47], by dividing the gradient by a running average of its recent magnitude. The batch size was set to 32, the rmsprop momentum to 0.9 and the decay to 0.9. The learning rate was initially set to 10 and then exponentially decreased with a learning rate decay factor of 0.94. The learning rate is decreased after each 2 epochs.
5.2. Evaluation Protocol
To evaluate the proposed solution, leave-one-subject-out cross-validation is used in order to see if the trained models generalize well to an independent data set. To gather the dataset, we collected several lists of famous persons belonging to each ethnicity class and automatically crawled the Internet for their images. For each downloaded image, we also stored the query used to obtain it. Based on this information, we were able to use the leave one subject out validation technique. We selected the names of some celebrities that were not used in the training process and the proposed solution is evaluated on these images. In total, we selected 10,000 facial images (2500 for each race category).
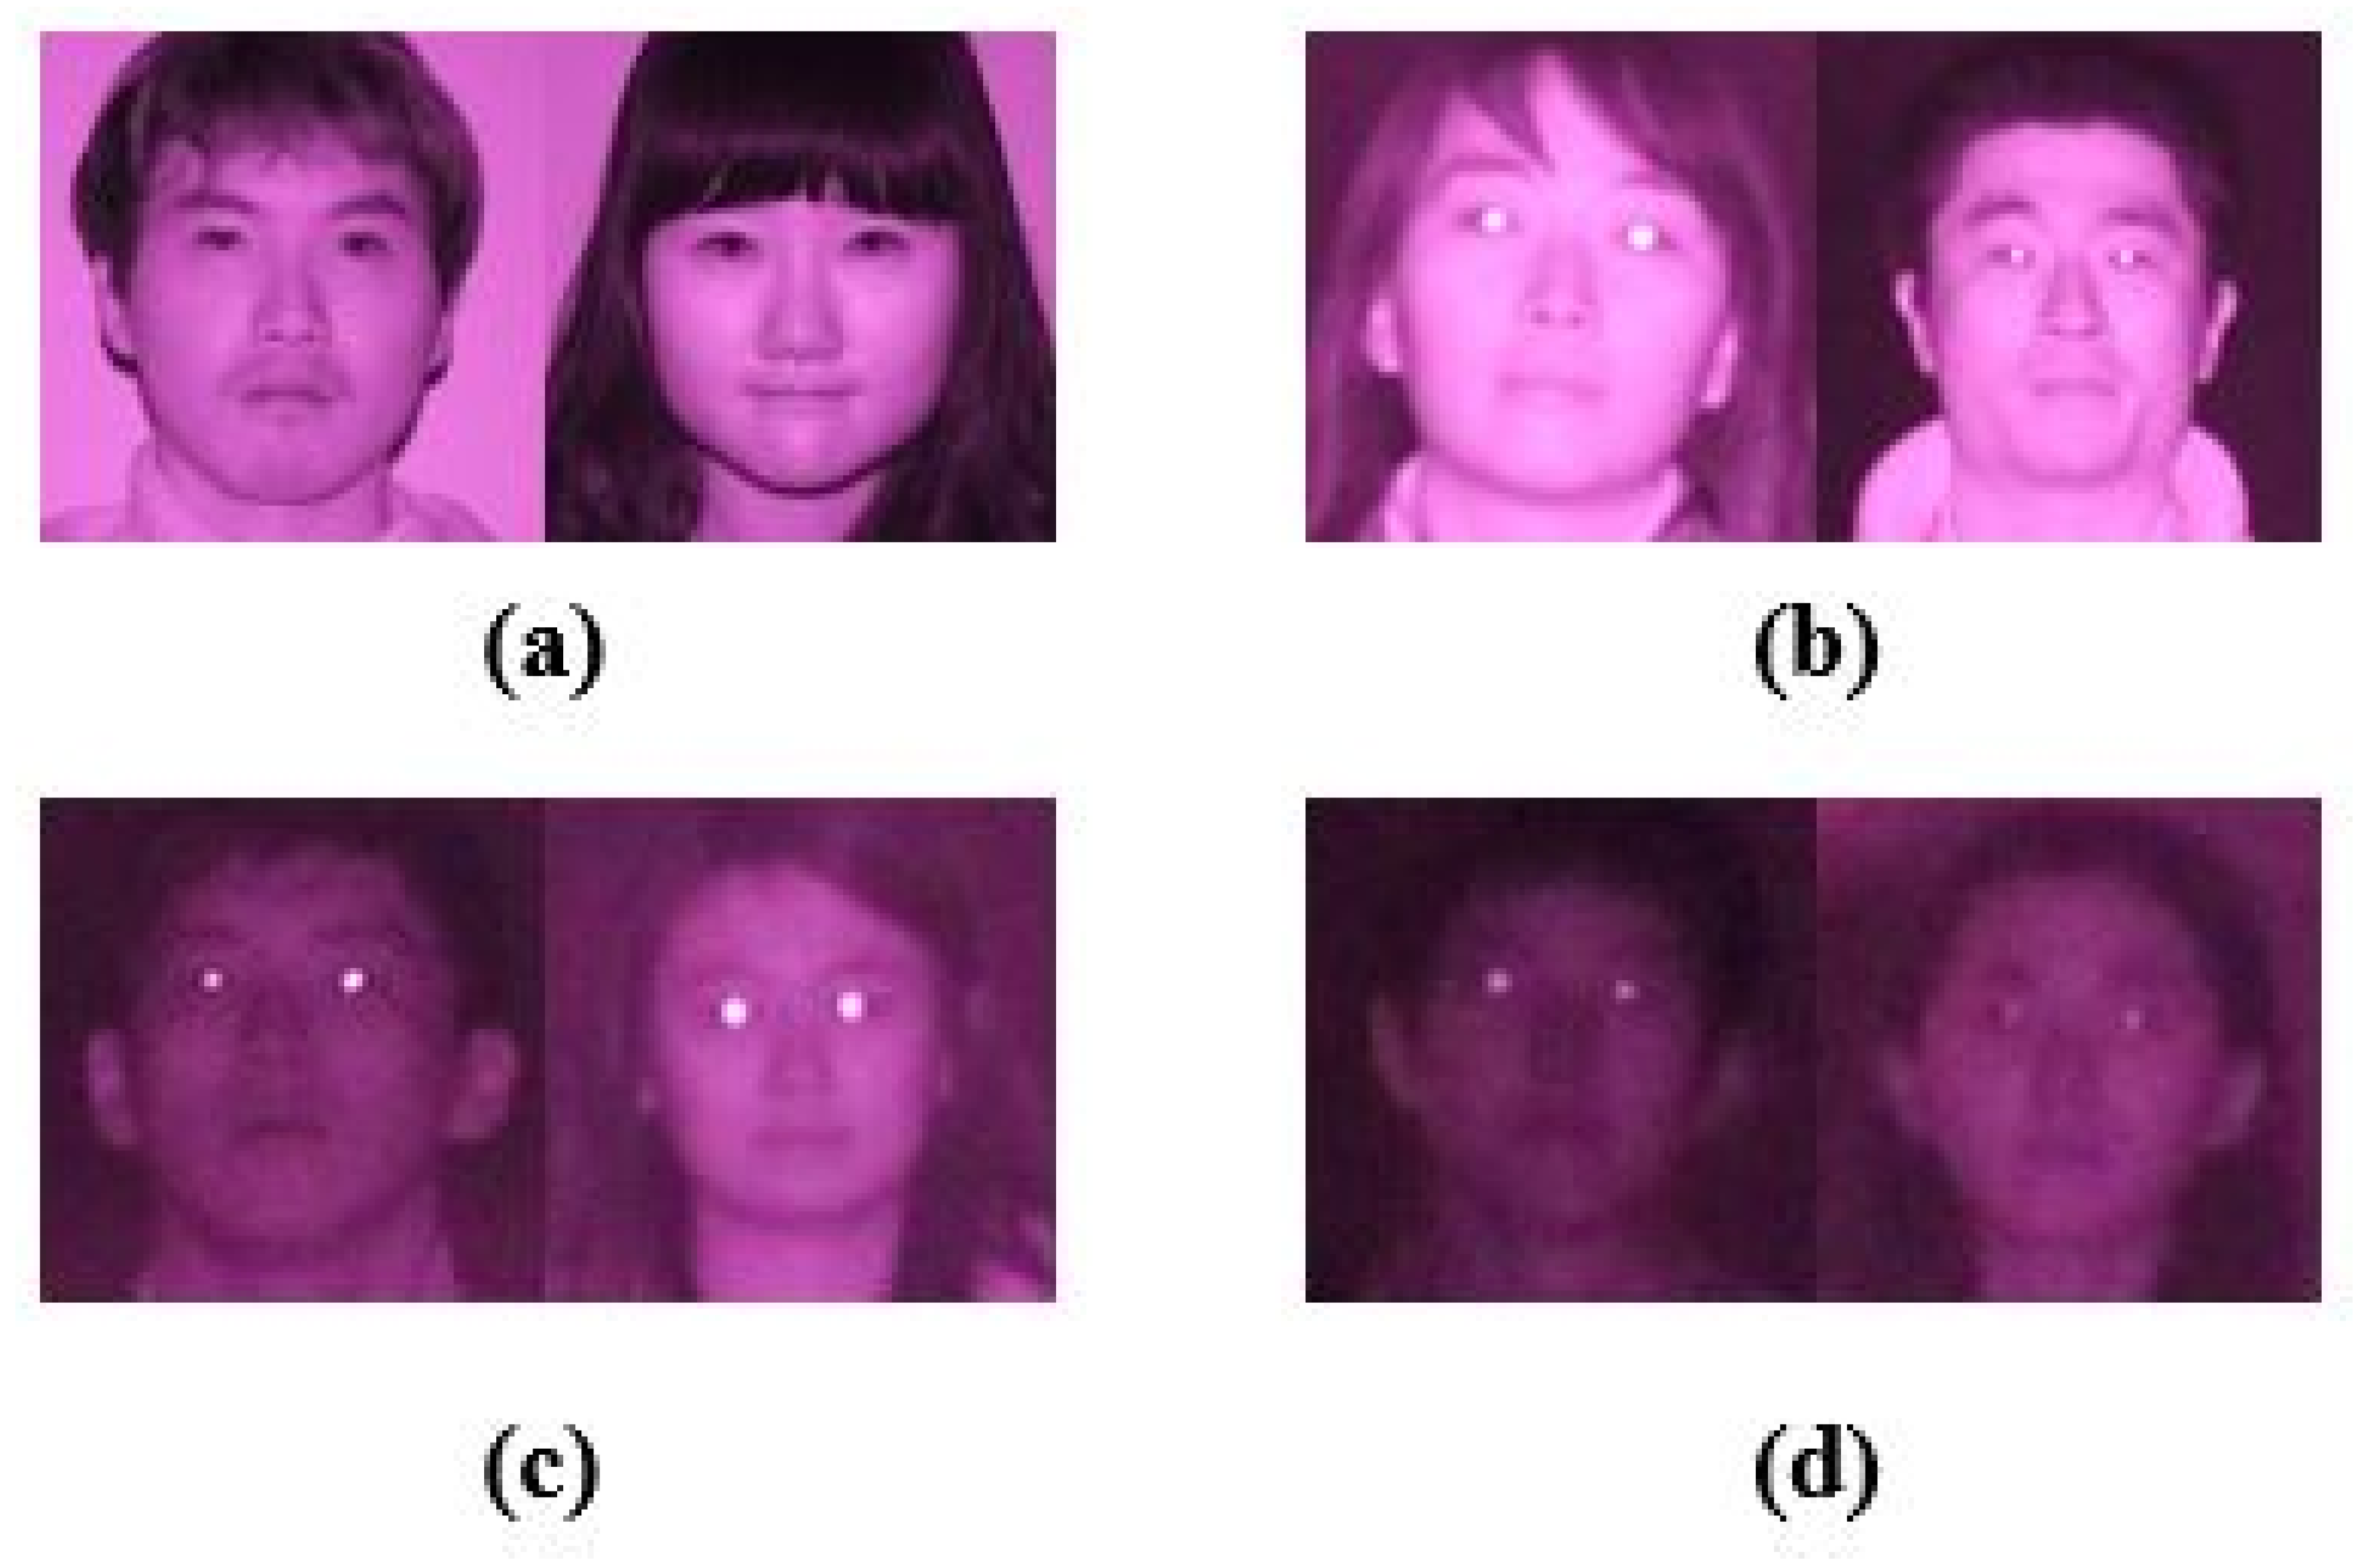
Moreover, we also evaluated the trained networks on other publicly available datasets which were not used in the training process—LHDF [48,49] and CAS-PEAL [50] in order to study the cross-dataset variance impact. The CAS-PEAL dataset is a large-scale Chinese database containing images of 1040 individuals (595 male and 445 female) with different variations (pose, expression, accessories and lighting). The LDHF database contains facial images of 100 subjects (70 males and 30 females), in both visible (VIS) and near-infrared (NIR) spectrum, captured at distances of 60 m, 100 m, and 150 m outdoors and at a 1m distance indoors.
5.3. Race Detection
In Table 1 we report the performance of our trained convolutional neural networks for the four-race classification problem. The networks attained similar performances: the best performance is obtained by Inception Resnet-v2 (96.36%).
We report the well-known metrics: precision (or positive predicted value), recall (or true positive rate) and the F1 score-the harmonic mean of precision and recall:
As we deal with a multilabel classification problem, when computing the precision, recall and F1 scores, we reported the results for each individual class label (the rows Afro-American, Asian, Caucasian and Indian), and also we aggregated the metrics globally (the row Overall) by counting the total true positives, false positives and false negatives. In all the networks, the Indian and Caucasian classes have lower precision rates. The confusion matrices for the race classification problem of all networks is reported in Table 2. The majority of confusions occur between Indian and Caucasian subjects, followed by Indian and African-American subjects.
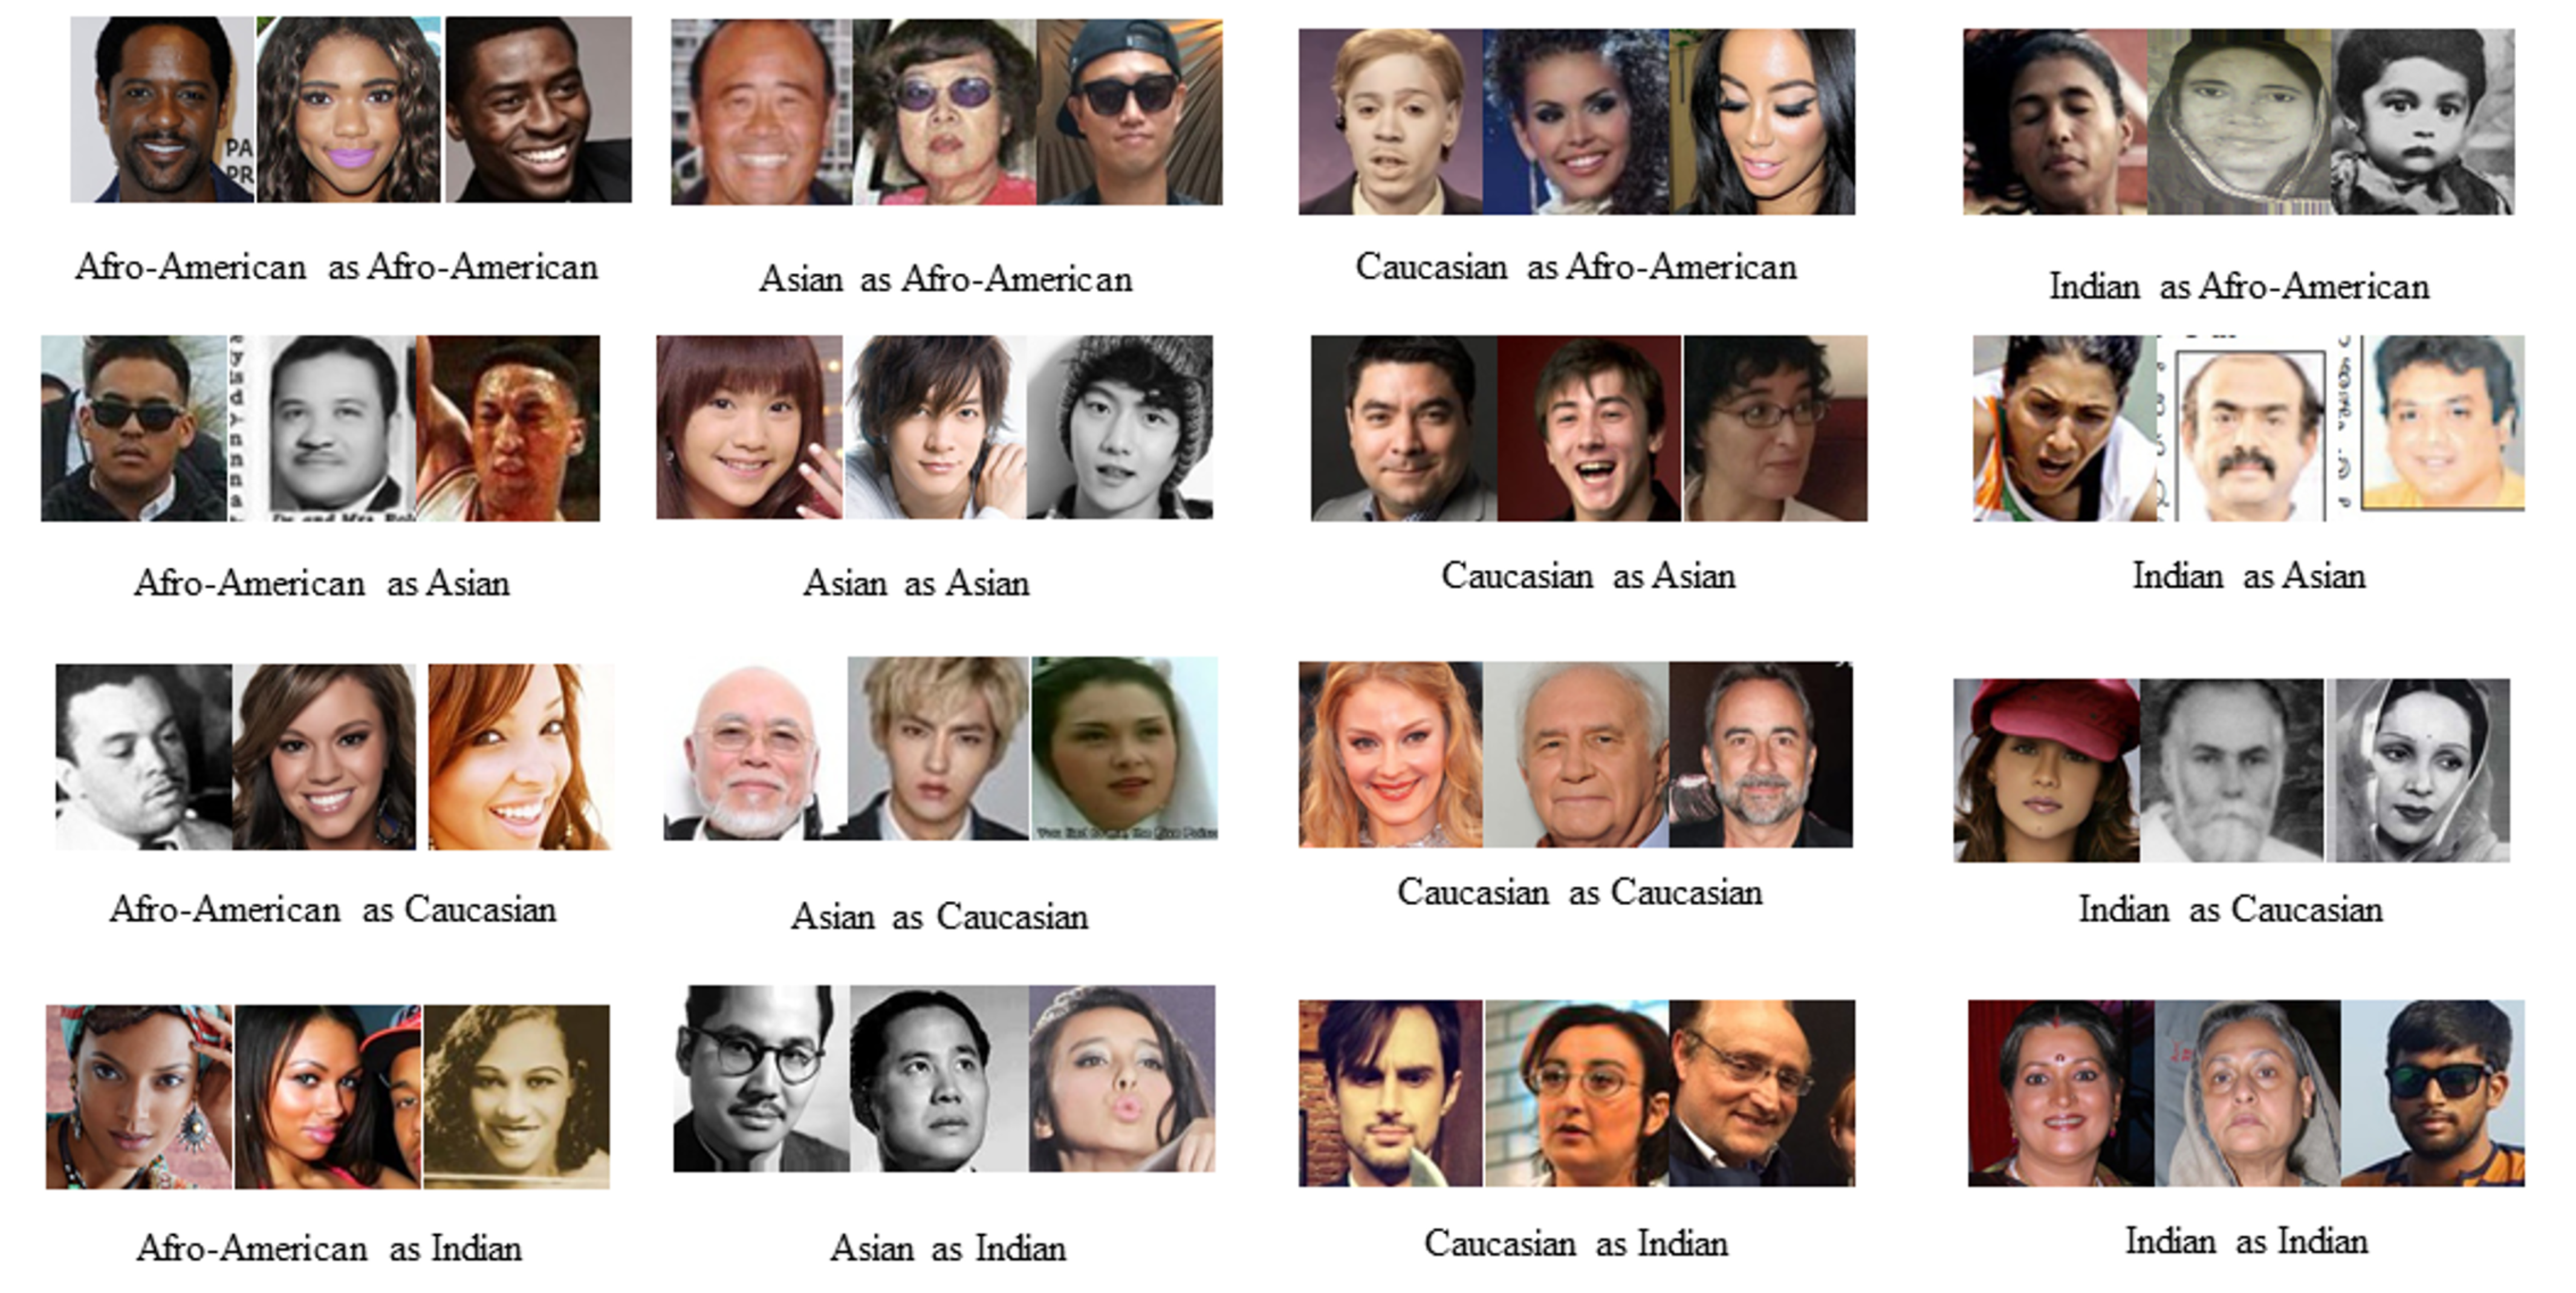
Some examples of correctly classified and misclassified images are depicted in Figure 4.
5.4. Robustness Analysis
There are several salient features of the face that influence the way humans perceive race: the iris texture, the whole peri-ocular region (eyelids, eyelashes and the canthus), the nostrils and the skin tone. We also performed some experiments in order to determine if the convolutional neural network “learned” and used the same classification features.
In early anthropometric studies, the skin color was used as a cue for race classification and anthropometry. In the 18th century, in the first edition of Systema Naturae [51], Carl Linnaeus proposed a four class taxonomy for humans based on the skin colour and continent. Another example of skin colour taxonomy is the von Luschan scale [52] which classifies the skin colour into 36 categories based on painted glass tiles. Nowadays, it is well known that human skin colour is determined by the melanin pigment, as a part of a natural process which controls the biochemical effects of ultraviolet radiation (UV) that penetrates the skin. As a result, a direct correlation between the geographical latitude (in other words, the UV radiation level) and the skin pigmentation can be established. The skin colour can greatly vary within the same ethnic group, so it should not be taken as a differentiating factor for ethnic or racial groups.
The first comprehensive and broad study on cranio-facial anthropometric measurements and the comparison of facial variations between races and gender is presented in [53]. The authors compared fourteen linear facial measurements of North American White (NAW) subjects with measurements of subjects from other countries in the world. As anticipated, there were few differences between the NAW and the Caucasian groups from Europe; the nose height of Caucasian was the measurement that seldom differed from that of the reference group. The measurements from the periocular region were found to be “one of the cranio-facial areas most exposed to visual judgement”: subjects from Asia and Middle East have a significantly larger intercanthal and binocular width, while the eye fissure length is much smaller than the one of the NAWs.
A more recent study [54], reviewed and collated numerous facial photogrammetric studies from the specialized literature in order to determine inter-ethnic and racial variations of various angular and linear facial measurements. The main inter-racial angular differences found by the study are: African males have a smaller naso-frontal angle compared to Caucasian males and a larger naso-facial angle than Asian males. The naso-labial angle is more obtuse in Caucasian females than in African and Asian females. Regarding the linear facial measurements, Caucasian females have, on average, a shorter facial height, a smaller width of the face as compared to Asian females.
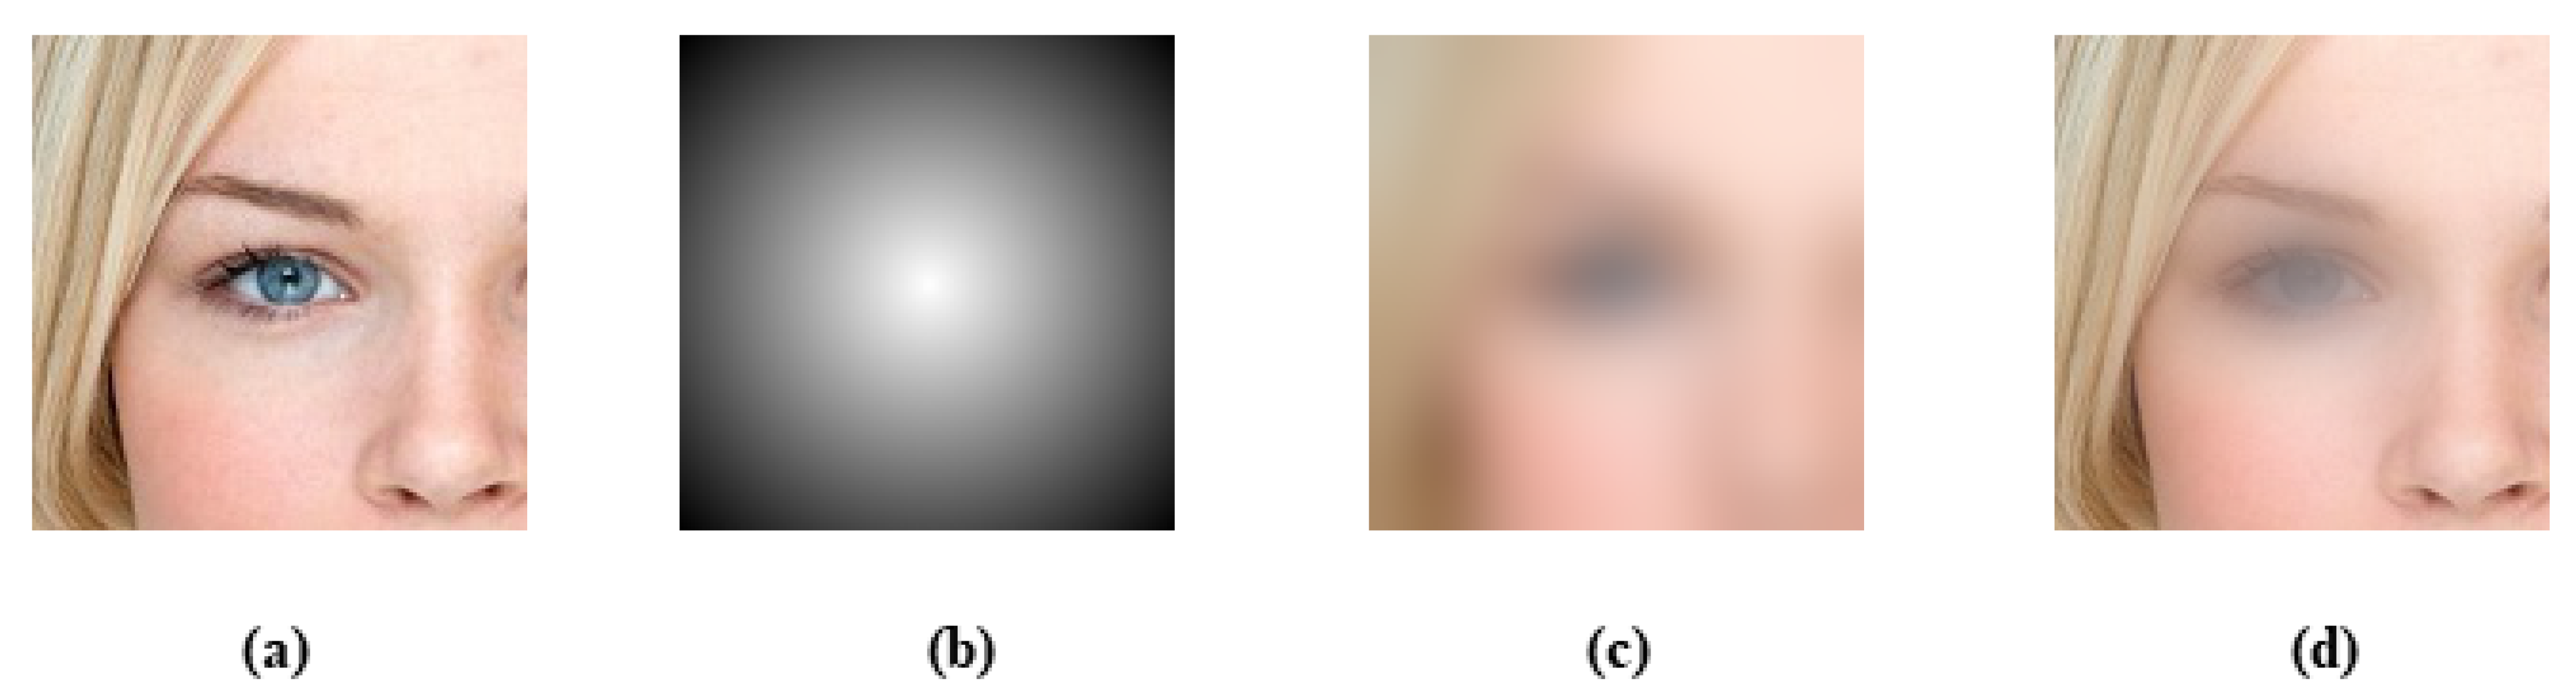
The straightforward approach to investigate the sensibility of the network towards the facial features is to iteratively mask the input test image with an occluder object (a gray rectangle) and plot the probability of the ground truth class as a function of the occluder object. Figure 5 shows the occluding process and the probabilities after occluding the images for images belonging to each one of the race classes as heat maps.
For the Asian class, the peri-ocular region has a big impact on the classification result: if the eye area is masked, the subject is considered a Caucasian subject. This is explainable, as the inner canthus region is essential in differentiating between Caucasians and Asians. For the African-American class the masking process does not cause the confusion with another class; this could be be a clue that in this case, the chromatic information is used as a cue in the classification problem. The same behaviour is observed for the Caucasian class. Finally, in the Indian case, the intra-ocular and the nose region seem to have a large impact on the classification problem.
In order to numerically express the sensibility of the network towards certain facial features, several transformations (occlusions, blurs, color enhancement) were applied on the test images in order to degrade the most prominent features of the face. The modified images are then fed to the CNN and the results are re-examined.
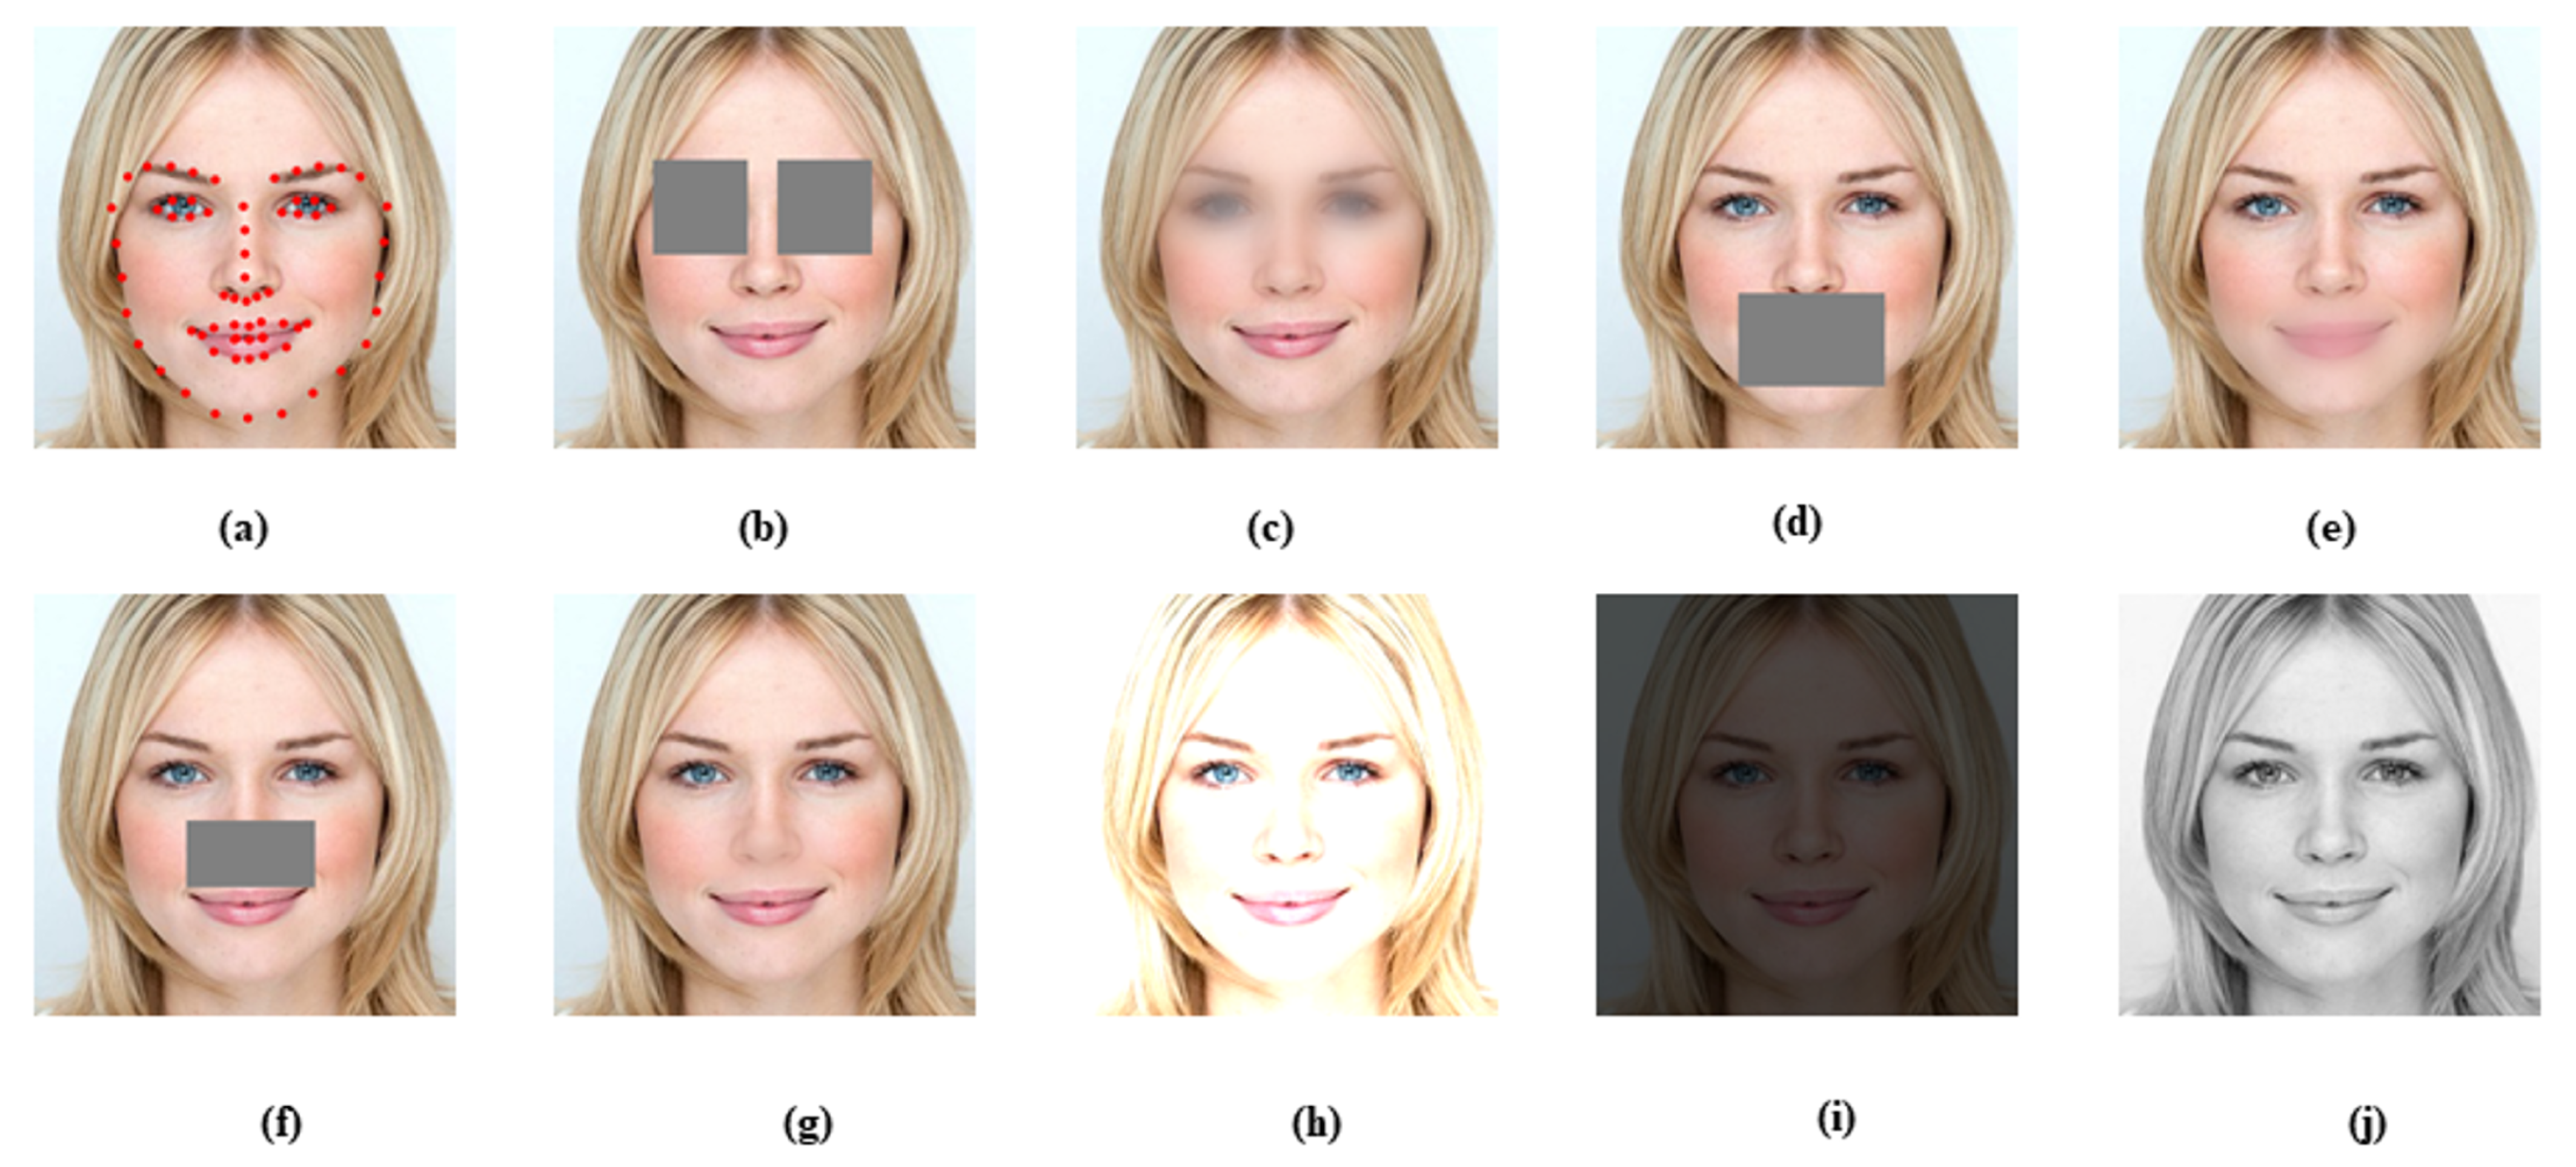
First, 68 facial landmarks were localized on the face using the dlib framework [55]. Based on the position of these features, different rectangular regions of interest (ROIs) on the face were established and masked/blurred.
The occlusion operation corresponds to a simple overlay of a grey rectangle (the red, green and blue color components are set to 128) over the ROI. The main disadvantage of this operation is that it also introduces strong edges around the area of interest. In order to overcome this issue, a radial blur operation is proposed: the region of interest is strongly blurred in its center and the blur factor decreases inversely with the distance from the center.
To implement the radial blur, the area of interest is blurred with a strong Gaussian filter and a gradient radial mask is generated based on the distance from the region’s center; the original and the blurred ROIs are blended according to the mask pixels in order to obtain the radial blur (Figure 6).
The following alterations were performed (as illustrated in Figure 7):
- Blur/occlusion of the eye region: the eyes were masked/blurred in order to determine their importance in the race classification problem.
- Blur/occlusion of the nose region: the nostril region was masked/blurred in order to determine its importance in the race classification problem.
- Blur/occlusion of the mouth region: the mouth region was masked/blurred in order to determine its importance in the race classification problem.
- Grayscale conversion: this transformation is performed in order to determine the importance of the chromatic information.
- Increase/decrease the image brightness: these transformations are performed in order to determine the robustness of the classifier towards overexposed and underexposed images.
- Blur the entire image with a Gaussian filter of size 17 × 17: this transformation corresponds to low resolution image (similar to the ones captured from bad quality surveillance cameras).
The results of this test experiment are reported in Table 3.
The periocular region seems to have the highest impact on the classification performance: the overall accuracy decreases with 5.99% when the eyes are blurred and with 15.62% when the eyes are totally occluded. The mouth and the nose area seem to have a lower importance. The accuracy on the Asian and Caucasian classes is mostly impaired when altering the eye area, because the canthus is essential for differentiation Caucasians from other races.
These observations are consistent with the way humans perceive the faces— studies [56,57] revealed the importance of the periocular region followed by the mouth and then the nose in human face perception and recognition. Other studies suggest that the eyebrows could be even more important than the eyes [58], due to their role in non-verbal communication and because they are large, high-frequency facial features.
As stated in [58], the geometrical relationship between the facial parts is at least as important as the appearance of each facial feature, and although in some cases, features alone are sufficient for face recognition, “the geometric relationship between each feature and the rest of the face can override the diagnosticity of that feature”. This could be an explanation of why the detection performance does not drastically decreases when independently masking facial parts.
Chromacity is known to play an important role in the human visual system-but studies reveal that when it comes to face identification color is not the primary trait [59]. Even more, people are better at encoding facial information of their own race than from other races. Our classifiers based on CNNs seem to do the same and chromacity does not seem to have a big impact: when the images are converted to grayscale, the overall performance decreases only with 1.9%.
In today’s context of globalization, the racial mixing between human accelerates and a discrete identification of the race becomes much more difficult than other demographic traits that can be extracted from the face (age, gender, eye color etc.). Biracial/multiracial refers to individuals belonging or related to two/many races.
Although the networks were not trained on multi-racial subjects, we also evaluated the performance of the proposed solution on multi-racial subjects in order to determine if the races to which the subject is related to should have a higher prediction score.
For this task we downloaded from the internet images from of subjects with multi-racial descent [60].
The average probability of the correct class is 98.07% with a standard deviation of 6.36%. Little research has been made on this field and a sufficiently large scale database for the problem of multi-racial classification does not yet exist.
Comparison to the State of the Art
Recently, several other works tackled the problem of race [11,12] and ethnicity [12,13] classification using convolutional neural networks. The obtained results compared to the state of the art are summarized in Table 4. However, a direct numerical comparison with all previous works is not possible because some methods were trained and evaluated on private databases that do not seem to be available anymore. Moreover, because the race and ethnicity classification problem is fluid and not rigorously defined, different taxonomies are often used.
In [11] the authors propose a deep learning framework for extracting soft-biometric information—gender and ethnicity in Near Infrared (NIR) long-range, night-time face images and visible images (VIS). However, their method requires face normalization—the eye centers must be located manually and their positions are used to generate the canonical images by applying an affine transformation. In addition, the racial taxonomy contains only the Asian and Caucasian classes. The method was tested on images captured by the authors and on the LDHF [48,49] dataset.
To compare with [11], we also tested the proposed method on the LDHF dataset, both on the visible and near infra-red images, even if the proposed method was trained only with VIS images. As the database contains only Asian subjects, we consider two output classes Asian and Non-Asian (i.e., Afro-American, Caucasian and Indian). In other words, we transform the output of the trained network into a binary classification problem with the classes Asian vs. Non-Asian: that is, if the network prediction belongs to the labels Afro-American, Caucasian or Indian, then it is considered that the network predicted the class Non-Asian; otherwise, the if the network predicted the Asian class, the label is left unchanged.
In Table 5 we report the classification accuracy of the proposed solution on all the subsets of the LDHF database (Asian vs. Non-Asian classes).
For the near-infrared spectrum, even if the network was not trained on near-infrared images, the method obtains good accuracy for near images. For images captured outdoor, in near-infrared at large distances, the performance decreases drastically. However, the proposed method is not intended for the near-infrared case and, we argue that on these images, ethnicity recognition is very challenging even for a human (Figure 8).
In [12], the authors trained a 5 layer convolutional neural network (3 convolutional layers and 2 fully connected layers) for several race and ethnicity scenarios: Black vs. White, Chinese vs. Non-Chinese and Han, Uygurs and Non-Chinese. The method requires face alignment and normalization. For the Chinese vs. Non-Chinese case, the authors tested the database on 542 images randomly selected from the CAS-PEAL database and obtained an accuracy of 99.81%. We tested the trained Inception Resnet-v2 network on all the frontal pose subsets of the CAS-PEAL (8658 images). In the normal image capturing conditions, the network achieved an accuracy of 99.61%, a value comparable to the one of [12]. The worst results are achieved on the Lighting subset, in which the subjects are illuminated by fluorescent light source located at different azimuth and elevation coordinates. In extreme cases, the subject’s face is in [total] darkness and it is quite challenging to distinguish his/hers facial features.
In [61], the authors finely tuned several convolutional neural networks for classifying Chinese, Japanese and Korean subjects. They gathered a dataset of 39883 images annotated with these three ethnicity labels; the best accuracy (75.03%) is obtained by the Resnet network [34]. For the problem of ethnicity classification between Asian subjects we obtained an accuarcy of 77.87%. A similar approach is proposed in [13]: the authors finely tuned the VGG network for ethnicity classification in Indian subjects into South-Indian and North Indian. They obtained 62% accuracy. We cannot compare to this method, as there is no intersection between the proposed taxonomies.
As opposed to the other methods from the literature, we proposed a network that is trained to recognize between four race classes at once (Afro-American, Asian, Caucasian and Indian); moreover, the method is able to work with “in the wild” images and it does not require any face normalization.
6. Conclusions
The human face is one of the most important visual stimulus for humans, as it encodes information about one’s emotional state and demographics (race, ethnicity, age, gender etc.). In this paper, we built an annotated dataset of facial images and proposed a deep learning approach for automatic human race and ethnicity detection from facial images; 4 state of the art convolutional neural networks were fully trained to differentiate between the following racial classes: African-American, Asian, Caucasian and Indian.
To train the networks, we gathered over 175,000 facial images from the Internet and used four independent human subjects to label the images with race information. The training database is made publicly available. To the best of our knowledge this is the largest publicly available, free and balanced face database annotated with race information.
The networks were evaluated on images from our database using the leave-one-subject-out cross-validation in order to determine if they generalize well on new images and on images from publicly available datasets, which were not used in the training process. The average prediction time is 70 milliseconds.
The best results are obtained by the Inception Resnet-v2 network (96.36% accuracy). In order to compare with the state of the art, we also assessed the accuracy of our classifiers on near infra-red images, even if they were not trained in such use cases. The networks attained surprisingly good results in indoor conditions (100% accuracy for distinguishing between Asian and non-Asian subjects). Lower accuracies were obtained for outdoor, near infra-red images, but we argue that this is a difficult task even for a human. Moreover, this was not the scope of the current method.
We employed various visualization techniques (plot the probability distribution function as a function of an occluding object) in order to determine the facial features to which the network is sensible to. In addition, we altered the test images, such as the most prominent parts of the face are occluded or blurred. The numerical results revealed the importance of the periocular region followed by the mouth; this pattern is consistent to the way humans process and recognize faces. Another experiment involved the gray-scale conversion of the test images and chromatic alterations (brightness increasing and decreasing). It was determined that the chromatic information is not crucial to the classification performance. This idea is also sustained by the fact that the network performed well on near infra-red images. Psychological studies also show that for humans, the color information is important only when facing degraded images.
In conclusion, we proposed a human race classification system from facial images which is illumination invariant. The experimental results show that the proposed method is at least comparable or better than the state of the art. The visualization experiments we performed show that the way the network “perceive” the human face is similar to the way humans perceive faces. Using fine tuning, the network can be used to distinguish between ethnic groups.
The race topic seems to be the target of ethical criticism as race is perceived as a social and political discrimination factor. Recent psychological and anthropological studies state that there is not scientific basis for any claim supporting hierarchical human categories or race and ethnicity based on patterns of human genetic variations-and we are on the same sentiment. However, being able to scientifically discern and infer the source race of an individual or groups of individual could help for better cultural and social understanding of human relations. In the very end any scientific discovery has a potential to be used for the good or for the bad. That choice belongs to the humanity.
As future work, we plan to gather more training data such that the system can classify between seven human races. In addition, we plan to address the problem of multi-racial subjects (“African/African American, Caucasian, East Asian, Native American/American Indian, Pacific Islander, Asian Indian and Hispanic/Latino).
Author Contributions
Conceptualization, R.D. and D.B.; methodology, D.B. and R.D.; software, D.B., R.D., A.S.D.; validation, D.B., R.D., A.S.D.; investigation, A.S.D. and R.D.; resources, A.S.D. and D.B.; data curation, A.S.D.; writing—original draft preparation, D.B., R.D., A.S.D.; writing—review and editing, D.B., R.D., A.S.D.; supervision, R.D.; funding acquisition, D.B. and A.S.D. All authors have read and agreed to the published version of the manuscript.
Funding
This research was funded by Babes Bolyai University, authors SEED grants and through the SmartFace (2017–2020) funding project coordinated by TVARITA SRL.
Institutional Review Board Statement
Not applicable.
Informed Consent Statement
Not applicable.
Data Availability Statement
The data presented in this study (FaceARG) are available at: https://www.cs.ubbcluj.ro/~dadi/FaceARG-database.html.
Conflicts of Interest
The authors declare no conflict of interest.
References
- Wade, P.; Takezawa, Y.I.; Smedley, A. Human Race. In Encyclopaedia Britannica. Available online: https://www.britannica.com/topic/race-human (accessed on 28 July 2020).
- Darwin, C. The Descent of Man and Selection in Relation to Sex; D. Appleton: New York, NY, USA, 1888; Volume 1. [Google Scholar]
- Fu, S.; He, H.; Hou, Z.G. Learning race from face: A survey. IEEE Trans. Pattern Anal. Mach. Intell. 2014, 36, 2483–2509. [Google Scholar] [CrossRef] [PubMed] [Green Version]
- Brown, T.I.; Uncapher, M.R.; Chow, T.E.; Eberhardt, J.L.; Wagner, A.D. Cognitive control, attention, and the other race effect in memory. PLoS ONE 2017, 12, e0173579. [Google Scholar] [CrossRef] [PubMed]
- Kelly, D.J.; Quinn, P.C.; Slater, A.M.; Lee, K.; Ge, L.; Pascalis, O. The other-race effect develops during infancy: Evidence of perceptual narrowing. Psychol. Sci. 2007, 18, 1084–1089. [Google Scholar] [CrossRef] [PubMed] [Green Version]
- Valentine, T. A unified account of the effects of distinctiveness, inversion, and race in face recognition. Q. J. Exp. Psychol. 1991, 43, 161–204. [Google Scholar] [CrossRef]
- Phillips, P.J.; Jiang, F.; Narvekar, A.; Ayyad, J.; O’Toole, A.J. An other-race effect for face recognition algorithms. ACM Trans. Appl. Percept. (TAP) 2011, 8, 14. [Google Scholar] [CrossRef]
- Roomi, S.M.M.; Virasundarii, S.; Selvamegala, S.; Jeevanandham, S.; Hariharasudhan, D. Race classification based on facial features. In Proceedings of the IEEE 2011 Third National Conference on Computer Vision, Pattern Recognition, Image Processing and Graphics (NCVPRIPG), Hubli, India, 15–17 December 2011; pp. 54–57. [Google Scholar]
- Tin, H.H.K.; Sein, M.M. Automatic Race Identification from Face Images in Myanmar. In Proceedings of the The First International Conference on Energy Environment and Human Engineering (ICEEHE 2013), Yangon, Myanmar, 21–23 December 2013. [Google Scholar]
- Klare, B.; Jain, A.K. On a taxonomy of facial features. In Proceedings of the 2010 Fourth IEEE International Conference on Biometrics: Theory, Applications and Systems (BTAS), Washington, DC, USA, 27–29 September 2010; pp. 1–8. [Google Scholar]
- Narang, N.; Bourlai, T. Gender and ethnicity classification using deep learning in heterogeneous face recognition. In Proceedings of the 2016 International Conference on Biometrics (ICB), Halmstad, Sweden, 13–16 June 2016; pp. 1–8. [Google Scholar]
- Wang, W.; He, F.; Zhao, Q. Facial Ethnicity Classification with Deep Convolutional Neural Networks. In Proceedings of the Chinese Conference on Biometric Recognition, Chengdu, China, 14–16 October 2016; pp. 176–185. [Google Scholar]
- Katti, H.; Arun, S. Can you tell where in India I am from? Comparing humans and computers on fine-grained race face classification. arXiv 2017, arXiv:1703.07595. [Google Scholar]
- Ryu, H.J.; Adam, H.; Mitchell, M. Inclusivefacenet: Improving face attribute detection with race and gender diversity. arXiv 2017, arXiv:1712.00193. [Google Scholar]
- Wang, M.; Deng, W.; Hu, J.; Tao, X.; Huang, Y. Racial faces in the wild: Reducing racial bias by information maximization adaptation network. In Proceedings of the IEEE International Conference on Computer Vision, (ICCV 2019), Seoul, Korea, 27 October–2 November 2019; pp. 692–702. [Google Scholar]
- Guo, Y.; Zhang, L.; Hu, Y.; He, X.; Gao, J. Ms-celeb-1m: A dataset and benchmark for large-scale face recognition. In Proceedings of the European Conference on Computer Vision, Amsterdam, The Netherlands, 8–16 October 2016; pp. 87–102. [Google Scholar]
- Face++. Available online: https://www.faceplusplus.com/ (accessed on 13 October 2020).
- Yucer, S.; Akçay, S.; Al-Moubayed, N.; Breckon, T.P. Exploring Racial Bias within Face Recognition via per-subject Adversarially-Enabled Data Augmentation. In Proceedings of the IEEE/CVF Conference on Computer Vision and Pattern Recognition Workshops, Seattle, WA, USA, 14–19 June 2020; pp. 18–19. [Google Scholar]
- Torralba, A.; Efros, A.A. Unbiased look at dataset bias. In Proceedings of the 2011 IEEE Conference on Computer Vision and Pattern Recognition (CVPR), Colorado Springs, CO, USA, 20–25 June 2011; pp. 1521–1528. [Google Scholar]
- Taigman, Y.; Yang, M.; Ranzato, M.; Wolf, L. Deepface: Closing the gap to human-level performance in face verification. In Proceedings of the IEEE Conference on Computer Vision and Pattern Recognition, Columbus, OH, USA, 23–28 June 2014; pp. 1701–1708. [Google Scholar]
- Viola, P.; Jones, M.J. Robust real-time face detection. Int. J. Comput. Vis. 2004, 57, 137–154. [Google Scholar] [CrossRef]
- Simonyan, K.; Zisserman, A. Very deep convolutional networks for large-scale image recognition. arXiv 2014, arXiv:1409.1556. [Google Scholar]
- Szegedy, C.; Ioffe, S.; Vanhoucke, V.; Alemi, A.A. Inception-v4, Inception-ResNet and the Impact of Residual Connections on Learning. In Proceedings of the Thirty-First AAAI Conference on Artificial Intelligence, San Francisco, CA, USA, 4–9 February 2017; pp. 4278–4284. [Google Scholar]
- Hu, J.; Shen, L.; Sun, G. Squeeze-and-excitation networks. In Proceedings of the IEEE Conference on Computer Vision and Pattern Recognition, Salt Lake City, UT, USA, 18–23 June 2018; pp. 7132–7141. [Google Scholar]
- Howard, A.; Sandler, M.; Chu, G.; Chen, L.C.; Chen, B.; Tan, M.; Wang, W.; Zhu, Y.; Pang, R.; Vasudevan, V.; et al. Searching for mobilenetv3. In Proceedings of the IEEE International Conference on Computer Vision, Seoul, Korea, 27 October–2 November 2019; pp. 1314–1324. [Google Scholar]
- Russakovsky, O.; Deng, J.; Su, H.; Krause, J.; Satheesh, S.; Ma, S.; Huang, Z.; Karpathy, A.; Khosla, A.; Bernstein, M.; et al. ImageNet Large Scale Visual Recognition Challenge. Int. J. Comput. Vis. 2015, 115, 211–252. [Google Scholar] [CrossRef] [Green Version]
- Bai, Z.; Li, Y.; Woźniak, M.; Zhou, M.; Li, D. DecomVQANet: Decomposing visual question answering deep network via tensor decomposition and regression. Pattern Recognit. 2020, 110, 107538. [Google Scholar] [CrossRef]
- Wozniak, M.; Wieczorek, M.; Silka, J.; Polap, D. Body pose prediction based on motion sensor data and Recurrent Neural Network. IEEE Trans. Ind. Inform. 2020, 17, 2101–2111. [Google Scholar] [CrossRef]
- Krizhevsky, A.; Sutskever, I.; Hinton, G.E. Imagenet classification with deep convolutional neural networks. In Proceedings of the Advances in Neural Information Processing Systems, Lake Tahoe, NV, USA, 3–6 December 2012; pp. 1097–1105. [Google Scholar]
- Lin, M.; Chen, Q.; Yan, S. Network in network. arXiv 2013, arXiv:1312.4400. [Google Scholar]
- Qiu, J.; Wang, J.; Yao, S.; Guo, K.; Li, B.; Zhou, E.; Yu, J.; Tang, T.; Xu, N.; Song, S.; et al. Going deeper with embedded fpga platform for convolutional neural network. In Proceedings of the 2016 ACM/SIGDA International Symposium on Field-Programmable Gate Arrays, Monterey, CA, USA, 21–23 February 2016; ACM: New York, NY, USA, 2016; pp. 26–35. [Google Scholar]
- Ioffe, S.; Szegedy, C. Batch normalization: Accelerating deep network training by reducing internal covariate shift. arXiv 2015, arXiv:1502.03167, 448–456. [Google Scholar]
- Szegedy, C.; Vanhoucke, V.; Ioffe, S.; Shlens, J.; Wojna, Z. Rethinking the inception architecture for computer vision. In Proceedings of the IEEE Conference on Computer Vision and Pattern Recognition, Las Vegas, NV, USA, 27–30 June 2016; pp. 2818–2826. [Google Scholar]
- He, K.; Zhang, X.; Ren, S.; Sun, J. Deep residual learning for image recognition. In Proceedings of the IEEE Conference on Computer Vision and Pattern Recognition, Las Vegas, NV, USA, 27–30 June 2016; pp. 770–778. [Google Scholar]
- Sandler, M.; Howard, A.; Zhu, M.; Zhmoginov, A.; Chen, L.C. Mobilenetv2: Inverted residuals and linear bottlenecks. In Proceedings of the IEEE Conference on Computer Vision and Pattern recognition, Salt Lake City, UT, USA, 18–23 June 2018; pp. 4510–4520. [Google Scholar]
- Zoph, B.; Vasudevan, V.; Shlens, J.; Le, Q.V. Learning transferable architectures for scalable image recognition. In Proceedings of the IEEE Conference on Computer Vision and Pattern Recognition, Salt Lake City, UT, USA, 18–23 June 2018; pp. 8697–8710. [Google Scholar]
- Liu, C.; Zoph, B.; Neumann, M.; Shlens, J.; Hua, W.; Li, L.J.; Fei-Fei, L.; Yuille, A.; Huang, J.; Murphy, K. Progressive neural architecture search. In Proceedings of the European Conference on Computer Vision (ECCV), Munich, Germany, 8–14 September 2018; pp. 19–34. [Google Scholar]
- Yang, T.J.; Howard, A.; Chen, B.; Zhang, X.; Go, A.; Sandler, M.; Sze, V.; Adam, H. Netadapt: Platform-aware neural network adaptation for mobile applications. In Proceedings of the European Conference on Computer Vision (ECCV), Munich, Germany, 8–14 September 2018; pp. 285–300. [Google Scholar]
- Ma, D.S.; Correll, J.; Wittenbrink, B. The Chicago face database: A free stimulus set of faces and norming data. Behav. Res. Methods 2015, 47, 1122–1135. [Google Scholar] [CrossRef] [Green Version]
- Minear, M.; Park, D.C. A lifespan database of adult facial stimuli. Behav. Res. Methods Instrum. Comput. 2004, 36, 630–633. [Google Scholar] [CrossRef] [Green Version]
- Lyons, M.J.; Akamatsu, S.; Kamachi, M.; Gyoba, J.; Budynek, J. The Japanese female facial expression (JAFFE) database. In Proceedings of the Third International Conference on Automatic Face and Gesture Recognition, Nara, Japan, 14–16 April 1998; pp. 14–16. [Google Scholar]
- Strohminger, N.; Gray, K.; Chituc, V.; Heffner, J.; Schein, C.; Heagins, T.B. The MR2: A multi-racial, mega-resolution database of facial stimuli. Behav. Res. Methods 2016, 48, 1197–1204. [Google Scholar] [CrossRef] [Green Version]
- Setty, S.; Husain, M.; Beham, P.; Gudavalli, J.; Kandasamy, M.; Vaddi, R.; Hemadri, V.; Karure, J.; Raju, R.; Rajan, B.; et al. Indian movie face database: A benchmark for face recognition under wide variations. In Proceedings of the 2013 Fourth National Conference on Computer Vision, Pattern Recognition, Image Processing and Graphics (NCVPRIPG), Jodhpur, India, 18–21 December 2013; pp. 1–5. [Google Scholar]
- Hwang, B.W.; Roh, M.C.; Lee, S.W. Performance evaluation of face recognition algorithms on asian face database. In Proceedings of the Sixth IEEE International Conference on Automatic Face and Gesture Recognition, Seoul, Korea, 19 May 2004; pp. 278–283. [Google Scholar]
- Ricanek, K.; Tesafaye, T. Morph: A longitudinal image database of normal adult age-progression. In Proceedings of the 7th International Conference on Automatic Face and Gesture Recognition (FGR06), Southampton, UK, 10–12 April 2006; pp. 341–345. [Google Scholar]
- Abadi, M.; Agarwal, A.; Barham, P.; Brevdo, E.; Chen, Z.; Citro, C.; Corrado, G.S.; Davis, A.; Dean, J.; Devin, M.; et al. Tensorflow: Large-scale machine learning on heterogeneous distributed systems. arXiv 2016, arXiv:1603.04467. [Google Scholar]
- Hinton, G.; Srivastava, N.; Swersky, K. Neural Networks for Machine Learning: Overview of Mini-Batch Gradient Descent. 2016. Available online: http://www.cs.toronto.edu/~tijmen/csc321/slides/lecture_slides_lec6.pdf (accessed on 20 October 2020).
- Kang, D.; Han, H.; Jain, A.K.; Lee, S.W. Nighttime face recognition at large standoff: Cross-distance and cross-spectral matching. Pattern Recognit. 2014, 47, 3750–3766. [Google Scholar] [CrossRef]
- Maeng, H.; Liao, S.; Kang, D.; Lee, S.W.; Jain, A.K. Nighttime face recognition at long distance: Cross-distance and cross-spectral matching. In Proceedings of the Asian Conference on Computer Vision, Daejeon, Korea, 5–9 November 2012; Springer: Berlin/Heidelberg, Germany, 2012; pp. 708–721. [Google Scholar]
- Gao, W.; Cao, B.; Shan, S.; Chen, X.; Zhou, D.; Zhang, X.; Zhao, D. The CAS-PEAL large-scale Chinese face database and baseline evaluations. IEEE Trans. Syst. Man Cybern. Part A Syst. Hum. 2008, 38, 149–161. [Google Scholar]
- Linnaeus, C. Systema Naturae, 12th ed.; Laurentii Salvii: Stockholm, Sweden, 1767; Volume 2. [Google Scholar]
- von Luschan, F. Beiträge zur Völkerkunde der Deutschen Schutzgebiete; D. Reimer: Berlin, Germany, 1897. [Google Scholar]
- Farkas, L.G.; Katic, M.J.; Forrest, C.R. International anthropometric study of facial morphology in various ethnic groups/races. J. Craniofacial Surg. 2005, 16, 615–646. [Google Scholar] [CrossRef] [PubMed] [Green Version]
- Wen, Y.F.; Wong, H.M.; Lin, R.; Yin, G.; McGrath, C. Inter-ethnic/racial facial variations: A systematic review and Bayesian meta-analysis of photogrammetric studies. PLoS ONE 2015, 10, e0134525. [Google Scholar] [CrossRef] [Green Version]
- King, D.E. Dlib-ml: A machine learning toolkit. J. Mach. Learn. Res. 2009, 10, 1755–1758. [Google Scholar]
- Fraser, I.H.; Craig, G.L.; Parker, D.M. Reaction time measures of feature saliency in schematic faces. Perception 1990, 19, 661–673. [Google Scholar] [CrossRef] [PubMed]
- Sinha, P.; Balas, B.; Ostrovsky, Y.; Russell, R. Face recognition by humans: Nineteen results all computer vision researchers should know about. Proc. IEEE 2006, 94, 1948–1962. [Google Scholar] [CrossRef]
- Sadr, J.; Jarudi, I.; Sinha, P. The role of eyebrows in face recognition. Perception 2003, 32, 285–293. [Google Scholar] [CrossRef]
- Stephen, I.D.; Perrett, D.I. Color and face perception. In Handbook of Color Psychology; Elliot, A.J., Fairchild, M.D., Franklin, A., Eds.; Cambridge Handbooks in Psychology; Cambridge University Press: Cambridge, UK, 2015; pp. 585–602. [Google Scholar] [CrossRef]
- Funderburg, L. The Changing Face of America. In National Geographic, October 2010. Available online: https://www.nationalgeographic.com/magazine/2013/10/changing-face-america/ (accessed on 1 December 2020).
- Wang, Y.; Liao, H.; Feng, Y.; Xu, X.; Luo, J. Do they all look the same? Deciphering Chinese, Japanese and Koreans by fine-grained deep learning. arXiv 2016, arXiv:1610.01854. [Google Scholar]
Figure 1.
Image samples from the gathered dataset.

Figure 2.
Distribution of the annotated labels in the gathered dataset.

Figure 3.
Outline of the proposed solution. The face region is extracted using an off the shelf face detector and it is further enlarged. A convolutional neural network is used to extract the relevant features and determine the race.
Figure 3.
Outline of the proposed solution. The face region is extracted using an off the shelf face detector and it is further enlarged. A convolutional neural network is used to extract the relevant features and determine the race.

Figure 4.
Examples of correctly classified and misclassified samples.

Figure 5.
Masking procedure and heatmaps obtained after iteratively masking the images. (a). Masking procedure: the images is iteratively masked with a gray rectangle and the probability of the correct class is used to generate a heat-map (b). Heat-map for the Asian class. (c). Heat-map for the African-American class. (d). Heat-map for the Caucasian class. (e) Heat-map for the Indian class.

Figure 6.
Radial blur: the input region of interest (a) is combined with the blurred region of interest (c), based on the weights defined by the blur mask (b). The result is illustrated in subfigure (d).
Figure 6.
Radial blur: the input region of interest (a) is combined with the blurred region of interest (c), based on the weights defined by the blur mask (b). The result is illustrated in subfigure (d).

Figure 7.
Image alterations. (a) The 68 facial landmarks used in the localization of facial regions. (b) occlusion of the eyes. (c) radial blur or the eye area. (d) occlusion of the nostril area. (e) radial blur or the nostril area. (f) occlusion of the mouth area. (g) radial blur of the mouth area. (h) Gaussian blur of the entire image. (i) Increase brightness with a factor of 1.5. (j) Decrease brightness with a factor of 0.5.

Figure 8.
Some examples of Near Infrared (NIR) images from the LHDF dataset: (a) indoor, 1 m camera distance. (b). outdoor, 60 m camera distance, (c). outdoor, 100 m camera distance, (d). outdoor, 150 m camera distance.
Figure 8.
Some examples of Near Infrared (NIR) images from the LHDF dataset: (a) indoor, 1 m camera distance. (b). outdoor, 60 m camera distance, (c). outdoor, 100 m camera distance, (d). outdoor, 150 m camera distance.


Table 1.
Classification performance of the trained CNNs.
| VGG-19 Results | Inception-ResNet-v2 Results | |||||
| Pr | Re | F1 | Pr | Re | F1 | |
| Afro-American | 96.68 | 97.96 | 97.32 | 96.88 | 98.20 | 97.54 |
| Asian | 98.27 | 97.76 | 97.32 | 98.43 | 97.92 | 98.18 |
| Caucasian | 94.91 | 94.00 | 94.45 | 95.61 | 95.00 | 95.30 |
| Indian | 94.37 | 94.52 | 94.44 | 94.51 | 94.32 | 94.41 |
| Overall | 96.06 | 96.06 | 96.06 | 96.36 | 96.36 | 96.36 |
| Accuracy | 96.06 | 96.36 | ||||
| SeNet Results | Mobilenet V3 Results | |||||
| Pr | Re | F1 | Pr | Re | F1 | |
| Afro-American | 95.27 | 98.32 | 96.77 | 96.97 | 98.44 | 97.70 |
| Asian | 97.94 | 96.96 | 97.45 | 98.52 | 98.20 | 98.36 |
| Caucasian | 95.43 | 94.28 | 94.85 | 96.20 | 94.12 | 95.15 |
| Indian | 94.95 | 94.00 | 94.47 | 94.89 | 95.80 | 9.534 |
| Overall | 95.90 | 95.89 | 95.89 | 96.64 | 96.64 | 96.64 |
| Accuracy | 95.89 | 96.64 | ||||
Table 2.
Confusion matrices for racial classification.
| SENet | VGG-19 | |||||||
| Afro | Asian | Cauc. | Indian | Afro | Asian | Cauc. | Indian | |
| Afro | 2458 | 14 | 10 | 18 | 2449 | 10 | 15 | 26 |
| Asian | 35 | 2424 | 22 | 19 | 13 | 2444 | 29 | 14 |
| Cauc. | 31 | 24 | 2357 | 88 | 26 | 23 | 2350 | 101 |
| Indian | 56 | 13 | 81 | 2350 | 45 | 10 | 82 | 2363 |
| Resnet-v2 | Mobilenet V3 | |||||||
| Afro | Asian | Cauc. | Indian | Afro | Asian | Cauc. | Indian | |
| Afro | 2455 | 6 | 10 | 29 | 2461 | 5 | 15 | 19 |
| Asian | 15 | 2448 | 22 | 15 | 22 | 2455 | 15 | 8 |
| Cauc. | 15 | 14 | 2375 | 93 | 24 | 21 | 2353 | 102 |
| Indian | 49 | 16 | 77 | 2358 | 31 | 11 | 63 | 2395 |
Table 3.
Inception Resnet v2 performance on altered images.
| Experiment | African-American | Asian | Caucasian | Indian | Acc | ||||
|---|---|---|---|---|---|---|---|---|---|
| Pr | Re | Pr | Re | Pr | Re | Pr | Re | ||
| Eye blur | 96.92 | 93.04 | 96.51 | 86.16 | 82.66 | 94.20 | 87.42 | 88.08 | 90.37 |
| Eye occlusion | 93.99 | 83.84 | 75.81 | 80.72 | 93.46 | 70.92 | 68.11 | 87.48 | 80.74 |
| Nose blur | 97.89 | 96.68 | 98.03 | 97.44 | 95.15 | 93.32 | 91.60 | 95.04 | 95.62 |
| Nose occlusion | 89.79 | 96.00 | 98.37 | 91.64 | 90.79 | 91.48 | 90.08 | 89.32 | 92.11 |
| Mouth blur | 91.62 | 98.36 | 98.41 | 96.48 | 94.86 | 93.04 | 94.53 | 91.24 | 94.78 |
| Mouth occlusion | 82.06 | 97.00 | 98.21 | 94.48 | 92.82 | 88.88 | 94.43 | 84.84 | 91.30 |
| Grayscale | 94.83 | 97.68 | 97.48 | 97.52 | 90.40 | 96.40 | 96.59 | 87.24 | 94.71 |
| Brightness + + | 96.88 | 96.76 | 95.53 | 97.48 | 96.00 | 89.28 | 89.76 | 94.32 | 94.46 |
| Brightness– | 96.44 | 94.36 | 91.59 | 98.04 | 84.84 | 95.12 | 95.57 | 79.32 | 91.71 |
| Image blur | 94.72 | 96.96 | 94.11 | 97.20 | 93.35 | 89.88 | 91.35 | 89.60 | 93.41 |
| Original | 96.88 | 98.20 | 98.43 | 97.92 | 95.61 | 95.00 | 94.51 | 94.32 | 96.36 |
Table 4.
Comparison with state of the art.
| Method | CNN | Classes | Dataset | Accuracy |
|---|---|---|---|---|
| [11] | VGG | Asian, Caucasian | LDHF, VIS images, 1m | 78.98% |
| [12] | 5 layers CNN | Black, White | Morph II | 99.7% |
| [12] | 5 layers CNN | Chinese, Non-Chinese | CAS-PEAL | 99.81% |
| [13] | VGG | South Indian, North Indian | CNSIFD [13] | 62.00% |
| [61] | Resnet [34] | Chinese, Japanese, Korean | Twitter, Celeb-A | 75.03% |
| Ours | Resnet v2 | Asian vs Non-Asian | LDHF, VIS, 1m | 100% |
| Ours | Resnet v2 | Asian, Afro, Caucasian, Indian | internet images | 96.36% |
| Ours | Resnet v2 | Asian vs Non-Asian | CAS-PEAL, Accesory | 99.05% |
| Ours | Resnet v2 | Asian vs Non-Asian | CAS-PEAL, Aging | 100% |
| Ours | Resnet v2 | Asian vs Non-Asian | CAS-PEAL, Background | 98.76% |
| Ours | Resnet v2 | Asian vs Non-Asian | CAS-PEAL, Distance | 99.08% |
| Ours | Resnet v2 | Asian vs Non-Asian | CAS-PEAL, Expression | 99.52% |
| Ours | Resnet v2 | Asian vs Non-Asian | CAS-PEAL, Lightning | 95.55% |
| Ours | Resnet v2 | Asian vs Non-Asian | CAS-PEAL, Normal | 99.61% |
Table 5.
Comparison with state of the art.
| Image Type | Dataset Subset | Accuracy |
|---|---|---|
| visible spectrum | indoor, 1 m | 100% |
| visible spectrum | outdoor, 60 m | 100% |
| visible spectrum | outdoor, 100 m | 100% |
| visible spectrum | outdoor, 150 m | 97.97% |
| near infra-red spectrum | indoor, 1 m | 100% |
| near infra-red spectrum | outdoor, 60 m | 68% |
| near infra-red spectrum | outdoor, 100 m | 10.75% |
| near infra-red spectrum | outdoor, 150 m | 2.17% |
Publisher’s Note: MDPI stays neutral with regard to jurisdictional claims in published maps and institutional affiliations. |
© 2021 by the authors. Licensee MDPI, Basel, Switzerland. This article is an open access article distributed under the terms and conditions of the Creative Commons Attribution (CC BY) license (http://creativecommons.org/licenses/by/4.0/).
Share and Cite
MDPI and ACS Style
Darabant, A.S.; Borza, D.; Danescu, R. Recognizing Human Races through Machine Learning—A Multi-Network, Multi-Features Study. Mathematics 2021, 9, 195. https://0-doi-org.brum.beds.ac.uk/10.3390/math9020195
AMA Style
Darabant AS, Borza D, Danescu R. Recognizing Human Races through Machine Learning—A Multi-Network, Multi-Features Study. Mathematics. 2021; 9(2):195. https://0-doi-org.brum.beds.ac.uk/10.3390/math9020195
Chicago/Turabian StyleDarabant, Adrian Sergiu, Diana Borza, and Radu Danescu. 2021. "Recognizing Human Races through Machine Learning—A Multi-Network, Multi-Features Study" Mathematics 9, no. 2: 195. https://0-doi-org.brum.beds.ac.uk/10.3390/math9020195
Note that from the first issue of 2016, this journal uses article numbers instead of page numbers. See further details here.