
Automatic Image Characterization of Psoriasis Lesions
by
 , , ,
, , ,
Javier Martínez-Torres
1,* ,
,
Alicia Silva Piñeiro
1,
Álvaro Alesanco
2,
Ignacio Pérez-Rey
3,4 and 
José García
2 1
Department of Applied Mathematics I, Telecommunications Engineering School, University of Vigo, 36310 Vigo, Spain
2
Department of Electronics Engineering and Communications, Aragón Institute of Engineering Research (I3A), University of Zaragoza, 50018 Zaragoza, Spain
3
Área de Geotecnia Básica y Experimental, Laboratorio de Geotecnia, CEDEX, 28014 Madrid, Spain
4
Escuela Superior de Ingeniería y Tecnología (ESIT), Universidad Internacional de la Rioja, UNIR, 28040 Madrid, Spain
*
Author to whom correspondence should be addressed.
Mathematics 2021, 9(22), 2974; https://0-doi-org.brum.beds.ac.uk/10.3390/math9222974
Submission received: 14 October 2021
/
Revised: 17 November 2021
/
Accepted: 19 November 2021
/
Published: 22 November 2021
(This article belongs to the Special Issue Mathematical Approaches to Image Processing with Applications)
Abstract
:Psoriasis is a chronic skin disease that affects 125 million people worldwide and, particularly, 2% of the Spanish population, characterized by the appearance of skin lesions due to a growth of the epidermis that is seven times larger than usual. Its diagnosis and monitoring are based on the use of methodologies for measuring the severity and extent of these spots, and this includes a large subjective component. For this reason, this paper presents an automatic method for characterizing psoriasis images that is divided into four parts: image preparation or pre-processing, feature extraction, classification of the lesions, and the obtaining of parameters. The methodology proposed in this work covers different digital-image processing techniques, namely, marker-based image delimitation, hair removal, nipple detection, lesion contour detection, areal-measurement-based lesion classification, as well as lesion characterization by means of red and white intensity. The results obtained were also endorsed by a professional dermatologist. This methodology provides professionals with a common software tool for monitoring the different existing typologies, which proved satisfactory in the cases analyzed for a set of 20 images corresponding to different types of lesions.
1. Introduction and Objectives
1.1. Introduction
Psoriasis is a chronic autoimmune dermatological disease [1,2] that affects about 125 million people worldwide and shows up as red, scaly plaques on the skin. Currently, dermatologists primarily use visual methods to diagnose the severity of the disease, which hinders the process of stratification and definition of the extent of the lesion, leading to subjectivity in decision-making. Although the causes are unknown, 1/3 of cases are hereditary, as patients have relatives with a previous diagnosis [3]. Environmental factors, exposure to extreme temperatures, and stress can also be considered as triggers [4]. The disease is characterized by rapid growth of the surface layer of the skin (epidermis), resulting in the shedding of dead skin cells and lesions that cause redness, itching, and pain. There are seven types of psoriasis depending on the main characteristics of the lesions, but the existing diagnostic methodology is basically the same for all cases. This is based on the use of indices to measure the severity or extent of lesions, which are commonly as follows [5]:
-BSA (body surface area), in which the palm of the patient’s hand is taken as a unitary reference.
-PGA (physician’s global assessment), in which the doctor assigns a number within 0 and 6 to the severity of the injuries.
-PASI (psoriasis area and severity index), based on the division of the body into four areas and the application of a formula that considers the erythema, inflammation, and desquamation in each of them, in addition to the area. Finally, a weighted sum is made, resulting in a value between 0 and 72, obtaining a ‘mild’ classification if it is less than 10, ‘moderate’ if it is less than 15 and greater than 10, or ‘severe’ if it is more than 15.
In addition to the subjectivity of these methods, since they are all based on observations to make the diagnosis, there is the factor of not always having the same doctor, which increases the variability in patient monitoring [6,7].
Because of this and because of the need to offer solutions that allow patients to isolate themselves as far as possible from their chronic disease daily [8,9], an idea arose with the objective of developing a proposal that would allow diagnosis and control to be carried out at home. This idea, proposed in applications such as those presented in [10,11], serves as a guide for the development of this work, where these methods are integrated and adapted, focusing on eruptive and plaque psoriasis.
Computer vision techniques have been progressively included in medical analyses so far. Even though these techniques emerged around the 1960s, their use experienced an unprecedented growth with the improvement and capabilities of computers during the last decade. Nowadays, image-processing techniques are broadly employed in several areas of medical image analyses for automatic and semi-automatic (assisted) diagnosis. Some advantages of applying these techniques are the possibility of a sort of standardized medical analysis (thus, reducing the variations associated with the observer’s criterion), reduction of workload and, therefore, fatigue of medical professionals, and the possibility of acquiring precise information in a quantitative way, sometimes, with reduced budgets.
Machine learning (ML) and, more particularly, deep learning (DL), have played a key role on the development of the automatic characterization and classification of medical images. For example, Shrivastava et al. [12] proposed a study focusing a psoriasis risk assessment (pRAS) based on two kinds of classifiers (i.e., support vector machines and decision trees). Other ML-related works related to psoriasis studies are those proposed by [13,14,15]. Regarding DL-related studies, some recent works have been developed by other authors in the field of dermatology [16] and, specifically, related to the diagnosis of psoriasis [17].
This work presents a methodology for the automatic characterization of psoriasis patches that consists of four phases: image pre-processing, feature extraction, lesion classification, and parameter retrieval. Section 2 presents the mathematical foundations on which the proposed solution is based, and the algorithms developed following the technical implications of each of the three phases. Section 3 presents the main results obtained in the application of this methodology on a set of images. Finally, Section 4 summarizes the main conclusions and future lines of research.
1.2. Objectives
The main objective of this work is to develop a simple methodology for the automatic characterization of psoriasis patches involving four phases: image pre-processing, feature extraction, lesion classification, and parameter retrieval. Results obtained from this work will be benchmarked by the assessment of an expert dermatologist.
To achieve the main objective, the main work is presented within the two following sections: ‘Section 2’ presents the mathematical foundations on which the proposed solution is based, and the algorithms developed following the technical implications of each of the four phases; ‘Section 3’ presents the main results obtained in the application of this methodology on a set of images. Finally, the main conclusions and future lines of research are summarized in another section (‘Section 4’).
2. Materials and Methods
2.1. Mathematical Background
In what follows, a brief description of some techniques used in the field of image processing from the perspective of their mathematical foundations are shown. This method is based on the analysis of medical images corresponding to psoriatic lesions. Therefore, it was necessary to implement and adapt several mathematical operations, considering the matrix representation character obtained after reading each of them.
First, there is the thresholding technique, an image segmentation procedure based on the establishment of a limit (thresh) to obtain an image whose pixels are between two values and, thus, the isolation a region of interest. Its calculation is defined as a piecewise function as presented in Equation (1).
where f is the function, src is the source image, thresh corresponds to the threshold, and x and y are the coordinates of a given pixel.
Additionally, the smoothing filters, which are based on the application of a Gaussian function, are intended to eliminate the noise or imperfections present in an image. The function used for the calculation of each of the elements of the kernel is the one shown in Equation (2), where σ represents a threshold specified by the user, and the variables x and y are the coordinates of the corresponding pixel.
Another widely used method is the adaptive histogram equalization, which consists of a redistribution of the histogram or graph representing the frequencies of occurrence of the brightness levels present in the image to improve its contrast. If the probability of gray level i in an image x, between 0 and L (normally 256) is given by Equation (3).
then, its linearized cumulative distribution function (cdf) is defined by Equation (4):
A new image is to be obtained with a flat histogram, i.e., with a cumulative function with some constant K such that (Equation (5)):
The properties of the cdf allow to obtain an expression with K in the range [0, L]:
where Equation (6) presents the values of T in the range [0, 1] so that, to return them to their original range, it is necessary to apply the expression shown by Equation (7):
In addition, as far as matrix operations are concerned, morphological and bitwise operations are mainly used for denoising [18] or extraction of regions of interest, among others. There are also operations related to image quality enhancement or restoration. For example, the method called inpainting [19,20], is based on the use of the numerical fast marching method (FMM), which solves the eikonal equation, indicated by Equation (8):
in which the obtained solution T represents the distance map of the Ω pixels to the boundary δΩ.
Other methodologies implemented for image enhancement consists of the application of the Navier–Stokes equation, initially developed to describe the motion of incompressible Newtonian fluids making a modification for use in imaging, where w = ∇I is the smoothness of the image intensity and g is a function that allows for anisotropic diffusion of the image, as expressed in Equation (9):
Finally, edge-detection methods [21], namely, Canny’s algorithm, are based on the calculation of the first derivative of the gradient in the vertical and horizontal direction for the subsequent calculation of the global gradient, stated in Equation (10), where Gx and Gy are the gradients in the main directions and Gb is the gradient magnitude, and indicates the gradient direction, as presented in Equation (11).
2.2. Methodology
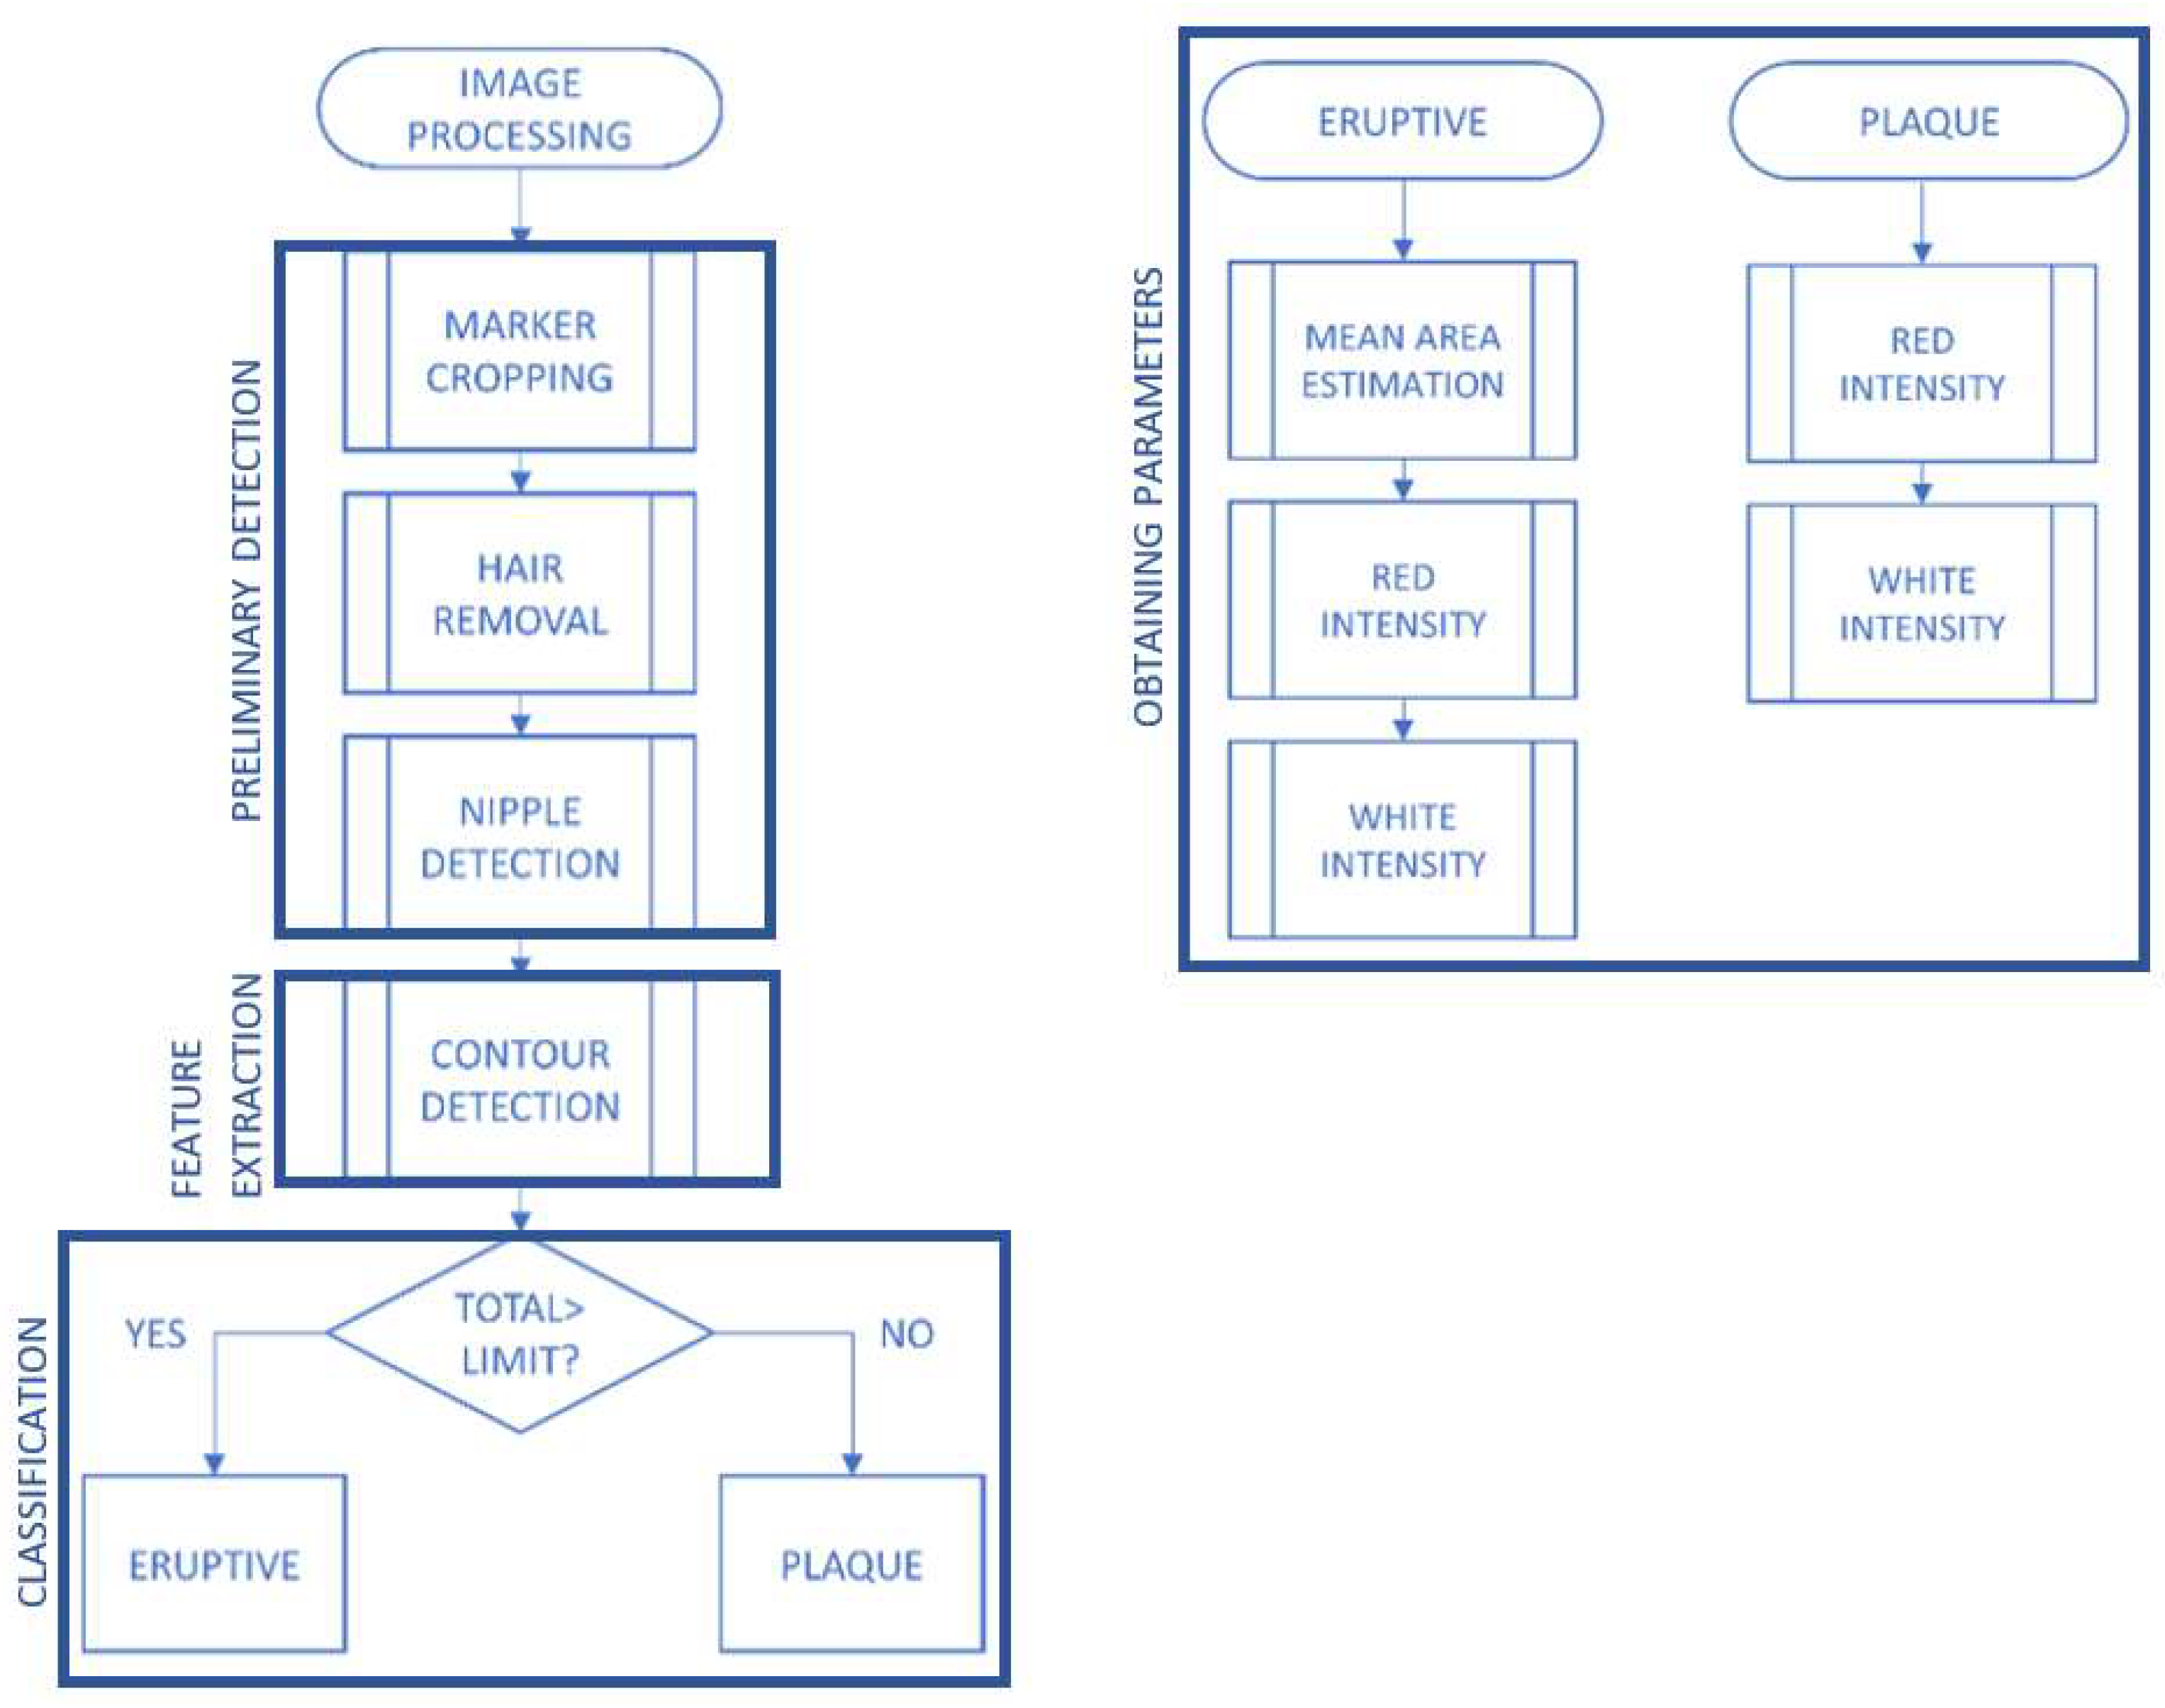
The specifically proposed methodology for the automatic characterization of psoriasis patches is presented below. This consists of four phases or stages: image pre-processing, feature extraction, classification of the lesions, and the obtaining of parameters. First, a pre-preparation of the images was proposed in order to eliminate all the factors that are challenging during post-processing. In this case, it was decided to include an automatic cropping of the image using markers, in addition to hair removal, following the methodology presented in [27], which is an improvement over other existing works [28,29]. Nipple detection was also included since the visual appearance of nipples is similar to that of some lesions and the presence of nipples can mislead the results when analyzing psoriasis images. The proposed methodology follows that described in [30,31]. Subsequently, in the second phase, a classification process was performed so as to determine the typology of the disease present in the image as psoriasis of the eruptive or plaque type by extracting some basic characteristics. The lesion classification procedure was based on the main characteristics of these types of lesions, which are color and texture as well as the extent of the individual patches [32,33]. Finally, in the fourth phase, the relevant parameters of the detected lesions were estimated, namely, values related to red and white intensity to be stored in a database, in order to be accessible to medical professionals for diagnosis and monitoring of the disease.
Figure 1 shows the operating flowchart of the proposed solution, describing the algorithms that take part in each one of the four previously described phases. The first three subroutines, corresponding to marker cropping, hair removal, and nipple detection, are included in the first stage of the system, which consisted of the preliminary preparation of the images. The second and third stages included the contour detection subroutine and the classification of the type of psoriasis present. Those three phases are presented in the left side of the general operation diagram. The fourth stage, which consisted of obtaining parameters, is presented in more detail in the right side of the flowchart in Figure 1, since it varies according to the type of psoriasis identified in the image.
In this work, the programming of the proposed routines and algorithms was developed in a Python version 3.8 environment and included libraries commonly used in this type of solutions, such as NumPy version 1.18.1 for matrix operations, PIL version 7.0.0 for basic image processing and OpenCV version 4.2.0 for advanced processing, since it is one of the most extensive libraries for machine vision applications.
2.2.1. Image Pre-Processing
For the correct detection of psoriasis spots, it is necessary to eliminate all factors that may hinder this task. Therefore, three techniques were used to prepare the spots.
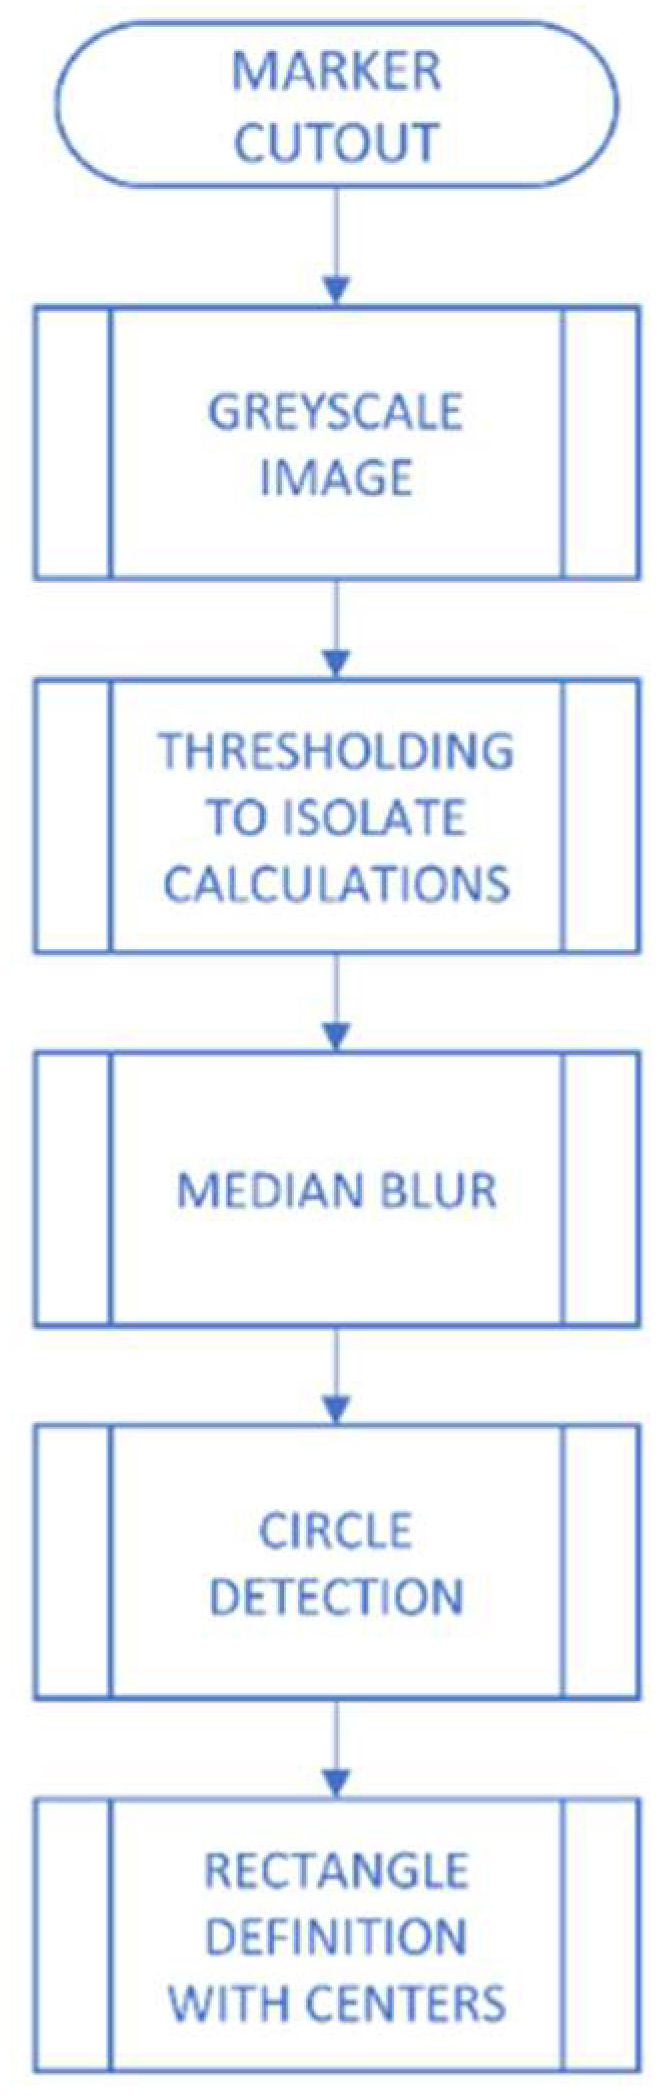
Firstly, a marker cutout was used (Figure 2), based on the use of white adhesives in a circular shape to delimit the area of interest for the study, eliminating areas of healthy skin. This is only done in some cases and the procedure is based on the use of thresholding to identify the adhesives and, subsequently, on the application of a smoothing filter to eliminate the existing noise in the image.
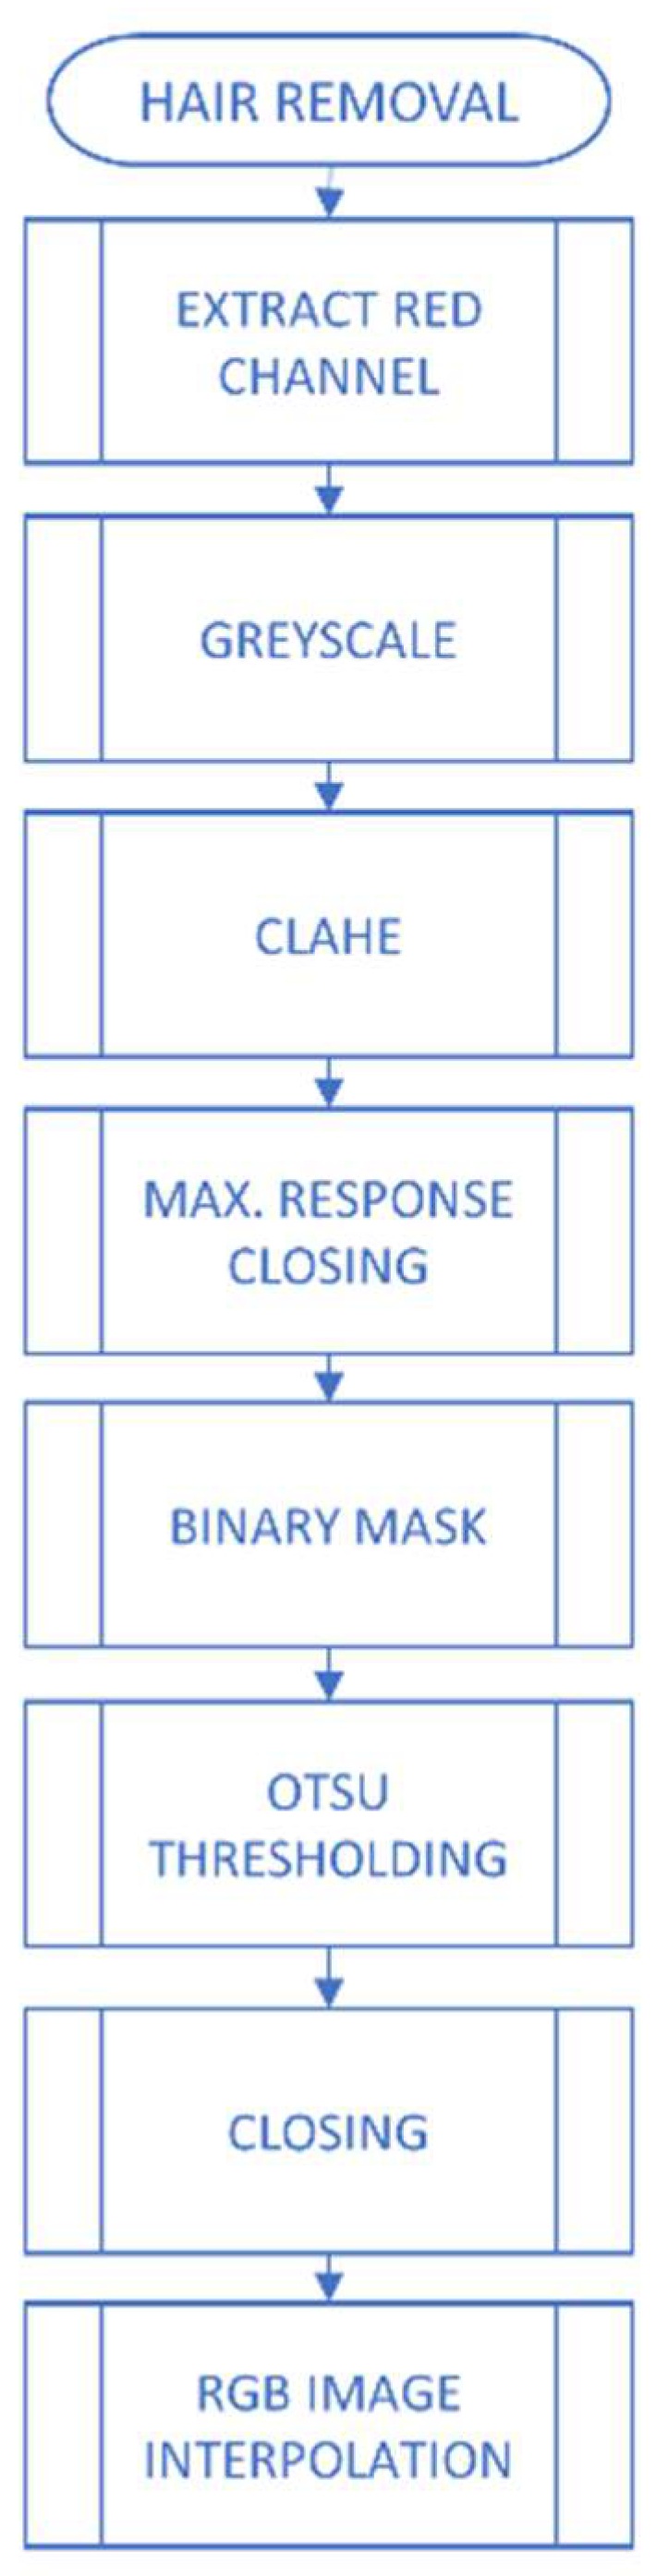
Afterward, hair removal (Figure 3) was carried out in those cases where it may be an element that hinders the detection of the spot contours. It was performed using the strategy presented in [27], allowing us to obtain a better result than that provided by previous methods such as DullRazor [28,29]. The strategy is based on the application of an adaptive equalization of the histogram to the red channel present in the image. This will result in a mask that characterizes the present hair and, by applying the inpainting on the original image, it is removed.
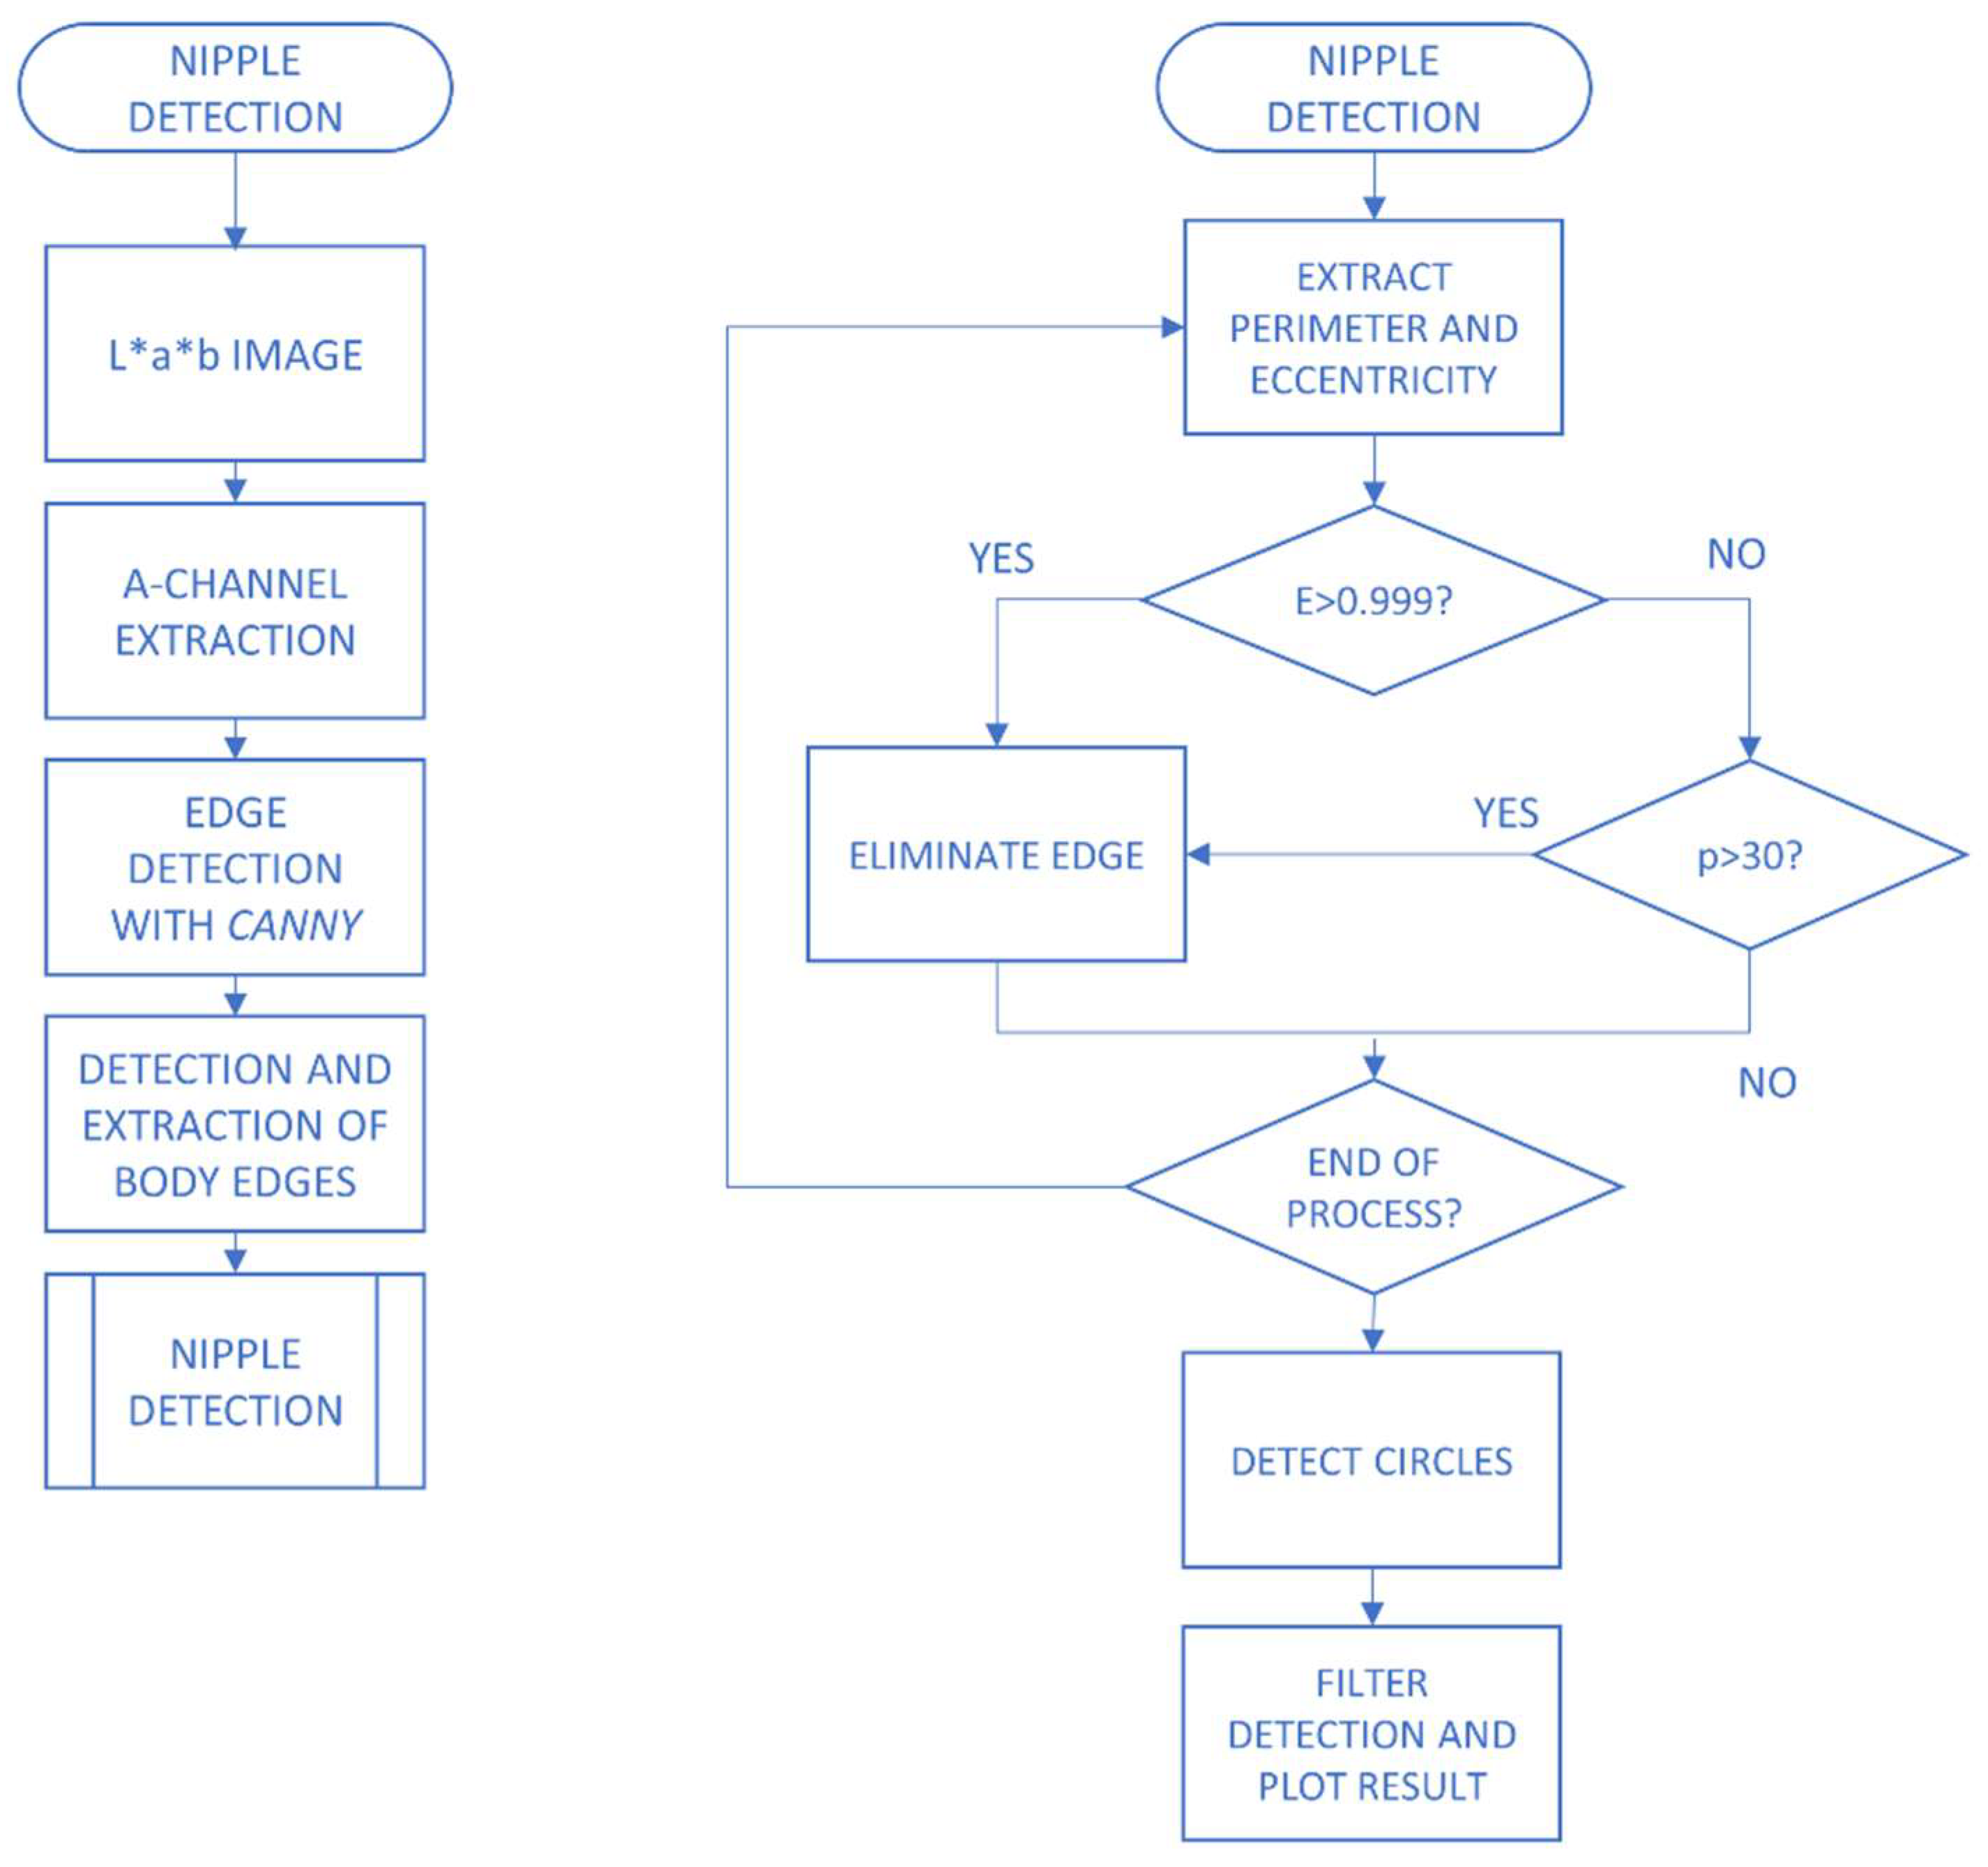
Finally, the detection and elimination of nipples (Figure 4) in images corresponding to the breast region was carried out, since they often lead to false detections due to the similarity observed between them and some lesions. The procedure is based on that proposed in [30,31], consisting of the application of Canny’s algorithm to detect the edges present and, by means of morphological operations, the nipples were isolated. In this case, and additionally, the values proposed by the authors in [30] for perimeter and eccentricity were modified due to the need for adjusting them to the size of the images used for the verification of the correct functioning of the algorithm. It was also assumed that the nipples would be approximately on the same horizontal plane, leaving for further developments the implementation of the algorithm in images that do not present two nipples or in cases in which these are asymmetrical.
2.2.2. Extraction of Characteristics and Classification of Lesions
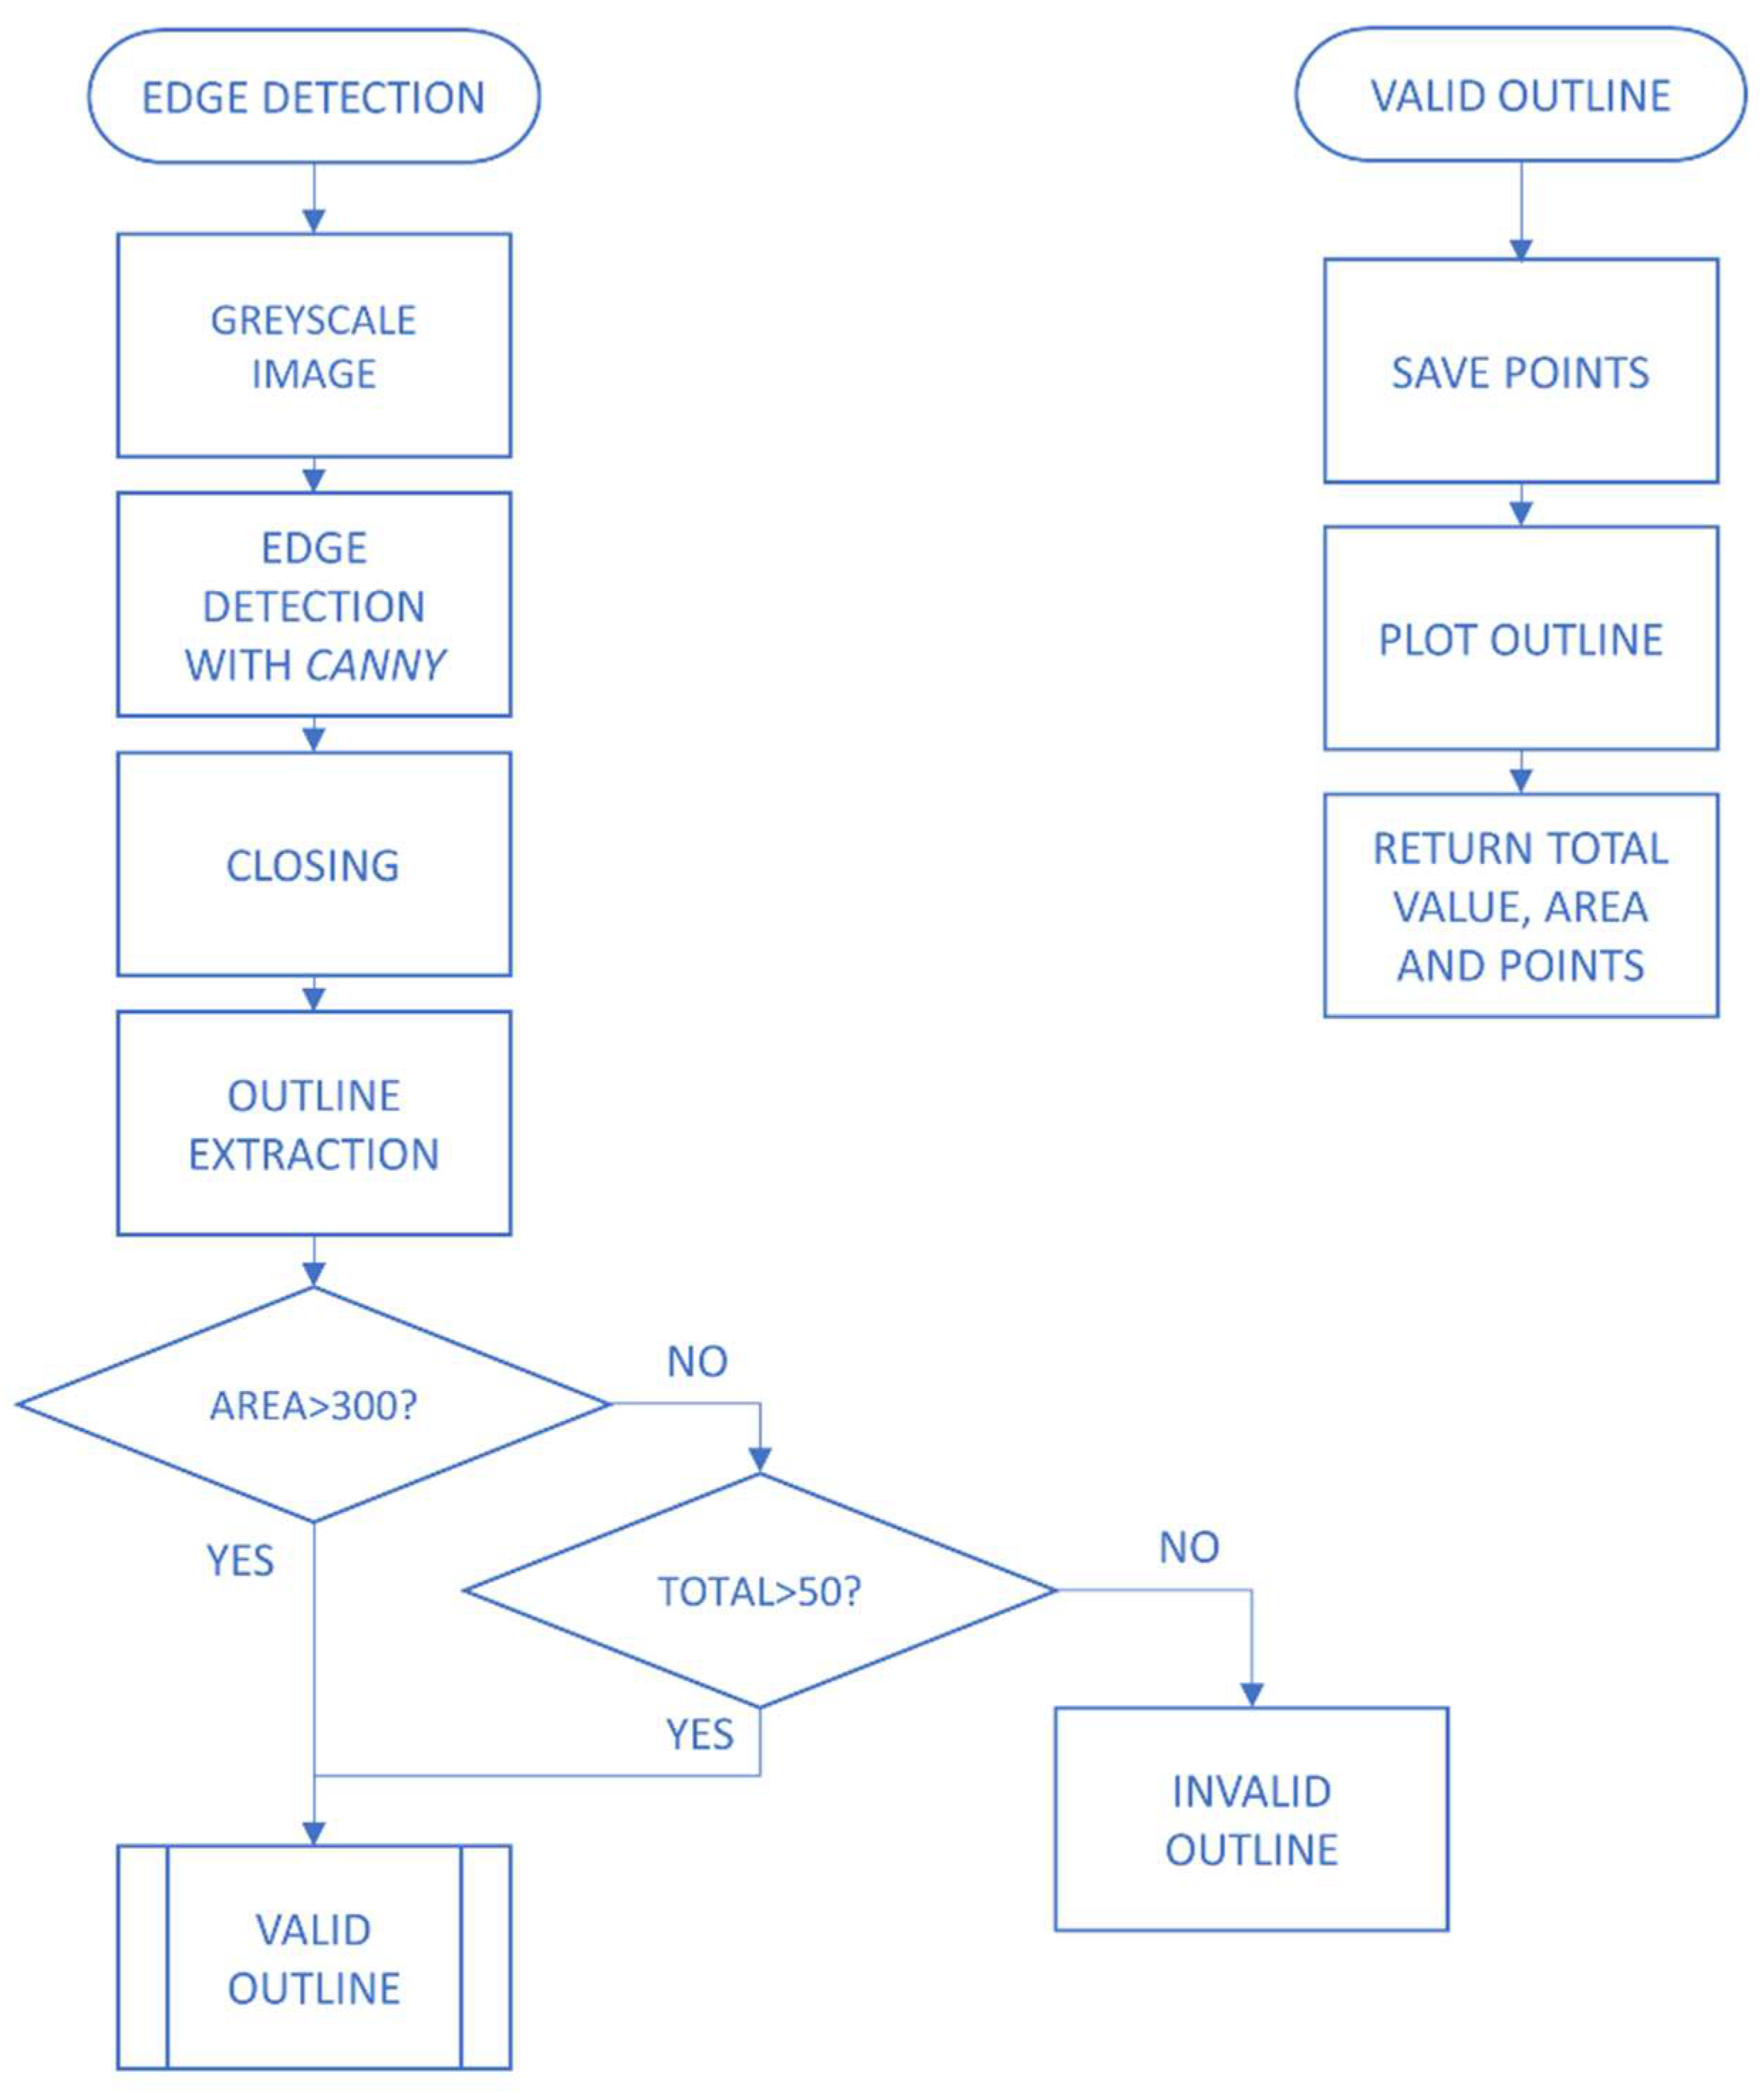
Once the images were prepared, features were extracted. This process is of great importance, since part of the success of this system relies on the correct detection of lesions to determine the type of psoriasis. Therefore, edge detection (Figure 5) was performed based on the use of the Canny’s algorithm. In this detection, texture, and color [32] were taken into account for the correct delimitation of the lesions, as these are two characteristics that differentiate these types of dermatological lesions from those produced by other pathologies. In this algorithm, in addition to re-performing this detection, values are extracted for the area and number of lesions present, which will serve as the basis for the next stage, the classification of the typology present. As shown in the lower part of the diagram in Figure 1, a classification was made into either eruptive or plaque-type psoriasis according to the number of lesions found, as the former is characterized by the appearance of multiple patches in a scattered manner. The values used for the classification were experimentally obtained, resulting in 300 pixels for the area, above which a contour is considered a lesion, and 50 pixels for the number, above which it is an eruptive-type lesion. The type of lesion determined the subsequent calculations; as in the case of eruptive psoriasis, the average area of the lesions was obtained in order to draw conclusions about comparable involvement in both cases. These measurements are presented in relative terms since images of different dimensions were used.
2.2.3. Parameter Estimation
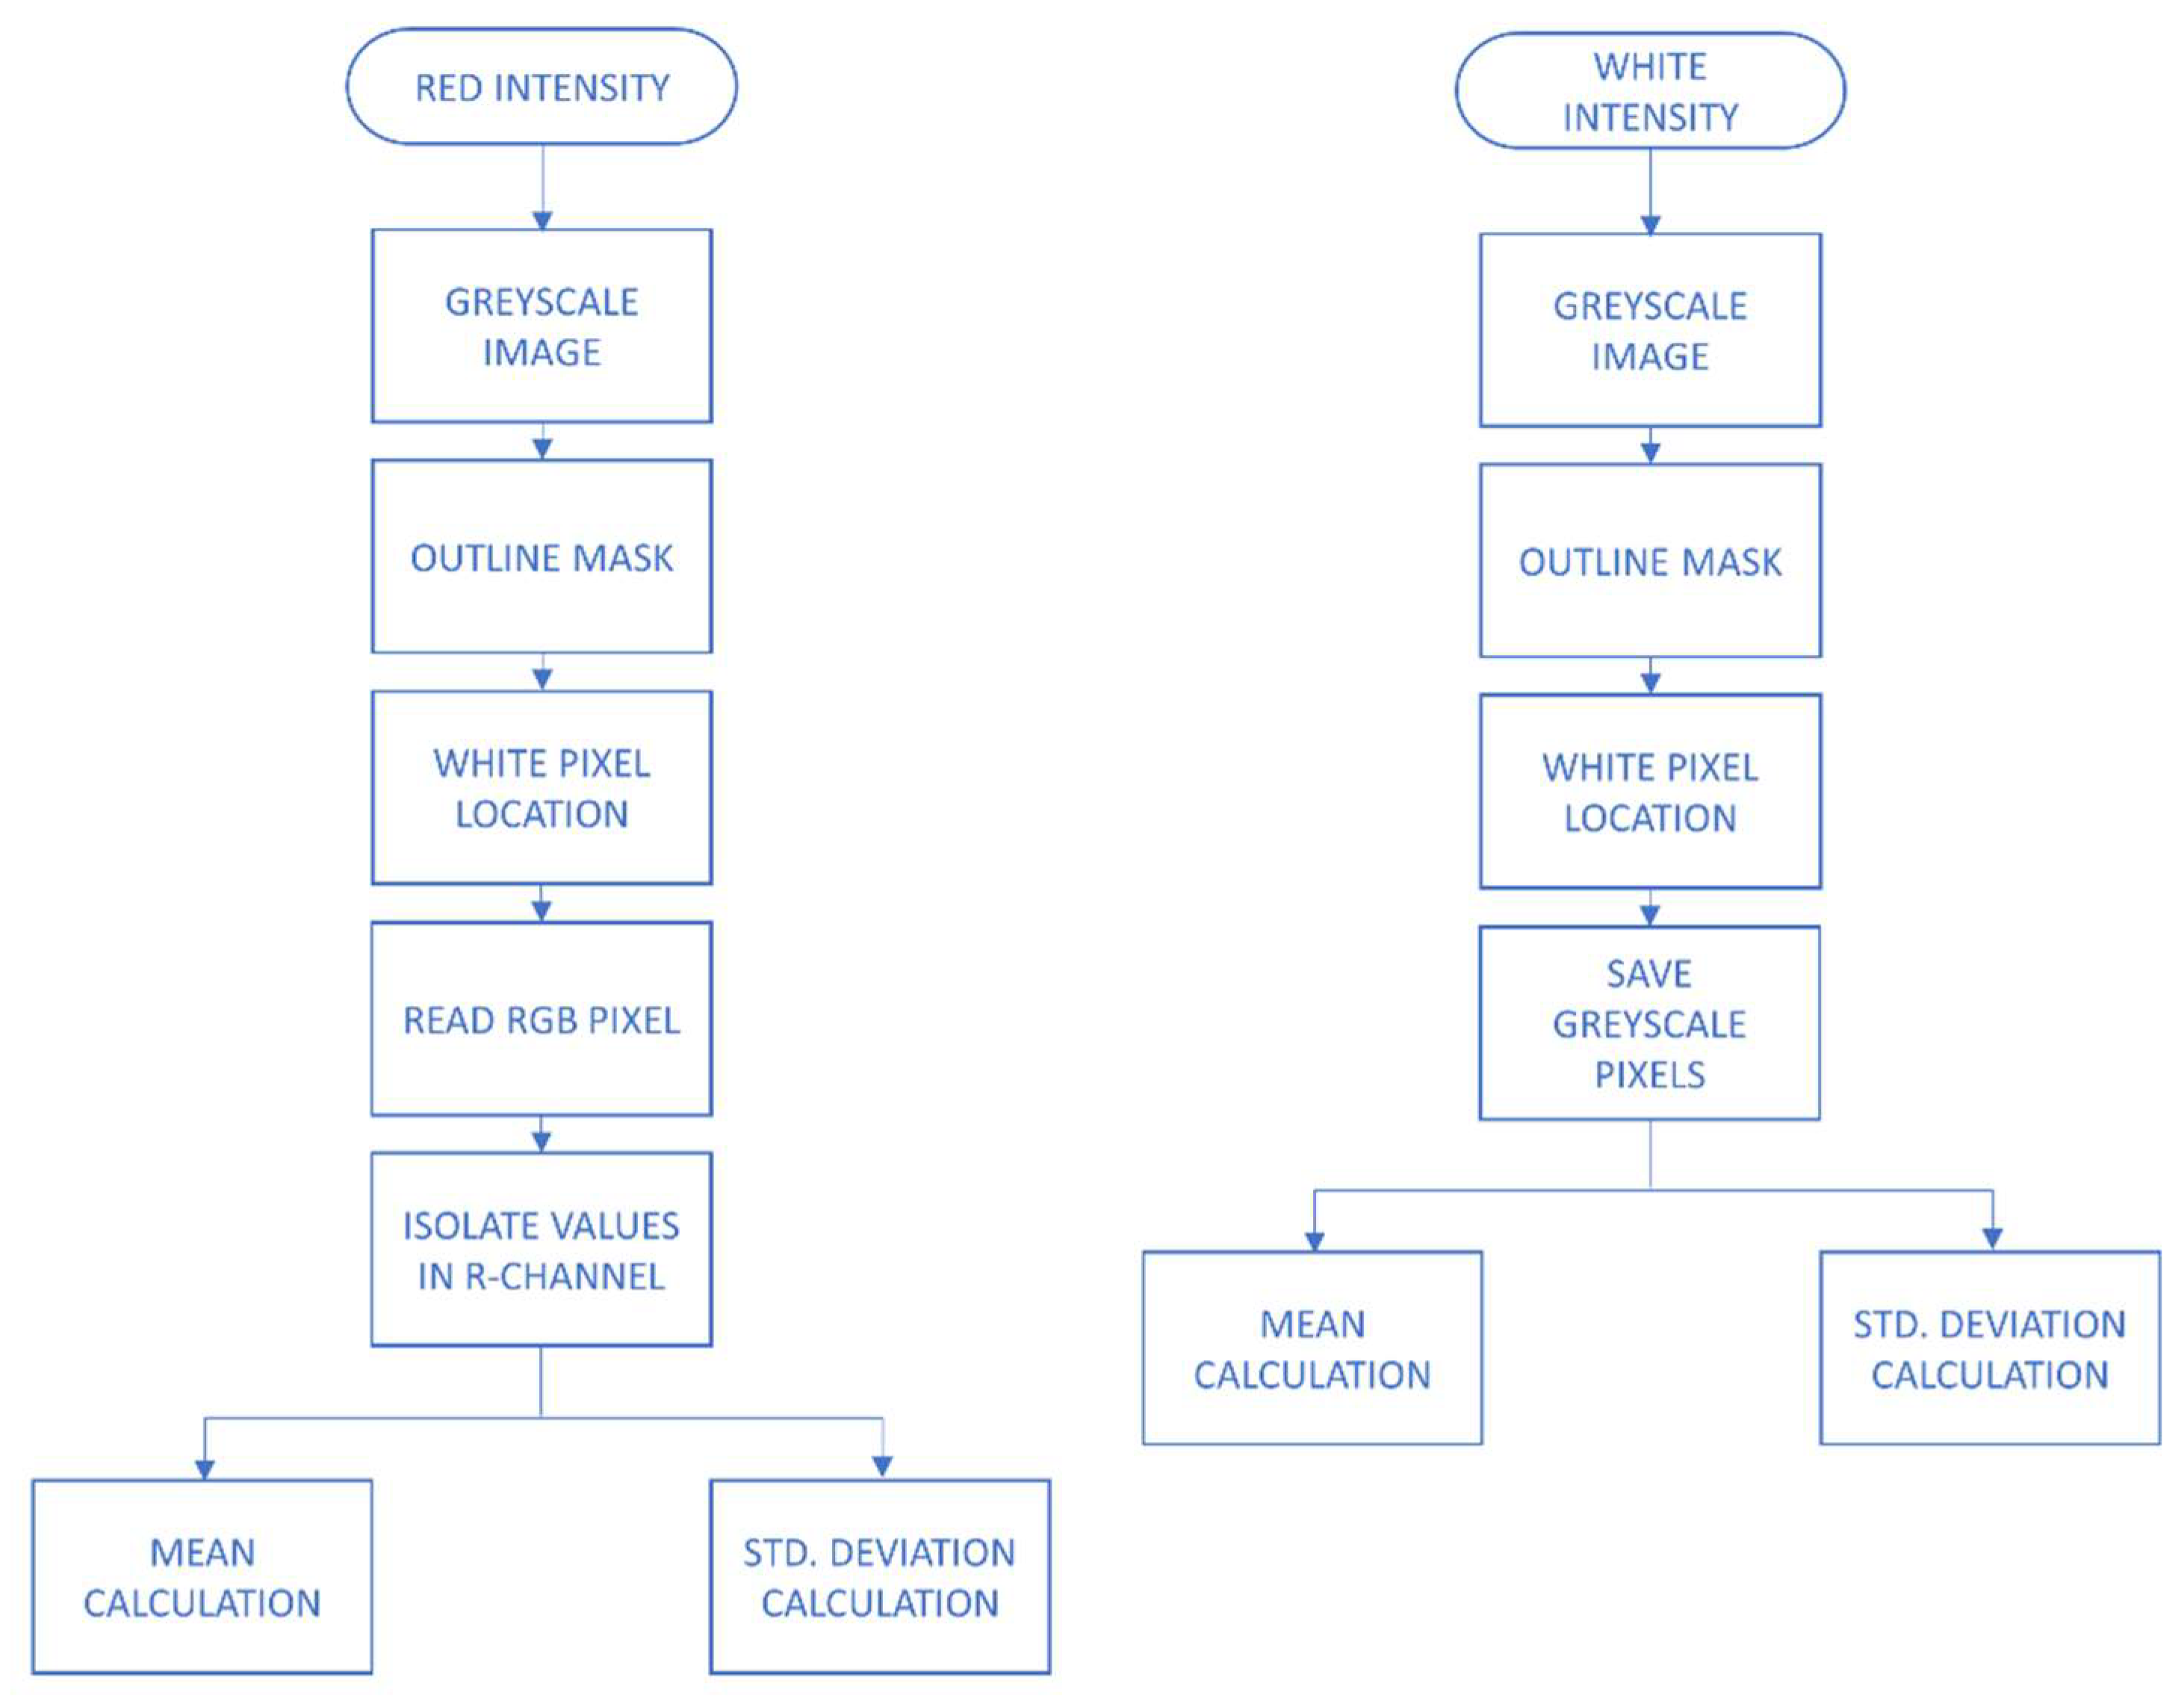
Once the images were prepared and the contours detected, it was time to obtain the parameters that were later stored in a database for diagnostic and monitoring purposes. As explained in the previous section and considering that these lesions are characterized by color and texture, parameter estimation was based on obtaining values relative to the intensity of red and white (Figure 6). In this way, numerical values were obtained, and conclusions could also be drawn as to whether the lesions showed erythema or redness [34], desquamation [35], or a mixture of both. By obtaining a mask of the lesions and then reading the pixels in RGB or grayscale as appropriate, the values present were obtained from which the mean and standard deviation were calculated so that they could be analyzed later.
2.3. Dataset
3. Results
Using the proposed strategy, the described algorithms were implemented in an integrated and automatic way so that the images recorded in psoriasis patients could be digitally processed.
In the first stage, concerning image preparation, easily processable images were obtained by eliminating three factors that are misleading for the diagnosis of lesions. This step was particularly necessary in the case of nipples, as they can be mistaken for the injuries themselves. However, in the case of marker cutout and hair removal, they were used with the aim of reducing the computational workload of the algorithm, as it does not make sense to subject large healthy areas to the process or areas where it will be impossible to identify lesions because they are covered by hair and not easily identifiable. Table 1 shows an example of the results obtained after applying the pre-processing algorithms described above on three different images using a Python IDE developed by Jet-brains, called PyCharm.
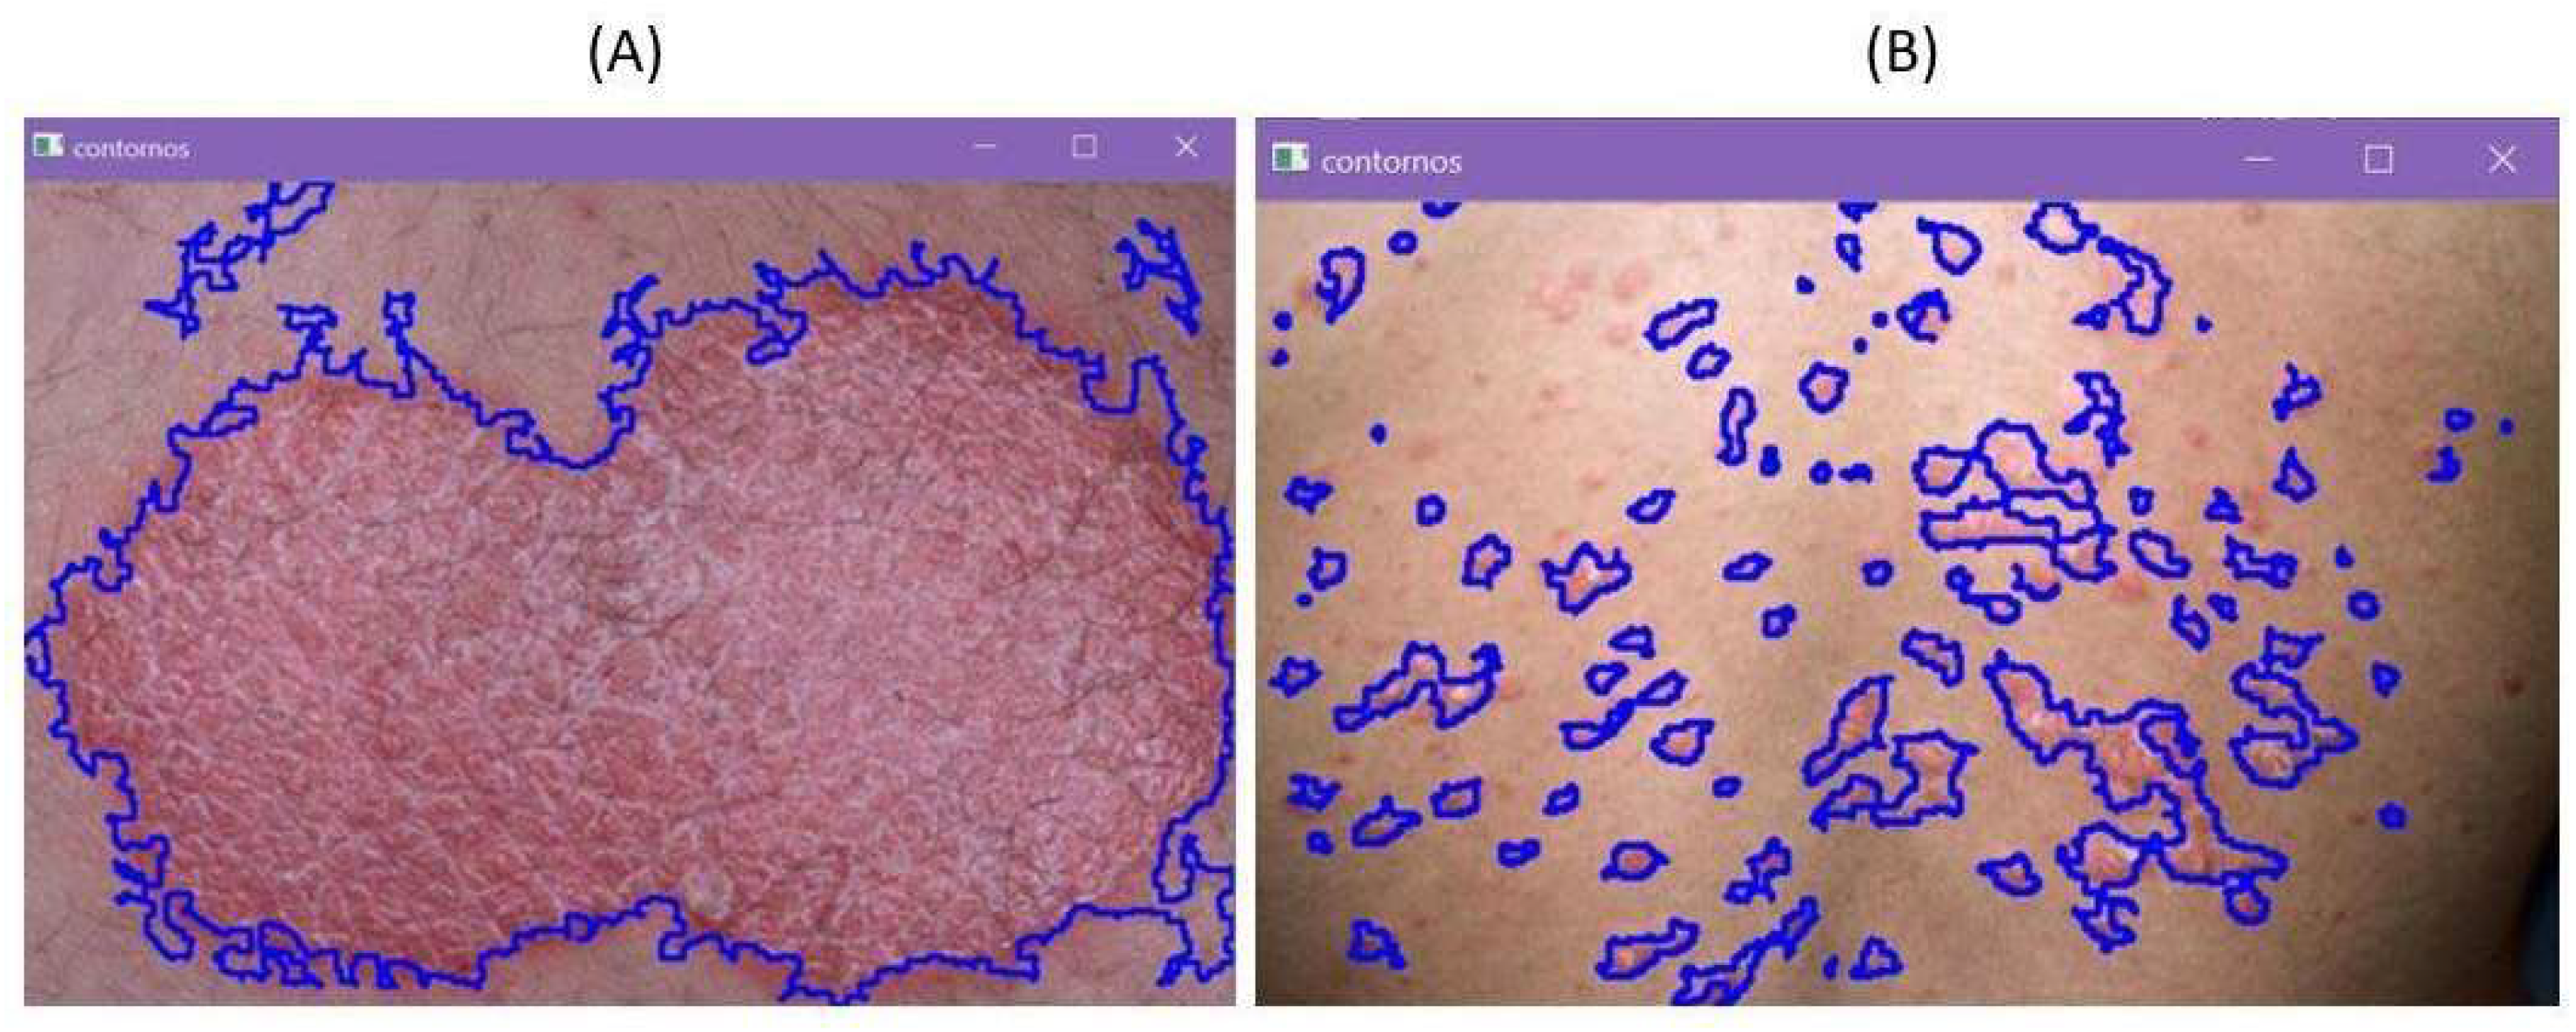
In the second stage, corresponding to feature extraction and classification of the type of eruptive or plaque lesions, the algorithm performs a detection of the lesion edges, selecting the areas of interest for analysis. This screening allows, in a simple way, to obtain measures of lesion severity by representing the affected area in relation to the total area. In addition, its function is also to classify the type of psoriasis, data that will help doctors to characterize each flare-up according to its typology, triggers, and consequences for each patient. Figure 7 shows an example of the classification of lesions of different typology.
Finally, in the fourth stage corresponding to obtaining parameters for the database, we started from the premise of seeking a method that allows comparison of the data between different types of psoriasis, even though they present lesions of different extents. This step was based on the use of color, as this is a common feature of psoriasis lesions. In addition, by extension, indicators of other sequelae of the disease can be obtained. If red tones are present, it can be inferred that the lesions are erythematous. On the other hand, in cases where white tones are present, it can be deduced that the lesions are desquamated.
Once the development and implementation of the proposed algorithms was completed, they were evaluated on the set of images described in Section 2.3 corresponding to the dataset. From a total of 20 images available, 18 were subjected to the complete processing flow of the proposed solution, which showed that the integration between the pre-processing, feature extraction, and parameter estimation algorithms was suitable for most of the cases analyzed. The images that could not be processed in a sequential way were those that needed a previous hair removal pre-processing. This was because the result obtained after the application of the hair removal algorithm gave rise to an image whose quality did not allow the processing of the following stages to be continued. The results of the application of this methodology on the images were presented to a dermatologist in order to obtain a qualitative assessment. The specialist highlighted the tight demarking of the lesions, especially in those images showing eruptive psoriasis, given their greater difficulty in presenting a variety of small lesions. Regarding the estimation of parameters, she also commented on the great help that can be provided by having parameters such as the extent of the lesions as well as the pre-existing erythema automatically calculated.
It should be noted that the samples were limited due to the pandemic situation, which prevented the implementation of the field data collection phase of the project. Thus, the research project is currently in the initial phase, but this paper discusses the methodology and design of the algorithm, as well as its actual application. Even though the present approach does not take into account predictive capabilities, the implementations of different machine learning algorithms are in place for the future. In this line, some relevant works have been recently developed: a good example is that presented by Kumar et al. [37] resorting to artificial neural networks (ANNs) trained by differential evolution algorithms (DEAs) and fuzzy C-means clustering so as to predict the evolution of skin cancer (melanoma). Another work was proposed by Goyal et al. [38] by using convolutional neural networks (CNNs) to implement an intelligent skin cancer detection app. These works may serve as appropriate examples inspiring future developments of the application presented in this work.
Once the proposed methodology has been fully developed and evaluated, the objective will be to integrate it into a support that allows interaction with the user, such as an app. The app will also be responsible for sending the resulting data to a database that can only be accessed by professionals for diagnostic purposes. The overall result of this integration will be a diagnostic tool that makes life easier for patients, can help to reduce saturation in health systems, and allows a continuous monitoring of the disease.
4. Concluding Remarks and Future Work
In this study, we have presented a diagnostic and monitoring methodology for psoriasis disease that consists of four stages encompassing image preparation, extraction of characteristics and classification of lesions, and obtaining parameters, in order to offer an integrated tool that can be used by professionals. The present proposal is intended to be a methodology for monitoring the disease in a way that eliminates the subjective factor of some of the strategies currently used, as well as simplifying the diagnostic and monitoring techniques in terms of material and sanitary means.
To develop this methodology, different digital-image processing techniques have been implemented, including image delimitation based on markers, hair removal, nipple detection, lesion contour detection, lesion classification based on areal measurements and number of lesions, as well as obtaining parameters that characterize the lesions such as red and white intensity. The assessments made by the professionals, in this case a dermatologist who issued a qualitative report, are focused on carrying out a more rigorous clinical and concordance validation in the future so as to know in depth the scope of the solution.
Once the results obtained have been analyzed, several lines for future enhancement of the presented methodology are proposed, which are mainly divided into making improvements to the algorithms presented (such as the hair removal algorithm) and adding new functionalities to the existing ones (for example, diversifying the cases analyzed by the nipple detection algorithm, which currently assumes the existence of two symmetrical nipples that are on the same horizontal).
Author Contributions
The tasks of this paper were divided as follows: on the one hand, J.M.-T., J.G. and A.S.P. focused on the development of the methodology and on writing this paper; on the other hand, Á.A. and J.G. focused on the project administration and funding acquisition; Á.A., J.G. and I.P.-R. carried out the paper editing and reviewing, as well as the manuscript’s final proofreading. All authors have read and agreed to the published version of the manuscript.
Funding
The research was funded by the Ministerio de Economía, Industria y Competitividad of the Gobierno de España and the European Regional Development Fund (TIN2016-76770-R), the Gobierno de Aragón (Reference Group T31_20R) and FEDER 2014–2020 “Construyendo Europa desde Aragón”.
Institutional Review Board Statement
Ethical review and approval were waived for this study, due to the images and data used in this article were taken from public repositories and from sources previously approved for publication strictly related to scientific or academic purposes.
Informed Consent Statement
Patient consent was waived because the images and data used in this article were taken from public repositories and from sources previously approved for publication strictly related to scientific or academic purposes.
Data Availability Statement
Not applicable.
Conflicts of Interest
The authors declare no conflict of interest.
References
- Sánchez, M.; Aldunce, M.J.; Belinchón, I.; Ribera, M.; Lafuente, R.F.; Carrascosa Carrillo, J.M.; Ferrándiz Foraster, C.; Puig Sanz, L.; Daudén Tello, E.; Vidal Sarró, D.; et al. Evidencebased guidelines of the spanish psoriasis group on the use of biological therapy in patients with psoriasis in difficult-treat sites (nails, scalp, palms and soles). Actas Dermo-Sifiliográficas 2014, 105, 923–934. [Google Scholar] [CrossRef]
- Kimball, A.; Gieler, U.; Linder, D.; Sampogna, F.; Warren, R.; Augustin, M. Psoriasis: Is the impairment to a patient’s life cumulative? J. Eur. Acad. Dermatol. Venereol. 2010, 24, 989–1004. [Google Scholar] [CrossRef] [PubMed]
- Boshle, M.J.; Kulkarni, A.; Feldman, S.R.; Balkrishnan, R. Quality of life in patients with psoriasis. Health Qual. Life Outcomes 2006, 4, 35. [Google Scholar]
- Raychaudhuri, S.K.; Maverakis, E.; Raychaudhuri, S.P. Diagnosis and classification of psoriasis. Autoimmun. Rev. 2014, 13, 490–495. [Google Scholar] [CrossRef]
- Shrivastava, V.K.; Londhe, N.D.; Sonawane, R.S.; Suri, J.S. First review on psoriasis severity risk stratification: An engineering perspective. Comput. Biol. Med. 2015, 63, 52–63. [Google Scholar] [CrossRef] [PubMed]
- Güvenir, H.A.; Demiröz, G.; Ilter, N. Learning Differential Diagnosis of Erythemato-Squamos diseases using voting feature intervals. Artif. Intell. Med. 1998, 13, 147–165. [Google Scholar] [CrossRef] [Green Version]
- George, Y.; Aldeen, M.; Garnavi, R. Automatic Scale Severity Assessment Method in Psoriasis Skin Images using Local Descriptors. IEEE J. Biomed. Health Inform. 2020, 24, 577–585. [Google Scholar] [CrossRef]
- Lafuente, R.F.; Pérez, J. Impact of obesity on the effectiveness of adalimumab for the treatment of psoriasis: A retrospective study of 30 patients in daily practice. Eur. J. Derm. 2014, 24, 217–223. [Google Scholar] [CrossRef]
- Lasierra, N.; Alesanco, A.; Guillén, S.; García, J. A three stage ontology-driven solution to provide personalized care to chronic patients at home. J. Biomed. Inform. 2013, 46, 516–529. [Google Scholar] [CrossRef]
- Banu, S.M.; Toacşe, G. A mobile/desktop medical application for automatic differential diagnosis of psoriasis lesions. In Proceedings of the 2013 Second International Conference on E-Learning and E-Technologies in Education (ICEEE), Lodz, Poland, 23–25 September 2013. [Google Scholar]
- Lasierra, N.; Alesanco, A.; García, J. Designing an architecture for monitoring patients at home: Ontologies and web services for clinical and technical management integration. IEEE J. Biomed. Health Inform. 2014, 18, 896–906. [Google Scholar] [CrossRef]
- Shrivastava, V.K.; Londhe, N.D.; Sonawane, R.S.; Suri, J.S. Computer-aided diagnosis of psoriasis skin images with HOS, texture and color features: A first comparative study of its kind. Comput. Methods Prog. Biomed. 2016, 126, 98–109. [Google Scholar] [CrossRef] [PubMed]
- Shrivastava, V.K.; Londhe, N.D.; Sonawane, R.S.; Suri, J.S. Reliable and accurate psoriasis disease classification in dermatology images using comprehensive feature space in machine learning paradigm. Expert Syst. Appl. 2015, 42, 6184–6195. [Google Scholar] [CrossRef]
- Le, N.Q.K.; Do, D.T.; Nguyen, T.T.D.; Nguyen, N.T.K.; Hung, T.N.K.; Trang, N.T.T. Identification of gene expression signatures for psoriasis classification using machine learning techniques. Med. Omics 2020, 1, 100001. [Google Scholar] [CrossRef]
- Tapak, L.; Afshar, S.; Afrasiabi, M.; Ghasemi, M.K.; Alirezaei, P. Application of Genetic Algorithm-Based Support Vector Machine in Identification of Gene Expression Signatures for Psoriasis Classification: A Hybrid Model. BioMed Res. Int. 2021, 2021, 5520710. [Google Scholar] [CrossRef] [PubMed]
- Han, S.S.; Kim, M.S.; Lim, W.; Park, G.H.; Park, I.; Chang, S.E. Classification of the clinical images for benign and malignant cutaneous tumors using a deep learning algorithm. J. Investig. Dermatol. 2018, 138, 1529–1538. [Google Scholar] [CrossRef] [Green Version]
- Pal, A.; Garain, U.; Chandra, A.; Chatterjee, R.; Senapati, S. Psoriasis skin biopsy image segmentation using deep convolutional neural network. Comput. Methods Programs Biomed. 2018, 159, 59–69. [Google Scholar] [CrossRef] [PubMed]
- Kaur, S. Noise Types and Various Removal Techniques. Int. J. Adv. Res. Electron. Commun. Eng. 2015, 4, 226–230. [Google Scholar]
- Manterola, H.; del Freson, M. Impainting digital aplicado a la reconstrucción de imágenes de ultrasonido. Mecánica Comput. 2013, XXXII, 3835–3848. [Google Scholar]
- Akbari, R.; Soryani, M.; Fathy, M. Image inpainting with prioritizing of hole’s pixels. In Proceedings of the 16th CSI International Symposium on Artificial Intelligence and Signal Processing (AISP 2012), Shiraz, Iran, 2–3 May 2012. [Google Scholar]
- Canny, J. A Computational Approach to Edge Detection. IEEE Trans. Pattern Anal. Mach. Intell. 1986, 8, 679–698. [Google Scholar] [CrossRef]
- Dougherty, G. Digital Image Processing for Medical Applications; Cambridge University Press: Cambridge, UK, 2009. [Google Scholar]
- Bankman, I. Handbook of Medical Image Processing and Analysis; Academic Press: Cambridge, MA, USA, 2008. [Google Scholar]
- Sinha, G.; Bhagwati, B.; Patel, B. Medical Image Processing Concepts and Applications; PHI: Delhi, India, 2014. [Google Scholar]
- Toennies, K. Guide to Medical Image Analysis, Methods and Algorithms/K. Toennies; Springer: London, UK, 2012. [Google Scholar]
- Dhawan, A. Medical Image Analysis/A Dhawan; John Wiley & Sons Inc.: Hoboken, NJ, USA, 2011. [Google Scholar]
- George, Y.; Aldeen, M.; Garnavi, R. Skin Hair Removal for 2D Psoriasis Images. In Proceedings of the 2015 International Conference on Digital Image Computing: Techniques and Applications (DICTA), Adelaide, SA, Australia, 23–25 November 2015. [Google Scholar]
- Lee, T.; Ng, V.; Gallagher, R.; Coldman, A.; Mclean, D. DullRazor: A Software Approach to Hair Removal from Images. Comput. Biol. Med. 1997, 27, 533–543. [Google Scholar] [CrossRef]
- Kiani, K.; Sharafat, A.R. E-shaver: An Improved DullRazor for Digitally Removing Dark and Light-colored Hairs in Dermoscopic Images. Comput. Biol. Med. 2011, 41, 139–145. [Google Scholar] [CrossRef]
- George, Y.; Aldeen, M.; Garnavi, R. Automatic Nipple Detection Method for Digital Skin Images with Psoriasis Lesions. In Proceedings of the 2019 Digital Image Computing: Techniques and Applications (DICTA), Perth, WA, Australia, 2–4 December 2019. [Google Scholar]
- Wang, Y.; Li, J.; Wang, H.; Hou, Z. Automatic nipple detection using shape and statistical skin color information. In International Conference on Multimedia Modeling; Springer: Berlin/Heidelberg, Germany, 2010; pp. 644–649. [Google Scholar]
- Al Abbadi, N.K.; Dahir, N.S.; Al-Dhalimi, M.A. Psoriasis Detection Using Skin Color and Texture Features. J. Comput. Sci. 2010, 6, 648–652. [Google Scholar] [CrossRef] [Green Version]
- Hassanein, A.S.; Mohammad, S.; Sameer, M.; Ragab, M.E. A Survey on Hough Transform, Theory, Techniques and Applications. Int. J. Comput. Sci. Issues (IJCSI) 2015, 12, 139–156. [Google Scholar]
- Lu, J.; Manton, J.H.; Kazmierczak, E.; Sinclair, R. Erythema Detection in Digital Skin Images. In Proceedings of the 2010 IEEE International Conference on Image Processing, Hong Kong, China, 26–29 September 2010. [Google Scholar]
- Lu, J.; Kazmierczak, E.; Manton, J.H.; Sinclair, R. Automatic Segmentation on Scaling in 2-D Psoriasis Skin Images. IEEE Trans. Med. Imaging 2013, 32, 719–730. [Google Scholar] [CrossRef] [PubMed]
- Psoriasis 360. Más allá de la piel. Copyright: Janssen-Cilag, S.A. 2020. Available online: https://www.psoriasis360.es/ (accessed on 18 November 2021).
- Kumar, M.; Alshehri, M.; AlGhamdi, R.; Sharma, P.; Deep, V. A DE-ANN Inspired Skin Cancer Detection Approach Using Fuzzy C-Means Clustering. Mob. Netw. Appl. 2020, 25, 1319–1329. [Google Scholar] [CrossRef]
- Goyal, V.; Singh, G.; Tiwari, O.M.; Kumar Punia, S.; Kumar, M. Intelligent skin cancer detection mobile application using convolution neural network. J. Adv. Res. Dyn. Control Syst. 2019, 11, 253–259. [Google Scholar]
Figure 1.
General operation diagram.

Figure 2.
Marker cutout.

Figure 3.
Hair removal (CLAHE stands for contrast limited adaptive histogram equalization).

Figure 4.
Routine and subroutine for nipple detection.

Figure 5.
Routine and subroutine for edge detection.

Figure 6.
Routines for red and white intensity estimation.

Figure 7.
Classification example: (A) eruptive psoriasis and (B) plaque psoriasis.


Publisher’s Note: MDPI stays neutral with regard to jurisdictional claims in published maps and institutional affiliations. |
© 2021 by the authors. Licensee MDPI, Basel, Switzerland. This article is an open access article distributed under the terms and conditions of the Creative Commons Attribution (CC BY) license (https://creativecommons.org/licenses/by/4.0/).
Share and Cite
MDPI and ACS Style
Martínez-Torres, J.; Silva Piñeiro, A.; Alesanco, Á.; Pérez-Rey, I.; García, J. Automatic Image Characterization of Psoriasis Lesions. Mathematics 2021, 9, 2974. https://0-doi-org.brum.beds.ac.uk/10.3390/math9222974
AMA Style
Martínez-Torres J, Silva Piñeiro A, Alesanco Á, Pérez-Rey I, García J. Automatic Image Characterization of Psoriasis Lesions. Mathematics. 2021; 9(22):2974. https://0-doi-org.brum.beds.ac.uk/10.3390/math9222974
Chicago/Turabian StyleMartínez-Torres, Javier, Alicia Silva Piñeiro, Álvaro Alesanco, Ignacio Pérez-Rey, and José García. 2021. "Automatic Image Characterization of Psoriasis Lesions" Mathematics 9, no. 22: 2974. https://0-doi-org.brum.beds.ac.uk/10.3390/math9222974
Note that from the first issue of 2016, this journal uses article numbers instead of page numbers. See further details here.