Article

Using PLS-SEM to Analyze the Effect of CSR on Corporate Performance: The Mediating Role of Human Resources Management and Customer Satisfaction. An Empirical Study in the Spanish Food and Beverage Manufacturing Sector

by
Fernando Gimeno-Arias
1,
José Manuel Santos-Jaén
2,*,
Mercedes Palacios-Manzano
2 and
Héctor Horacio Garza-Sánchez
3
1
Department of Management and Finance, University of Murcia, 30100 Murcia, Spain
2
Department of Accounting and Finance, University of Murcia, 30100 Murcia, Spain
3
Department of Accounting and Finance, University of Nuevo Leon, Nuevo León 66455, Mexico
*
Author to whom correspondence should be addressed.
Submission received: 29 September 2021 / Revised: 13 November 2021 / Accepted: 19 November 2021 / Published: 21 November 2021

Abstract

:
Although in recent decades corporate social responsibility (CSR) has been subjected to numerous studies in management and marketing literature about its impact on business results, the mechanism by which it affects performance has not been established. There is a lack of consensus when it comes to explaining how CSR actions are related to firm performance. Our research helps to understand this relationship through mediating effects such as CSR-oriented human resource management and customer satisfaction because employees and customers are critical stakeholders of companies and contribute directly to the determination of the corporate results. Through a study on a sample of small and medium-sized Spanish food and beverage manufacturing companies, and by using partial least squares structural equation modelling (PLS-SEM), we found that CSR does indeed impact business performance when CSR actions are mainly oriented towards more efficient management of human resources and customer satisfaction. In this way, the results lead us to conclude that depending on the stakeholder to which these actions are oriented, a specific orientation of the company’s CSR policy can be more efficient in corporate performance.

1. Introduction

Corporate social responsibility (CSR) is considered crucial for business success [1] and a strategic business necessity in order to achieve competitive advantage [2,3]. A large amount of research has shown that CSR orientation is the key to stimulating long-term stability, growth, and sustainable performance in a dynamic and changing environment [4].
CSR seems to have rather an unclear impact on corporate performance as no true causality has yet been proven. Despite the large number of studies undertaken to investigate this issue, the results are not conclusive [5,6]. There is a strong consensus that companies that incorporate CSR into their strategy actions increase their value creation [7,8,9,10,11]. However, the effects of CSR on corporate performance are not sufficiently specified, as there is a diversity of conclusions [12,13,14,15,16].
The lack of consensus might reflect model specification problems, such as omissions of intangible resources [2,4]. In this sense, [17] has stressed the importance of developmental models incorporating omitted variables and test mediating mechanisms to establish causal links between CSR practices and business performance. Although the most recent literature in this field showcases models that incorporate mediation mechanisms with variables, such as firm reputation [6], individual-level organizational identification, employees’ innovative job performance [18], or customer loyalty [19], there remains a wide field of research due to the diversity of variables that are part of the strategic management of the firms. The progressive incorporation of variables with mediating effects will help to understand and reach a consensus on how CSR actions and performance are related within the company.
The academic community has highlighted the lack of studies promoting CSR practices and have demanded more research in this area, especially from SMEs (small and medium-sized enterprises). With this purpose in mind, we have considered it necessary to examine whether there is a relationship between CSR activities and business performance and to study if this relationship could be mediated by other factors, such as good human resource management [20,21] or customer satisfaction [22,23], through the incorporation of CSR into business strategy. In this sense, the presence of research that has explored mediating effects [19,23,24,25,26,27,28,29,30,31,32] leads to work on these issues.
Given the state of knowledge, we consider it essential to deepen research to understand how certain aspects of management omitted in previous studies mediate the impact of CSR on the organization’s performance. With this purpose, this paper proposes and tests a model of the relationship between CSR activities, firm performance, human resource management and customer satisfaction in a sample of Spanish SMEs. According to the International Council for Small Business (ICSB) SMEs represent 90% of the business activity and therefore, from the analysis of this type of company, conclusions can be drawn that can be generalized to all companies. Thus, our research objective is to investigate whether the mediating effects serve as connectors between CSR and business performance. This article proposes to answer the following questions: Does CSR influence the performance of SMEs in the food and beverage manufacturer sector? Is this influence mediated by human resource management or customer satisfaction? In order to draw our conclusions, we obtained data from a sample of Spanish companies by means of a questionnaire. We investigated the relationships present in the companies between CSR, human resource management, customer satisfaction, and firm performance.
To process the data and study the adequacy of the proposed behavioral model, we apply structural equation modelling (SEM) by using the method partial least squares (PLS) because “using PLS-SEM to estimate common factor models is much less of an issue than (incorrectly) using factor-based SEM to estimate composite models” [33]. Moreover, not only does PLS-SEM work well with small samples [34], it has also proven to be the most appropriate technique to apply in order to estimate multiple relationships between latent constructs, above all, if they involve mediation [33]. The empirical results show that the relationship between CSR and performance does not occur directly but is mediated by human resource management and customer satisfaction.
We contribute to the field of study of mathematics by illustrating its multiple applications as a transversal science. The use of existing knowledge in statistics-mathematics in various areas allows us to conduct research with greater scientific rigor. Specifically, in the social sciences, the use of complex statistical techniques, such as PLS-SEM, has revolutionized research methodology in recent decades. It has provided the field with better-founded conclusions, better interconnections with reality and greater universality of their conclusions. On the other hand, this research provides a contribution to management literature by considering the CSR as a key business performance tool in SMESs in the food and beverage manufacturer sector, through the analysis of the relationship between CSR practices and performance, and by incorporating the mediating effects of human resource management and customer satisfaction. The inclusion of these two mediating effects seeks to draw the inconclusive results concerning the effect of CSR on firm performance in the research [35]. These results align with previous studies [19,21,22,26], although our research considers them as a whole and not in isolation.
The paper is structured as follows. After this introduction, Section 2 contains the literature review and proposes the hypotheses development. Section 3 describes the research method, the variables and model to test the hypotheses. In Section 4, the results are provided. Finally, Section 5 shows the main results and consequences and presents the conclusions.

2. Literature Review and Hypothesis

In recent decades, stakeholder theory [36] has become one of the dominant paradigms in business management research, through strategic interpretation of firms, which positions stakeholder management as a means of achieving the objectives of shareholders and corporate managers [37]. Stakeholder theory reconsidered the traditional view focused on agents directly related to the firm’s output-shareholders, customers, employees, and suppliers-introducing a new perspective on management understanding through the extended web of the stakeholder [9]. Thus, the firms’ stakeholders are defined as “any group or individual that can affect or is affected by an organization” [7], and these include shareholders, creditors, employees, customers, suppliers, public interest groups, and governmental bodies [38]. This type of management makes it possible to exploit the existing relationship between stakeholders and business objectives, such as profitability, stability, and growth [11].
One of the most interesting consequences of the stakeholder theory is the incorporation of CSR into business strategy, as a means of simultaneously achieving corporate and stakeholder objectives from a social perspective [8,9,11,38] namely “the conscience of the corporation is a logical and moral extension of the consciences of its principals” [37]. In this way, corporate management is guided by incentives to maximize shareholder value, and the individual or collective interests of stakeholders such as employees, customers, suppliers, and local communities within which corporations operate [11]. So, CSR includes firm actions aimed at efficient management to ensure the sustainability of the economy, the environment, and society in general [26].
From this perspective, scholars ask themselves about the benefits of incorporating CSR into the firm strategy and its impact on corporate performance. Does CSR have a direct impact on performance [12,13,14,15,16,39], and which company elements can model the impact of CSR on performance? The literature points CSR as a VRIO element (valuable, rare, difficult to imitate, and non-substitutable in the corporate organization) and therefore a source of a sustained competitive advantage [19,40,41], as it is mainly applied in human resources [42]. Thus, another conceptual framework of the influence of CSR on performance can be found in the Resource-Based View (RBV) Theory.
Therefore, we find that Corporative Social Responsibility (CSR) is a set of firms actions and policies (economic, social, and environmental) directed to interact with their stakeholders [26], i.e., “philanthropic in nature and not necessarily related directly to the operational business of a firm” [10]. We can find in the literature an extended definition published by the European Commission in 2001 stating that “firms voluntarily interact with their stakeholders and integrate social and environmental concerns to corporate management” [43]. The CSR idea is that for-profit organizations have a responsibility towards society [26]. These definitions regarding CSR lead us to think that disinterested actions in firms’ decisions may even incur a source of cost [6]. Nevertheless, CSR actions can contribute to the competitive advantage and superior performance of the corporations [10].
In this sense, CSR is based on the win–win concept through the evidence that social values are linked with corporate performance because prosperous societies are a business-friendly environment [43].
CSR is a complex concept because it “is an umbrella term overlapping with some yet synonymous with other concepts of business–society relations” [44]. CSR requires investments in resources, and the Return on Investments (ROI) is only noticeable in the long term and not necessarily in financial terms [10]. However, performance is a concept generally based on financial aspects as Return On Assets (ROA) and Tobin’s Q [43]. These dimensional differences explain the difficulty of empirically demonstrating a, clear direct causal effect of CSR practices on performance, particularly in situations where practices are not necessarily related directly to a firm’s operational business [10].
On the other hand, the economic objectives of CSR practices are not exclusively performance based. They could be varied and complex as a consequence of multiple categories of CSR related to the interests of the stakeholders. According to European Commission, “CSR that supports economic growth and prosperity is a means by which firms can pre-empt economic responsibility issues that might arise in their interactions with customers, suppliers and shareholders in the Marketplace”. Under this standpoint, CSR practices could contribute to the economic development of companies through indirect effects related to stakeholders [43].
Finally, the firm’s performance is an indicator of its capacity to achieve its goals and performance includes both financial and non-financial measures [45]. However, CSR is a strategic action of the firm that supports the economic aspects of the company and social cohesion, equity, integrity, and environmental responsibility [10]. Some authors consider CSR actions as “marketing techniques that enable companies to simultaneously pursue economic and social goals” [43]. The complexity of the CSR construct has very different objectives because it aims to satisfy other stakeholders and not all of them have the same interest in the firm’s performance [18]. From a strategic point of view, CSR contributes to increasing a firm’s value through superior competitive advantage [40], which may be related to human, organizational, or relational elements [5]. With this in mind, the relationship between CSR and corporate performance is mediated by the type of CSR action and stakeholder it impacts, and these arguments lead us to not expect a direct relationship between CSR actions and firm performance, and to formulate the following hypothesis:
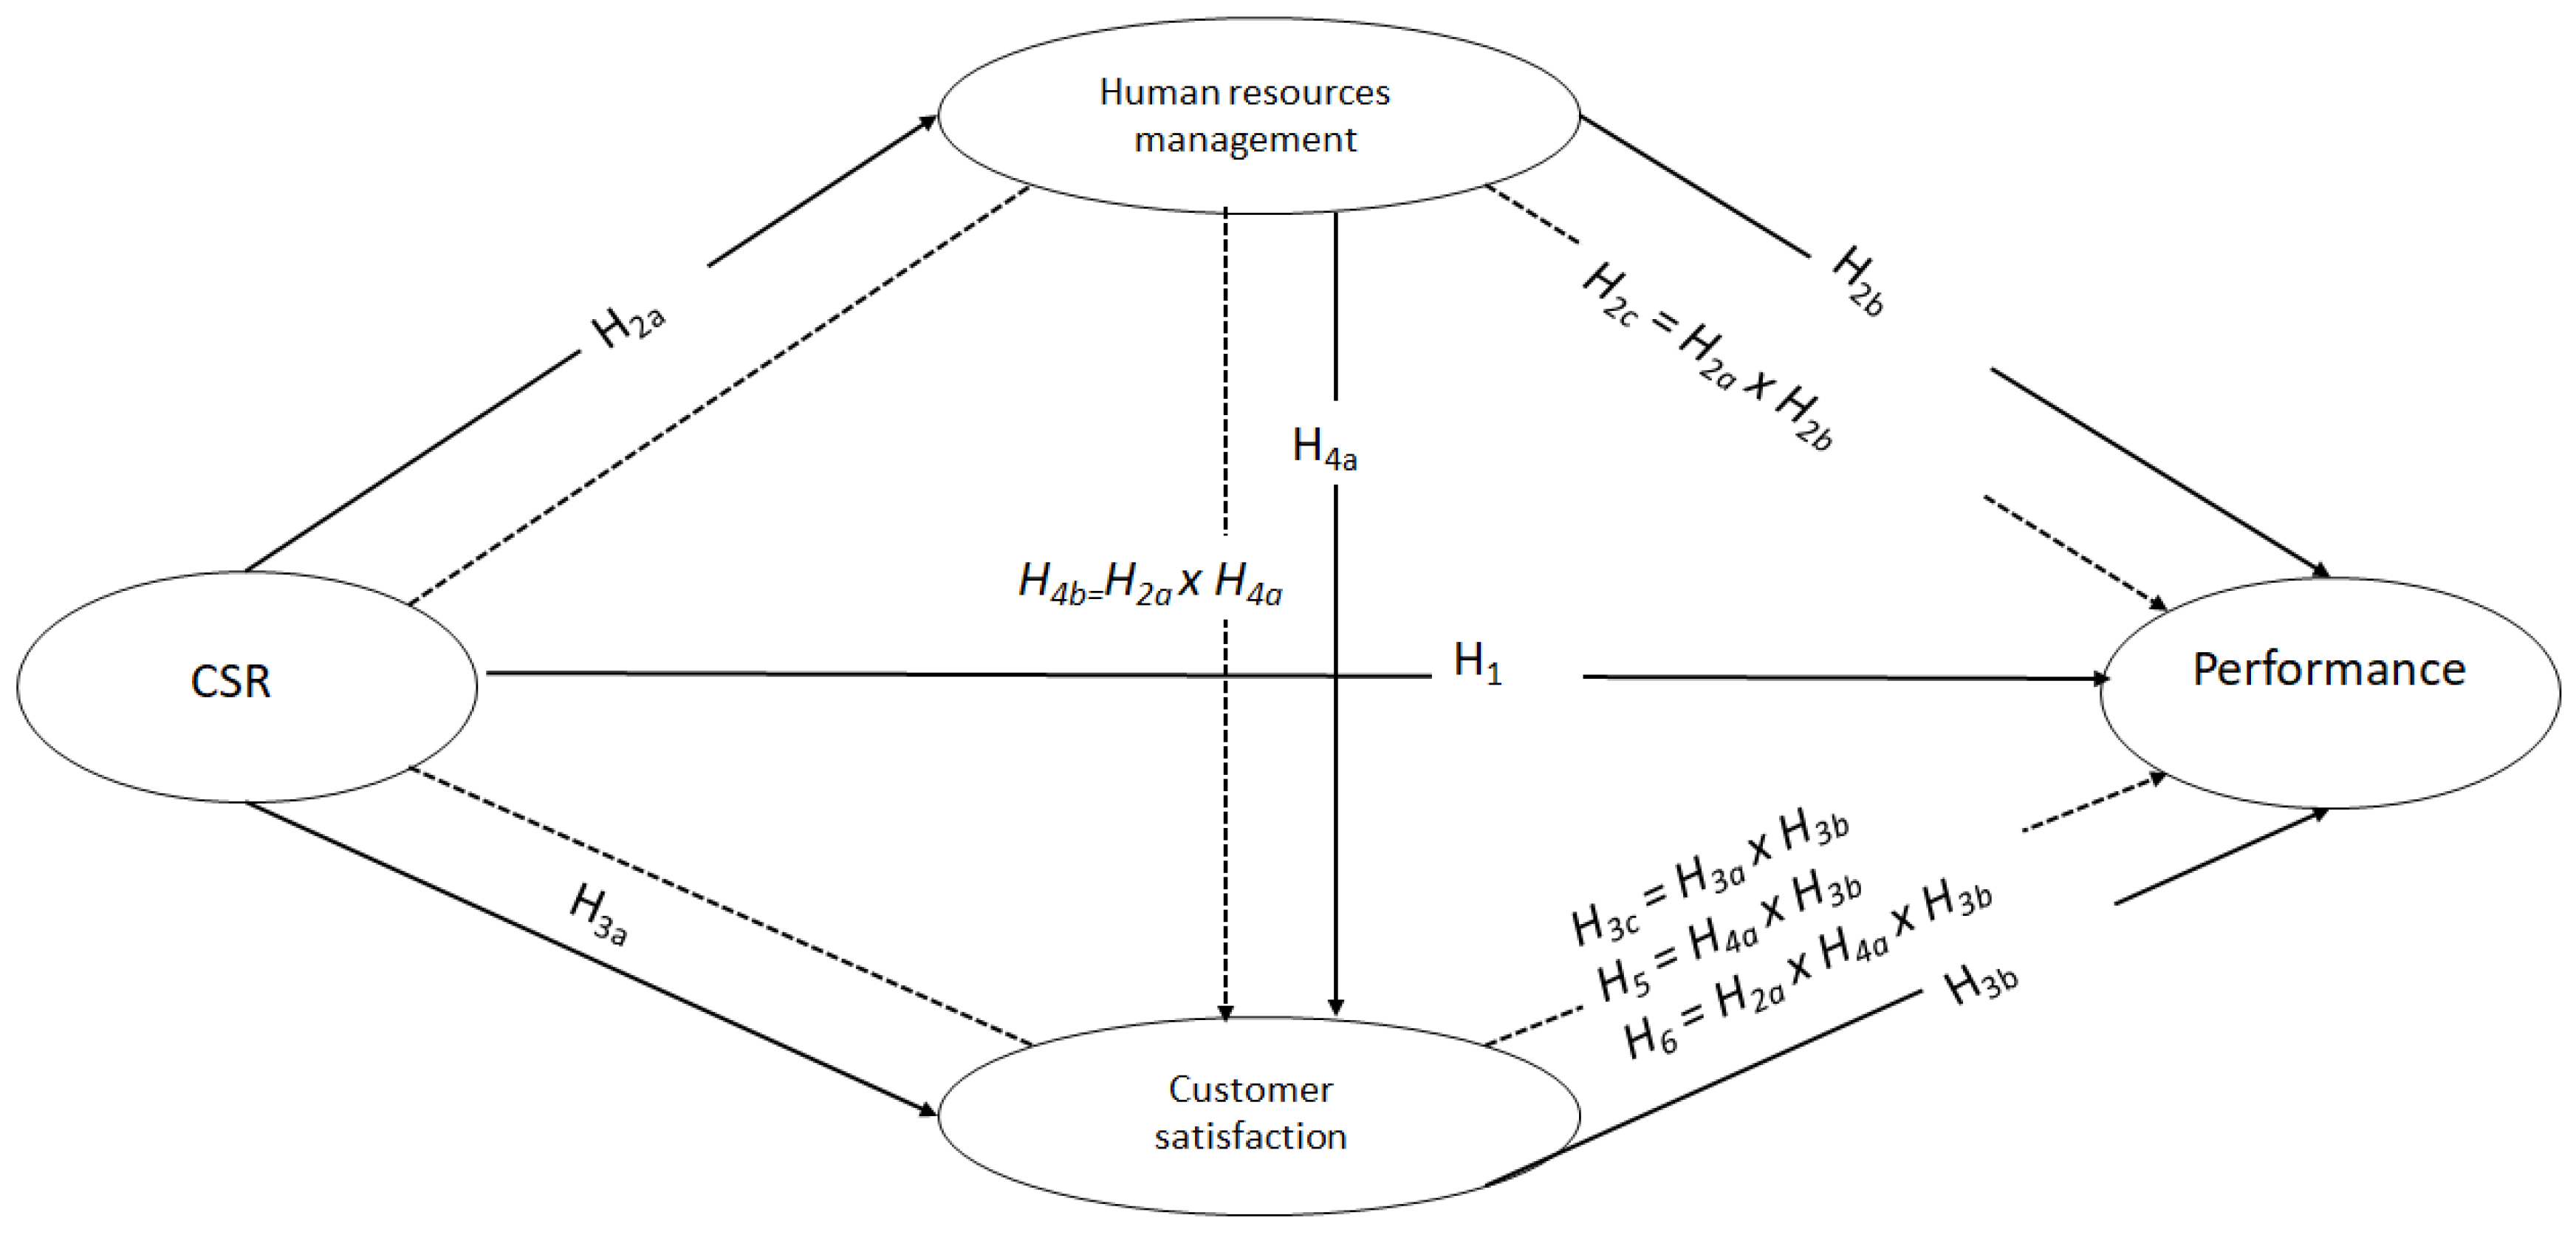
Hypothesis 1 (H1).
CSR practices do not directly affect corporate performance.
Although we do not find a direct cause–effect relationship between CSR practices and firm performance, the literature suggests that the adoption of CSR actions is related to a source of labor productivity and sales growth [22], elements necessary to achieve corporate performance. Labor productivity and sales growth are types of performance directly related to two concrete stakeholders: employees and customers. In this sense, specific works suggest a direct link between CSR-employee behavior [20] and CSR-customer satisfaction [22]. When the firms adopt CSR practices, it contributes to building closer relationships with their stakeholders [43], and particularly in human resources management, customer satisfaction or firm reputation [18].
In this way, through CSR “firms voluntarily interact with their stakeholders and integrate social and environmental concerns to corporate management” [43]. The interaction with one of their stakeholders, such as employees, could be a strategy of human resources that generate “structural cohesion, and employee-generated synergy that propels a company forward” [25]. The European Commission suggests in its 2003 report that proactive CSR motivates the workforce by offering training and development opportunities. CSR practices increase employees’ pride of belonging; they consider being a member of the firm is valuable and identify themselves with a socially responsible organization [19,26,29]. These situations show that companies can influence their employees’ attitudes. The behavior for their job contribute to organization’s purpose and better performance [46].
According to the relationship described, CSR could be a powerful tool for manage human resources through promoting employees’ positive attitudes, trust, and commitment to the firm, corporate identity, or job satisfaction [21]. CSR actions oriented to a human resource could be integrated into human resources management (HRM) because they “influence and shape the skills, attitudes, and behaviors of individuals, so that they can do their job better and achieve the objectives of the organization” [46]. The literature in human resources has demonstrated that adequate management strategy oriented to workers is a practical action to attain organizational objectives [27] because it favors the corporate identification of employees who tend to make extra efforts to defend corporative interests [28] and influences employees’ behavior, thus promoting superior worker performance and, as a consequence, a greater level of firm performance [25,46].
Human resources are key competitive factors in the firm because they are rare, valuable, inimitable, and non-substitutable [40], and are “organizational systems designed to achieve a competitive advantage through people” [42]. This competitive advantage is built by adequately managing human resources and linking this effort with the strategic goals of the firm; therefore, HRM are a source of a competitive advantage [25]. Researchers in the field of human resources report explanations about the effects of HRM on firm performance, finding a positive influence [25,45]. In this sense, the relationship between CSR and firm performance is mediated through HRM, which lead us to make the following hypothesis:
Hypothesis 2 (H2).
The effect of CSR on firm performance is mediated by human resource management (HRM).
This H2 Hypothesis is subdivided into the following three:
Hypothesis 2a (H2a).
CSR practices have a positive effect on HRM.
Hypothesis 2b (H2b).
HRM has a positive effect on corporate performance.
Hypothesis 2c (H2c).
CSR practices indirectly affect corporate performance through HRM.
Numerous studies have established empirical evidence of the relationship between CSR and customer satisfaction [23]. The literature shows CSR actions as “a competitive strategy for corporations to increase profits, customer satisfaction, customer loyalty, corporate reputation, and positive attitudes towards the company’s brands” [19]. Although it is difficult to establish a direct relationship between CSR and performance, there is a broad consensus in the literature in positioning customer satisfaction as a precursor to improved performance [19,29,31,41,47].
Satisfaction in business relationships is a fundamental aspect of the marketing literature [48] because relationships that contribute to business success are characterized by high levels of satisfaction among the parties [49,50,51]. In addition, the presence of satisfaction in the commercial relationship fosters stronger bonds [52], generates loyalty [48], provokes a desire for continuity [53], and encourages participation in collaborative activities [52]. These characteristics define satisfaction as “an affective state developed based on the evaluation of the relationship with a particular exchange partner or the degree of fulfillment of the expectations of each partner in an exchange relationship” [48]. The positive affective state arises as a consequence of the assets of the relationship [54], through a cognitive process that compares the expectations of the parties concerned with regards to their performance, both in their tangible aspects (profitability, growth, income) and in the intangible aspects reflected in their emotional dimension [52]. When assessing satisfaction, this double dimension (tangible and intangible) implies its division into economic and non-economic satisfaction [50,52,53]. Economic satisfaction is derived from the achievement of performance objectives [50] and is defined as “evaluation of the economic outcomes that flow from the relationship with its partner such as sales volume, margins, and discounts” [55].
On the other hand, non-economic satisfaction or “social satisfaction” is defined as “evaluation of the psychosocial aspects of its relationship, in that the interactions with the exchange partner are fulfilling, gratifying, and facile” [55]. This meaning of satisfaction focuses on a positive affective response to the psychological aspects of the customer relationship [50], the contacts are appreciated on a personal level and the client considers the firm concerned, respectful, and open to the exchange of ideas [53]. There is a broad consensus in the literature that economic satisfaction is the antecedent of social satisfaction [52,53,55] because high levels of economic satisfaction will have an emotional impact, provoking in the agents a collaborative and constructive response to any contingency, which will positively affect the increase in social satisfaction [52], although most of the studies focus on the social aspects [50].
Theoretical and empirical evidence show CSR actions of the firms are perceived by their customers positively and lead to higher satisfaction and loyalty [23]. Hence, CSR is a driver of client satisfaction [30]. In this case, social satisfaction is built on the customers’ psychosocial perceptions [50]. Marketing literature points to customer satisfaction as a key driver of a firm’s long-term profitability and higher market value [23] because “customers are among the most important stakeholders” [19]. Supported by the literature, we can establish a clear positive relationship between customer satisfaction and firm performance because many companies use customer satisfaction as an indicator of performance [31], the situation described in the following hypothesis:
Hypothesis 3 (H3).
The effect of CSR practices on firm performance is mediated by Customer Satisfaction (CS).
This H3 Hypothesis is subdivided into the following three:
Hypothesis 3a (H3a).
CSR practices have a positive effect on CS.
Hypothesis 3b (H3b).
CS has a positive effect on corporate performance.
Hypothesis 3c (H3c).
CSR practices indirectly affect corporate performance through CS.
The literature shows as CSR activities in the firm oriented to human resources management and the perception that employees have about CSR is considered a positive influence on their attitudes and behaviors, that it leads to worker satisfaction [27,28,29]. The strategies oriented to human resources add value to the firm because the workers obtain different skills, abilities, and capabilities [45]. These higher abilities of employees are associated with job satisfaction, higher productivity, and better decision-making which contribute to customer satisfaction and as a result, the likelihood of better organizational performance [24].
In this way, employees who are more engaged with the organization improve their customers’ experiences, especially those in direct contact with them. This better customer service directly relates to improving organizational performance in terms of sales, market share, and profitability [56]. So, it is expected that the increased employee motivation resulting from the company’s CSR actions will lead to increased customer satisfaction [32,57]. Following these considerations, we can formulate a hypothesis:
Hypothesis 4 (H4).
The effect of CSR on customer satisfaction (CS) is mediated by human resources management (HRM).
This H4 Hypothesis is subdivided into the following two:
Hypothesis 4a (H4a).
HRM practices have a positive effect on CS.
Hypothesis 4b (H4b).
CSR practices indirectly affect CS through HRM.
As we have discussed, human resources management originated by the company’s CSR policies has an impact on customer satisfaction, which fosters higher corporate performance. In this sense, based on Barney [40], “from the stakeholder’s point of view, it is always the focus on the interest of the individual stakeholder that influences the organization’s performance” [19]. The individual stakeholder with a more direct impact on firm performance is the customer, and customer satisfaction is one of the most widely used performance indicators by business analysts [19,30,58].
Based on the above reasoning, more satisfied customers promote higher company reputation, more sales growth, greater competitive advantage, and higher levels of firm performance [31]. For those employees who have direct contact with the customer, the result of HRM involves “helping achieve business objectives, adapt to change, meet customers’ needs, and increase financial performance through the deliverable of effective strategy execution” [59] So, we can establish the following hypothesis:
Hypothesis 5 (H5).
Human resources management (HRM) has indirect effects on corporate performance through customer satisfaction (CS).
The integration of the partial relationships described above leads to the establishment of a general model. In this way, we have described the influence that CSR has on employee motivation as part of HRM [19,25,26,29,60], as well as the influence CSR has on CS [19,21,22,23,31,41,47].
On the other hand, we have found a positive influence of HRM on firm performance [25,27,28,45,46] and CS on firm performance [19,23,49,50,51]. We have also found a positive relationship between HRM and CS [31,59].
Using this syllogism, we can establish a model of relationships using the following hypothesis:
Hypothesis 6 (H6).
CSR practices have indirect effects on corporate performance through human resources management (HRM) and customer satisfaction (CS).
Based on the above, Figure 1 represents the model for this research.

3. Methodology

3.1. Research Design and Data Collection

The study was carried out using a sample of 166 SMEs in the food and beverage manufacturer Spanish sector. The food and beverage manufacturing sector in Spain is comprised of 30,573 companies, which implies a sampling error of 7.59 (with a confidence level of 95%). In Spain, the food and beverage manufacturing sector accounts for 27% of the total number of manufacturing companies, according to data obtained from the National Statistics Institute (INE), the governmental institution that provides statistical data. Therefore, the conclusions obtained in the sector study can be extrapolated to other manufacturing companies. These companies were randomly selected using the SABI database, the most detailed database of company information in Spain with data on more than 2.6 million companies (financial, directors and contacts, corporate structures, audit reports, and a great deal of other relevant information). For this purpose, a telephone questionnaire was administered to managers of these companies during the spring of 2018. The telephone interview allows (1) selecting the key respondent for each company, and (2) resolving any doubts that the questionnaire may raise guaranteeing its face validity. The distribution of the companies according to their size is shown in Table 1.
In order to reduce the social acceptance bias, the anonymity of the responses was ensured at all times [61]. In addition, to ensure that the questionnaire was easy to understand, a pre-test was carried out with 5 companies. Based on the sample size obtained and a confidence level of 95%, the sampling error obtained is 7.8%. Moreover, with the power of 0.95, an effect size of 0.15, and 3 predictors, the calculated minimum sample size for this study was 119. Therefore, our sample of 166 companies is more than sufficient to validate all the effects found in the research [62].
Despite the fact that all data have been obtained from the same source, the results (see Section 4) show that there are no multicollinearity problems, ruling out a problem related to common method bias [63]. In the same way, a possible problem related to non-response bias has also been ruled out. For this purpose, the sample was divided into two groups, one with 75% of the first responses and the other with the rest. The results of the ANOVA test show that there were no significant differences between the two groups.

3.2. Variables

The four constructs have been measured with a Likert-type scale with five levels of answers, from 1 = “Strongly disagree” to 5 = “Strongly agree” for CSR, customer satisfaction and human resources management, and 1 = “Unimportant” to 5 = “Very important” for performance. The questions used in the survey can be found in Table A1 (Appendix A).

3.2.1. CSR

According to Galbreath and Shum [64], there are several good ways to measure CSR. Our research used five indicators adapted from the literature [65,66,67,68,69,70]. These indicators have been previously validated in other studies in the field [71]. A variable has been obtained that incorporates various CSR practices such as: (1) helping the community, (2) developing transparent management, and (3) protecting the environment.

3.2.2. Human Resources Management

Based on the previous literature and keeping in mind that human resources management is affected by external and internal factors [72], we have used seven indicators adapted from the literature [73,74,75,76,77]. As a result of this, in our questionnaire, we asked: (1) the equity of salary, (2) professional growth, (3) employees’ opportunities to be involved in decision making, (4) hiring criteria, (5) investment money and time in training, and (6) the existence of permanent training.

3.2.3. Customer Satisfaction

In order to understand how customer satisfaction has evolved, a variable composed of three indicators adapted from previous literature has been created [19,23,31,32,47]. For this purpose, companies were asked about the evolution of their corporate image and reputation, the quality of their products and the satisfaction of their customers.

3.2.4. Performance

Performance was evaluated with a scale of three items based on previous research [4,78,79]. The scale created has been used to measure the financial and non-financial performance of companies, in aspects such as profitability, sales growth, and customer satisfaction, in comparison with the performance of their competitors. The use of this type of measurement, rather than relying on accounting data, allows us to measure a company’s success more efficiently [78].

3.3. Data Analysis

Due to the high correlation between the indicators that make up the same construct or latent variable, the model comprises four composite variables performed in mode A [80]. According to Hair et al. [33], to estimate composite models, PLS-SEM is better than SEM. Therefore, we considered PLS-SEM, a variance-based structural equation modeling technique [81], the most appropriate for analyzing the model [82,83,84]. Other reasons that led us to choose this technique were that PLS-SEM is the most appropriate to apply to estimate multiple relationships between latent constructs above all if they involve mediation [33] and also due to this technique working very well when the sample is not very large [34]. Therefore, the model proposed in the research has been analyzed using Smart-PLS software 3.3 [85]. Following Henseler’s indications, a bootstrapping procedure with 10,000 subsamples was performed to test the hypotheses [86].

4. Results

4.1. Analysis of the Measurement Model

In this model, it has been assumed that all latent variables are antecedents of their indicators. That is, they are reflective variables. For this reason, in order to evaluate the measurement model, indicators and construct reliability, convergence validity and discriminant validity, as well as analysis were carried out. The results are presented in Table 2.
The reliability of the constructs was analyzed through factor loadings, Cronbach’s Alpha, composite reliability, the Dijkstra–Henseler rho ratio, and the average variance extracted (AVE) [87].
The reliability of the indicators were examined through their loadings. All but two of the factor loadings exceed the established minimum value of 0.7 [88]. Furthermore, these two loads have values close to this minimum level, so they can also be accepted [89]. Therefore, the reliability of the indicators has been demonstrated.
The values for Cronbach’s alpha, composite reliability, and the Dijkstra–Henseler rho ratio range from 0.731 to 0.925, demonstrating the reliability of the constructs [88]. Convergent validity was measured using average variance extracted (AVE). All values are greater than 0.5, confirming the internal consistency of the reflective scales [90].
The Fornell–Larcker criterion [91] was used to check the discriminant validity. For this purpose, the correlations between each pair of constructs were checked to ensure they did not exceed the square root of the AVE of each of the constructs, as can be seen in the results shown in Table 3 below. In addition, the heterotrait–monotrait (HTMT) ratio of correlations [92] was estimated. All values are below the conservative threshold of 0.850, confirming the adequate discriminant validity for all latent variables.
For further analysis, this research evaluated the quality by finding that the normed fit index (NFI) and the standardized root mean square residual (SRMR) and (NFI) did not exceed the value of 0.09 and 0.08 [86,93]. These results clearly show an adequate fit of the model.
Finally, through the QB2 statistical test (a cross-validated redundancy index), carried out by the blindfolding method [94], the predictive relevance of the independent latent variables has been evaluated. The findings in Table 2 reveal that all QB2 are positive, confirming the satisfactory explanatory qualities of the model [95].

4.2. Path Analysis

The structural model analysis begins by checking for the possible existence of a multicollinearity problem by analyzing the variance inflation factor (VIF). The results in Table 4 show how the values fluctuate from 1 to 1.85. Therefore, there is no multicollinearity problem in the structural model [96].
A further bootstrapping (10,000 resamples) procedure was then carried out with the aim to calculate t-values and percentile confidence intervals [97]. The coefficient of determination (R2) of the dependent variables, the algebraic sign and magnitude, as well as the effect size (f2) of the standardized regression coefficients were measured (Hair et al., 2017). The results are presented in Table 4 and Figure 2.
The findings reveal that CSR does not directly affect performance, as the effect found, and although positive, it is not significant (β = 0.133), rejecting H1. However, a positive and direct influence of CSR on human resources management and customer satisfaction has been found (β = 0.518 *** and β = 0.519 *** respectively), thus verifying H2a and H3a. Likewise, a positive and significant influence of human resources management on performance and customer satisfaction has also been found (β = 0.133 * and β = 0.228 *** respectively), thus verifying H2b and H4a. Finally, the results also show a positive and significant influence of customer satisfaction on performance (β = 0.671 ***), verifying H3b.
R2 is used as a measure to analyze the model’s predictive power as it shows how the variance of a variable can be explained by those variables that predict it in the model. The higher the R2 value, the greater the predictive power of the model. As can be seen in the results, the variance explained is 43.7% for customer satisfaction, 26.4% for Human resources management and 56.0% for performance, exceeding the minimum value of 10% established by Falk & Miller [98].
According to Cohen [62], the contribution of each independent variable to R2 values of a dependent variable is to measure through f2. Levels of f2 of 0.02, 0.15, and 0.35 indicate a small, medium, or large effect, respectively. In addition, Chin [99] established a minimum value for f2 of 0.02. As can be seen from the results, this minimum value is exceeded in all cases, except for the relationship between CSR and performance. Based on the above, the results show that customer satisfaction has a substantial effect on performance. There is also a significant effect of CSR on human resource management and customer satisfaction.

4.3. Mediating Effects

The results in Table 4 also show the indirect effects and the variance accounted for (VAF) [100]. VAF shows the size of the indirect effect relative to the total effect. As can be seen, the findings reveal how the indirect effects of CSR on performance through human resources management and customer satisfaction are both positive and significant (β = 0.069 * and β = 0.349 *** respectively, plus a sequential indirect effect β = 0.079 **). Regarding the VAF, the indirect effect of CSR on performance is about 97.83% of the total effect, with 13.58% through human resources management, 68.70% through customer satisfaction, and an additional 15.55% sequentially. Since the direct effect is not significant and indirect effects are significant, and the proportions mediated are prominent, a full mediation is suggested, supporting H2c, H3c and H6. Furthermore, the results show that the indirect effect of CSR on customer satisfaction is positive and significant (β = 0.118 **). The proportion mediated by human resources management is 18.52% (VAF) of the total effect of CSR on customer satisfaction, supporting H4b. Finally, customer satisfaction partially mediates between human resources management and performance (β = 0.153 **), with a 53.50% (VAF) of the total effect of human resources management on performance, supporting H5.
In sum, the findings demonstrate that the relationship between CSR and performance is fully mediated by human resources management and customer satisfaction. For CSR practices to have a positive influence on company performance, they must be partly aimed at improving employee and customer satisfaction.

4.4. Evaluation of the Predictive Performance

According to Shmueli [101], the predictive performance of a model is its ability to generate new predictions. Therefore, predictive validity (out-of-sample prediction) shows how a given outcome variable can be predicted from a given set of measures of a variable [102].
The model’s predictive capacity has been evaluated through a cross-validation with holdout samples [95] by running the PLS predict algorithm with SmartPLS [103].
As can be observed in Table 5, the model shows predictive power for all the constructs, since their Q2 value is above 0. A similar conclusion is achieved when comparing the RMSE or MAE results of the PLS-SEM with those of a linear regression model (LM) model. In almost all results obtained, PLS-SEM produces lower errors and higher Q2, demonstrating the model’s predictive performance [89].

4.5. Robustness Checks

4.5.1. Endogeneity

In order to rule out the existence of endogeneity problems, we applied the Gaussian copula approach developed by Park and Gupta [104], which is suitable to identify endogeneity issues [105]. In order to do this, we previously checked that the variables that could generate an endogeneity problem are nonnormally distributed. We carried out, using Stata v.16, the skewness/kurtosis test for normality, the Shapiro–Wilk W test for normal data and the Shapiro–Francia W’ test for normal data on the independent variable scores of CSR, human resources management and customer satisfaction. The findings show that none of the variables has a normally distributed score. These results allow us to continue with the Gaussian copula approach [106].
The results in Table 6 show that the effect of the Gaussian copula is not a significant equation. Therefore, endogeneity is not an issue in this model.
We checked for endogeneity arising from the existence of omitted variables when trying to explain the dependent variable [107]. For this purpose and according to Antonakis et al. [108], we introduced as control variables size, age and the percentage of the company’s capital owned by the family ownership. Once the control variables have been introduced, we run the PLS algorithm again and we can see that the results obtained are identical to those obtained without the control variables. Thus, we can establish that the omitted variables are controlled in this model.

4.5.2. Heterogeneity

To identify unobserved heterogeneity in PLS path models, we carried out the FIMIX-PLS procedure [109]. We established a maximum number of iterations of 5000 and 10 repetitions. Taking into account the size of the sample, an effect size of 0.15 and a power level of 80%, we established two segments. Subsequently, FIMIX-PLS was run for 1 to 2 segments.
Table 7 shows the results obtained, which are ambiguous in determining the number of appropriate segments, which shows that unobserved heterogeneity is not a problem [110].

4.5.3. Nonlinear Effects

We checked for the existence of nonlinear effects by following the instructions set out by Svenson [111]. First, we carried out the Ramsey RESET [112] using Stata V.16 with the values obtained for the latent variables. The findings in Table 8 show that none of the partial regressions are subject to nonlinearities. Second, we included interaction terms to represent the quadratic effects between the variables. The findings, with 10,000 samples, show that none of the nonlinear effects are significant. Therefore, in this model the linear effects are robust.

5. Discussions and Conclusions

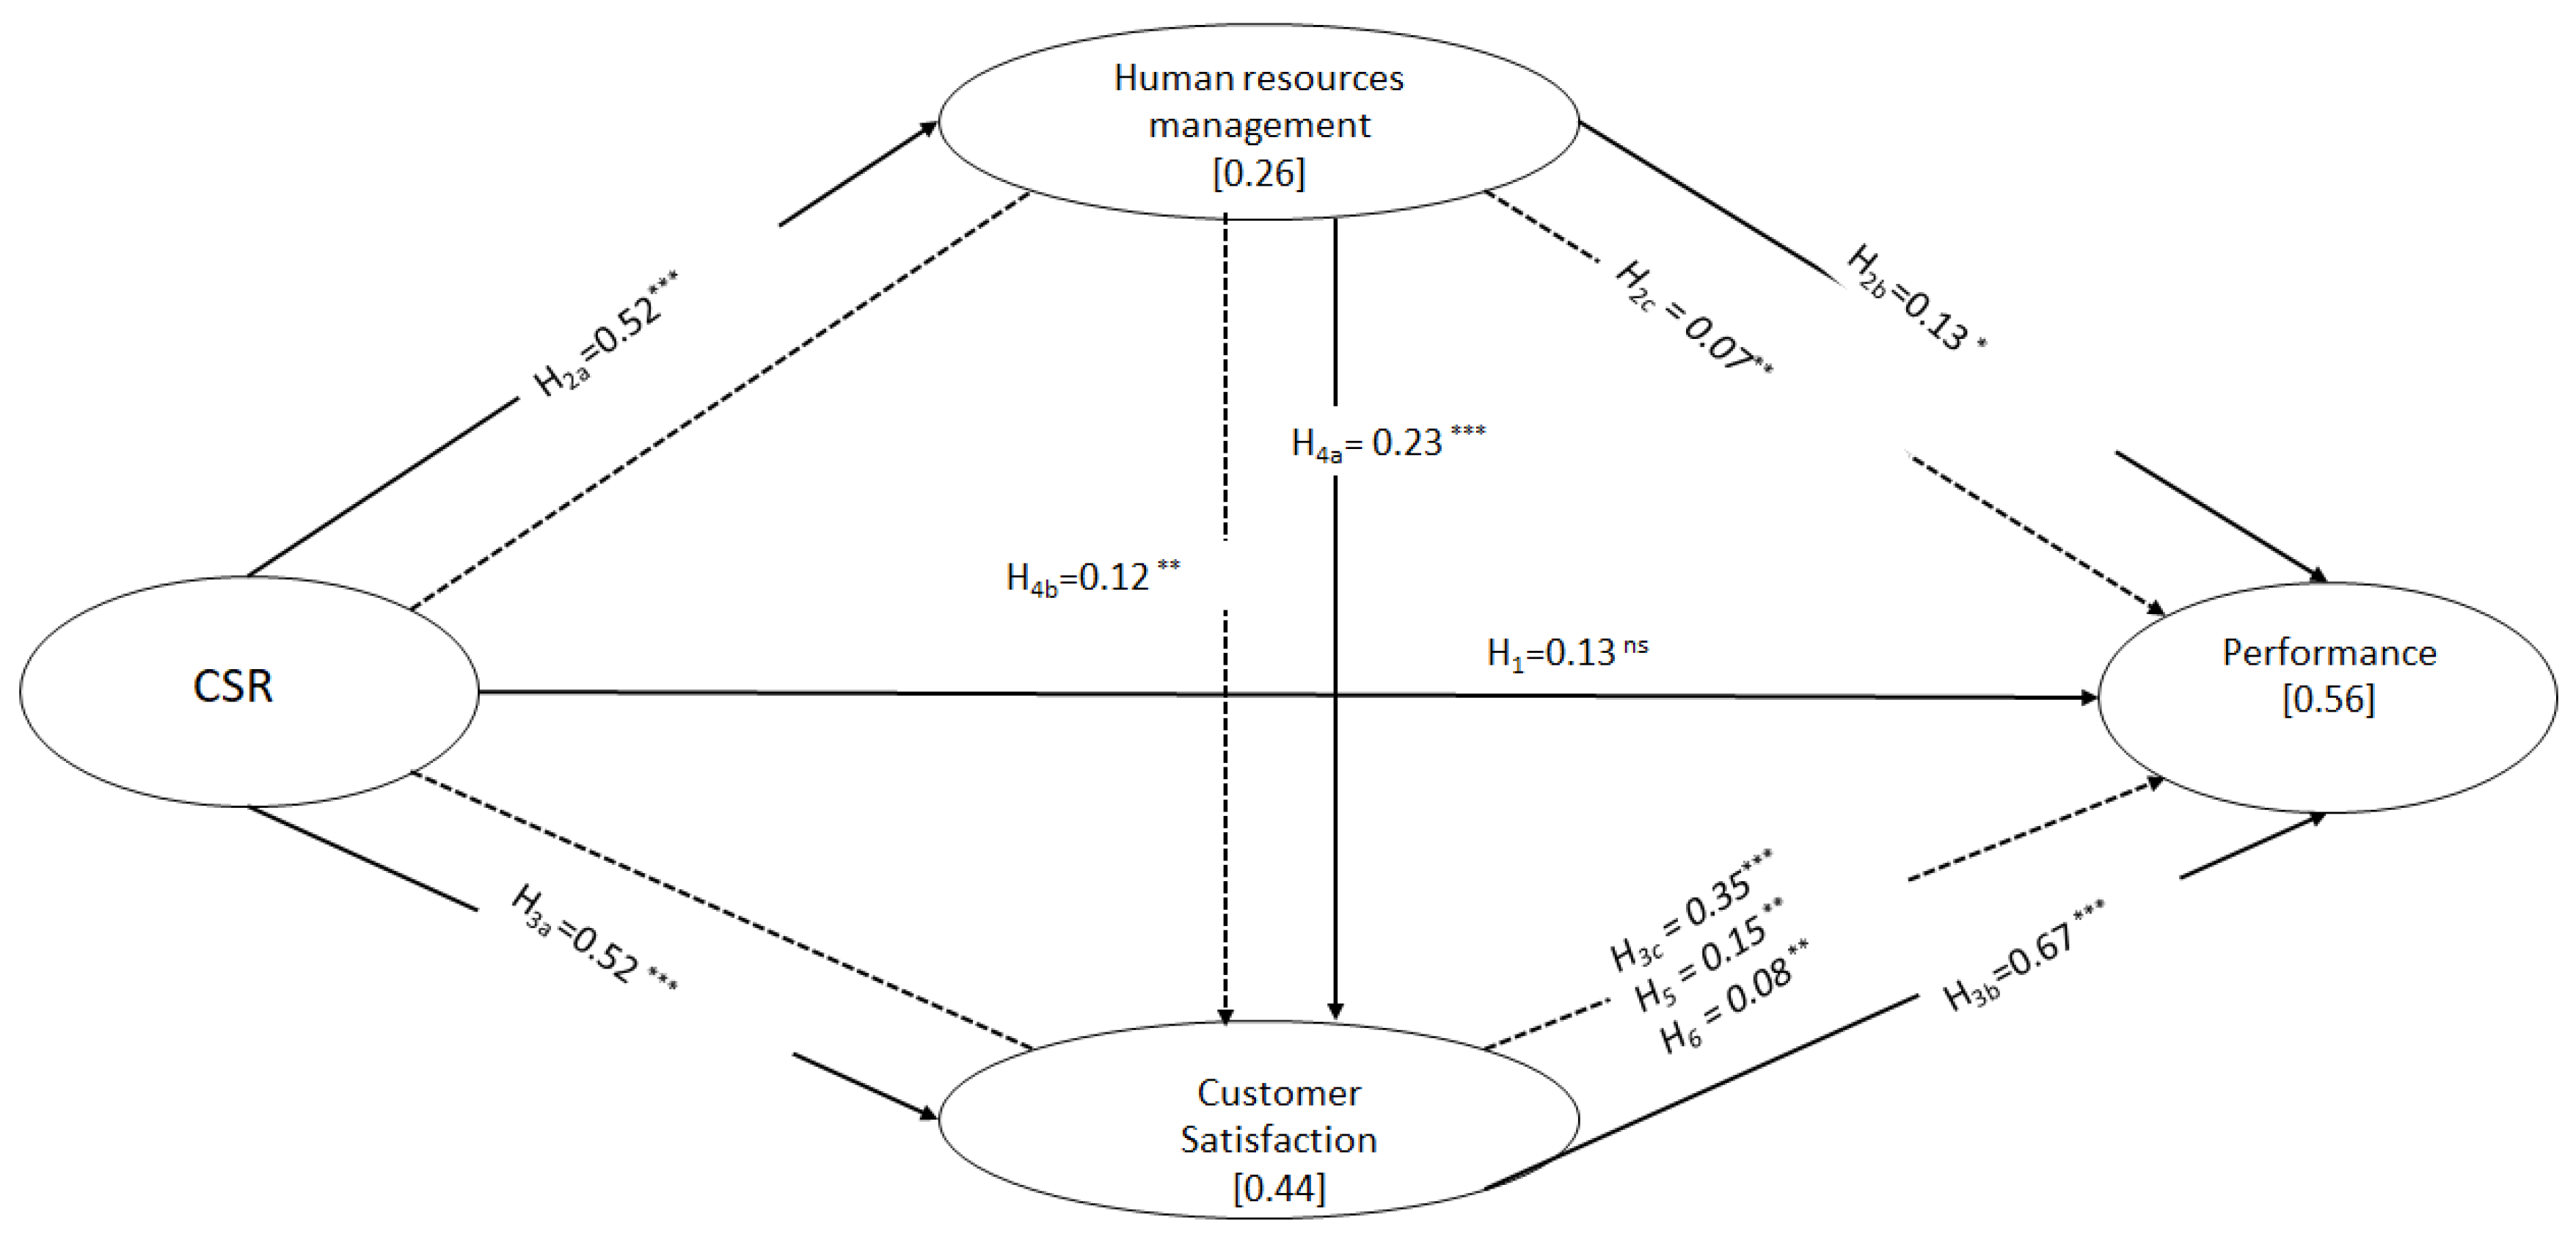
Our study has found indications that CSR actions induce a positive influence on human resource management due to the generation of synergies and greater cohesion among employees [25], which allows companies to achieve their objectives more efficiently [27] and therefore improve their performance by observing the influence of human resources management on performance.
Similarly, a positive relationship has been observed between CSR and customer satisfaction as a consequence of increased customer loyalty and satisfaction through CSR practices. This is in line with previously published results [23]. This increase in customer satisfaction also provides companies with an important competitive advantage that influences performance.
On this basis, it has been possible to intuit an indirect influence of CSR on the performance of companies since, through increased customer satisfaction and appropriate human resources management, companies obtain a series of competitive advantages that allow them to increase their performance.
It is also interesting to note that the results obtained show us that human resource management directly and positively affects customer satisfaction. Through proper human resource management, it is possible to create a team with higher skills and capabilities [45], which impacts the service provided to customers and, therefore, improves their satisfaction [24]. Thus, it has been shown to achieve higher customer satisfaction by influencing human resource practices, as already stated [57].
Finally, an important finding of this research has been the observation of a sequential mediation of HRM and customer satisfaction in the relationship between CSR and performance. When companies carry out CSR practices aimed at satisfying the conditions of their employees, this has an impact on customer care by increasing customer loyalty and satisfaction, which enables companies to increase their performance.
With these results, this paper contributes to filling a gap related to the indirect effect of CSR through human resources management and customer satisfaction on performance.
Through a sample of 166 Spanish SMEs in the food and beverage manufacturing sector and using PLS-SEM, this research has focused on analyzing the effect of CSR practices on the performance of these companies. In addition, the mediating effect of human resource management and customer satisfaction on this relationship has been analyzed, which is a step further in relation to previous research.
The literature is divided on the effect of CSR practices on performance [5,6]. This paper contributes to evidence demonstrating no significant effect. However, when CSR is oriented towards customer and employee satisfaction, CSR practices have a significant indirect effect on firm performance and such strategies do allow firms to increase their chances of survival in the current uncertain environment.
From a theoretical point of view, this paper contributes to shedding light on the effect of CSR on the financial and non-financial performance of companies, integrating the role that human resource management and customer satisfaction play in this relationship, demonstrating that it can allow companies to obtain interesting competitive advantages, which is crucial for their growth. This is justified because the relationship between CSR and performance is fully mediated and the mediation is total (we have no evidence of direct relationship). Moreover, the VAF of the mediation is 97.83%, well above the acceptance threshold.
This research also has important implications for managers of SMEs in this sector and policymakers. From a practical point of view, it has shown how CSR practices aimed at improving customer and employee satisfaction not only contribute to creating a better society but also enable companies to improve their performance. In line with Yáñez-Araque et al. [113], the results obtained in this research show how, for these companies, the benefits of implementing CSR practices outweigh the costs, thereby increasing the profit obtained by companies. This should serve to encourage company managers to develop a CSR strategy that will bring them interesting competitive advantages. Regarding public policies, these results show how the establishment of awareness-raising campaigns and aid aimed at encouraging SMEs to develop CSR practices would produce significant benefits, both for society as a whole and these companies.
This article is not without limitations, which serve to establish future lines of research. This article is based on results obtained from a sample of Spanish companies only. For this reason, these results may not be extrapolated to other regions, as CSR depends on aspects such as culture, ethics, legislation, and the economic environment [114]. Therefore, future studies could use a larger sample size covering other regions. Likewise, this article has only used cross-sectional information, so these could change over time. For this reason, it would be interesting for future research to use longitudinal data in order to assess possible changes over time.

Author Contributions

Conceptualization, J.M.S.-J. and F.G.-A.; methodology, J.M.S.-J. and M.P.-M.; software, J.M.S.-J. and H.H.G.-S.; validation, J.M.S.-J., M.P.-M. and F.G.-A.; formal analysis, M.P.-M. and J.M.S.-J.; investigation, F.G.-A. and J.M.S.-J.; resources, M.P.-M. and H.H.G.-S.; data curation, J.M.S.-J. and F.G.-A.; writing-original draft preparation, J.M.S.-J. and F.G.-A.; writing-review and editing, M.P.-M. and H.H.G.-S.; visualization, M.P.-M.; supervision, J.M.S.-J.; project administration, H.H.G.-S.; funding acquisition, F.G.-A. All authors have read and agreed to the published version of the manuscript.

Funding

This research received no external funding.

Institutional Review Board Statement

Not applicable.

Informed Consent Statement

Not applicable.

Data Availability Statement

Not applicable.

Acknowledgments

This study has been supported by FAEDPYME (Fundación para el análisis económico de la Pyme).

Conflicts of Interest

The authors declare no conflict of interest.

Appendix A

Table A1. Survey questions used in the research.
CSR
Regarding the CSR in your company, assess your level of conformity, from 1(absolutely disagree) to 5 (absolutely agree), with the following statements
CSR.1Is broadly understood by management and implemented in company.
CSR.2Refers to achieve social and economic values.
CSR.3The company performs its activities spending less energy and other resources.
CSR.4The company implements effective recycling measures.
CSR.5In recent years, transparency towards customers and suppliers has improved.
Employee Satisfaction
Thinking of your employees as a whole, please indicate your level of agreement with the following statements: “In the last 2 years, the company…, from 1 (absolutely disagree) to 5 (absolutely agree)”
EMP.1Has assessed performance and given feedback on time.
EMP.2Has ensured equal treatment in salaries.
EMP.3Has allowed incentives based on results achieved.
EMP.4Has improved career development.
EMP.5Has provided opportunities to be involved in decision making.
EMP.6Has applied accurately the requirements for each position in the recruitments.
EMP.7Has invested enough time and money in training.
EMP.8Has allowed successive training programmes.
Customer satisfaction
Indicate your degree of agreement with the following statements: “In the last 2 years, the company……. from 1(absolutely disagree) to 5 (absolutely agree)”
CUS.1The company has improved its corporate identity and reputation in the last years.
CUS.2The quality of products and services has increased in the last years.
CUS.3The company has enhanced the customer satisfaction in the last years.
Performance
Indicate your degree of conformity with the following performance indicators of your company, from 1 (absolutely disagree) to 5 (absolutely agree)
PERF.1The company adapts earlier to changes in the market than competitors.
PERF.2The company is growing more than competitors
PERF.3The company is more profitable than competitors
Note: The research questions and their results were drawn from a broader study of companies in all sectors and in order to analyze many other variables. Only those that have been used in the research are reported here.
Table A2. Correlation matrix.
123456789101112131415161718
CSR011
CSR020.698 **1
CSR030.480 **0.547 **1
CSR040.330 **0.487 **0.598 **1
CSR050.437 **0.529 **0.541 **0.522 **1
HRM010.235 **0.203 **0.1270.208 **0.300 **1
HRM020.253 **0.281 **0.187 *0.259 **0.261 **0.398 **1
HRM030.172 *0.252 **0.267 **0.294 **0.298 **0.385 **0.424 **1
HRM040.251 **0.314 **0.237 **0.289 **0.412 **0.529 **0.458 **0.569 **1
HRM050.335 **0.405 **0.372 **0.336 **0.374 **0.565 **0.452 **0.658 **0.572 **1
HRM060.295 **0.333 **0.332 **0.314 **0.253 **0.353 **0.379 **0.518 **0.495 **0.629 **1
HRM070.226 **0.278 **0.282 **0.321 **0.441 **0.530 **0.365 **0.560 **0.484 **0.598 **0.898 **1
CUS010.331 **0.358 **0.247 **0.260 **0.218 **0.269 **0.263 **0.298 **0.367 **0.480 **0.465 **0.223 **1
CUS020.235 **0.272 **0.361 **0.173 *0.330 **0.242 **0.275 **0.233 **0.286 **0.282 **0.227 **0.154 *.705 **1
CUS030.208 **0.322 **0.327 **0.175 *0.392 **0.207 **0.285 **0.231 **0.326 **0.303 **0.313 **0.251 **.687 **0.596 **1
PERF010.359 **0.333 **0.392 **0.365 **0.266 **0.252 **0.272 **0.385 **0.277 **0.362 **0.412 **0.392 **.508 **0.548 **0.406 **1
PERF020.320 **0.307 **0.402 **0.280 **0.428 **0.214 **0.292 **0.332 **0.323 **0.381 **0.377 **0.311 **0.471 **0.540 **0.596 **0.723 **1
PERF030.292 **0.302 **0.344 **0.1380.243 **0.197 *0.269 **0.320 **0.254 **0.398 **0.318 **0.291 **0.449 **0.542 **0.597 **0.605 **0.790 **1
** p < 0.01; * p < 0.05.

References

  1. Story, J.; Neves, P. When corporate social responsibility (CSR) increases performance: Exploring the role of intrinsic and extrinsic CSR attribution. Bus. Ethics A Eur. Rev. 2015, 24, 111–124. [Google Scholar] [CrossRef]
  2. Surroca, J.; Tribó, J.A.; Waddock, S. Corporate responsibility and financial performance: The role of intangible resources. Strateg. Manag. J. 2010, 31, 463–490. [Google Scholar] [CrossRef]
  3. Latif, K.F.; Sajjad, A. Measuring corporate social responsibility: A critical review of survey instruments. Corp. Soc. Responsib. Environ. Manag. 2018, 25, 1174–1197. [Google Scholar] [CrossRef]
  4. Martinez-Conesa, I.; Soto-Acosta, P.; Palacios-Manzano, M. Corporate social responsibility and its effect on innovation and firm performance: An empirical research in SMEs. J. Clean. Prod. 2017, 142, 2374–2383. [Google Scholar] [CrossRef]
  5. Tang, Z.; Hull, C.E.; Rothenberg, S. How Corporate Social Responsibility Engagement Strategy Moderates the CSR-Financial Performance Relationship. J. Manag. Stud. 2012, 49, 1274–1303. [Google Scholar] [CrossRef]
  6. Bahta, D.; Yun, J.; Islam, M.R.; Bikanyi, K.J. How does CSR enhance the financial performance of SMEs? The mediating role of firm reputation. Econ. Res.-Ekon. Istraživanja 2020, 34, 1428–1451. [Google Scholar] [CrossRef]
  7. Freeman, R.E. Stakeholder theory. In Wiley Encyclopedia of Management, 12: Strategic Management; John Wiley & Sons: Hoboken, NJ, USA, 2015; pp. 1–6. [Google Scholar]
  8. Parmar, B.L.; Freeman, R.E.; Harrison, J.S.; Wicks, A.C.; Purnell, L.; De Colle, S. Stakeholder theory: The state of the art. Acad. Manag. Ann. 2010, 4, 403–445. [Google Scholar] [CrossRef]
  9. Jamali, D. A stakeholder approach to corporate social responsibility: A fresh perspective into theory and practice. J. Bus. Ethics 2008, 82, 213–231. [Google Scholar] [CrossRef]
  10. Torugsa, N.A.; O’Donohue, W.; Hecker, R. Capabilities, proactive CSR and financial performance in SMEs: Empirical evidence from an Australian manufacturing industry sector. J. Bus. Ethics 2012, 109, 483–500. [Google Scholar] [CrossRef] [Green Version]
  11. Campbell, J.L. Why would corporations behave in socially responsible ways? An institutional theory of corporate social responsibility. Acad. Manag. Rev. 2007, 32, 946–967. [Google Scholar] [CrossRef]
  12. Hao, X.; Tong, Y.; Hu, C. A Study on the Impact of Corporate Social Performance on Corporate Financial Performance: From a View of Social Capital. Sci. Sci. Manag. S. T 2011, 10. [Google Scholar]
  13. Liping, Z.; Yan, C.; Yujian, J. An empirical study on the relationship between corporate social responsibility and financial performance—Based on the analysis and interpretation based on the perspective of corporate reputation. Jiangsu Soc. Sci. 2016, 3, 95–102. [Google Scholar]
  14. Oeyono, J.; Samy, M.; Bampton, R. An examination of corporate social responsibility and financial performance: A study of the top 50 Indonesian listed corporations. J. Glob. Responsib. 2011, 2, 100–112. [Google Scholar] [CrossRef]
  15. Tian, H. The correlation between CSR and corporate performance-cased on the empirical data in China’s telecommunication industry. Econ. Manag. 2009, 31, 72–79. [Google Scholar]
  16. Wagner, M.; Van Phu, N.; Azomahou, T.; Wehrmeyer, W. The relationship between the environmental and economic performance of firms: An empirical analysis of the European paper industry. Corp. Soc. Responsib. Environ. Manag. 2002, 9, 133–146. [Google Scholar] [CrossRef]
  17. Margolis, J.D.; Walsh, J.P. Misery loves companies: Rethinking social initiatives by business. Adm. Sci. Q. 2003, 48, 268–305. [Google Scholar] [CrossRef] [Green Version]
  18. Mahmood, F.; Qadeer, F.; Saleem, M.; Han, H.; Ariza-Montes, A. Corporate social responsibility and firms’ financial performance: A multi-level serial analysis underpinning social identity theory. Econ. Res.-Ekon. Istraživanja 2021, 12, 1–39. [Google Scholar] [CrossRef]
  19. Islam, T.; Islam, R.; Pitafi, A.H.; Xiaobei, L.; Rehmani, M.; Irfan, M.; Mubarak, M.S. The impact of corporate social responsibility on customer loyalty: The mediating role of corporate reputation, customer satisfaction, and trust. Sustain. Prod. Consum. 2021, 25, 123–135. [Google Scholar] [CrossRef]
  20. Kramer, M.R.; Porter, M. Creating Shared Value; January–February 2011 Harvard Business Review; Harvard Business Publishing: Brighton, MA, USA, 2011; Volume 17. [Google Scholar]
  21. Wang, Y.; Xu, S.; Wang, Y. The consequences of employees’ perceived corporate social responsibility: A meta-analysis. Bus. Ethics A Eur. Rev. 2020, 29, 471–496. [Google Scholar] [CrossRef]
  22. Flammer, C. Does corporate social responsibility lead to superior financial performance? A regression discontinuity approach. Manag. Sci. 2015, 61, 2549–2568. [Google Scholar] [CrossRef] [Green Version]
  23. Chung, K.-H.; Yu, J.-E.; Choi, M.-G.; Shin, J.-I. The effects of CSR on customer satisfaction and loyalty in China: The moderating role of corporate image. J. Econ. Bus. Manag. 2015, 3, 542–547. [Google Scholar] [CrossRef] [Green Version]
  24. Cantarello, S.; Filippini, R.; Nosella, A. Linking human resource management practices and customer satisfaction on product quality. Int. J. Hum. Resour. Manag. 2012, 23, 3906–3924. [Google Scholar] [CrossRef]
  25. Chang, W.A.; Huang, T.C. Relationship between strategic human resource management and firm performance: A contingency perspective. Int. J. Manpow. 2005, 26, 434–449. [Google Scholar] [CrossRef]
  26. Cheema, S.; Afsar, B.; Javed, F. Employees’ corporate social responsibility perceptions and organizational citizenship behaviors for the environment: The mediating roles of organizational identification and environmental orientation fit. Corp. Soc. Responsib. Environ. Manag. 2020, 27, 9–21. [Google Scholar] [CrossRef]
  27. Santana, M.; Morales-Sánchez, R.; Pasamar, S. Mapping the link between corporate social responsibility (CSR) and human resource management (HRM): How is this relationship measured? Sustainability 2020, 12, 1678. [Google Scholar] [CrossRef] [Green Version]
  28. Shen, J.; Benson, J. When CSR is a social norm: How socially responsible human resource management affects employee work behavior. J. Manag. 2016, 42, 1723–1746. [Google Scholar] [CrossRef]
  29. Wang, C.-C. Corporate social responsibility on customer behaviour: The mediating role of corporate image and customer satisfaction. Total Qual. Manag. Bus. Excell. 2020, 31, 742–760. [Google Scholar] [CrossRef]
  30. Luo, X.; Bhattacharya, C.B. Corporate social responsibility, customer satisfaction, and market value. J. Mark. 2006, 70, 1–18. [Google Scholar] [CrossRef]
  31. Saeidi, S.P.; Sofian, S.; Saeidi, P.; Saeidi, S.P.; Saaeidi, S.A. How does corporate social responsibility contribute to firm financial performance? The mediating role of competitive advantage, reputation, and customer satisfaction. J. Bus. Res. 2015, 68, 341–350. [Google Scholar] [CrossRef]
  32. Zhang, Q.; Cao, M.; Zhang, F.; Liu, J.; Li, X. Effects of corporate social responsibility on customer satisfaction and organizational attractiveness: A signaling perspective. Bus. Ethics A Eur. Rev. 2020, 29, 20–34. [Google Scholar] [CrossRef]
  33. Hair, J.F.; Sarstedt, M. Factors versus Composites: Guidelines for Choosing the Right Structural Equation Modeling Method. Proj. Manag. J. 2019, 50, 619–624. [Google Scholar] [CrossRef]
  34. Segarra-Moliner, J.R.; Moliner-Tena, M.Á. Customer equity and CLV in Spanish telecommunication services. J. Bus. Res. 2016, 69, 4694–4705. [Google Scholar] [CrossRef]
  35. Hannah, S.T.; Sayari, N.; Harris, F.H.d.B.; Cain, C.L. The Direct and Moderating Effects of Endogenous Corporate Social Responsibility on Firm Valuation: Theoretical and Empirical Evidence from the Global Financial Crisis. J. Manag. Stud. 2021, 58, 421–456. [Google Scholar] [CrossRef]
  36. Freeman, R.E. Strategic Management: A Stakeholder Approach; Cambridge University Press: Cambridge, UK, 1984; ISBN 9780521151740. [Google Scholar]
  37. Freeman, R.E. The politics of stakeholder theory: Some future directions. Bus. Ethics Q. 1994, 4, 409–421. [Google Scholar] [CrossRef]
  38. Roberts, R.W. Determinants of corporate social responsibility disclosure: An application of stakeholder theory. Account. Organ. Soc. 1992, 17, 595–612. [Google Scholar] [CrossRef] [Green Version]
  39. Yang, W.; Yang, S. An empirical study on the relationship between corporate social responsibility and financial performance under the Chinese context-based on the contrastive analysis of large, small and medium-size listed companies. Chin. J. Manag. Sci. 2016, 24, 143–150. [Google Scholar]
  40. Barney, J. Firm resources and sustained competitive advantage. J. Manag. 1991, 17, 99–120. [Google Scholar] [CrossRef]
  41. Sun, W.; Price, J.M. The impact of environmental uncertainty on increasing customer satisfaction through corporate social responsibility. Eur. J. Mark. 2016, 50, 1209–1238. [Google Scholar] [CrossRef]
  42. Stavrou, E.T.; Brewster, C.; Charalambous, C. Human resource management and firm performance in Europe through the lens of business systems: Best fit, best practice or both? Int. J. Hum. Resour. Manag. 2010, 21, 933–962. [Google Scholar] [CrossRef]
  43. Cho, S.J.; Chung, C.Y.; Young, J. Study on the Relationship between CSR and Financial Performance. Sustainability 2019, 11, 343. [Google Scholar] [CrossRef] [Green Version]
  44. Matten, D.; Moon, J. “Implicit” and “explicit” CSR: A conceptual framework for a comparative understanding of corporate social responsibility. Acad. Manag. Rev. 2008, 33, 404–424. [Google Scholar] [CrossRef] [Green Version]
  45. Zehir, C.; Gurol, Y.; Karaboga, T.; Kole, M. Strategic human resource management and firm performance: The mediating role of entrepreneurial orientation. Procedia-Soc. Behav. Sci. 2016, 235, 372–381. [Google Scholar] [CrossRef]
  46. Sánchez, A.A.; Marín, G.S.; Morales, A.M. The mediating effect of strategic human resource practices on knowledge management and firm performance. Rev. Eur. Dir. Econ. Empresa 2015, 24, 138–148. [Google Scholar] [CrossRef] [Green Version]
  47. Xie, X.; Jia, Y.; Meng, X.; Li, C. Corporate social responsibility, customer satisfaction, and financial performance: The moderating effect of the institutional environment in two transition economies. J. Clean. Prod. 2017, 150, 26–39. [Google Scholar] [CrossRef]
  48. Sharma, N. An Examination of Customer Relationship Value in High vs. Low Technology Industries. Acad. Mark. Stud. J. 2020, 24, 1–24. [Google Scholar]
  49. Høgevold, N.M.; Svensson, G.; Otero-Neira, C. Validating action and social alignment constituents of collaboration in business relationships: A sales perspective. Mark. Intell. Plan. 2019, 37, 721–740. [Google Scholar] [CrossRef]
  50. Mpinganjira, M.; Roberts-Lombard, M.; Svensson, G. Validating the relationship between trust, commitment, economic and non-economic satisfaction in South African buyer-supplier relationships. J. Bus. Ind. Mark. 2017, 32, 421–431. [Google Scholar] [CrossRef]
  51. Gandhi, S.K.; Sachdeva, A.; Gupta, A. Impact of service quality on satisfaction and loyalty at manufacturer-distributor dyad: Insights from Indian SMEs. J. Adv. Manag. Res. 2019, 16, 91–122. [Google Scholar] [CrossRef]
  52. Ferro, C.; Padin, C.; Svensson, G.; Payan, J. Trust and commitment as mediators between economic and non-economic satisfaction in manufacturer-supplier relationships. J. Bus. Ind. Mark. 2016, 31, 13–23. [Google Scholar] [CrossRef]
  53. Geyskens, I.; Steenkamp, J.-B.E.M.; Kumar, N. A meta-analysis of satisfaction in marketing channel relationships. J. Mark. Res. 1999, 36, 223–238. [Google Scholar] [CrossRef]
  54. Johnston, W.J.; Le, A.N.H.; Cheng, J.M.-S. A meta-analytic review of influence strategies in marketing channel relationships. J. Acad. Mark. Sci. 2018, 46, 674–702. [Google Scholar] [CrossRef]
  55. Geyskens, I.; Steenkamp, J.-B.E.M. Economic and social satisfaction: Measurement and relevance to marketing channel relationships. J. Retail. 2000, 76, 11–32. [Google Scholar] [CrossRef]
  56. Chuang, C.; Liao, H.U.I. Strategic human resource management in service context: Taking care of business by taking care of employees and customers. Pers. Psychol. 2010, 63, 153–196. [Google Scholar] [CrossRef]
  57. Chand, M. The impact of HRM practices on service quality, customer satisfaction and performance in the Indian hotel industry. Int. J. Hum. Resour. Manag. 2010, 21, 551–566. [Google Scholar] [CrossRef]
  58. Phillips, S.; Thai, V.V.; Halim, Z. Airline Value Chain Capabilities and CSR Performance: The Connection Between CSR Leadership and CSR Culture with CSR Performance, Customer Satisfaction and Financial Performance. Asian J. Shipp. Logist. 2019, 35, 30–40. [Google Scholar] [CrossRef]
  59. Jamali, D.R.; El Dirani, A.M.; Harwood, I.A. Exploring human resource management roles in corporate social responsibility: The CSR-HRM co-creation model. Bus. Ethics A Eur. Rev. 2015, 24, 125–143. [Google Scholar] [CrossRef]
  60. Porter, M.E.; Kramer, M.R. Creating shared value: How to reinvent capitalism—And unleash a wave of innovation and growth. Harv. Bus. Rev. 2011, 89, 62–77. [Google Scholar]
  61. Fisher, R.J. Social desirability bias and the validity of indirect questioning. J. Consum. Res. 1993, 20, 303–315. [Google Scholar] [CrossRef]
  62. Cohen, J. Statistical Power Analysis for the Behavioral Sciences, 2nd ed.; Routledge: London, UK, 1988. [Google Scholar]
  63. Podsakoff, P.M.; MacKenzie, S.B.; Lee, J.-Y.; Podsakoff, N.P. Common method biases in behavioral research: A critical review of the literature and recommended remedies. J. Appl. Psychol. 2003, 88, 879. [Google Scholar] [CrossRef]
  64. Galbreath, J.; Shum, P. Do customer satisfaction and reputation mediate the CSR–FP link? Evidence from Australia. Aust. J. Manag. 2012, 37, 211–229. [Google Scholar] [CrossRef]
  65. Adinata, G. CSR Expenditures, Financial Distress Prediction, and Firm Reputation: A Pathway Analysis. Perspekt. Akunt. 2019, 2, 1–18. [Google Scholar] [CrossRef]
  66. Agyemang, O.S.; Ansong, A. Corporate social responsibility and firm performance of Ghanaian SMEs. J. Glob. Responsib. 2017. [Google Scholar] [CrossRef]
  67. Caro, N.; Salazar, I. La responsabilidad social y la competitividad de las MYPES de Tingo María. Balance’s 2019, 6, 4–12. [Google Scholar]
  68. Esparza Aguilar, J.L.; Reyes Fong, T. Practices of corporate social responsability developed by mexican family businesses and their impact on competitive success and innovation. Tec Empres. 2019, 13, 45–57. [Google Scholar]
  69. Ikram, M.; Sroufe, R.; Mohsin, M.; Solangi, Y.A.; Shah, S.Z.A.; Shahzad, F. Does CSR influence firm performance? A longitudinal study of SME sectors of Pakistan. J. Glob. Responsib. 2019, 11, 27–53. [Google Scholar] [CrossRef]
  70. Liman, L.; Tarigan, J.; Jie, F. Corporate Social Responsibility, Financial Performance, and Risk in Indonesian Natural Resources Industry. Soc. Responsib. J. 2019, 16, 73–90. [Google Scholar]
  71. Santos-Jaén, J.M.; Madrid-Guijarro, A.; García-Pérez-de-Lema, D. The impact of corporate social responsibility on innovation in small and medium-sized enterprises: The mediating role of debt terms and human capital. Corp. Soc. Responsib. Environ. Manag. 2021, 28, 1200–1215. [Google Scholar] [CrossRef]
  72. Ozutku, H.; Ozturkler, H. The determinants of human resource practices: An empirical investigation in the Turkish manufacturing industry. Ege Acad. Rev. 2009, 9, 73–93. [Google Scholar]
  73. Ngwenya, L.; Aigbavboa, C. Improvement of productivity and employee performance through an efficient human resource management practices. In Advances in Human Factors, Business Management, Training and Education; Springer: Berlin/Heidelberg, Germany, 2017; pp. 727–737. [Google Scholar]
  74. Bombiak, E.; Marciniuk-Kluska, A. Socially responsible human resource management as a concept of fostering sustainable organization-building: Experiences of young polish companies. Sustainability 2019, 11, 1044. [Google Scholar] [CrossRef] [Green Version]
  75. Wright, P.M.; Gardner, T.M.; Moynihan, L.M.; Allen, M.R. The relationship between HR practices and firm performance: Examining causal order. Pers. Psychol. 2005, 58, 409–446. [Google Scholar] [CrossRef]
  76. Raineri, A. Linking human resources practices with performance: The simultaneous mediation of collective affective commitment and human capital. Int. J. Hum. Resour. Manag. 2017, 28, 3149–3178. [Google Scholar] [CrossRef]
  77. Al-Hawary, S.I.S.; Shdefat, F.A. Impact of Human Resources Management Practices on Employees’ Satisfaction A Field Study on the Rajhi Cement Factory. Int. J. Acad. Res. Account. Financ. Manag. Sci. 2016, 6, 274–286. [Google Scholar]
  78. Ruiz-Palomo, D.; Diéguez-Soto, J.; Duréndez, A.; Santos, J.A.C. Family management and firm performance in family SMEs: The mediating roles of management control systems and technological innovation. Sustainability 2019, 11, 3805. [Google Scholar] [CrossRef] [Green Version]
  79. Ubeda-García, M.; Claver-Cortés, E.; Marco-Lajara, B. Corporate social responsibility and firm performance in the hotel industry. The mediating role of green human resource management and environmental outcomes. J. Bus. Res. 2021, 123, 57–69. [Google Scholar] [CrossRef]
  80. Rigdon, E.E. Choosing PLS path modeling as analytical method in European management research: A realist perspective. Eur. Manag. J. 2016, 34, 598–605. [Google Scholar] [CrossRef]
  81. Henseler, J. Partial least squares path modeling: Quo vadis? Qual. Quant. 2018, 52, 1–8. [Google Scholar] [CrossRef] [Green Version]
  82. Chin, W.W. The Partial Least Squares Approach to Structural Modeling. Mod. Methods Bus. Res. 1998, 295, 295–336. [Google Scholar]
  83. Dijkstra, T.K.; Henseler, J. Linear indices in nonlinear structural equation models: Best fitting proper indices and other composites. Qual. Quant. 2011, 45, 1505–1518. [Google Scholar] [CrossRef]
  84. Tenenhaus, M. Component-based structural equation modelling. Total Qual. Manag. Bus. Excell. 2008, 19, 871–886. [Google Scholar] [CrossRef]
  85. Ringle, C.M.; Wende, S.; Becker, J.-M. SmartPLS 3 2015; SmartPLS GmbH: Boenningstedt, Germany, 2015. [Google Scholar]
  86. Henseler, J.; Dijkstra, T.K.; Sarstedt, M.; Ringle, C.M.; Diamantopoulos, A.; Straub, D.W.; Ketchen, D.J.; Hair, J.F.; Hult, G.T.M.; Calantone, R.J. Common Beliefs and Reality About PLS: Comments on Rönkkö and Evermann (2013). Organ. Res. Methods 2014, 17, 182–209. [Google Scholar] [CrossRef] [Green Version]
  87. Henseler, J.; Schuberth, F. Using confirmatory composite analysis to assess emergent variables in business research. J. Bus. Res. 2020, 120, 147–156. [Google Scholar] [CrossRef]
  88. Hair, J.F.; Hult, G.T.M.; Ringle, C.; Sarstedt, M. A Primer on Partial Least Squares Structural Equation Modeling (PLS-SEM); Sage Publications: Thousand Oaks, CA, USA, 2016; ISBN 1483377431. [Google Scholar]
  89. Felipe, C.M.; Roldán, J.L.; Leal-Rodríguez, A.L. Impact of organizational culture values on organizational agility. Sustainability 2017, 9, 2354. [Google Scholar] [CrossRef] [Green Version]
  90. Hair, J.F.; Howard, M.C.; Nitzl, C. Assessing measurement model quality in PLS-SEM using confirmatory composite analysis. J. Bus. Res. 2020, 109, 101–110. [Google Scholar] [CrossRef]
  91. Fornell, C.; Larcker, D.F. Evaluating structural equation models with unobservable variables and measurement error. J. Mark. Res. 1981, 18, 39–50. [Google Scholar] [CrossRef]
  92. Henseler, J.; Noonan, R. Partial Least Square Path Modeling: Basic Concepts issues and Application. Adv. Methods Model. Mark. Int. Ser. Quant. Mark. 2017, 361–381. [Google Scholar] [CrossRef]
  93. Hu, L.-T.; Bentler, P.M. Fit indices sensitivity to misspecification. Psychol. Methods 1998, 3, 424–453. [Google Scholar] [CrossRef]
  94. Khan, G.F.; Sarstedt, M.; Shiau, W.L.; Hair, J.F.; Ringle, C.M.; Fritze, M.P. Methodological research on partial least squares structural equation modeling (PLS-SEM): An analysis based on social network approaches. Internet Res. 2019, 29, 407–429. [Google Scholar] [CrossRef]
  95. Evermann, J.; Tate, M. Assessing the predictive performance of structural equation model estimators. J. Bus. Res. 2016, 69, 4565–4582. [Google Scholar] [CrossRef]
  96. Kock, N. Common method bias in PLS-SEM: A full collinearity assessment approach. Int. J. e-Collab. 2015, 11, 1–10. [Google Scholar] [CrossRef] [Green Version]
  97. Hair, J.F.; Sarstedt, M.; Ringle, C.M.; Gudergan, S.P. Advanced Issues in Partial Least Squares Structural Equation Modeling; Sage Publications: Los Angeles, CA, USA, 2017; ISBN 1483377385. [Google Scholar]
  98. Falk, R.F.; Miller, N.B. A Primer for Soft Modeling; University of Akron Press: Akron, OH, USA, 1992; ISBN 0962262846. [Google Scholar]
  99. Chin, W.W. How to write up and report PLS analyses. In Handbook of Partial Least Squares; Springer: Berlin/Heidelberg, Germany, 2010; pp. 655–690. [Google Scholar]
  100. Hair, J.F.; Ringle, C.M.; Sarstedt, M. PLS-SEM: Indeed a silver bullet. J. Mark. Theory Pract. 2011, 19, 139–152. [Google Scholar] [CrossRef]
  101. Shmueli, G. To explain or to predict? Stat. Sci. 2010, 25, 289–310. [Google Scholar] [CrossRef]
  102. Straub, D.; Gefen, D. Validation Guidelines for IS Positivist Research. Commun. Assoc. Inf. Syst. 2004, 13, 380–427. [Google Scholar] [CrossRef]
  103. Shmueli, G.; Sarstedt, M.; Hair, J.F.; Cheah, J.H.; Ting, H.; Vaithilingam, S.; Ringle, C.M. Predictive model assessment in PLS-SEM: Guidelines for using PLSpredict. Eur. J. Mark. 2019, 53, 2322–2347. [Google Scholar] [CrossRef]
  104. Park, S.; Gupta, S. Handling endogenous regressors by joint estimation using copulas. Mark. Sci. 2012, 31, 567–586. [Google Scholar] [CrossRef]
  105. García-pérez-de-lema, D.; Ruiz-palomo, D.; Diéguez-soto, J. Analysing the Roles of CEO’ s financial literacy and financial constraints on Spanish SMEs technological innovation. Technol. Soc. 2021, 64, 1–21. [Google Scholar] [CrossRef]
  106. Sarstedt, M.; Ringle, C.M.; Cheah, J.H.; Ting, H.; Moisescu, O.I.; Radomir, L. Structural model robustness checks in PLS-SEM. Tour. Econ. 2020, 26, 531–554. [Google Scholar] [CrossRef]
  107. Hair, J.F.; Astrachan, C.B.; Moisescu, O.I.; Radomir, L.; Sarstedt, M.; Vaithilingam, S.; Ringle, C.M. Executing and interpreting applications of PLS-SEM: Updates for family business researchers. J. Fam. Bus. Strateg. 2021, 12, 100392. [Google Scholar] [CrossRef]
  108. Antonakis, J.; Bendahan, S.; Jacquart, P.; Lalive, R. Causality and endogeneity: Problems and solutions. In The Oxford Handbook of Leadership and Organizations; Oxford University Press: New York, NY, USA, 2014; pp. 93–117. [Google Scholar] [CrossRef]
  109. Huit, G.T.M.; Hair, J.F.; Proksch, D.; Sarstedt, M.; Pinkwart, A.; Ringle, C.M. Addressing endogeneity in international marketing applications of partial least squares structural equation modeling. J. Int. Mark. 2018, 26, 1–21. [Google Scholar] [CrossRef]
  110. Ringle, C.M.; Sarstedt, M.; Mitchell, R.; Gudergan, S.P. Partial least squares structural equation modeling in HRM research. Int. J. Hum. Resour. Manag. 2020, 31, 1617–1643. [Google Scholar] [CrossRef]
  111. Svensson, G.; Ferro, C.; Høgevold, N.; Padin, C.; Carlos Sosa Varela, J.; Sarstedt, M. Framing the triple bottom line approach: Direct and mediation effects between economic, social and environmental elements. J. Clean. Prod. 2018, 197, 972–991. [Google Scholar] [CrossRef]
  112. Ramsey, J.B. Tests for specification errors in classical linear least-squares regression analysis. J. R. Stat. Soc. Ser. B 1969, 31, 350–371. [Google Scholar] [CrossRef]
  113. Yáñez-Araque, B.; Sánchez-Infante Hernández, J.P.; Gutiérrez-Broncano, S.; Jiménez-Estévez, P. Corporate social responsibility in micro-, small- and medium-sized enterprises: Multigroup analysis of family vs. nonfamily firms. J. Bus. Res. 2020, 124, 581–592. [Google Scholar] [CrossRef]
  114. García-Piqueres, G.; García-Ramos, R. Is the corporate social responsibility–innovation link homogeneous?: Looking for sustainable innovation in the Spanish context. Corp. Soc. Responsib. Environ. Manag. 2020, 27, 803–814. [Google Scholar] [CrossRef]
Figure 1. Research model. Note: The path lines in H2c, H3c, H4b, H5 and H6 represent mediation relationships. Source: Authors.
Mathematics 09 02973 g001
Figure 2. Results. *: p < 0.05; **: p < 0.01; ***: p < 0.001; ns: not significant. Source: Authors.
Mathematics 09 02973 g002
Table 1. Sample distribution.
Sector IndustryTotal of CompaniesMicro CompaniesSmall CompaniesMedium Companies
NumberPercent of TotalNumberPercent of TotalNumberPercent of TotalNumberPercent of Total
Food and beverage
manufacturing
166100%6036.1%7243.4%3420.5%
Source: Authors.
Table 2. Outer model results for 18 indicators corresponding to four constructs.
MeanSDLoadingt-Student *QB2αρAρCAVE
CSR 0.8370.8590.8840.604
CSR.13.6631.0090.73112.890
CSR.23.7050.8940.80020.291
CSR.33.7530.9840.81422.210
CSR.43.8491.0220.71812.000
CSR.53.9340.8510.81829.526
Human Resources Management 0.1460.8730.8890.9030.574
HRM.13.2111.1400.5978.0350.079
HRM.23.6571.0100.6369.3450.090
HRM.33.4821.0040.77812.3290.107
HRM.43.4341.0780.77014.0630.154
HRM.53.7830.9060.83130.3530.242
HRM.63.8610.8350.83122.9650.197
HRM.73.8250.9310.82122.5340.155
Customer Satisfaction 0.2590.7310.7350.8470.649
CUS.13.9580.8530.79024.4190.487
CUS.24.1870.7730.80119.6070.130
CUS.34.1200.7100.82520.2380.161
Performance 0.4420.8780.8780.9250.805
PERF.13.9820.8320.87040.6470.467
PERF.23.8860.8880.93369.3310.445
PERF.33.7890.8420.88640.1440.414
Significance and standard deviations (SD) performed by 10,000 repetitions bootstrapping procedure. QB2: cross-validated redundancies index performed by a 9-step distance-blindfolding procedure. α: Chronbach’s alpha; ρA: Dijkstra–Henseler’s composite reliability; ρC: Jöreskog’s composite reliability; AVE: average variance extracted; *: All loadings are significant at the 0.001 level. Source: Authors.
Table 3. Discriminant validity.
IIIIIIIV
ICSR0.7770.5670.5870.576
IIHuman resources management0.5180.7570.6060.534
IIICustomer satisfaction0.6370.4970.8050.849
IVPerformance0.5080.4570.4720.897
HTMT ratio over the diagonal (italics). Fornell–Lacker criterion: square root of AVE in diagonal (bold) and construct correlations below the diagonal. Source: Authors.
Table 4. Structural model and hypotheses testing.
PathSDt-Valuef295CI HSupported
Direct effects VIF
CSR → Performance0.1330.0840.1300.000[−0.132;0.142]1.85H1Yes
CSR → Human resources management0.5180.0667.795 ***0.367[0.412;0.630]1.00H2aYes
Human resources management → Performance0.1330.0662.024 *0.028[0.030;0.247]1.46H2bYes
CSR → Customer satisfaction0.5190.0638.234 ***0.355[0.415;0.621]1.37H3aYes
Customer satisfaction → Performance0.6710.0709.551 ***0.579[0.563;0.793]1.80H3bYes
Human resources management → Customer satisfaction0.2280.0693.297 ***0.068[0.112;0.337]1.37H4aYes
Indirect effects VAF
Individual indirect effects
CSR → Human resources management → Performance0.0690.0361.926 * [0.016–0.133]13.58%H2cYes
CSR → Customer satisfaction → Performance0.3490.0605.518 *** [0.255–0.463]68.70%H3cYes
CSR → Human resources management → Customer satisfaction0.1180.0412.904 ** [0.056–0.189]18.52%H4bYes
Human resources management → Customer satisfaction → Performance0.1530.0483.120 ** [0.037–0.129]53.50%H5Yes
CSR → Human resources management → Customer satisfaction → Performance0.0790.0282.806 ** [0.001–0.016]15.55%H6Yes
Global indirect effects
CSR → Customer satisfaction0.1180.0492.904 ** [0.056–0.189]18.52%
CSR → Performance0.4970.0598.486 *** [0.414–0.605]97.83%
Human resources management → Performance0.0150.0493.12 ** [0.074–0.233]5.35%
Total effect
CSR → Performance0.5080.0578.851 *** [0.414–0.603]
Human resources management → Performance0.2860.0793.641 *** [0.158–0.416]
CSR → Customer satisfaction0.6370.04913.062 *** [0.563–0.793]
R2 adjusted [99% CI in brackets]: Customer satisfaction: 0.437 [0.340; 0.549]; Human resources management: 0.264 [0.164; 0.393]; Performance: 0.560 [0. 496; 0.648]. Blindfolding Q2 index as shown in Table 3; Standardized path values reported. SD: Standard deviation; f2: size effect index; 95CI: 95% Bias Corrected confidence interval; VIF: Inner model variance inflation factors; VAF: Variance Accounted Formula × 100 represents the proportion mediated. Significance, standard deviations, 95% bias-corrected CIs were performed by 10,000 repetitions bootstrapping procedure; *: p < 0.05; **: p < 0.01; ***: p < 0.001. Only total effects that differ from direct effects are shown. Source: Authors.
Table 5. PLS predict assessment.
Construct Prediction Summary
Q2
HUMAN RESOURCES MANAGEMENT0.250
CUSTOMER SATISFACTION0.391
PERFORMANCE0.243
INDICATOR PREDICTION SUMMARY
PLSLMPLS-LM
IndicatorRMSEMAEQ2RMSEMAEQ2RMSEMAEQ2
HRM.11.1030.8950.0711.1240.9010.036−0.021−0.0060.035
HRM.20.9700.7430.0910.9940.7620.047−0.024−0.0190.044
HRM.30.9610.7520.0960.9790.7720.062−0.018−0.0200.034
HRM.41.0000.8050.1471.0060.8070.138−0.006−0.0020.009
HRM.50.7970.6080.2360.8130.6220.206−0.016−0.0140.030
HRM.60.7550.5840.1910.7670.6020.165−0.012−0.0180.026
HRM.70.8610.6490.1550.8640.6550.149−0.003−0.0060.006
CUS.10.6120.4970.4920.4960.3300.6670.1160.167−0.175
CUS.20.7430.5860.0890.7340.5880.1110.009−0.002−0.022
CUS.30.6750.5310.1080.6620.5310.1430.0130.000−0.035
PERF.10.7330.5810.2350.7440.5960.211−0.011−0.0150.024
PERF.20.8020.6400.1950.8150.6610.168−0.013−0.0210.027
PERF.30.7820.6290.1510.7640.6190.1890.0180.010−0.038
PLS: Partial least squares path model; LM: Linear regression model; RMSE: Root mean squared error; MAE: Mean absolute error. Q2: PLS-predict index performed with 10 k-fold and 10 repetitions. Source: Authors.
Table 6. Gaussian Copula Approach.
PathCopula
RelationshipModelβtβt
Perf ← CSR10.6799.69 ***
Perf ← CSR20.6669.42 ***0.0910.34
Cus ← CSR10.2273.33 ***
Cus ← CSR20.2443.62 ***0.7182.46
HRM ← CSR10.5177.76 ***
HRM ← CSR20.8183.37 ***–0.432–1.29
***: p < 0.001.
Table 7. Fit indices for the one to two segments solutions.
Number of Segments
12
AIC1142.7021130.045
AIC31151.7021149.045
AIC41160.7021168.045
BIC1170.711189.173
CAIC1179.711208.173
HQ1154.0711154.045
MDL51354.7411577.684
LnL−562.351−546.022
ENna0.61
NFIna0.637
NECna64.746
Note: AIC: Akaike’s information criterion. AIC3: Modified AIC with factor 3. AIC4: Modified AIC with factor 4. BIC: Bayesian information criteria. CAIC: consistent AIC. HQ: Hannan Quinn criterion. MDL5: Minimum description length with factor 5. LnL: Log likelihood. EN: Entropy statistic. NFI: Non-fuzzy index. NEC: Normalized entropy criterion. na: not available. Numbers in bold indicate the best outcome per segment retention criterion.
Table 8. Nonlinear effects.
Nonlinear RelationshipCoefficientp Valuesf2Ramsey RESET
CSR * CSR → Perf0.0120.4030.480F (3.159) = 1.21p = 0.215
HRM * HRM → Perf0.0650.0580.188
Cus * Cus → Perf0.0620.0980.267
CSR * CSR → Cus0.0650.1380.325F (3.160) = 1.21p = 0.219
HRM * HRM → Cus0.0950.0760.177
*: p < 0.05.
Publisher’s Note: MDPI stays neutral with regard to jurisdictional claims in published maps and institutional affiliations.

