
Red Seaweeds as a Source of Nutrients and Bioactive Compounds: Optimization of the Extraction

 , ,
, ,  , , , ,
  ,
,  , and
, and 
Abstract
: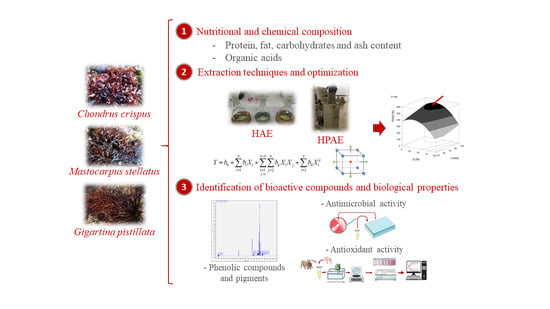
1. Introduction
2. Materials and Methods
2.1. Preparation of the Samples
2.2. Nutritional and Chemical Characterization
2.3. Optimization and Comparison of Extractive Techniques (HAE and HPAE)
2.3.1. Extraction Techniques
Heat Assisted Extraction (HAE)
High Pressure Assisted Extraction (HPAE)
2.3.2. Experimental Design, Analysis Model and Statistic Evaluation
Experimental Design
Maximized Response
Mathematical Model
Procedure to Optimize the Variables to Their Maximum Response
2.4. Bioactive Evaluation
2.4.1. Extract Preparation
2.4.2. Identification and Quantification of Phenolic Compounds
2.4.3. Identification and Quantification of Main Pigments
2.4.4. Evaluation of Antioxidant Activity
2.4.5. Evaluation of Antimicrobial Activity
2.5. Numerical Methods, Statistical Analysis, and Graphic Illustrations
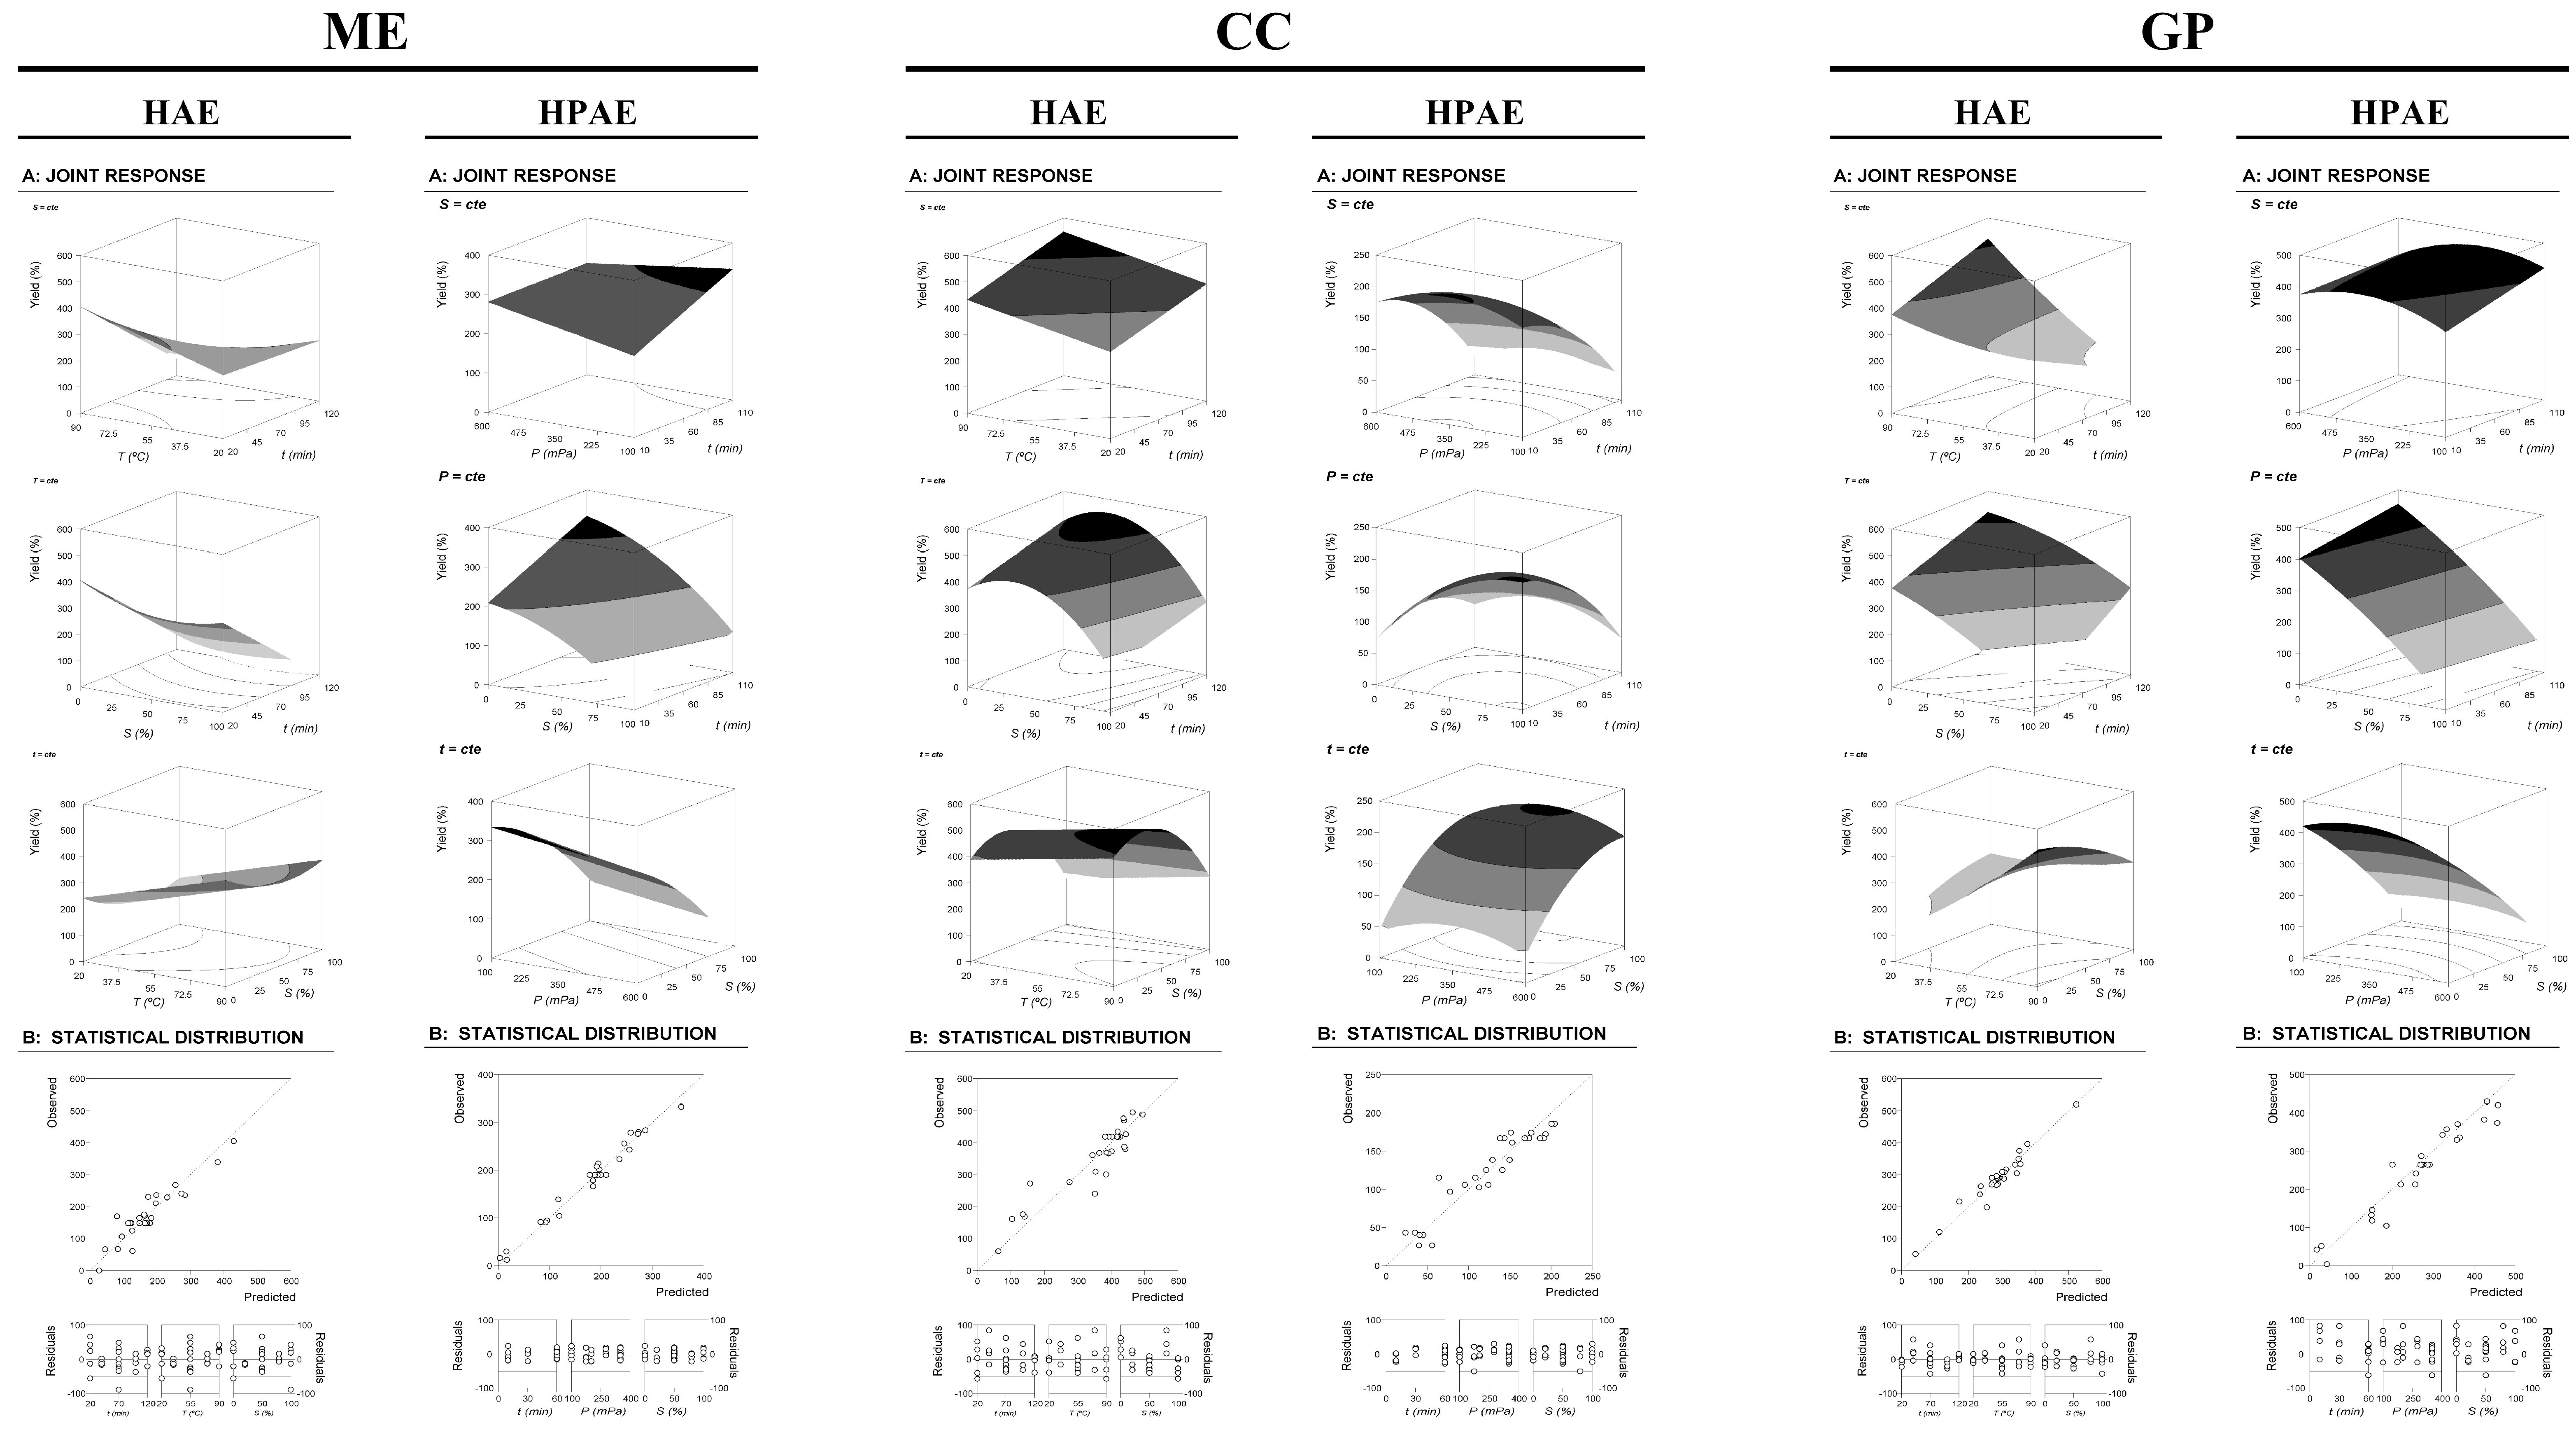
3. Results and Discussion
3.1. Nutritional Characterization and Chemical Composition
3.2. Optimization and Comparison of Extraction Techniques (HAE and HPAE) to Obtain Extracts Rich in Biological Compounds from Red Algae
3.2.1. Selection of Relevant Variables and Instrumental Parameters to Focus Their Experimental Domains before Applying the RSM
3.2.2. Analysis of the Optimization by RSM of the Three Variables
Mathematical Models Derived from the RSM for a CCCD with Three Variables, and Statistical Evaluation
Response Patterns
Individual and Global Numerical Conditions That Maximize Extraction
- (1)
- For HAE: the optimal global conditions were *36.6 min, *88.6 °C and *50.0% of acidified ethanol, producing a response yield of 405.0 ± 12.2 mg/g for ME, 373.2 ± 22.4 mg/g for CC and 375.0 ± 3.8 mg/g for GP.
- (2)
- For HPAE: the optimal global conditions were 49.0 min, 51.9 MPa and 50.0% of acidified ethanol, producing a response yield of 292.2 ± 14.6 mg/g for ME, 94.4 ± 4.7 mg/g for CC and 441.1 ± 4.4 mg/g for GP.
3.3. Bioactive Evaluation
3.3.1. Identification and Quantification of Phenolic Compounds and Fundamental Pigments
3.3.2. Evaluation of Antioxidant Activity
3.3.3. Evaluation of Antimicrobial Activity
4. Conclusions
Author Contributions
Funding
Institutional Review Board Statement
Informed Consent Statement
Data Availability Statement
Conflicts of Interest
References
- Gurgel, C.F.D.; Lopez-Bautista, J. Red Algae. eLS 2007. [Google Scholar] [CrossRef]
- FAO. El Estado Mundial de la Pesca y la Acuicuiltura 2020. La Sostenibilidad en Acción; FAO: Rome, Italy, 2020; ISBN 978-92-5-132756-2. [Google Scholar]
- Sudhakar, K.; Mamat, R.; Samykano, M.; Azmi, W.; Ishak, W.; Yusaf, T. An overview of marine macroalgae as bioresource. Renew. Sustain. Energy Rev. 2018, 91, 165–179. [Google Scholar] [CrossRef]
- Gurpilhares, D.D.B.; Cinelli, L.P.; Simas, N.K.; Pessoa, A., Jr.; Sette, L.D. Marine prebiotics: Polysaccharides and oligosaccharides obtained by using microbial enzymes. Food Chem. 2019, 280, 175–186. [Google Scholar] [CrossRef]
- Cian, R.E.; Drago, S.R.; De Medina, F.S.; Martínez-Augustin, O. Proteins and Carbohydrates from Red Seaweeds: Evidence for Beneficial Effects on Gut Function and Microbiota. Mar. Drugs 2015, 13, 5358–5383. [Google Scholar] [CrossRef] [Green Version]
- Gómez-Ordóñez, E.; Jiménez-Escrig, A.; Rupérez, P. Effect of the red seaweed Mastocarpus stellatus intake on lipid metabolism and antioxidant status in healthy Wistar rats. Food Chem. 2012, 135, 806–811. [Google Scholar] [CrossRef]
- Cardozo, K.H.; Guaratini, T.; Barros, M.; Falcão, V.R.; Tonon, A.P.; Lopes, N.P.; Campos, S.; Torres, M.A.; Souza, A.O.; Colepicolo, P.; et al. Metabolites from algae with economical impact. Comp. Biochem. Physiol. Part C Toxicol. Pharmacol. 2007, 146, 60–78. [Google Scholar] [CrossRef]
- Lalegerie, F.; Lajili, S.; Bedoux, G.; Taupin, L.; Stiger-Pouvreau, V.; Connan, S. Photo-protective compounds in red macroalgae from Brittany: Considerable diversity in mycosporine-like amino acids (MAAs). Mar. Environ. Res. 2019, 147, 37–48. [Google Scholar] [CrossRef] [PubMed] [Green Version]
- Suleria, H.A.R.; Gobe, G.; Masci, P.; Osborne, S.A. Marine bioactive compounds and health promoting perspectives; innovation pathways for drug discovery. Trends Food Sci. Technol. 2016, 50, 44–55. [Google Scholar] [CrossRef]
- Freitas, A.C.; Rodrigues, D.; Rocha-Santos, T.A.; Gomes, A.M.; Duarte, A.C. Marine biotechnology advances towards applications in new functional foods. Biotechnol. Adv. 2012, 30, 1506–1515. [Google Scholar] [CrossRef]
- Holdt, S.L.; Kraan, S. Bioactive compounds in seaweed: Functional food applications and legislation. J. Appl. Phycol. 2011, 23, 543–597. [Google Scholar] [CrossRef]
- Wan, A.H.; Davies, S.J.; Soler-Vila, A.; Fitzgerald, R.; Johnson, M. Macroalgae as a sustainable aquafeed ingredient. Rev. Aquac. 2019, 11, 458–492. [Google Scholar] [CrossRef]
- Belghit, I.; Rasinger, J.D.; Heesch, S.; Biancarosa, I.; Liland, N.; Torstensen, B.; Waagbo, R.; Lock, E.-J.; Bruckner, C.G. In-depth metabolic profiling of marine macroalgae confirms strong biochemical differences between brown, red and green algae. Algal Res. 2017, 26, 240–249. [Google Scholar] [CrossRef]
- Mohamed, S.; Hashim, S.N.; Rahman, H.A. Seaweeds: A sustainable functional food for complementary and alternative therapy. Trends Food Sci. Technol. 2012, 23, 83–96. [Google Scholar] [CrossRef]
- Naylor, J. Production, Trade and Utilization of Seaweeds and Seaweed Products; FAO Fisheries Technical Papers (FAO); Documents Techniques FAO sur les Peches (FAO)-Documentos Tecnicos de la FAO sobre la Pesca (FAO); FAO: Rome, Italy, 1976; ISBN 92-5-100091-3. Available online: http://www.fao.org/3/AC860E/AC860E00.htm (accessed on 12 February 2020).
- Torres, M.D.; Flórez-Fernández, N.; Domínguez, H. Integral Utilization of Red Seaweed for Bioactive Production. Mar. Drugs 2019, 17, 314. [Google Scholar] [CrossRef] [PubMed] [Green Version]
- Øverland, M.; Mydland, L.T.; Skrede, A. Marine macroalgae as sources of protein and bioactive compounds in feed for monogastric animals. J. Sci. Food Agric. 2019, 99, 13–24. [Google Scholar] [CrossRef] [Green Version]
- Leal, M.C.; Munro, M.; Blunt, J.; Puga, J.; Jesus, B.; Calado, R.; Rosa, R.; Madeira, C. Biogeography and biodiscovery hotspots of macroalgal marine natural products. Nat. Prod. Rep. 2013, 30, 1380–1390. [Google Scholar] [CrossRef]
- Rudtanatip, T.; Lynch, S.A.; Wongprasert, K.; Culloty, S.C. Assessment of the effects of sulfated polysaccharides extracted from the red seaweed Irish moss Chondrus crispus on the immune-stimulant activity in mussels Mytilus spp. Fish Shellfish. Immunol. 2018, 75, 284–290. [Google Scholar] [CrossRef]
- Silva, T.H.; Alves, A.; Popa, E.G.; Reys, L.L.; Gomes, M.E.; Sousa, R.A.; Silva, S.S.; Mano, J.F.; Reis, R.L. Marine algae sulfated polysaccharides for tissue engineering and drug delivery approaches. Biomatter 2012, 2, 278–289. [Google Scholar] [CrossRef] [Green Version]
- Qi, H.; Huang, L.; Liu, X.; Liu, D.; Zhang, Q.; Liu, S. Antihyperlipidemic activity of high sulfate content derivative of polysaccharide extracted from Ulva pertusa (Chlorophyta). Carbohydr. Polym. 2012, 87, 1637–1640. [Google Scholar] [CrossRef]
- Tasende, M.G.; Peteiro, C. Explotación de las macroalgas marinas: Galicia como caso de estudio hacia una gestión sostenible de los recursos. Ambienta 2015, 111, 116–132. [Google Scholar]
- Farvin, K.S.; Jacobsen, C. Phenolic compounds and antioxidant activities of selected species of seaweeds from Danish coast. Food Chem. 2013, 138, 1670–1681. [Google Scholar] [CrossRef]
- Gómez-Ordóñez, E.; Jimenez-Escrig, A.; Rupérez, P. Dietary fibre and physicochemical properties of several edible seaweeds from the northwestern Spanish coast. Food Res. Int. 2010, 43, 2289–2294. [Google Scholar] [CrossRef]
- Gómez-Ordóñez, E.; Jiménez-Escrig, A.; Rupérez, P. Bioactivity of sulfated polysaccharides from the edible red seaweed Mastocarpus stellatus. Bioact. Carbohydr. Diet. Fibre 2014, 3, 29–40. [Google Scholar] [CrossRef] [Green Version]
- Pina, A.; Costa, A.; Lage-Yusty, M.; Lopez-Hernandez, J. An evaluation of edible red seaweed (Chondrus crispus) components and their modification during the cooking process. LWT Food Sci. Technol. 2014, 56, 175–180. [Google Scholar] [CrossRef]
- Cotas, J.; Marques, V.; Afonso, M.B.; Rodrigues, C.M.P.; Pereira, L. Antitumour Potential of Gigartina pistillata Carrageenans against Colorectal Cancer Stem Cell-Enriched Tumourspheres. Mar. Drugs 2020, 18, 50. [Google Scholar] [CrossRef] [Green Version]
- Sangha, J.S.; Fan, D.; Banskota, A.H.; Stefanova, R.; Khan, W.; Hafting, J.; Craigie, J.; Critchley, A.T.; Prithiviraj, B. Bioactive components of the edible strain of red alga, Chondrus crispus, enhance oxidative stress tolerance in Caenorhabditis elegans. J. Funct. Foods 2013, 5, 1180–1190. [Google Scholar] [CrossRef]
- Salta, M.; Wharton, J.A.; Dennington, S.P.; Stoodley, P.; Stokes, K.R. Anti-Biofilm Performance of Three Natural Products against Initial Bacterial Attachment. Int. J. Mol. Sci. 2013, 14, 21757–21780. [Google Scholar] [CrossRef] [Green Version]
- Mendes, M.; Pereira, R.; Pinto, I.S.; Carvalho, A.P.; Gomes, A.M. Antimicrobial activity and lipid profile of seaweed extracts from the North Portuguese Coast. Int. Food Res. J. 2013, 20, 3337–3345. [Google Scholar]
- Kulshreshtha, G.; Burlot, A.-S.; Marty, C.; Critchley, A.T.; Hafting, J.; Bedoux, G.; Bourgougnon, N.; Prithiviraj, B. Enzyme-Assisted Extraction of Bioactive Material from Chondrus crispus and Codium fragile and Its Effect on Herpes simplex Virus (HSV-1). Mar. Drugs 2015, 13, 558–580. [Google Scholar] [CrossRef] [Green Version]
- Salces, R.M.A.; Korta, E.; Barranco, A.; Berrueta, L.; Gallo, B.; Vicente, F. Pressurized liquid extraction for the determination of polyphenols in apple. J. Chromatogr. A 2001, 933, 37–43. [Google Scholar] [CrossRef]
- Dai, J.; Mumper, R.J. Plant Phenolics: Extraction, Analysis and Their Antioxidant and Anticancer Properties. Molecules 2010, 15, 7313–7352. [Google Scholar] [CrossRef] [PubMed]
- Ince, A.E.; Şahin, S.; Şümnü, S.G. Extraction of phenolic compounds from melissa using microwave and ultrasound. Turk. J. Agric. For. 2013, 37, 69–75. [Google Scholar]
- Prasad, N.; Yang, E.; Yi, C.; Zhao, M.; Jiang, Y. Effects of high pressure extraction on the extraction yield, total phenolic content and antioxidant activity of longan fruit pericarp. Innov. Food Sci. Emerg. Technol. 2009, 10, 155–159. [Google Scholar] [CrossRef]
- Suwal, S.; Perreault, V.; Marciniak, A.; Tamigneaux, É.; Deslandes, É.; Bazinet, L.; Jacques, H.; Beaulieu, L.; Doyen, A. Effects of high hydrostatic pressure and polysaccharidases on the extraction of antioxidant compounds from red macroalgae, Palmaria palmata and Solieria chordalis. J. Food Eng. 2019, 252, 53–59. [Google Scholar] [CrossRef]
- Xi, J.; Shen, D.; Zhao, S.; Lu, B.; Li, Y.; Zhang, R. Characterization of polyphenols from green tea leaves using a high hydrostatic pressure extraction. Int. J. Pharm. 2009, 382, 139–143. [Google Scholar] [CrossRef] [PubMed]
- AOAC International. Official Methods of Analysis of AOAC International; Association of Official Analytical Chemists: Washington, WA, USA, 1975; ISBN 0935584544. [Google Scholar]
- Barros, L.; Pereira, E.; Calhelha, R.C.; Dueñas, M.; Carvalho, A.M.; Santos-Buelga, C.; Ferreira, I.C. Bioactivity and chemical characterization in hydrophilic and lipophilic compounds of Chenopodium ambrosioides L. J. Funct. Foods 2013, 5, 1732–1740. [Google Scholar] [CrossRef]
- Pinela, J.; Prieto, M.A.; Barros, L.; Carvalho, A.M.; Oliveira, M.B.P.; Saraiva, J.A.; Ferreira, I.C. Cold extraction of phenolic compounds from watercress by high hydrostatic pressure: Process modelling and optimization. Sep. Purif. Technol. 2018, 192, 501–512. [Google Scholar] [CrossRef] [Green Version]
- Heleno, S.A.; Prieto, M.A.; Barros, L.; Rodrigues, A.; Barreiro, M.F.; Ferreira, I.C. Optimization of microwave-assisted extraction of ergosterol from Agaricus bisporus L. by-products using response surface methodology. Food Bioprod. Process. 2016, 100, 25–35. [Google Scholar] [CrossRef] [Green Version]
- Vieira, V.; Prieto, M.A.; Barros, L.; Coutinho, J.; Ferreira, O.; Ferreira, I.C. Optimization and comparison of maceration and microwave extraction systems for the production of phenolic compounds from Juglans regia L. for the valorization of walnut leaves. Ind. Crop. Prod. 2017, 107, 341–352. [Google Scholar] [CrossRef] [Green Version]
- Bessada, S.M.; Barreira, J.C.; Barros, L.; Ferreira, I.C.; Oliveira, M.B.P. Phenolic profile and antioxidant activity of Coleostephus myconis (L.) Rchb.f.: An underexploited and highly disseminated species. Ind. Crop. Prod. 2016, 89, 45–51. [Google Scholar] [CrossRef] [Green Version]
- Lockowandt, L.; Pinela, J.; Roriz, C.L.; Pereira, C.; Abreu, R.M.; Calhelha, R.C.; Alves, M.J.; Barros, L.; Bredol, M.; Ferreira, I.C. Chemical features and bioactivities of cornflower (Centaurea cyanus L.) capitula: The blue flowers and the unexplored non-edible part. Ind. Crop. Prod. 2019, 128, 496–503. [Google Scholar] [CrossRef] [Green Version]
- Soković, M.; Glamočlija, J.; Marin, P.D.; Brkić, D.; Van Griensven, L.J.L.D. Antibacterial Effects of the Essential Oils of Commonly Consumed Medicinal Herbs Using an In Vitro Model. Molecules 2010, 15, 7532–7546. [Google Scholar] [CrossRef] [Green Version]
- Soković, M.; Van Griensven, L.J. Antimicrobial activity of essential oils and their components against the three major pathogens of the cultivated button mushroom, Agaricus bisporus. Eur. J. Plant Pathol. 2006, 116, 211–224. [Google Scholar] [CrossRef]
- Murado, M.; Prieto, M.A. NOEC and LOEC as merely concessive expedients: Two unambiguous alternatives and some criteria to maximize the efficiency of dose–response experimental designs. Sci. Total Environ. 2013, 461–462, 576–586. [Google Scholar] [CrossRef] [Green Version]
- Prieto, M.A.; Vázquez, J.; Murado, M. Crocin bleaching antioxidant assay revisited: Application to microplate to analyse antioxidant and pro-oxidant activities. Food Chem. 2015, 167, 299–310. [Google Scholar] [CrossRef] [Green Version]
- Prieto, M.; Vázquez, J. In vitro determination of the lipophilic and hydrophilic antioxidant capacity of unroasted coffee bean extracts and their synergistic and antagonistic effects. Food Res. Int. 2014, 62, 1183–1196. [Google Scholar] [CrossRef] [Green Version]
- Durán, L. Aditivos naturales. Arbor 2001, 168, 87–107. [Google Scholar] [CrossRef]
- Marsham, S.; Scott, G.; Tobin, M.L. Comparison of nutritive chemistry of a range of temperate seaweeds. Food Chem. 2007, 100, 1331–1336. [Google Scholar] [CrossRef]
- Ruperez, P. Mineral content of edible marine seaweeds. Food Chem. 2002, 79, 23–26. [Google Scholar] [CrossRef]
- Rupérez, P.; Calixto, F.D.S. Dietary fibre and physicochemical properties of edible Spanish seaweeds. Eur. Food Res. Technol. 2001, 212, 349–354. [Google Scholar] [CrossRef]
- Rohani-Ghadikolaei, K.; Abdulalian, E.; Ng, W.-K. Evaluation of the proximate, fatty acid and mineral composition of representative green, brown and red seaweeds from the Persian Gulf of Iran as potential food and feed resources. J. Food Sci. Technol. 2011, 49, 774–780. [Google Scholar] [CrossRef] [Green Version]
- Kaliaperumal, N.; Ramalingam, J.R.; Kalimuthu, S.; Ezhilvalavan, R. Seasonal changes in growth, biochemical constituents and phycocolloid of some marine algae of Mandapam coast. Seaweed Res. Util. 2002, 24, 73–77. [Google Scholar]
- Ohanenye, I.C.; Tsopmo, A.; Ejike, C.E.; Udenigwe, C.C. Germination as a bioprocess for enhancing the quality and nutritional prospects of legume proteins. Trends Food Sci. Technol. 2020, 101, 213–222. [Google Scholar] [CrossRef]
- Praveen, M.A.; Parvathy, K.K.; Balasubramanian, P.; Jayabalan, R. An overview of extraction and purification techniques of seaweed dietary fibers for immunomodulation on gut microbiota. Trends Food Sci. Technol. 2019, 92, 46–64. [Google Scholar] [CrossRef]
- Pereira, L. A review of the nutrient composition of selected edible seaweeds. In Seaweed: Ecology, Nutrient Composition and Medicinal Uses; Pomin, V.H., Ed.; Nova Science Publishers: Hauppauge, NY, USA, 2011; pp. 15–47. ISBN 978-1-61470-878-0. [Google Scholar]
- Ganesan, A.R.; Subramanium, K.; Shanmugam, M.; Seedevi, P.; Park, S.; Alfarhan, A.H.; Rajagopal, R.; Balasubramanian, B. A comparison of nutritional value of underexploited edible seaweeds with recommended dietary allowances. J. King Saud Univ. Sci. 2020, 32, 1206–1211. [Google Scholar] [CrossRef]
- Nunes, N.; Ferraz, S.; Valente, S.; Barreto, M.C.; De Carvalho, M.A.A.P. Biochemical composition, nutritional value, and antioxidant properties of seven seaweed species from the Madeira Archipelago. Environ. Boil. Fishes 2017, 29, 2427–2437. [Google Scholar] [CrossRef]
- Jimenez-Escrig, A.; Gómez-Ordóñez, E.; Rupérez, P. Brown and red seaweeds as potential sources of antioxidant nutraceuticals. Environ. Boil. Fishes 2011, 24, 1123–1132. [Google Scholar] [CrossRef]
- Fleurence, J. Seaweeds as Food; Elsevier: Amsterdam, The Netherlands, 2016; pp. 149–167. [Google Scholar]
- Carocho, M.; Morales, P.; Ferreira, I.C. Antioxidants: Reviewing the chemistry, food applications, legislation and role as preservatives. Trends Food Sci. Technol. 2018, 71, 107–120. [Google Scholar] [CrossRef] [Green Version]
- Rostamzad, H.; Shabanpour, B.; Kashaninejad, M.; Shabani, A. Inhibitory impacts of natural antioxidants (ascorbic and citric acid) and vacuum packaging on lipid oxidation in frozen Persian sturgeon fillets. Iran. J. Fish. Sci. 2010, 9, 279–292. [Google Scholar]
- Frankel, E.N. Antioxidants in lipid foods and their impact on food quality. Food Chem. 1996, 57, 51–55. [Google Scholar] [CrossRef]
- Tanna, B.; Choudhary, B.; Mishra, A. Metabolite profiling, antioxidant, scavenging and anti-proliferative activities of selected tropical green seaweeds reveal the nutraceutical potential of Caulerpa spp. Algal Res. 2018, 36, 96–105. [Google Scholar] [CrossRef]
- Silva, S.; Costa, E.M.; Calhau, C.; Morais, R.M.; Pintado, M.E. Anthocyanin extraction from plant tissues: A review. Crit. Rev. Food Sci. Nutr. 2015, 57, 3072–3083. [Google Scholar] [CrossRef]
- Bosiljkov, T.; Dujmić, F.; Bubalo, M.C.; Hribar, J.; Vidrih, R.; Brnčić, M.; Zlatic, E.; Redovniković, I.R.; Jokić, S. Natural deep eutectic solvents and ultrasound-assisted extraction: Green approaches for extraction of wine lees anthocyanins. Food Bioprod. Process. 2017, 102, 195–203. [Google Scholar] [CrossRef]
- Elisia, I.; Hu, C.; Popovich, D.; Kitts, D.D. Antioxidant assessment of an anthocyanin-enriched blackberry extract. Food Chem. 2007, 101, 1052–1058. [Google Scholar] [CrossRef]
- Ticona, L.A.; Lacheva, G.I.; Serban, A.M.; Ángel, R.S. Hydroalcoholic extract of Tagetes minuta L. inhibits inflammatory bowel disease through the activity of pheophytins on the NF-κB signalling pathway. J. Ethnopharmacol. 2021, 268, 113603. [Google Scholar] [CrossRef]
- Naseri, A.; Holdt, S.L.; Jacobsen, C. Biochemical and Nutritional Composition of Industrial Red Seaweed Used in Carrageenan Production. J. Aquat. Food Prod. Technol. 2019, 28, 967–973. [Google Scholar] [CrossRef]
- Onofrejová, L.; Vašíčková, J.; Klejdus, B.; Stratil, P.; Mišurcová, L.; Kráčmar, S.; Kopecký, J.; Vacek, J. Bioactive phenols in algae: The application of pressurized-liquid and solid-phase extraction techniques. J. Pharm. Biomed. Anal. 2010, 51, 464–470. [Google Scholar] [CrossRef] [PubMed]
- Kazłowska, K.; Hsu, T.; Hou, C.-C.; Yang, W.-C.; Tsai, G.-J. Anti-inflammatory properties of phenolic compounds and crude extract from Porphyra dentata. J. Ethnopharmacol. 2010, 128, 123–130. [Google Scholar] [CrossRef] [PubMed]
- Namvar, F.; Mohamed, S.; Fard, S.G.; Behravan, J.; Mustapha, N.M.; Alitheen, N.B.M.; Othman, F. Polyphenol-rich seaweed (Eucheuma cottonii) extract suppresses breast tumour via hormone modulation and apoptosis induction. Food Chem. 2012, 130, 376–382. [Google Scholar] [CrossRef]
- Rodrigues, D.; Sousa, S.; Silva, A.; Amorim, M.M.; Pereira, L.; Rocha-Santos, T.; Gomes, A.M.P.; Duarte, A.; Freitas, A.C. Impact of Enzyme- and Ultrasound-Assisted Extraction Methods on Biological Properties of Red, Brown, and Green Seaweeds from the Central West Coast of Portugal. J. Agric. Food Chem. 2015, 63, 3177–3188. [Google Scholar] [CrossRef] [PubMed]
- Zou, P.; Lu, X.; Jing, C.; Yuan, Y.; Lu, Y.; Zhang, C.; Meng, L.; Zhao, H.; Li, Y. Low-Molecular-Weight Polysaccharides From Pyropia yezoensis Enhance Tolerance of Wheat Seedlings (Triticum aestivum L.) to Salt Stress. Front. Plant Sci. 2018, 9, 427. [Google Scholar] [CrossRef] [Green Version]
- Zhou, C.; Yu, X.; Zhang, Y.; He, R.; Ma, H. Ultrasonic degradation, purification and analysis of structure and antioxidant activity of polysaccharide from Porphyra yezoensis Udea. Carbohydr. Polym. 2012, 87, 2046–2051. [Google Scholar] [CrossRef]
- Hardouin, K.; Burlot, A.-S.; Umami, A.; Tanniou, A.; Stiger-Pouvreau, V.; Widowati, I.; Bedoux, G.; Bourgougnon, N. Biochemical and antiviral activities of enzymatic hydrolysates from different invasive French seaweeds. Environ. Boil. Fishes 2013, 26, 1029–1042. [Google Scholar] [CrossRef]
- Wang, T.; Jónsdóttir, R.; Kristinsson, H.G.; Hreggvidsson, G.O.; Jónsson, J.Ó.; Thorkelsson, G.; Ólafsdóttir, G. Enzyme-enhanced extraction of antioxidant ingredients from red algae Palmaria palmata. LWT Food Sci. Technol. 2010, 43, 1387–1393. [Google Scholar] [CrossRef]
- Harnedy, P.A.; O’Keeffe, M.B.; FitzGerald, R.J. Fractionation and identification of antioxidant peptides from an enzymatically hydrolysed Palmaria palmata protein isolate. Food Res. Int. 2017, 100, 416–422. [Google Scholar] [CrossRef] [Green Version]
- Gereniu, C.R.N.; Saravana, P.S.; Getachew, A.T.; Chun, B.-S. Characteristics of functional materials recovered from Solomon Islands red seaweed (Kappaphycus alvarezii) using pressurized hot water extraction. Environ. Boil. Fishes 2017, 29, 1609–1621. [Google Scholar] [CrossRef]
- Chambers, L.; Hellio, C.; Stokes, K.; Dennington, S.; Goodes, L.; Wood, R.; Walsh, F. Investigation of Chondrus crispus as a potential source of new antifouling agents. Int. Biodeterior. Biodegrad. 2011, 65, 939–946. [Google Scholar] [CrossRef]
- Dubber, D.; Harder, T. Extracts of Ceramium rubrum, Mastocarpus stellatus and Laminaria digitata inhibit growth of marine and fish pathogenic bacteria at ecologically realistic concentrations. Aquaculture 2008, 274, 196–200. [Google Scholar] [CrossRef]


| Coded Values | Natural Values | |||||
|---|---|---|---|---|---|---|
| HAE | HPAE | |||||
| t (min) | T (°C) | S (%) | t (min) | P (MPa) | S (%) | |
| −1.68 | 19.5 | 21,4 | 0 | 10 | 100 | 0 |
| −1 | 40 | 35 | 20.3 | 30.3 | 201.3 | 20.3 |
| 0 | 70 | 55 | 50 | 60 | 350 | 50 |
| +1 | 100 | 75 | 79.8 | 89.7 | 498.7 | 79.8 |
| +1.68 | 120.5 | 88,6 | 100 | 110 | 600 | 100 |
| ME | CC | GP | |
|---|---|---|---|
| Nutritional Composition and Energetic Value | |||
| Ash | 20.81 a ± 0.61 | 29.46 b ± 0.26 | 31.82 c ± 0.54 |
| Proteins | 18.62 a ± 0.04 | 17.00 b ± 0.26 | 14.35 c ± 0.26 |
| Lipids | 0.14 a ± 0.03 | 0.12 a ± 0.01 | 0.11 a ± 0.04 |
| Carbohydrates | 60.43 a ± 0.59 | 53.43 b ± 0.01 | 53.72 b ± 0.75 |
| Energy (kcal/100 g dw) | 317.50 a ± 2.26 | 282.75 b ± 1.01 | 273.26 c ± 2.35 |
| Energy (kJ/100 g dw) | 1329.3 a ± 9.45 | 1183.83 b ± 4.21 | 1144.07 c ± 9.82 |
| Organic Acids | |||
| Oxalic acid | 0.52 a ± 0.08 | 0.30 b ± 0.09 | 0.89 c ± 0.02 |
| Quinic acid | 2.01 a ± 0.27 | nd | 0.57 b ± 0.15 |
| Malic acid | 9.45 a ± 1.05 | 4.28 b ± 1.00 | 4.29 b ± 0.37 |
| Shikimic acid | nd | nd | 0.07 a ± 0.02 |
| Citric acid | 1.28 a ± 0.12 | 1.85 b ± 0.42 | 2.52 c ± 0.16 |
| Total | 13.26 a ± 1.51 | 6.13 b ± 1.42 | 7.45 b ± 0.03 |
| Experimental Response | |||||||||||||||
|---|---|---|---|---|---|---|---|---|---|---|---|---|---|---|---|
| Coded Values | Natural Values | HAE | HPAE | ||||||||||||
| HAE | HPAE | ME | CC | GP | ME | CC | GP | ||||||||
| X1 | X2 | X3 | X1: t | X2: T | X3: S | X1: t | X2: P | X3: S | YME | YCC | YGP | YME | YCC | YGP | |
| min | °C | % | min | MPa | % | mg/g | mg/g | mg/g | mg/g | mg/g | mg/g | ||||
| 1 | −1 | −1 | −1 | 40 | 34.2 | 20.3 | 30.3 | 201.3 | 20.3 | 196.4 | 392.2 | 305.5 | 236.0 | 121.4 | 358.3 |
| 2 | −1 | −1 | 1 | 100 | 34.2 | 79.7 | 30.3 | 201.3 | 79.7 | 163.5 | 351.3 | 287.4 | 94.8 | 200.7 | 186.7 |
| 3 | −1 | 1 | −1 | 40 | 75.8 | 20.3 | 30.3 | 498.7 | 20.3 | 254.9 | 443.8 | 355.2 | 255.6 | 140.9 | 323.3 |
| 4 | −1 | 1 | 1 | 100 | 75.8 | 79.7 | 30.3 | 498.7 | 79.7 | 230.6 | 384.7 | 254.6 | 92.2 | 204.5 | 151.7 |
| 5 | 1 | −1 | −1 | 40 | 34.2 | 20.3 | 89.7 | 201.3 | 20.3 | 147.1 | 419.4 | 234.2 | 258.0 | 124.0 | 360.0 |
| 6 | 1 | −1 | 1 | 100 | 34.2 | 79.7 | 89.7 | 201.3 | 79.7 | 126.4 | 353.4 | 269.2 | 116.8 | 108.3 | 151.7 |
| 7 | 1 | 1 | −1 | 40 | 75.8 | 20.3 | 89.7 | 498.7 | 20.3 | 95.0 | 463.9 | 375.9 | 245.8 | 95.5 | 333.3 |
| 8 | 1 | 1 | 1 | 100 | 75.8 | 79.7 | 89.7 | 498.7 | 79.7 | 82.9 | 386.1 | 300.7 | 82.5 | 64.2 | 150.0 |
| 9 | −1.68 | 0 | 0 | 19.5 | 55 | 50 | 10 | 350 | 50 | 198.2 | 344.1 | 236.6 | 184.8 | 193.5 | 258.3 |
| 10 | 1.68 | 0 | 0 | 120.5 | 55 | 50 | 110 | 350 | 50 | 126.7 | 436.9 | 313.0 | 195.1 | 77.6 | 271.7 |
| 11 | 0 | −1.68 | 0 | 70 | 20 | 50 | 60 | 100 | 50 | 163.2 | 364.7 | 274.7 | 197.1 | 149.9 | 256.7 |
| 12 | 0 | 1.68 | 0 | 70 | 90 | 50 | 60 | 600 | 50 | 169.7 | 438.9 | 350.3 | 184.7 | 129.2 | 221.7 |
| 13 | 0 | 0 | −1.68 | 70 | 55 | 0 | 60 | 350 | 0 | 283.8 | 442.4 | 344.7 | 272.1 | 112.8 | 431.7 |
| 14 | 0 | 0 | 1.68 | 70 | 55 | 100 | 60 | 350 | 100 | 80.4 | 141.2 | 173.0 | 16.0 | 153.1 | 28.3 |
| 15 | −1.68 | −1.68 | −1.68 | 19.5 | 20 | 0 | 10 | 100 | 0 | 272.8 | 157.9 | 283.7 | 191.9 | 35.0 | 365.0 |
| 16 | −1.68 | −1.68 | 1.68 | 19.5 | 20 | 100 | 10 | 100 | 100 | 162.0 | 62.9 | 307.0 | 16.7 | 151.2 | 25.0 |
| 17 | −1.68 | 1.68 | −1.68 | 120.5 | 90 | 0 | 10 | 600 | 0 | 429.6 | 401.5 | 352.5 | 273.3 | 23.7 | 456.7 |
| 18 | −1.68 | 1.68 | 1.68 | 120.5 | 90 | 100 | 10 | 600 | 100 | 381.8 | 103.4 | 41.1 | 3.3 | 176.1 | 33.3 |
| 19 | 1.68 | −1.68 | −1.68 | 19.5 | 20 | 0 | 110 | 100 | 0 | 173.4 | 439.6 | 112.2 | 356.7 | 40.6 | 458.3 |
| 20 | 1.68 | −1.68 | 1.68 | 19.5 | 20 | 100 | 110 | 100 | 100 | 182.4 | 135.9 | 283.0 | 119.1 | 40.0 | 16.7 |
| 21 | 1.68 | 1.68 | −1.68 | 120.5 | 90 | 0 | 110 | 600 | 0 | 45.1 | 494.1 | 522.2 | 286.7 | 45.0 | 425.0 |
| 22 | 1.68 | 1.68 | 1.68 | 120.5 | 90 | 100 | 110 | 600 | 100 | 27.5 | 275.5 | 339.7 | 5.0 | 56.0 | 41.7 |
| 23 | 0 | 0 | 0 | 70 | 55 | 50 | 60 | 350 | 50 | 167.6 | 427.5 | 291.7 | 188.3 | 173.3 | 286.7 |
| 24 | 0 | 0 | 0 | 70 | 55 | 50 | 60 | 350 | 50 | 178.3 | 416.9 | 285.0 | 193.3 | 191.7 | 291.7 |
| 25 | 0 | 0 | 0 | 70 | 55 | 50 | 60 | 350 | 50 | 113.6 | 382.2 | 270.2 | 210.0 | 168.3 | 270.0 |
| 26 | 0 | 0 | 0 | 70 | 55 | 50 | 60 | 350 | 50 | 147.9 | 392.2 | 288.9 | 200.0 | 186.7 | 276.7 |
| 27 | 0 | 0 | 0 | 70 | 55 | 50 | 60 | 350 | 50 | 120.3 | 420.9 | 292.5 | 178.3 | 143.3 | 201.7 |
| 28 | 0 | 0 | 0 | 70 | 55 | 50 | 60 | 350 | 50 | 123.6 | 403.5 | 292.5 | 193.3 | 138.3 | 273.7 |
| Parameters | HAE | HPAE | |||||
|---|---|---|---|---|---|---|---|
| ME | CC | GP | ME | CC | GP | ||
| Origin | b0 | 148.2 ± 15.4 | 419.0 ± 20.9 | 290.1 ± 10.2 | 190.3 ± 6.2 | 167.1 ± 9.7 | 264.5 ± 9.3 |
| Lineal effect | b1 | −52.1 ± 9.2 | 34.4 ± 12.5 | 15.6 ± 5.7 | 14.2 ± 3.7 | −22.4 ± 5.3 | 13.8 ± 5.2 |
| b2 | ns | 30.1 ± 12.5 | 21.2 ± 5.7 | −6.8 ± 3.7 | ns | ns | |
| b3 | −19.7 ± 9.2 | −63.1 ± 12.5 | −26.2 ± 5.7 | −73.4 ± 3.7 | 17.4 ± 5.3 | −112.6 ± 5.2 | |
| Quadratic effect | b11 | ns | ns | ns | ns | −11.5 ± 7.0 | ns |
| b22 | ns | ns | 8.3 ± 7.0 | ns | −10.1 ± 7.0 | −18.3 ± 6.4 | |
| b33 | 19.2 ± 8.9 | −51.2 ± 12.0 | −10.7 ± 7.0 | −13.2 ± 3.6 | −12.4 ± 7.0 | −8.5 ± 6.4 | |
| Interactiveeffect | b12 | −29.0 ± 6.6 | ns | 28.3 ± 4.1 | −10.8 ± 2.7 | ns | −6.7 ± 3.8 |
| b13 | ns | ns | 11.9 ± 4.1 | −2.9 ± 2.7 | −12.8 ± 3.8 | ns | |
| b23 | ns | ns | −29.7 ± 4.1 | −6.1 ± 2.7 | ns | ns | |
| Statistics (R2) | 0.8623 | 0.8560 | 0.9451 | 0.9796 | 0.8878 | 0.9403 | |
| HAE | ME: | Equation | (3) | |
| CC: | Equation | (4) | ||
| GP: | Equation | (5) | ||
| HPAE | ME: | Equation | (6) | |
| CC: | Equation | (7) | ||
| GP: | Equation | (8) |
| Criteria | Variables Optimal Conditions | Optimal Response | ||||
|---|---|---|---|---|---|---|
| X1: t (min) | X2: T (°C) or P (MPa) | X3: S (%) | ||||
| (A) Optimal Individual Conditions of the Variables | ||||||
| HAE | ME: | *19.5 ± 0.2 | *88.6 ± 8.9 | *0.0 ± 0.0 | 405.0 ± 40.5 | mg/g |
| CC: | *120.5 ± 12.1 | *88.6 ± 8.9 | 31.7 ± 0.6 | 547.0 ± 16.4 | mg/g | |
| GP: | *120.5 ± 9.6 | *88.6 ± 8.0 | *0.0 ± 0.0 | 519.6 ± 10.4 | mg/g | |
| HPAE | ME: | *110.0 ± 7.7 | *100.0 ± 8.0 | *0.0 ± 0.0 | 333.1 ± 13.3 | mg/g |
| CC: | *10.0 ± 1.0 | 350.0 ± 28.0 | 96.7 ± 4.8 | 202.9 ± 18.3 | mg/g | |
| GP: | *110.0 ± 9.9 | 304.3 ± 24.3 | *0.0 ± 0.0 | 454.6 ± 4.5 | mg/g | |
| (B) Optimal Global Conditions of the Variables | ||||||
| HAE | ME: | 36.6 ± 10.8 | *88.6 ± 2.4 | 50.0 ± 2.4 | 405.0 ± 12.2 | mg/g |
| CC: | 373.2 ± 22.4 | mg/g | ||||
| GP: | 375.0 ± 3.8 | mg/g | ||||
| HPAE | ME: | 49.0 ± 3.4 | 51.9 ± 2.6 | 50.0 ± 5.0 | 292.2 ± 14.6 | mg/g |
| CC: | 94.4 ± 4.7 | mg/g | ||||
| GP: | 441.1 ± 4.4 | mg/g | ||||
| Compounds | Red Algae | |||
|---|---|---|---|---|
| ME | CC | GP | ||
| (A) Phenolic Compounds | ||||
| Total (mg/g): | 12.18 | 10.36 | 9.11 | |
| (−) Epicatechin | (2R,3R)-2-(3,4-dihydroxyphenyl)-3,4-dihydro-2H-chromene-3,5,7-triol | 1.14 | 9.95 | 5.78 |
| (+) Catechin | (2R,3S)-2-(3,4-dihydroxyphenyl)-3,4-dihydro-2H-chromene-3,5,7-triol | 1.34 | 10.34 | - |
| Protocatechuic acid | 3,4-Dihydroxybenzoic acid | 9.10 | 17.72 | 7.14 |
| Benzoic acid | Benzoic acid | 0.56 | 0.97 | 0.40 |
| Caffeic acid | 3-(3,4-Dihydroxyphenyl)prop-2-enoic acid | 1.67 | 1.31 | 0.83 |
| Caffeinic acid | 3-(3,4-Dihidroxyphenyl)-2-propenoic acid | 0.31 | 1.04 | 0.38 |
| Chlorogenic acid | 3-(3,4-Dihydroxycinnamoyl)quinic acid | - | 0.31 | - |
| Galagin | 3,5,7-Trihydroxy-2-phenylchromen-4-one | 0.15 | - | 0.05 |
| Hesperidin | (2S)-5-Hydroxy-2-(3-hydroxy-4-methoxyphenyl)-7-[(2S,3R,4S,5S,6R)-3,4,5-trihydroxy-6-[[(2R,3R,4R,5R,6S)-3,4,5-trihydroxy-6-methyloxan-2-yl]oxymethyl]oxan-2-yl]oxy-2,3-dihydrochromen-4-one - | 0.14 | - | 0.40 |
| Kaempherol | 3,5,7-Trihydroxy-2-(4-hydroxyphenyl)chromen-4-one | 0.19 | - | 0.03 |
| Luteolin | 2-(3,4-Dihidroxyphenyl)- 5,7-dihydroxy-4-chromenone | 0.22 | - | 0.03 |
| Naringenin | (2S)-5,7-Dihydroxy-2-(4-hydroxyphenyl)-2,3-dihydrochromen-4-one | - | 0.30 | - |
| Oleuropein | Methyl (4S,5E,6S)-4-[2-[2-(3,4-dihydroxyphenyl)ethoxy]-2-oxoethyl]-5-ethylidene-6-[(2S,3R,4S,5S,6R)-3,4,5-trihydroxy-6-(hydroxymethyl)oxan-2-yl]oxy-4H-pyran-3-carboxylate | 61.39 | - | 32.28 |
| p-aminobenzoic acid | 4-Aminobenzoic acid | 3.98 | - | 16.58 |
| p-coumaric acid | (E)-3-(4-Hydroxyphenyl)prop-2-enoic acid | 5.80 | 3.01 | 2.19 |
| Pinocembrin | (2S)-5,7-dihydroxy-2-phenyl-2,3-dihydrochromen-4-one | - | 0.53 | - |
| Salicylic acid | 2-Hydroxybenzoic acid | 12.44 | 4.14 | 10.12 |
| Sinapic acid | 3,5-Dimethoxy-4-hydroxycinnamic acid | 0.64 | - | |
| Syringaldehyde | 4-Hydroxy-3,5-dimethoxybenzaldehyde | 1.58 | 6.59 | 1.04 |
| Tyrosol | 2-(4-Hydroxyphenyl)ethanol | - | 43.01 | 22.75 |
| (B) Pigments | ||||
| Total (mg/g): | 2.34 | 0.52 | 2.56 | |
| β-Carotene | 1,3,3-Trimethyl-2-[(1E,3E,5E,7E,9E,11E,13E,15E,17E)-3,7,12,16-tetramethyl-18-(2,6,6-trimethylcyclohexen-1-yl)octadeca-1,3,5,7,9,11,13,15,17-nonaenyl]cyclohexene | 73.19 | 73.76 | 84.08 |
| Chlorophyll a | magnesium;methyl (3R,21S,22S)-16-ethenyl-11-ethyl-12,17,21,26-tetramethyl -4-oxo-22-[3-oxo-3-[(E,7R,11R)-3,7,11,15-tetramethylhexadec-2-enoxy]propyl]-23,25-diaza-7,24-diazanidahexacyclo [1 8.2.1.15,8.110,13.115,18.02,6]hexacosa-1,5,8(26),9,11,13(25),14,16,18,20(23)-decaene-3-carboxylate | 26.45 | 26.17 | 15.72 |
| Lutein | (1R)-4-[(1E,3E,5E,7E,9E,11E,13E,15E,17E)-18-[(1R,4R)-4-hydroxy-2,6,6-trimethylcyclohex-2-en-1-yl]-3,7,12,16-tetramethyloctadeca-1,3,5,7,9,11,13,15,17-nonaenyl] -3,5,5-trimethylcyclohex-3-en-1-ol | 0.35 | 0.061 | 0.18 |
| Red Algae | Reference Value | ||||||
|---|---|---|---|---|---|---|---|
| ME | CC | GP | Trolox | Str | Ktz | ||
| Antioxidant Activity | |||||||
| TBARS | 209 a ± 27 | 160 a ± 18 | 285 b ± 41 | 5.4 ± 0.3 | - | - | |
| OxHLIA (Δt = 30 min) | 1.0 a ± 0.1 | 1.4 a ± 0.2 | 1.5 a ± 0.3 | 46 ± 2 | - | - | |
| Antibacterial Activity | |||||||
| B. cereus | MIC | 0.06 | 0.045 | 0.045 | - | 0.1 | - |
| MBC | 0.12 | 0.06 | 0.06 | - | 0.2 | - | |
| S. aureus | MIC | 0.09 | 0.06 | 0.06 | - | 0.05 | - |
| MBC | 0.12 | 0.1 | 0.12 | - | 0.1 | - | |
| M. flavus | MIC | 0.09 | 0.09 | 0.09 | - | 0.2 | - |
| MBC | 0.12 | 0.12 | 0.12 | - | 0.3 | - | |
| P. miriabilis | MIC | 0.045 | 0.045 | 0.045 | - | 0.2 | - |
| MBC | 0.06 | 0.06 | 0.06 | - | 0.3 | - | |
| S. Typhimurium | MIC | 0.06 | 0.06 | 0.06 | - | 0.2 | - |
| MBC | 0.12 | 0.12 | 0.12 | - | 0.3 | - | |
| Antifungal Activity | |||||||
| C. albicans | MIC | 0.045 | 0.045 | 0.06 | - | - | 0.5 |
| MFC | 0.06 | 0.06 | 0.12 | - | - | 1 | |
| C. tropicalis | MIC | 0.045 | 0.045 | 0.03 | - | - | 0.3 |
| MFC | 0.06 | 0.06 | 0.06 | - | - | 0.5 | |
| C. krusei | MIC | 0.06 | 0.06 | 0.06 | - | - | 0.5 |
| MFC | 0.12 | 0.12 | 0.12 | - | - | 1 | |
Publisher’s Note: MDPI stays neutral with regard to jurisdictional claims in published maps and institutional affiliations. |
© 2021 by the authors. Licensee MDPI, Basel, Switzerland. This article is an open access article distributed under the terms and conditions of the Creative Commons Attribution (CC BY) license (https://creativecommons.org/licenses/by/4.0/).
Share and Cite
Carpena, M.; Caleja, C.; Pereira, E.; Pereira, C.; Ćirić, A.; Soković, M.; Soria-Lopez, A.; Fraga-Corral, M.; Simal-Gandara, J.; Ferreira, I.C.F.R.; et al. Red Seaweeds as a Source of Nutrients and Bioactive Compounds: Optimization of the Extraction. Chemosensors 2021, 9, 132. https://0-doi-org.brum.beds.ac.uk/10.3390/chemosensors9060132
Carpena M, Caleja C, Pereira E, Pereira C, Ćirić A, Soković M, Soria-Lopez A, Fraga-Corral M, Simal-Gandara J, Ferreira ICFR, et al. Red Seaweeds as a Source of Nutrients and Bioactive Compounds: Optimization of the Extraction. Chemosensors. 2021; 9(6):132. https://0-doi-org.brum.beds.ac.uk/10.3390/chemosensors9060132
Chicago/Turabian StyleCarpena, Maria, Cristina Caleja, Eliana Pereira, Carla Pereira, Ana Ćirić, Marina Soković, Anton Soria-Lopez, Maria Fraga-Corral, Jesus Simal-Gandara, Isabel C. F. R. Ferreira, and et al. 2021. "Red Seaweeds as a Source of Nutrients and Bioactive Compounds: Optimization of the Extraction" Chemosensors 9, no. 6: 132. https://0-doi-org.brum.beds.ac.uk/10.3390/chemosensors9060132