Article

Highly Sensitive Quartz-Based Sensing System for the Detection of Subpercentage Changes in the Relative Permittivity of Liquids Flowing in Microchannels

Faculty of Electrical Engineering and Computer Science, University of Maribor, Koroška c. 46, 2000 Maribor, Slovenia
*
Author to whom correspondence should be addressed.
Submission received: 15 July 2021 / Revised: 14 August 2021 / Accepted: 16 August 2021 / Published: 18 August 2021

Abstract

:
We describe a highly sensitive quartz sensor for measuring changes in the relative permittivity of liquids flowing in microchannels. The proposed method uses a highly stable oscillator and capacitance-dependent quartz crystal together with a capacitance-sensitive element attached along the microchannel. A change in the relative permittivity of the fluid induces a change in the capacitance of the sensitive element in the aF range, which is detected as a change in the resonant frequency. The advantages of the proposed measurement technique are the extreme sensitivity (changes in the relative permittivity as low as 0.01% can be detected), the temperature independence of the setup between 10 and 40 °C, the stability (the frequency reading fluctuates within 0.025 Hz), and the low cost compared with the methods that use impedance analyzers or lock-in amplifiers. We present the use of the method to detect changes in mixtures of liquids if the temperature, volume fractions, or properties of one liquid change. The method presents a useful tool for applications in biology, chemistry, pharmacy, and technology in general wherever accurate monitoring of compositions of fluids is required and where changes, for example, due to temperature variation or mixture aging, need to be detected in real time.

1. Introduction

Sensors to measure relative permittivity are of utmost importance in studying the properties of mixtures of liquids (especially solvents) and play an important role in the characterization of the electrical properties of fluids. Capacitive sensors are used to measure the dielectric properties of liquids in chemical processes, to detect droplets [1], to analyze water samples [2], to follow bacterial growth [3], and to detect DNA [4] and are used in systems for healthcare-based applications [5]. Usually, interdigitated capacitor plates with an area of the order of a few mm 2 are used. The signal can be collected by a capacitance-to-digital converter and transformed into a voltage signal [1] or by a lock-in amplifier, by which the change in the frequency of an LC oscillator due to a change in capacitance is detected [2]. However, most often, electrodes are connected to the complementary metal-oxide semiconductor (CMOS) chip [3,4,5] and a voltage signal is measured. Capacitive sensors are also used to detect concentrations of mixed liquids in pharmacy and medicine [6] as well as the dielectric properties of alcohols, which are of a special interest in chemical and electrochemical processes and thus very important in chemistry and biology [7,8].
To measure the dielectric properties of liquids in microchannels, CMOS-based sensors are usually used. To avoid their fabrication, which is relatively expensive and time consuming, direct measurements with an impedance analyzer were proposed [9,10]. The performance of the sensor strongly depends on the dielectric coating of the electrodes immersed in the liquid. The change in the measured capacitance between the empty channel and the channel filled with the studied liquid equals the capacitance of the liquid only if the relative permittivity of the coating on the electrodes is very high. For this purpose, polymer coatings with an addition of barium titanate are very efficient [9,10]. As the electrode area is very small ( 1 10   mm 2 ), these sensors measure only local properties in a small volume in the vicinity of the sensor, which is usually situated at the bottom of the microchannel. Despite their small size, they can disturb the liquid flow to some extent. On the other hand, their small size can be a disadvantage in measurements of the dielectric properties of mixtures of liquids, with a very low concentration of one liquid due to the prevailing effect of the other liquid.
Wherever accurate monitoring of (the composition of) liquids is required and changes, for example, due to the temperature variation, mixture aging, introduction of impurities, etc. needing to be detected in real time, rather than monitoring the absolute values, it is often the changes in relative permittivity that are important to monitor. In mixtures of liquids, a change in the volume fraction of liquids or their chemical properties might have a significant effect on the properties of the mixture. In cases where extremely low changes need to be detected, the method proposed in this paper provides a solution.
In this paper, we propose a highly sensitive method for detecting changes in the dielectric properties of liquids using a capacitance-dependent quartz crystal. Currently, quartz crystals are widely used as mass-sensitive sensors (a quartz crystal microbalance, QCM). For the use of QCM as biosensors, immunosensors, DNA, and protein sensors [11,12], a material should be electrodeposited onto the QCM surface [13], the proper choice of which strongly increases the sensitivity. In the method proposed here, we modify the electrical equivalent circuit of a quartz crystal [14,15] instead. Two thin capacitive lines that are attached to an open-ended glass tube present a sensor capacitor, the capacitance of which affects the resonant frequency of the capacitance-dependent quartz crystal. Measurements of a change in the resonant frequency enable us to make a very sensitive and accurate determination of the changes in the relative permittivity of the liquid flowing in the channel. We present the experimental setup, the equivalent circuit for the quartz crystal, the effect of the relative permittivity on the resonant frequency of the quartz oscillator, and the procedure to measure the relative permittivity at the frequency of the quartz oscillator. The sensitivity of the method and temperature stabilization of the quartz crystal are presented. The applicability of the method is demonstrated by following the temperature variation of the relative permittivity of three liquids with their values of relative permittivity ( ε ) in the order of magnitude between 1 and 100: toluene ( ε 2.4 ), 2-propanol ( ε 19 ), and distilled water ( ε 78 ). The applicability of the method for the detection of changes in the mixtures of liquids is shown in the case of a mixture of two liquids with very different values of relative permittivity, toluene, and ethyl alcohol. The advantages of the proposed measurement technique are the extreme sensitivity (changes in the relative permittivity as low as 0.01% can be detected), the temperature independence of the setup between 10–40 °C, the stability (the frequency reading fluctuates within 0.025 Hz), and the low cost. The method presents a noninvasive measurement of the relative permittivity, i.e., it neither disturbs the liquid flow nor changes the properties of the liquid due to a possible interaction of the liquid with the electrodes, because the electrodes are positioned outside the channel.

2. Materials and Methods

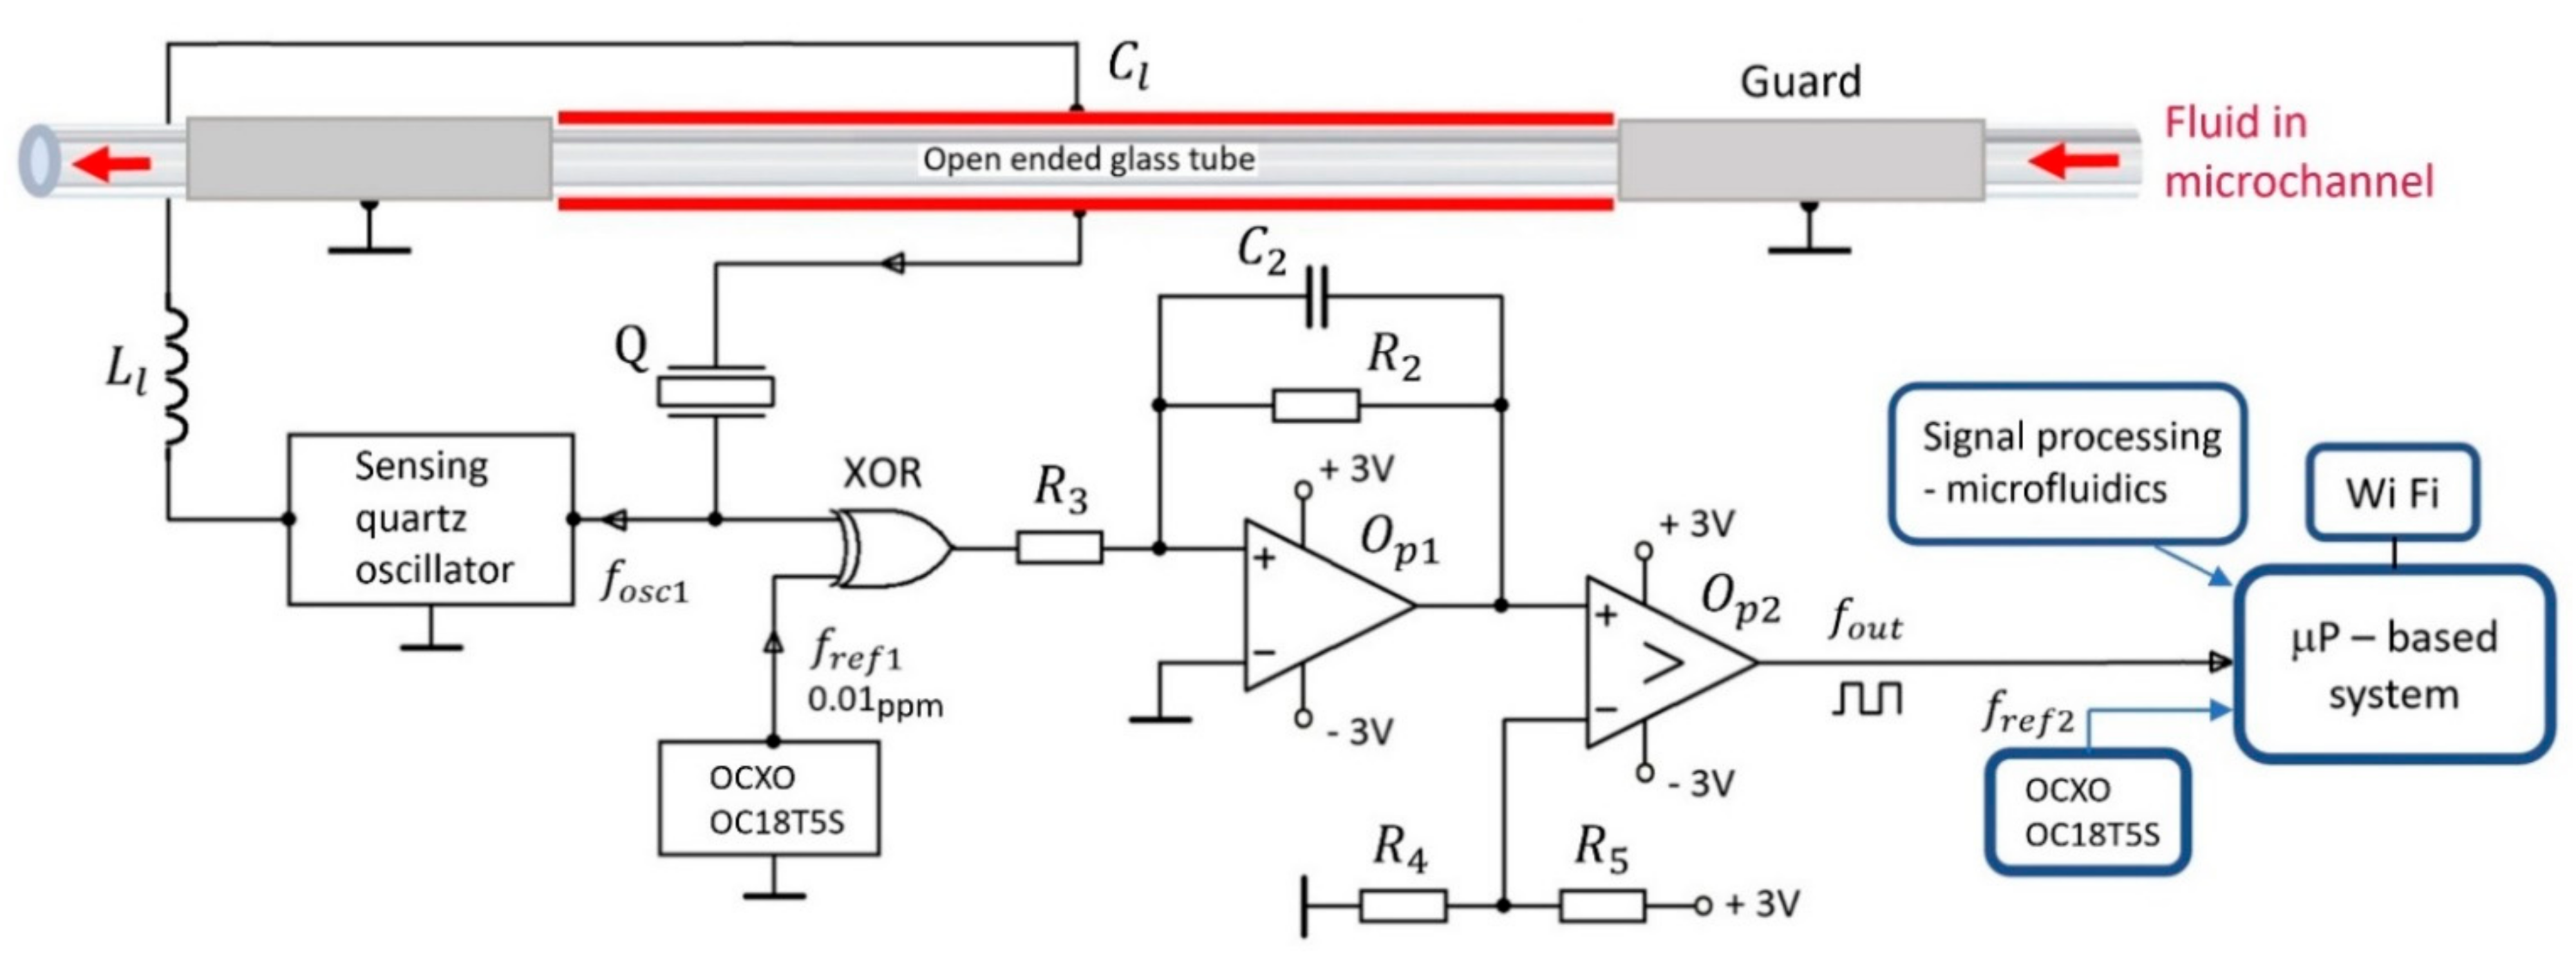
2.1. Experimental Setup

The experimental setup is shown in Figure 1. A commercially available (Norell) open-ended glass tube, through which the investigated liquid flows, has external and internal diameters equal to (1.00 ± 0.01) mm and (0.58 ± 0.01) mm, respectively; a length of 100 mm; and a volume equal to 12 μL. It is made of a fused silica for use in the frequency range 1–100 MHz, with the relative permittivity equal to ε r = 3.78 and the tangent loss tan δ = 0.0001 .
A sensitive capacitor of dimensions 50 mm × 1 mm is attached to the microchannel and connected in series with a capacitance-dependent quartz crystal Q. The oscillator frequency f o s c 1 depends on the properties of the quartz crystal equivalent circuit and on the dielectric properties of the liquid and microchannel. The thin metal lines of the sensitive capacitor are positioned on the external side of the open-ended glass tube. As the capacitor plates are not in contact with the liquid, there is no need for compensation of the ionic conductivity and polarization of the electrodes [6]. The guard electrodes positioned on opposite sides of the open-ended glass tube reduce the fringing field effect [6]. The capacitance of the sensing capacitor, including the microchannel between the capacitor plates, is C l (load capacitance).
The purpose of the oscillator signal with a frequency f r e f 1 from the reference oven-controlled oscillator OCXO OC18T5S is to use the XOR logic gate to transform the frequency signal f o s c into a lower frequency range, which is of the order of kilohertz. The reason for this is the frequency counter. It has a set number of displayed digits, and if the frequency is reduced by three order of magnitudes, this means that the accuracy of the frequency reading is increased by three orders of magnitude.
An integrator ( O p 1 ) and comparator ( O p 2 ) transform the signal from the XOR gate into a square signal with a frequency f o u t . This frequency depends on the relative permittivity of the liquid. The frequency stability of the reference oscillator OCXO OC18T5S with frequency f r e f 2 is 0.01 ppm in the temperature range 0–60 °C [16,17,18].
The equivalent electric circuit of the series connection of the quartz crystal (resistance R 1 , inductance L 1 , capacitance C 1 , and parasitic capacitance C 0 ) and the load capacitor ( C l ) are shown in Figure 2. The load capacitance C l affects the resonant frequency of the crystal. As already explained, the change in this frequency is related to the relative permittivity of the liquid.

2.1.1. Temperature Stability of the Quartz Oscillator

The frequency of the oscillator circuit, defined by the quartz crystal, is temperature-dependent. We used an AT-cut crystal with a cut angle 0′, for which the temperature dependence of the resonant frequency in the region between 10 °C and 40 °C is lower than 0.1 ppm (Figure 3). From Figure 3, we see that the temperature dependence is highly sensitive to the cut angle.
The change ( Δ f ) in the resonant frequency ( f s ) as a function of temperature ( T ) at different values of the crystal cut angle is presented by a cubical parabola, which intersects at the reference temperature T r e f = 25   :
Δ f f = A 1 T T r e f + A 2 T T r e f 2 + A 3 T T r e f 3   ,
where A 1 , A 2 , and A 3 are coefficients that depend on the cut angle and on mechanical construction of the quartz element [16,17,18,19,20]. For an even better temperature compensation at high-precision measurements of small impedance changes, a switching mode method [15,21] should be used.

2.1.2. Influence of Quartz Crystal Aging on the Frequency Change

For high-sensitivity measurements, both short-term (approximately 20 min) as well as long-term (over months or years) stabilities are of utmost importance. The short-term stability of a quartz crystal depends on the oscillator design and on the drive level, which should be below 10 μW. The long-term frequency stability of the quartz crystal depends on the purity of the resonator, on the stability of the inert gas filling, and on the final sealing process. At the beginning, the aging process is more pronounced but the relative frequency change ( Δ f t / f ) given in ppm reduces with time ( t ), given in hours, as follows [18,19,20,22]:
Δ f t f = 5   ln 0.5 t + 1   .
In the case of a constant operation, the aging is called active and it is higher than passive aging (during storage). Active aging is defined by the aging rate, which is less than ±1 ppm/year (in the temperature range 10–40 °C) for the best cold weld crystals.

2.1.3. Frequency Measurement Error

The accuracy of the frequency counter depends on the accuracy of the crystal driving the microcontroller. We use an NXP LPC 1768 microcontroller. With the reference oven-controlled oscillator OCXO OC18T5S used with frequency f r e f 2 = 25   MHz and with its frequency stability at 0.01 ppm, the maximum possible error is ± 25   MHz × 0.01 × 10 6 = ± 0.25   Hz . By prolonging the measurement time, this error can be reduced down to ±0.02 Hz. On the other hand, if one uses an ordinary crystal and a microcontroller with a frequency of 4 MHz and temperature stability of 50 ppm, the maximum error would be ± 4   MHz × 50 × 10 6 = ± 200   Hz . Commonly available crystals have a ppm specification from ±30 to ±50 ppm. The smaller the ppm value, the more accurate the measurement of the frequency.

2.2. Influence of the Liquid Impedance on the Quartz Crystal Resonant Frequency

The equivalent impedance Z q ^ of the quartz crystal is defined by L 1 ,   C 1 ,   R 1 ,   and   C 0 , i.e., by the properties of the elements from the equivalent circuit (Figure 2) [16,20]:
Z q ^ = R 1 + j ω L 1 + 1 j ω C 1 1 j ω C 0 R 1 + j ω L 1 + 1 j ω C 1 + 1 j ω C 0 = R 1 + j ω L 1 1 ω C 1 1 + C 0 C 1 ω 2 L 1 C 0 + j ω R 1 C 0   ,
where ω is the angular frequency. By neglecting R 1 and by setting Z q ^ to zero, we find the series resonant frequency f s   of the quartz crystal:
f s = 1 2 π L 1 C 1   .
The impedance ( Z * ) of the quartz crystal in series with the load capacitor is [20]
Z * = j ω L 1 1 ω C 1 1 + C 0 C 1 ω 2 L 1 C 0 + 1 j ω C l
The resonant frequency f s * is [16,20]
f s * = 1 2 π L 1 C 1 1 + C 1 C 0 + C l   .
The pulling range ( D l ) of the quartz crystal frequency is defined as a change in the frequency produced by changing the load capacitance from C l 1 to C l 2 [16,18,20,23,24]:
D l = f l 1 f l 2 f s C 1 C l 2 C l 1 2 C 0 + C l 1 C 0 + C l 2   ,
where f l 1 and f l 2 are f s * at the load capacitance C l 1 and C l 2 , respectively. The pulling sensitivity of the crystal unit can be considerably increased if the capacitance C 0 is compensated by a coil of inductance L l in series with the quartz crystal (Figure 2) [19,24]. The appropriate inductance is calculated as follows [20]:
L l = 1 ω s 2 C 0     ,
where ω s = 2 π f s . By adding a compensation inductance, a new resonant frequency f s * * of the quartz crystal is obtained [18,19], which in the case of C 1 C l C 0 2 can be expressed as follows:
f s * * f s = 1 + C 1 2 · C 0 C l C 0 2   .
Thus, by adding the coil with inductance L l , the resonant frequency becomes linearly dependent on the load capacitance C l (close to the resonant frequency), with the sensitivity being determined by the factor C 1 / 2 C 0 2 in front of C l . If one chooses a quartz crystal with a lower C 0 , the frequency sensitivity increases.
Figure 4 presents the change in the resonant frequency for a 5 MHz crystal in the case of the series load capacitance varying between 0 and 5 pF with and without compensation of C 0 .

2.3. Dependence of the Load Capacitance on the Relative Permittivity of the Investigated Liquid

To estimate the rate of changes in the load capacitance when the relative permittivity ( ε i ) of the investigated liquid changes ( d C l / d ε i ), we describe a microchannel (Figure 5) as a set of capacitors. As the width of the capacitor plates is comparable with the diameter of the microchannel, the microchannel can be considered a set of three capacitors in parallel. The upper and bottom capacitors of capacitance C g 0 are (approximately) filled by glass, while the central capacitor can be considered a set of three capacitors in series: two capacitors filled by glass, each of capacitance C g , and a capacitor filled with the liquid under investigation (capacitance C i ). Although these capacitors are not parallel plate capacitors, we use this approximation to estimate the sensitivity of such a system. The experimental studies presented in Section 3 confirm that such an approximation gives proper trends and predictions. When the measurements are performed, we are interested in the changes only and not in the absolute values, so all of the unknown factors not only due to the shape of the electrodes but also due to the hidden, parasitic, and capacitance-related factors turn out to be irrelevant.
The equivalent capacitance ( C l ) of the capacitor circuit given in Figure 5a is
C l = 2 C g 0 + ε i C g C a 2 ε i C a + C g     ,
where we used the fact that the capacitance of the microchannel filled with the investigated liquid is a factor of the relative permittivity of the liquid larger than the capacitance of the empty channel: C i = ε i C a , where C a is the capacitance of the channel filled by air. By assuming the width ( w ) of the capacitors plates given in Figure 5a, their length with being equal to L = 50   mm and the distance between the plates approximated by the distances d , as shown in Figure 5a, one finds C a = ε 0 L w i / d i = 0.37   pF , C g = ε g ε 0 L w i / d g = 1.0 ε g   pF , and C g 0 = ε g ε 0 L w 0 / d 0 = 0.11 ε g   pF , where ε g is the relative permittivity of glass. By differentiating C l over ε i , we find
d C l d ε i = C a 1 + 2 ε i C a C g 2     .
Thus, C g 0 is not used in the expression of the sensitivity and the expression for the sensitivity d C l / d ε i is the same as that in the case of a larger channel (a test tube) in which the thickness of the glass is relatively smaller (see Figure 5b). For the case shown in Figure 5b, one finds C g = 2.2 ε g   pF and C a = 0.22   pF ; thus, the capacitances C g and C a are of the same order of magnitude both in a microchannel and in a test tube. In Table 1, we compare the sensitivity d C l / d ε i for three different liquids, toluene, 2-propanol, and water, for two types of glass (iron and silica). We see that, in general, the sensitivity is larger if a microchannel or test tube is made of glass with larger relative permittivity. This is of special importance when liquids with high values of relative permittivity are monitored (for example water), while for liquids with low values of relative permittivity (e.g., toluene), the choice of the glass is less important.
From Table 1, we can also deduce that, in order to detect a relative change in the relative permittivity of the order of 10 3 , one would need to detect changes in the capacitance as low as 10   aF . In the next section, we present measurements that confirm that the proposed method is sensitive enough to detect such extremely low changes in the capacitance through the change in the quartz oscillator resonant frequency.

2.4. Temperature Dependence of Relative Permittivity

To test the properties of the proposed measuring system, we measured the temperature dependence of the relative permittivity of water, 2-propanol, and toluene in the temperature range 22 29   . In such a small temperature range, the relative permittivity of all of the studied liquids changes by the order of 1 % .
Table 2 lists the values of the relative permittivity of the studied liquids at 27   (in the middle of the measuring range) and the standard atmospheric pressure as well as coefficients a , b , and c of a polynomial fitting of the relative permittivity for the temperature valid in the temperature range of the performed measurements [25]
ε i T = a + b T + c T 2   .
Within the measured temperature range, the relative permittivity changes linearly with temperature for all three liquids, and for all three liquids, it decreases as temperature increases.

3. Measurements

First, the stability of the oscillator voltage ( V o s c ) was checked. The voltage measured over a time span of approximately 40 min is shown in Figure 6. The stability was measured by the HP6632A system with a DC power supply and with the accuracy of the set voltage being 0.01%. We see that the voltage fluctuates only by ± 0.0015   V , and it is unaffected by a slight variation in the temperature of the environment, which was kept at approximately 24   . The temperature of the environment was measured by a low-power linear active thermistor K S MCP9701A, the measuring range 0 70   , and an accuracy of ± 2 % . The sensor was connected to a 12 bit PIC microcontroller PIC18F27J53.
The stability of the measured frequency ( f o u t ) is shown in Figure 7. As already explained, we do not directly measure the resonant frequency but rather transform this frequency into a lower (kHz) frequency range, which increases the accuracy of the frequency reading by three orders of magnitude. The frequency was monitored for 2-propanol over a period of approximately 40 min. The temperature of the 2-propanol was kept constant at the environment temperature ( T = 24   ) . We see that the frequency reading fluctuates on the level of ± 0.025   Hz .
Next, we monitored the frequency and temperature of all three liquids as a function of time. The measurements were performed in a test tube because, in such a way, the temperature of the liquid and the frequency could be measured simultaneously. For measuring the temperature of the liquid, we used an NTC temperature sensor KWCQ ( 10 k   25   ) and a resistance tolerance of ± 1 % , measured with a HP3478A multimeter (four wire).
Figure 8 presents the time dependence of the frequency reading ( f o u t ) and temperature ( T ) of the toluene. Similar graphs were obtained for 2-propanol and water, as well.
Figure 9 presents the dependence of the measured frequency ( f o u t ) on temperature for all three liquids. The dependence is linear, with the coefficient Δ f o u t / Δ T being 1.024 ± 0.001   Hz / K for toluene, 0.772 ± 0.004   Hz / K for 2-propanol, and 0.505 ± 0.001   Hz / K for water. By knowing the relative permittivity at a given temperature (see Equation (12)), we can now relate the change in the measured frequency to the change in the relative permittivity, as discussed in the next section.

4. Discussion

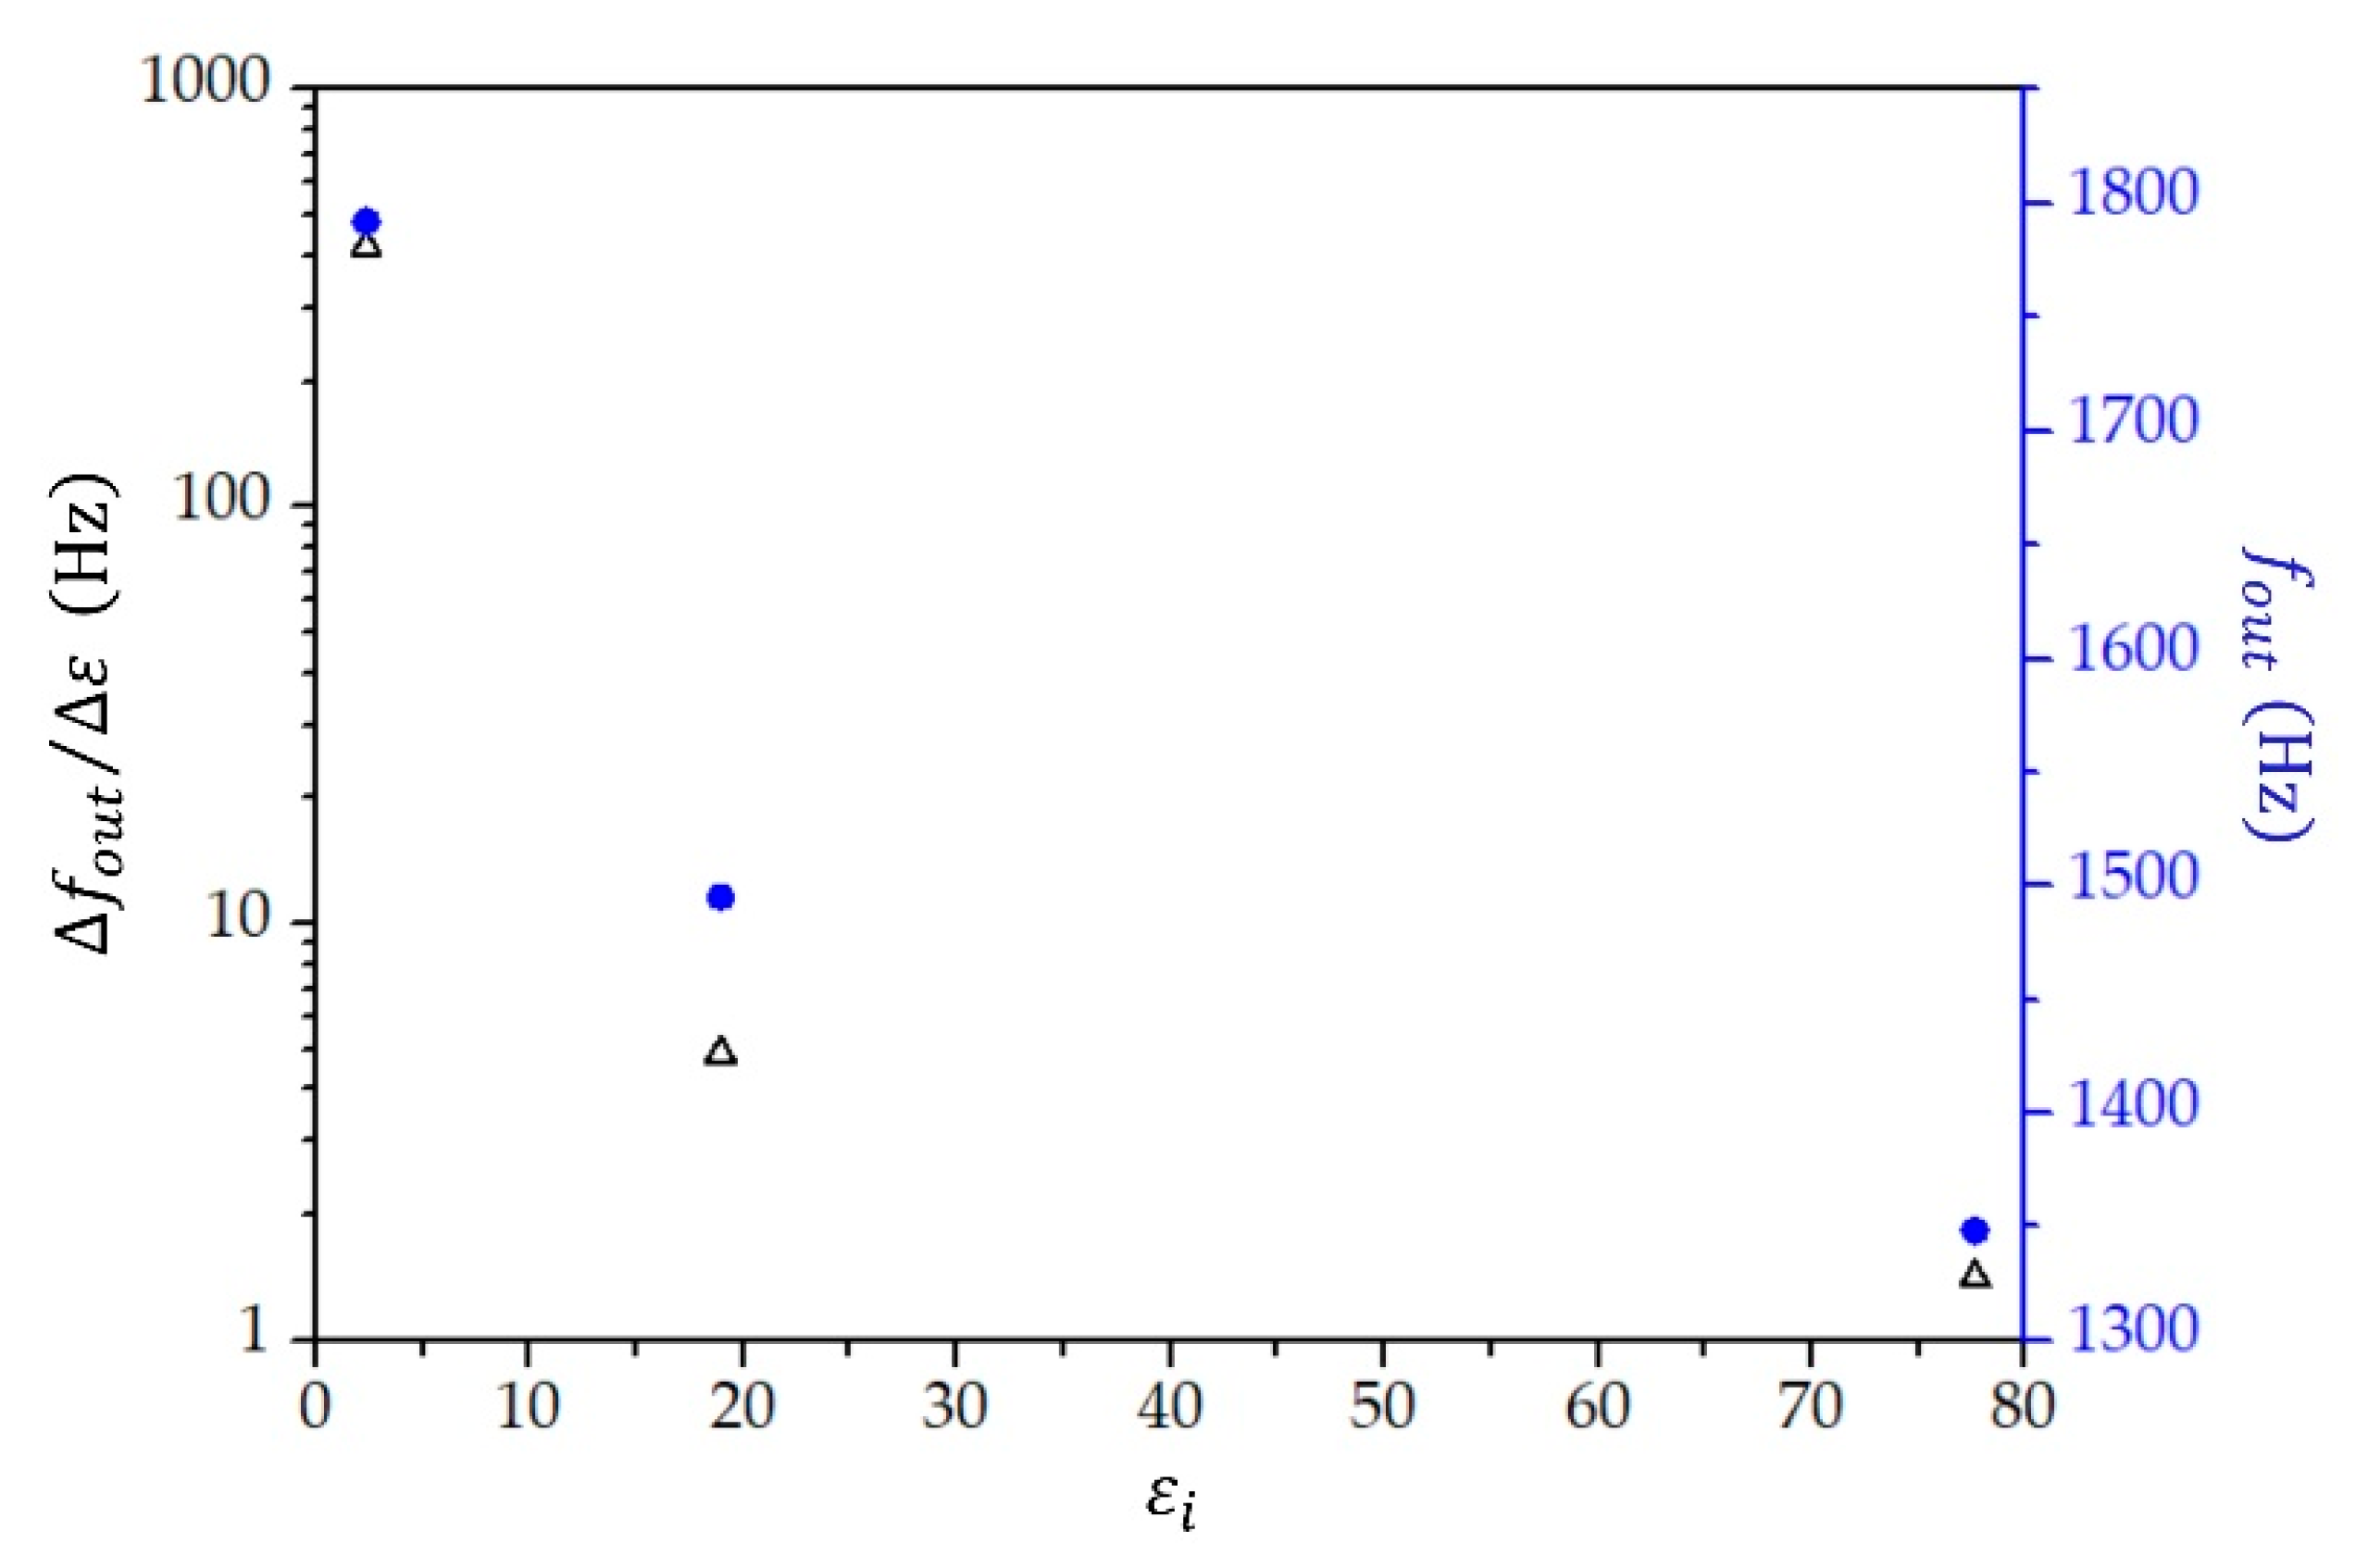
4.1. Sensitivity of the Method

From Equation (12) and the parameter values given in Table 2, we find that the change in the relative permittivity when temperature increases from 24.5   to 29   is 0.011 for toluene, 0.71 for 2-propanol, and 1.6 for water; therefore, Δ ε / Δ T for toluene is 2.44 × 10 3   K 1 , that for 2-propanol is 0.158   K 1 , and that for water is 0.356   K 1 . From the measurements (see Figure 9), we obtained Δ f o u t / Δ T for all three liquids. It is thus straightforward to find that Δ f o u t / Δ ε equals 419.7 ± 0.4   Hz for toluene, 4.89 ± 0.03   Hz for 2-propanol, and 1.419 ± 0.003   Hz for water. As each of these liquids have a different value for the average relative permittivity in the studied temperature range (see Table 2), we can plot the sensitivity Δ f o u t / Δ ε as a function of the relative permittivity (Figure 10). We see that the sensitivity decreases with an increasing value of relative permittivity, and it is by two orders of magnitude higher for liquids, with the value of relative permittivity lower than 10 compared with the sensitivity for liquids with larger relative permittivity.
The measured values of the frequency depart from the linear fit line for no more than δ f o u t = ± 0.1   Hz . Thus, we estimate the relative change in the relative permittivity of the investigated liquid that can be detected by the proposed measuring system as follows:
Δ ε ε i m i n = δ f o u t Δ f o u t Δ ε   1 ε a v   ,
where ε a v is the value of the relative permittivity ε i at the center of the measuring range, i.e., at 27   in our case (these values are given in Table 2). We find Δ ε / ε i m i n = 1 × 10 4 for toluene, 1 × 10 3 for 2-propanol, and 9 × 10 4 for water. This sensitivity is shown in Figure 11. For the purpose of further discussion, we added a provisional (drawing by feeling) sensitivity curve to the three points calculated from the measurements, which we use in our discussion presented below. To obtain a reliable sensitivity curve of the relative permittivity in the range of values between 2.4 and 20, more measurements are required on different liquids with the relative permittivity in this range of values. However, to demonstrate the applicability and limitations of the proposed measuring system, the current measurements are sufficient.
We note that the value measured for f o u t = f o s c f r e f 1 (see Figure 1) depends on the value set for the reference frequency f r e f 1 . This can be either lower or higher than the measured frequency f o s c = f s * * . As the measured frequency ( f * * ) reduces with the increasing value of load capacitance (see Figure 4) and the load capacitance increases with the increasing value of relative permittivity for the investigating liquid (see Equation (10)), we can deduce that, in our measurements, the reference frequency was set to a value lower than the oscillator frequency.

4.2. Detection of Changes in Mixture of Liquids

In this section, we show how the proposed method can be used to detect changes in the dielectric permittivity of mixtures of liquids that do not react if the dielectric properties of one component change, for example, due to the quality of production or aging. To estimate the change in the relative permittivity of the mixture if the relative permittivity of one component changes, we used theoretical models. Out of several available theoretical models, we studied and compared the models by Kraszewski, Bottcher–Bordewijk, Looyenga, Peon–Iglesias, and Lichtenecker–Rother [7,26,27]. All of these models express the effective relative permittivity of a mixture of two liquids in terms of their values of relative permittivity ( ε 1 and ε 2 ) and their volume fractions ( ϕ 1 and ϕ 2 = 1 ϕ 1 ). When the values of relative permittivity of the mixed liquids are similar, all of the models predict practically the same values for the relative permittivity of the mixture. However, when the values of relative permittivity of the constituent liquids differ by an order of magnitude, there is a significant difference among different models, the largest being at ϕ 1 = ϕ 2 = 0.5 . The model by Kraszewski predicts the largest values ( ε K r ) while the model by Lichtenecker–Rother predicts the lowest values ( ε L i ) of relative permittivity for the mixture. As we need the models only to estimate the relative change in the relative permittivity of the mixture if the relative permittivity of one of the components changes, we give theoretical expressions for the relative permittivity only for these two models. Within the model by Kraszewski [7,26], the relative permittivity of the mixture is given by
ε K r = ϕ 1   ε 1 + ϕ 2 ε 2 2   ,  
and within the model by Lichtenecker–Rother [7,26] as
ε L i = ε 1 ϕ 1   ε 2 ϕ 2   .  
Table 3 gives the relative permittivity of a commonly studied mixture [7] of toluene ( ε 1 = 2.4 ) and ethyl alcohol ( ε 2 = 24.1 ), calculated by both models.
By differentiating Equations (14) and (15), it is straightforward to obtain the following expressions:
Δ ε K r ε K r = ϕ 1 ε 1 ε K r   Δ ε 1 ε 1 + ϕ 2 ε 2 ε K r   Δ ε 2 ε 2 + 2 ε 2 ε 1 ε K r Δ ϕ 2   ,  
Δ ε L i ε L i = ϕ 1 Δ ε 1 ε 1 + ϕ 2 Δ ε 2 ε 2 + ln ε 2 ln ε 1 Δ ϕ 2   ,  
which relate the relative changes in the relative permittivity of each liquid and the change in their relative volume to the relative change of the relative permittivity of the mixture. As we estimated the sensitivity of the measuring system (see Figure 11), we can use Equations (16) and (17) to deduce the relative changes of ε 1 , ε 2 , and ϕ 1 (or ϕ 2 ) that can be detected. The relative change in the value of the relative permittivity of the first component can be calculated from Equation (16)
Δ ε 1 ε 1 = 1 ϕ 1 Δ ε K r ε K r ε K r ε 1  
for the model by Kraszewski and from Equation (17)
Δ ε 1 ε 1 = 1 ϕ 1 Δ ε L i ε L i  
for the model by Lichtenecker–Rother. Similarly, Δ ε 2 / ε 2 and Δ ϕ 2 = Δ ϕ 1 can be obtained from Equations (16) and (17). To calculate the right-hand sides of Equations (18) and (19), we note that Δ ε K r / ε K r and Δ ε L i / ε L i are, in fact, the sensitivity Δ ε / ε i m i n given in Figure 11. By using the sensitivity given in Figure 11 and the calculated values of the relative permittivity of the mixture (Table 3), Equations (18) and (19) can be evaluated at different values of ϕ 1 . In such a way, we obtain the minimum relative change in ε 1 that can be detected by the proposed measuring method. The sensitivities predicted by the two theoretical models are given in Figure 12a. We see that the relative changes in the relative permittivity of the toluene of the order of 10 4 can be detected if toluene prevails in the mixture, while at low volume fractions of toluene ( ϕ 1 0.1 ), percentile changes can be detected. Sensitivity decreases if the volume fraction is even lower. The model of Lichtenecker–Rother predicts a slightly higher sensitivity. While the sensitivity for detecting changes in the value of ε 1 strongly depends on the volume fraction of toluene, the sensitivity for detecting changes in the value of the relative permittivity of ethyl alcohol is of the other of 10 3 at volume fractions ϕ 2 > 0.1 and then decreases if ϕ 2 is further reduced.
When the volume fraction of one component is very low ( ϕ < 0.1 ), the measuring method is not very sensitive to the relative change in the relative permittivity of the low volume fraction component. However, we have to point out that the method is still extremely sensitive to any changes in the relative permittivity of the mixture, which would occur, for example, due to temperature variation, the introduction of impurities, etc., because relative changes in the relative permittivity of the mixture of the order of 10 4 10 3 can be detected.
The proposed measuring method is also extremely sensitive to a change in the volume fraction of each liquid. Figure 12b gives the volume fraction change for ethyl alcohol ( Δ ϕ 2 ) that can be detected at a given volume fraction of toluene ( ϕ 1 ). As Δ ϕ 2 = Δ ϕ 1 , the same volume fraction changes in toluene can be detected as well. From Figure 12b, we see that, for the exemplary mixture of toluene and ethyl alcohol, changes in the volume fraction of one component between 5 · 10 5 and 7 · 10 4 can be detected.
In general, for not only mixtures of liquids but also any liquid, we finally point out, that the method can also monitor the temperature stability of a liquid within the range of ± 0.1   K , as can be deduced from the coefficients Δ f o u t / Δ T for the three measured liquids, given in Section 3.

5. Conclusions

We presented a sensor system that opens new possibilities for real-time measurement of the relative permittivity in microfluidics. A high sensitivity and temperature stability of a quartz crystal together with the placement of a capacitive sensor along the microchannel outside the channel allows for a noninvasive and very sensitive measurement of the relative permittivity of the (mixture of) liquids flowing in the channel. This is a major advantage over small sensors placed inside the channel, which measure the relative permittivity in a very small volume and can disturb the flow of the liquid. The method presented in this paper can essentially be applied everywhere where careful monitoring of the dielectric properties of (a mixture of) liquids is required, e.g., in the pharmaceutical industry and medicine.
We showed that, using the proposed measuring system, one can detect relative changes in the relative permittivity of the order of 10 4 for liquids, with the relative permittivity lower than 10 , while for liquids with larger values of relative permittivity, relative changes of the order of 10 3 can be detected. As an example of an application of the method, we showed how it can be used to detect changes in the relative permittivity of one liquid in a mixture of two liquids. Such highly sensitive measurements of dielectric properties of a mixture of liquids, especially ones including alcohols, are very important in chemical and electrochemical processes. We showed that the proposed measuring method is extremely sensitive to detect changes in the volume fraction of the constituting liquids, even if the volume fraction of one liquid is very low. Changes of the order of less that 10 4 can be detected.
Finally, let us compare the presented method with a method that would use a lock-in amplifier or impedance analyzer to measure the changes in the capacitance due to chemical or physical changes in the liquid flowing in the channel. If a lock-in amplifier were used, the change in frequency would be transformed into the output voltage and then into a digital value by a limited number of bits. The measurement error of the order of 0.1% [2] would be too big to detect aF changes in the capacitance. If the capacitance were measured directly with an impedance analyzer [9], we would be limited to a sensitivity of 1% to the maximum 0.1%. Another problem would be the parasitic capacitance of the sensor, which is of the order of a few pF. In the measurement proposed, parasitic capacitance is not important because we measured changes in the frequency of the quartz oscillator and, in such a way, any parasitic capacitance is compensated.

Author Contributions

The research was carried out by V.M., who designed the experiment and analyzed the measurements of relative permittivity for a highly sensitive capacitive quartz crystal, while M.M. supervised the research. All authors have read and agreed to the published version of the manuscript.

Funding

This research was funded by the Slovenian Research Agency (ARRS) through the research core funding no. P2-7436.

Institutional Review Board Statement

Not applicable.

Informed Consent Statement

Not applicable.

Data Availability Statement

All the data is contained within the paper.

Conflicts of Interest

The authors declare no conflict of interest.

References

  1. Jain, V.; Hole, A.; Deshmukh, R.; Patrikar, R. Dynamic capacitive sensing of droplet parameters in a low-cost open EWOD system. Sens. Actuators A Phys. 2017, 263, 224–233. [Google Scholar] [CrossRef]
  2. Bilican, I.; Bahadir, T.; Bilgin, K.; Guler, M.T. Alternative screening method for analyzing the water samples through an electrical microfluidics chip with classical microbiological assay comparison of P. aeruginosa. Talanta 2020, 219, 121293. [Google Scholar] [CrossRef] [PubMed]
  3. Ghafar-Zadeh, E.; Sawan, M.; Chodavarapu, V.P.; Hosseini-Nia, T. Bacteria Growth Monitoring Through a Differential CMOS Capacitive Sensor. IEEE Trans. Biomed. Circuits Syst. 2010, 4, 232–238. [Google Scholar] [CrossRef] [PubMed]
  4. Stagni, C.; Guiducci, C.; Benini, L.; Ricco, B.; Carrara, S.; Samori, B.; Paulus, C.; Schienle, M.; Augustyniak, M.; Thewes, R. CMOS DNA Sensor Array With Integrated A/D Conversion Based on Label-Free Capacitance Measurement. IEEE J. Solid State Circuits 2006, 41, 2956–2964. [Google Scholar] [CrossRef]
  5. Iyuke, S.; Ntombenhle Hlongwane, G.; Daramola Michael, O.; Dodoo-Arhin, D.; Moothi, K.; Wamwangi, D. DNA hybridisation sensors for product authentication and tracing: State of the art and challenges. S. Afr. J. Chem. Eng. 2019, 27, 16–34. [Google Scholar]
  6. Nguyen, N.-T.; Wereley, S.T.; Shaegh, S.A.M. Fundamentals and Applications of Microfluidics, 3rd ed.; Artech House: Norwood, MA, USA, 2019. [Google Scholar]
  7. Ramana, C.V.V.; Kumar, A.B.V.K.; Kumar, A.S.; Kumar, M.A.; Moodley, M.K. Dielectric and excess dielectric constants in non polar + polar binary liquid mixtures of toluene with alcohols at 303, 313 and 323 K. Thermochim. Acta 2013, 566, 130–136. [Google Scholar] [CrossRef]
  8. El Khaled, D.; Novas, N.; Gázquez, J.A.; García, R.M.; Manzano-Agugliaro, F. Alcohols and alcohols mixtures as liquid biofuels: A review of dielectric properties. Renew. Sustain. Energy Rev. 2016, 66, 556–571. [Google Scholar] [CrossRef]
  9. Offenzeller, C.; Hintermüller, M.A.; Hilber, W.; Jakoby, B. A dielectric coating for improved performance of capacitive sensors in all-polymer microfluidic devices. Microelectron. Eng. 2020, 223, 111220. [Google Scholar] [CrossRef]
  10. Hintermüller, M.A.; Offenzeller, C.; Knoll, M.; Hilber, W.; Jakoby, B. Embedded screen-printed transducers in bulk polymer microfluidic devices. Eingebettete Siebgedruckte Transducer Polym. Mikrofluidischen Syst. 2020, 137, 128. [Google Scholar] [CrossRef] [Green Version]
  11. Migoń, D.; Wasilewski, T.; Suchy, D. Application of QCM in Peptide and Protein-Based Drug Product Development. Molecules 2020, 25, 3950. [Google Scholar] [CrossRef] [PubMed]
  12. Pohanka, M. Overview of Piezoelectric Biosensors, Immunosensors and DNA Sensors and Their Applications. Materials 2018, 11, 448. [Google Scholar] [CrossRef] [PubMed] [Green Version]
  13. Li, B.-R.; Shen, M.-Y.; Yu, H.-H.; Li, Y.-K. Rapid construction of an effective antifouling layer on a Au surface via electrodeposition. Chem. Commun. 2014, 50, 6793–6796. [Google Scholar] [CrossRef] [PubMed]
  14. Matko, V.; Safaric, R. Major Improvements of Quartz Crystal Pulling Sensitivity and Linearity Using Series Reactance. Sensors 2009, 9, 8263–8270. [Google Scholar] [CrossRef] [PubMed]
  15. Matko, V.; Milanovič, M. Detection Principles of Temperature Compensated Oscillators with Reactance Influence on Piezoelectric Resonator. Sensors 2020, 20, 802. [Google Scholar] [CrossRef] [PubMed] [Green Version]
  16. Euroquartz. Crystal Theory. Available online: https://euroquartz.co.uk/media/1879/tech-notes.pdf (accessed on 26 April 2021).
  17. Euroquartz. SC-Cut Crystal Reference Oscillator OCXO-OC18T5S. Available online: https://www.wdi.ag/specs/euroquartz/oszillatoren/ocxo/OC18T5S.pdf (accessed on 26 March 2021).
  18. Vig, J.R. Quartz Crystal Resonators and Oscillators for Frequency Control and Timing Applications. IEEE Ferroelectric and Frequency Control Society. Available online: https://ieee-uffc.org/download/quartz-crystal-resonators-and-oscillators-for-frequency-control-and-timing-applications-a-tutorial-2/ (accessed on 26 March 2021).
  19. Statek. The Quartz Crystal Model and Its Frequencies. Technical Note 32. Available online: http://statek.com/wp-content/uploads/2018/03/tn32.pdf (accessed on 26 April 2021).
  20. Schrüfer, E. Electrical Measurement: Quartz as a Frequency Reference, 5th ed.; Carl Hanser Verlag: München, Germany, 1992; pp. 405–414. [Google Scholar]
  21. Matko, V. Next Generation AT-Cut Quartz Crystal Sensing Devices. Sensors 2011, 11, 4474–4482. [Google Scholar] [CrossRef] [PubMed] [Green Version]
  22. Wang, S.-Y.; Neubig, B.; Sato, K.; Hosoda, T.; Seydel, E.; Wu, J.-H.; Ma, T.-F.; Wang, J. Aging models and parameters of quartz crystal resonators and oscillators. In Proceedings of the 2015 Symposium on Piezoelectricity, Acoustic Waves, and Device Applications (SPAWDA), Jinan, China, 5 January 2015. [Google Scholar] [CrossRef]
  23. Shuyu, L.; Jie, X. Effect of the Matching Circuit on the Electromechanical Characteristics of Sandwiched Piezoelectric Transducers. Sensors 2017, 17, 329. [Google Scholar]
  24. Stanford. QCM100-Quartz Microbalance Theory and Calibration. Available online: http://www.thinksrs.com/downloads/PDFs/ApplicationNotes/QCMTheoryapp.pdf (accessed on 26 March 2021).
  25. Lide, R.D. CRC Handbook of Chemistry and Physics: Permittivity of Liquids; CRC Press LLC: Boca Raton, FL, USA, 2005; pp. 153–175. [Google Scholar]
  26. Prasad, T.V.; Vishwam, T.; Manjula, V.; Raju, K.C.J.; Aparna, Y. Dielectric relaxation and thermodynamic study of Dimethylformamide/1,4-Butanediol binary mixtures in the temperature range 298K–323K. Phys. B Phys. Condens. Matter 2020, 588, 412142. [Google Scholar] [CrossRef]
  27. Zhuang, B.; Ramanauskaite, G.; Koa, Z.Y.; Wang, Z.-G. Like dissolves like: A first-principles theory for predicting liquid miscibility and mixture dielectric constant. Sci. Adv. 2021, 7, 1–7. [Google Scholar] [CrossRef] [PubMed]
Figure 1. Experimental setup for the measurement of the relative permittivity of fluids flowing through microchannels with the use of an oscillator in connection with a capacitance-dependent crystal Q and a sensing capacitor, which is positioned on the external side of an open-ended glass tube. The guard electrodes positioned on opposite sides of the open-ended glass tube reduce the fringing field effect [6].
Chemosensors 09 00230 g001
Figure 2. Equivalent electric circuit of the sensorial part of the experimental setup. C l is the capacitance of the microchannel. The values of the physical quantities representing the quartz crystal equivalent circuit are R 1 = 10   Ω ,   L 1 = 40.6   mH , C 1 = 25   fF ,     C 0 = 4   pF , quality Q = 229 10 3 ,   f s = 5   MHz , and inductance L l = 0.25   mH .
Chemosensors 09 00230 g002
Figure 3. The change ( Δ f ) in the resonant frequency ( f s ) as a function of temperature ( T ) at different values of the crystal cut angle (−1′, 0′, and 1′). The intersection of the cubic parabola is at T r e f = 25   .
Chemosensors 09 00230 g003
Figure 4. Resonant frequency in units of the series resonant frequency ( f s ) of the quartz crystal without a compensation of C 0 ( f s * ) and with the compensation of C 0 ( f s * * ) as a function of the load capacitance C l . The compensation of C 0 leads to the linearization of the dependence and to an increase in the sensitivity Δ f s * * / Δ C l .
Chemosensors 09 00230 g004
Figure 5. (a) The cross section of a microchannel and (b) a test tube and their equivalent circuits of capacitors. The red curved lines present the electrode. For the description of symbols, see the text.
Chemosensors 09 00230 g005
Figure 6. The oscillator voltage ( V o s c ) and temperature of the environment ( T e ) as a function of time.
Chemosensors 09 00230 g006
Figure 7. The measured frequency ( f o u t ) as a function of time ( t ) when the test tube was filled with 2-propanol.
Chemosensors 09 00230 g007
Figure 8. The measured frequency ( f o u t ) and temperature ( T ) of toluene as a function of time ( t ).
Chemosensors 09 00230 g008
Figure 9. The dependence of the measured frequency ( f o u t ) on temperature ( T ) for (a) toluene, (b) 2-propanol, and (c) water. The blue straight lines are linear fits to the measured data.
Chemosensors 09 00230 g009aChemosensors 09 00230 g009b
Figure 10. The sensitivity Δ f o u t / Δ ε (black triangles) and measured frequency f o u t (filled blue circles) as a function of relative permittivity ( ε i ).
Chemosensors 09 00230 g010
Figure 11. The minimum detected relative change in the relative permittivity Δ ε / ε i m i n as a function of the relative permittivity ε i (red squares). The dashed blue curve presents a sensitivity curve drawn by feeling and serves as a guide for the eye.
Chemosensors 09 00230 g011
Figure 12. (a) The relative change in the dielectric permittivity of toluene ( Δ ε 1 / ε 1 ) and (b) the relative change in the volume fraction of ethyl alcohol ( Δ ϕ 2 ), which can be detected by the measuring system, as a function of the volume fraction of toluene ( ϕ 1 ) in the mixture of toluene and ethyl alcohol. The blue curve (circles) presents the sensitivity obtained from the relative permittivity calculated by the model of Kraszewski, and the black curve (triangles) presents that by the model of Lichtenecker-Rother.
Chemosensors 09 00230 g012
Table 1. The sensitivity d C l / d ε i calculated from Equation (11) for water, 2-propanol, and toluene at 20   in a microchannel and test tube made of silica ( ε g = 3.78 ) and iron ( ε g = 8.38 ) glass. The values of the relative permittivity of liquids are given by Equation (12) and by the parameters in Table 2.
d C l / d ε i ( p F )
Silica glassIron glass
MicrochannelTest tubeMicrochannelTest tube
Water 1.4 × 10 3 7.9 × 10 3 5.9 × 10 3 2.6 × 10 2
2-Propanol 1.6 × 10 2 5.1 × 10 2 5.0 × 10 2 9.9 × 10 2
Toluene 0.18 0.170.260.19
Table 2. The relative permittivity ( ε i ) at 27   of the liquids used for calibration, measured in static fields or at low frequencies and standard atmospheric pressure [25], and the parameters a , b , and c of the polynomial fitting (Equation (12)), valid in the temperature range 0−40 °C.
Liquid ε i a b [ K 1 ] c [ K 2 ]
Toluene 2.369 3.2584 3.4410 × 10 3 1.5937 × 10 6
2-Propanol 18.947 1.0416 × 10 2 4.1011 × 10 1 4.2049 × 10 4
Water 77.647 2.4921 × 10 2 7.9069 × 10 1 7.2997 × 10 4
Table 3. Relative permittivity calculated from the model of Kraszewski ( ε K r ) and Lichtenecker–Rother ( ε L i ) for a mixture of toluene ( ε 1 = 2.4 ) and ethyl alcohol ( ε 2 = 24.1 ) at different concentrations of toluene ( ϕ 1 ) at 25 °C.
ϕ 1 ε K r ε L i
024.1024.10
0.120.9119.14
0.217.9515.20
0.315.2212.06
0.412.719.58
0.510.437.61
0.68.376.04
0.76.544.80
0.84.933.81
0.93.553.02
12.402.40
Publisher’s Note: MDPI stays neutral with regard to jurisdictional claims in published maps and institutional affiliations.

