
Phosphatidylethanolamine Deficiency and Triglyceride Overload in Perilesional Cortex Contribute to Non-Goal-Directed Hyperactivity after Traumatic Brain Injury in Mice

 , and
, and 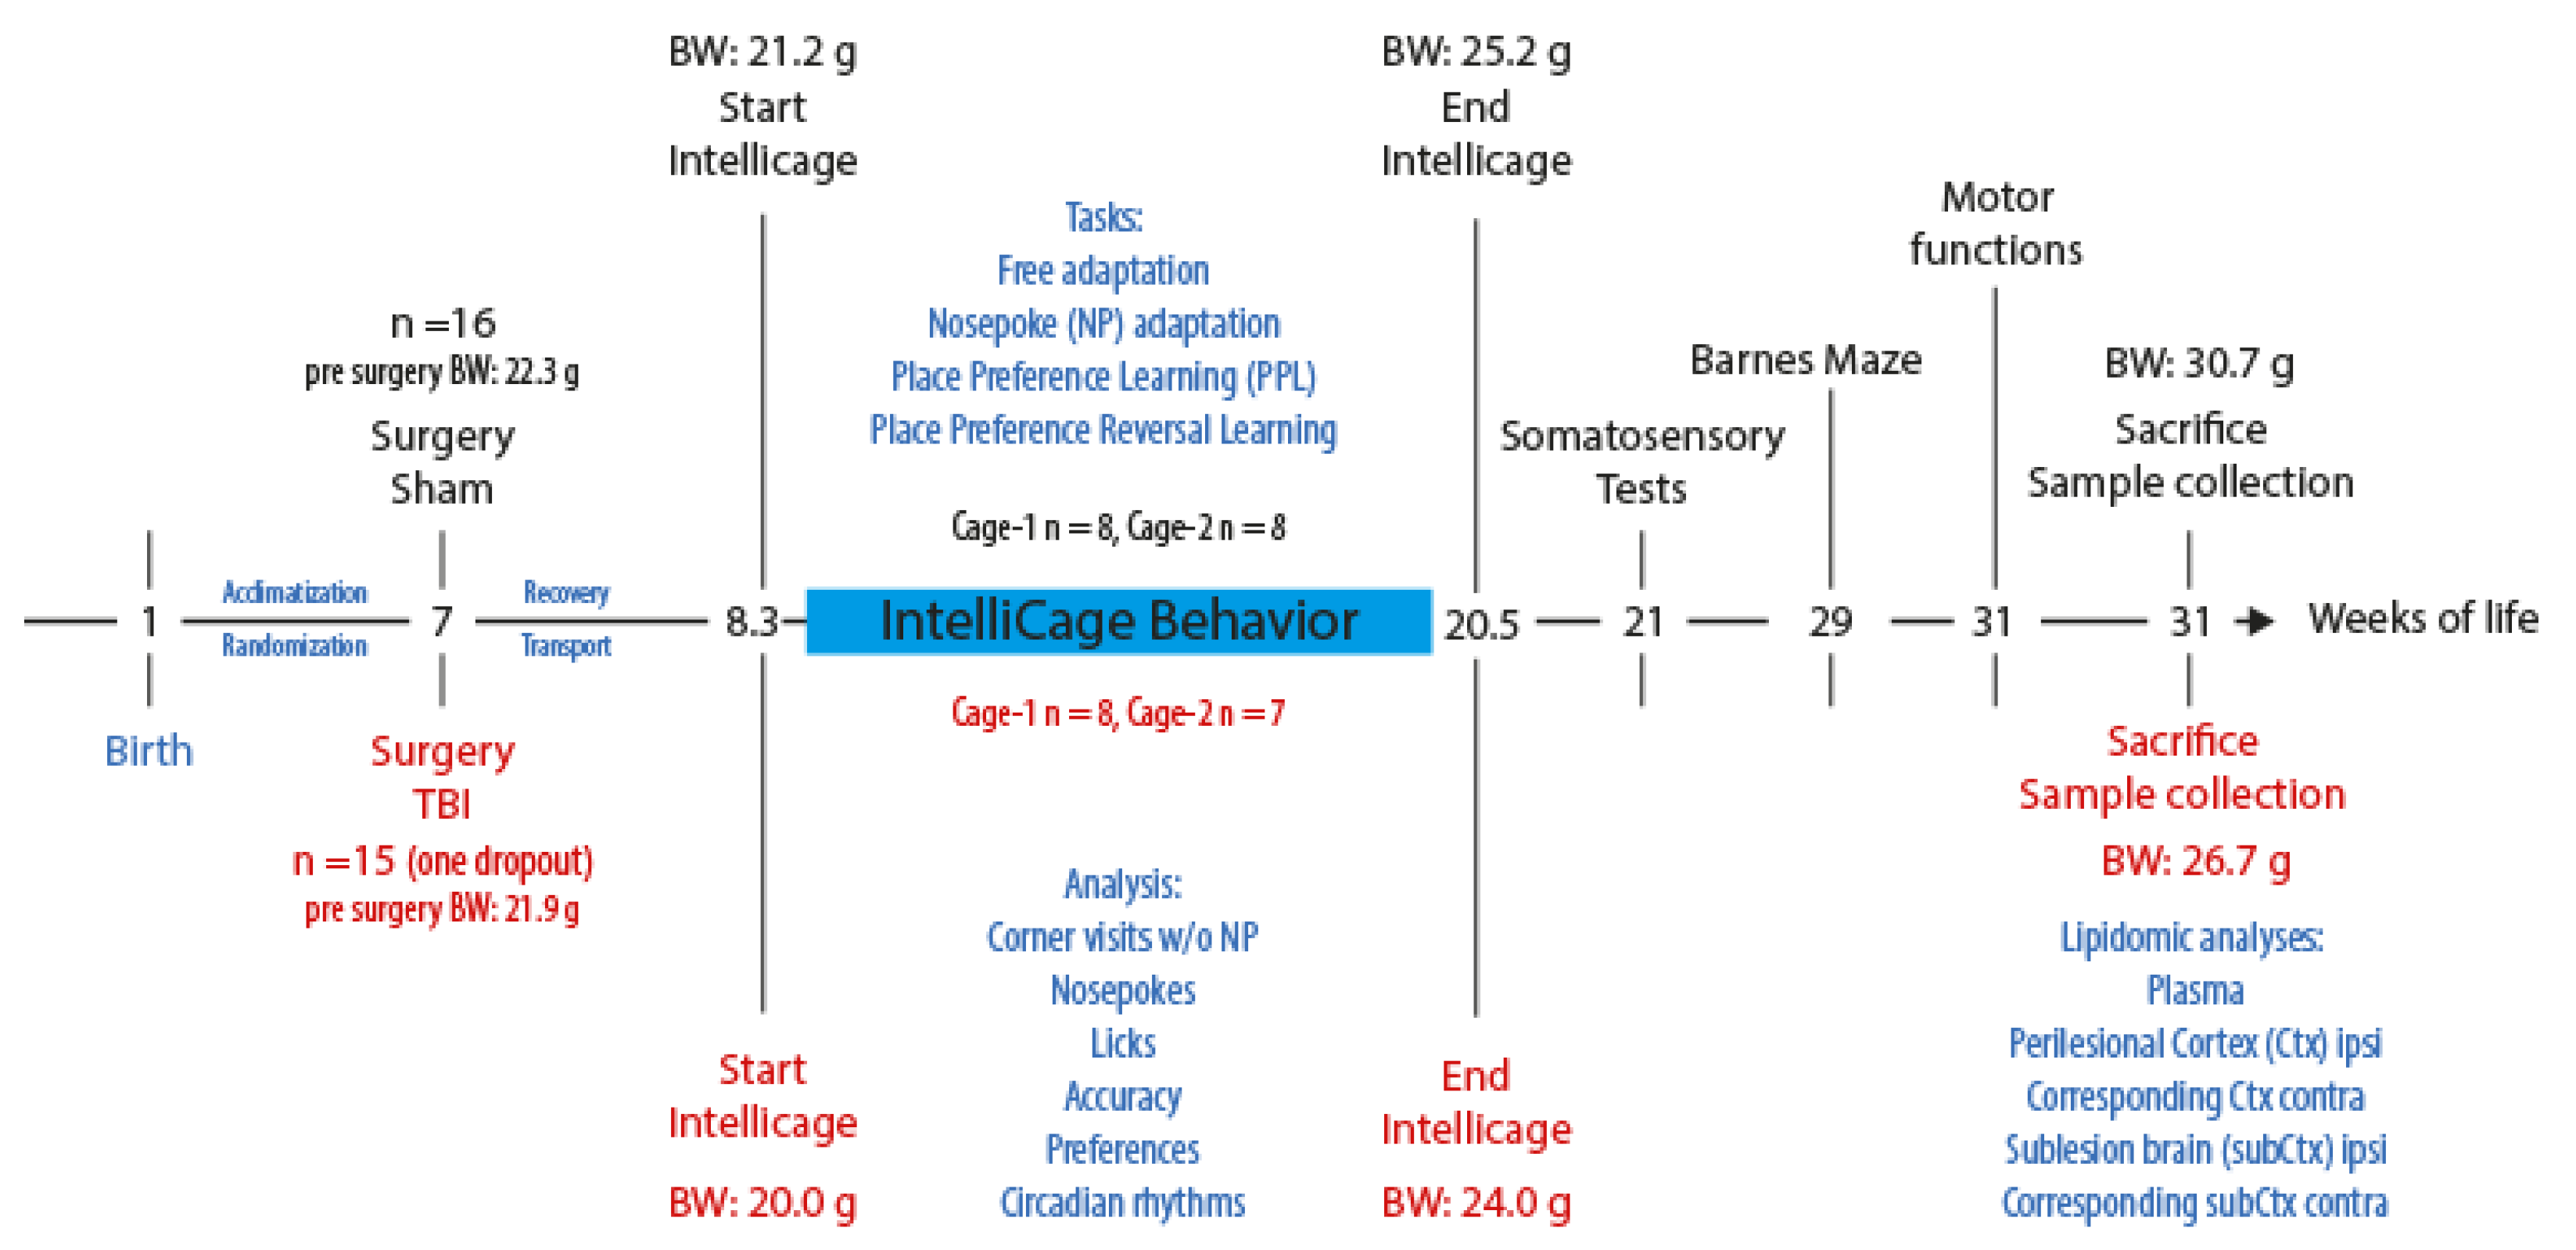
Abstract
:1. Introduction
2. Materials and Methods
2.1. Mice
2.2. Controlled Cortical Impact Model of Traumatic Brain Injury
2.3. IntelliCage Behavior
2.4. Plasma and Tissue Collection and Lipidomic Analyses
2.5. Oil Red O Histology
2.6. Data Analysis and Statistics
3. Results
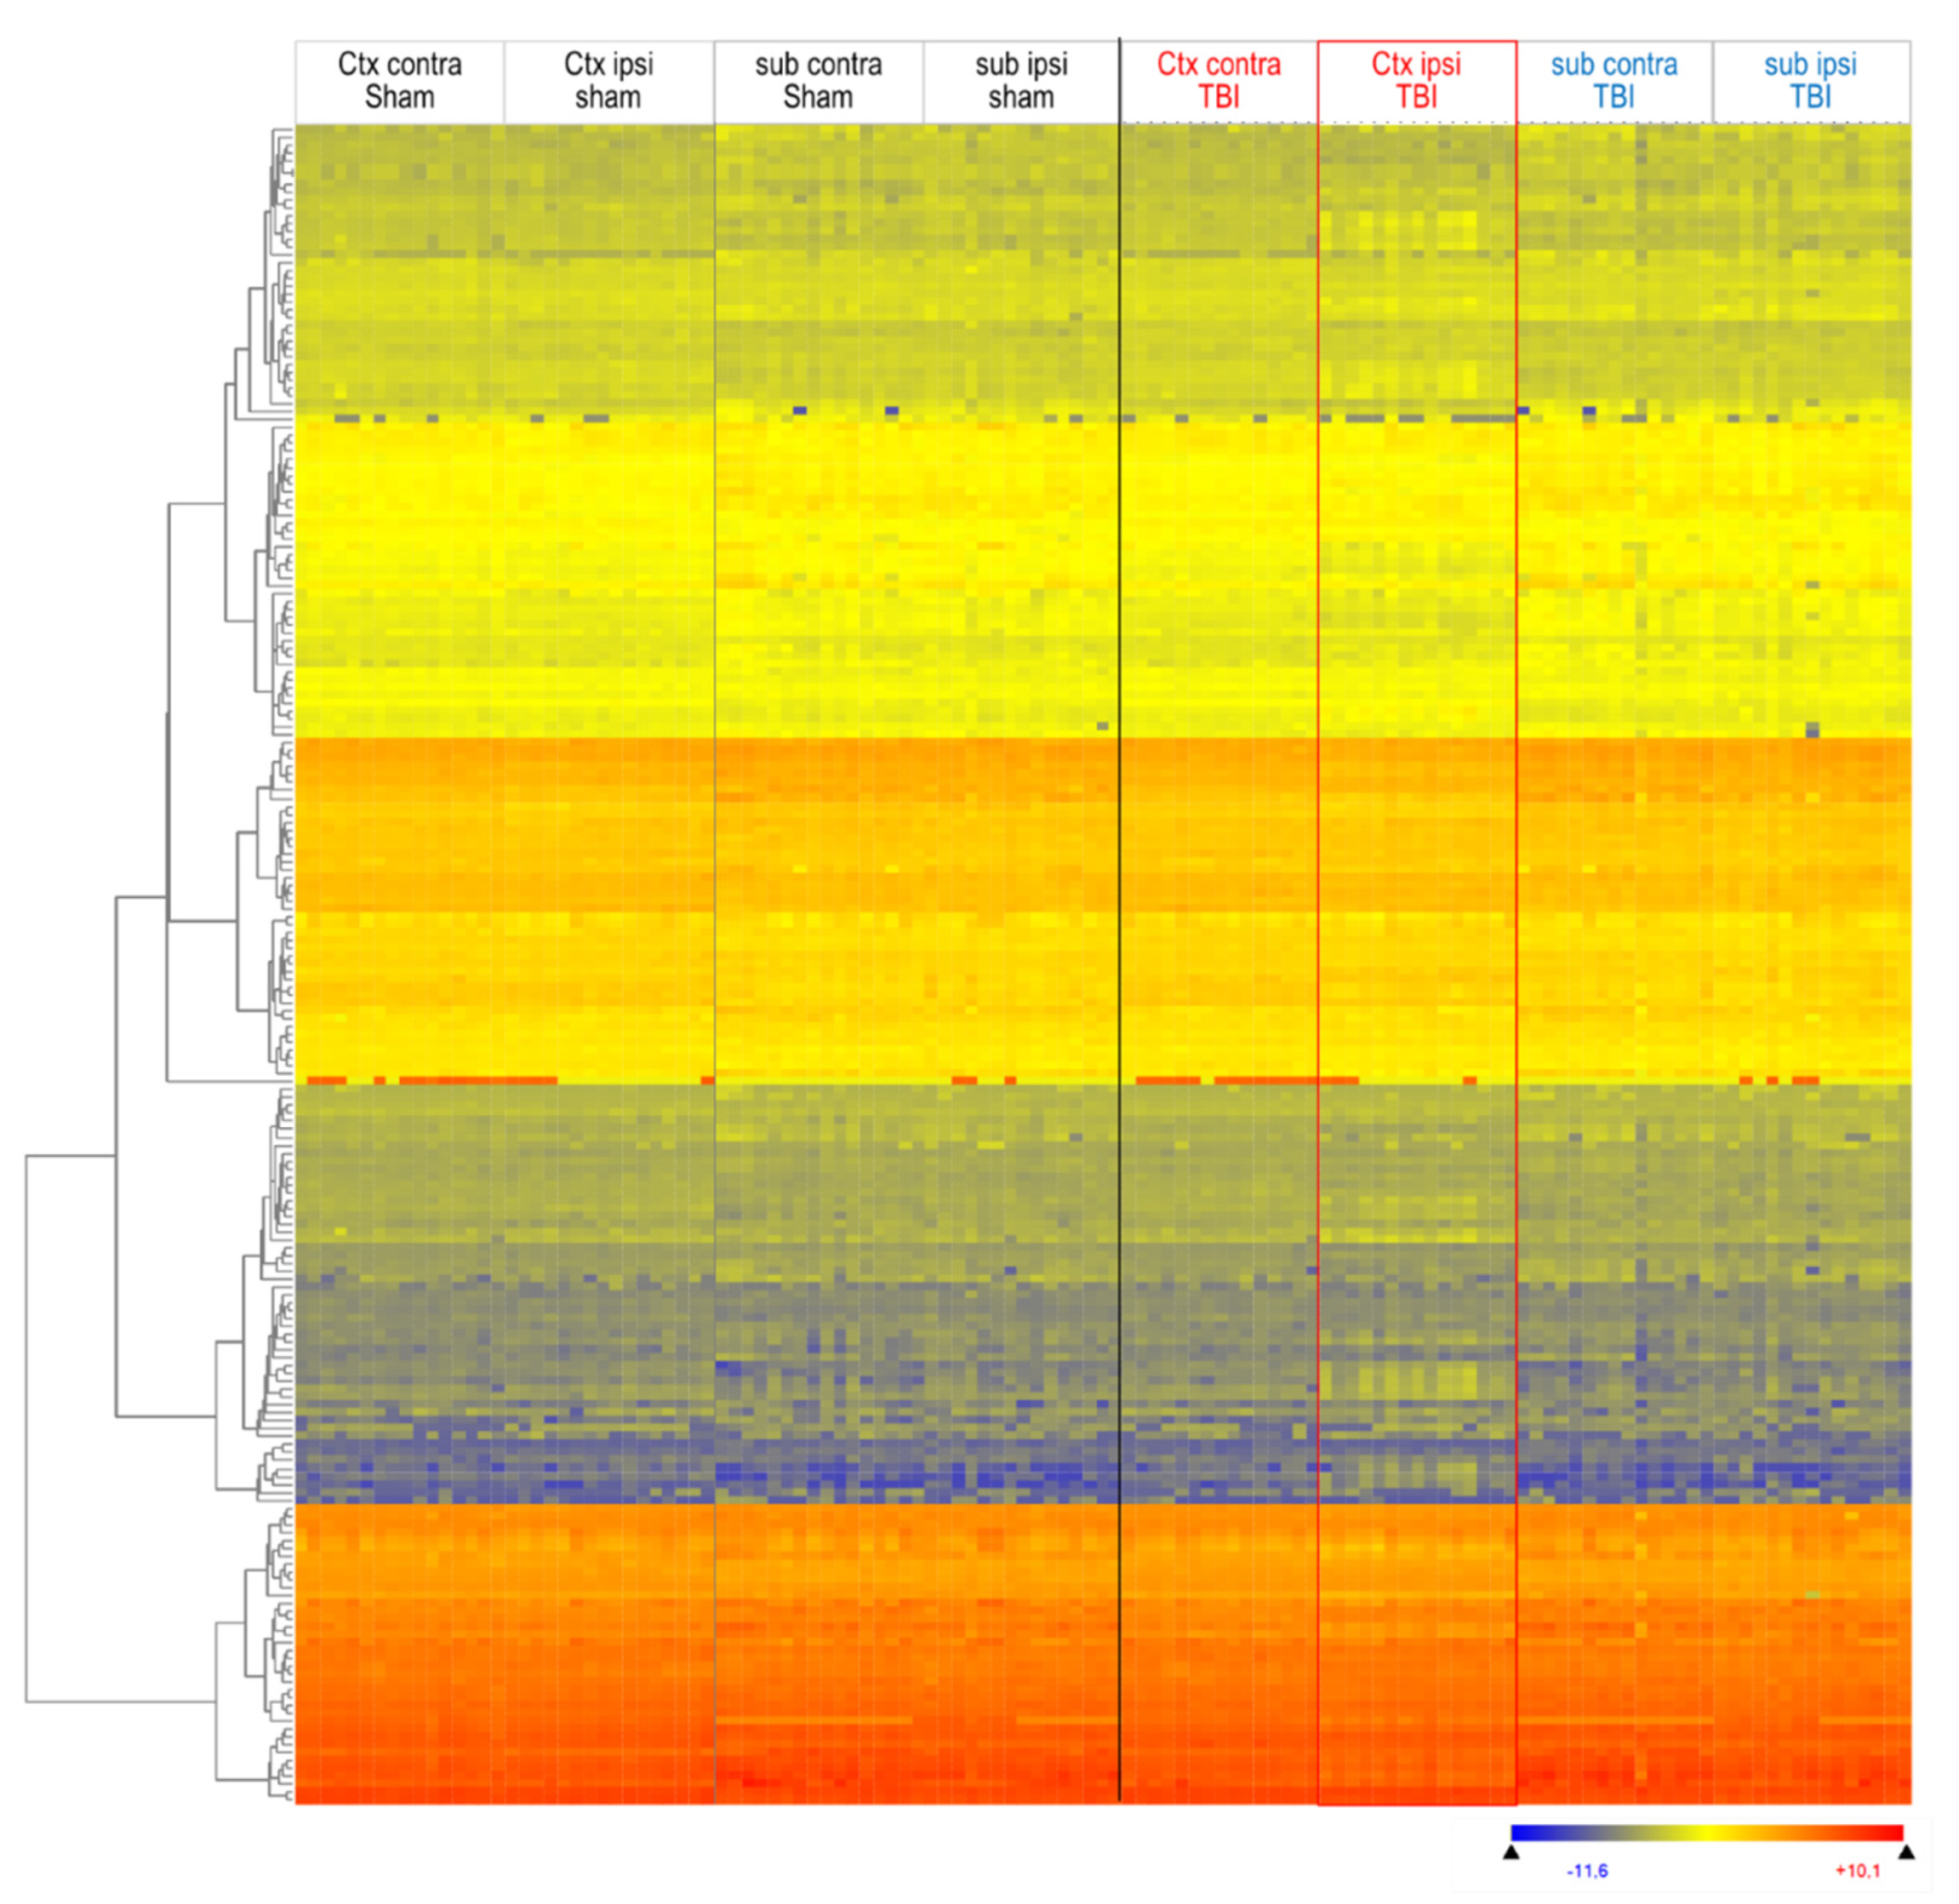
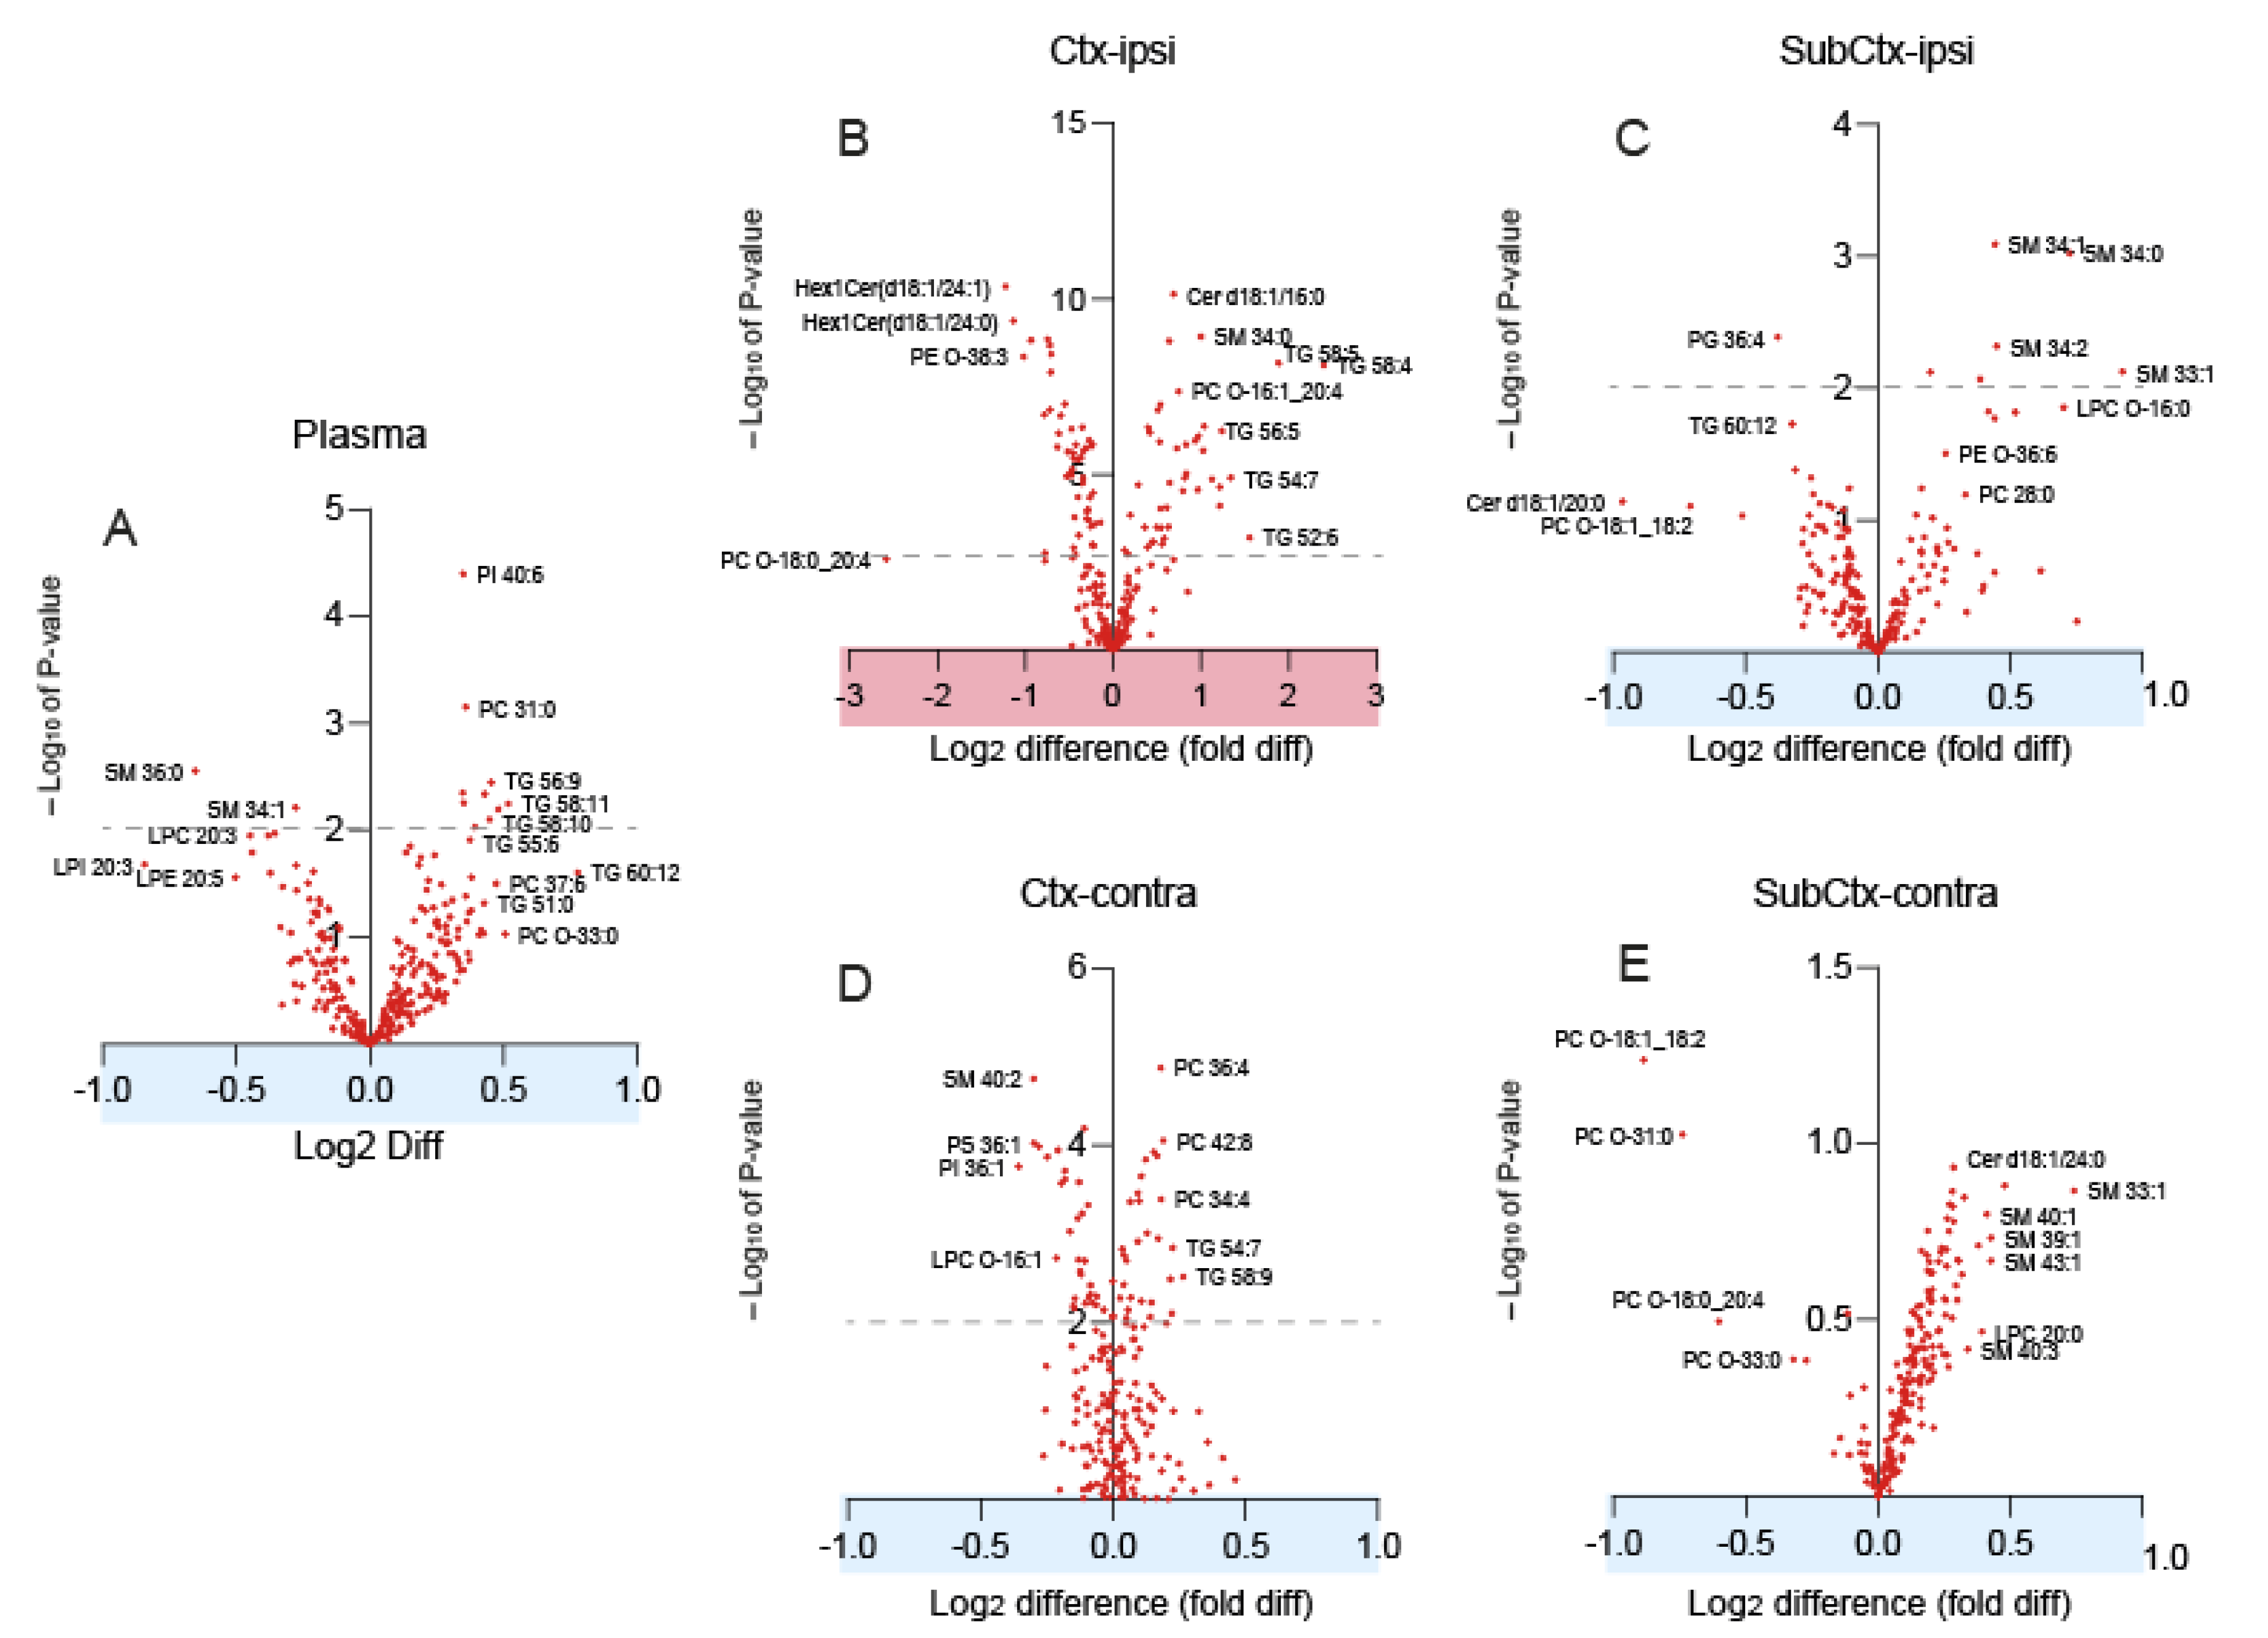
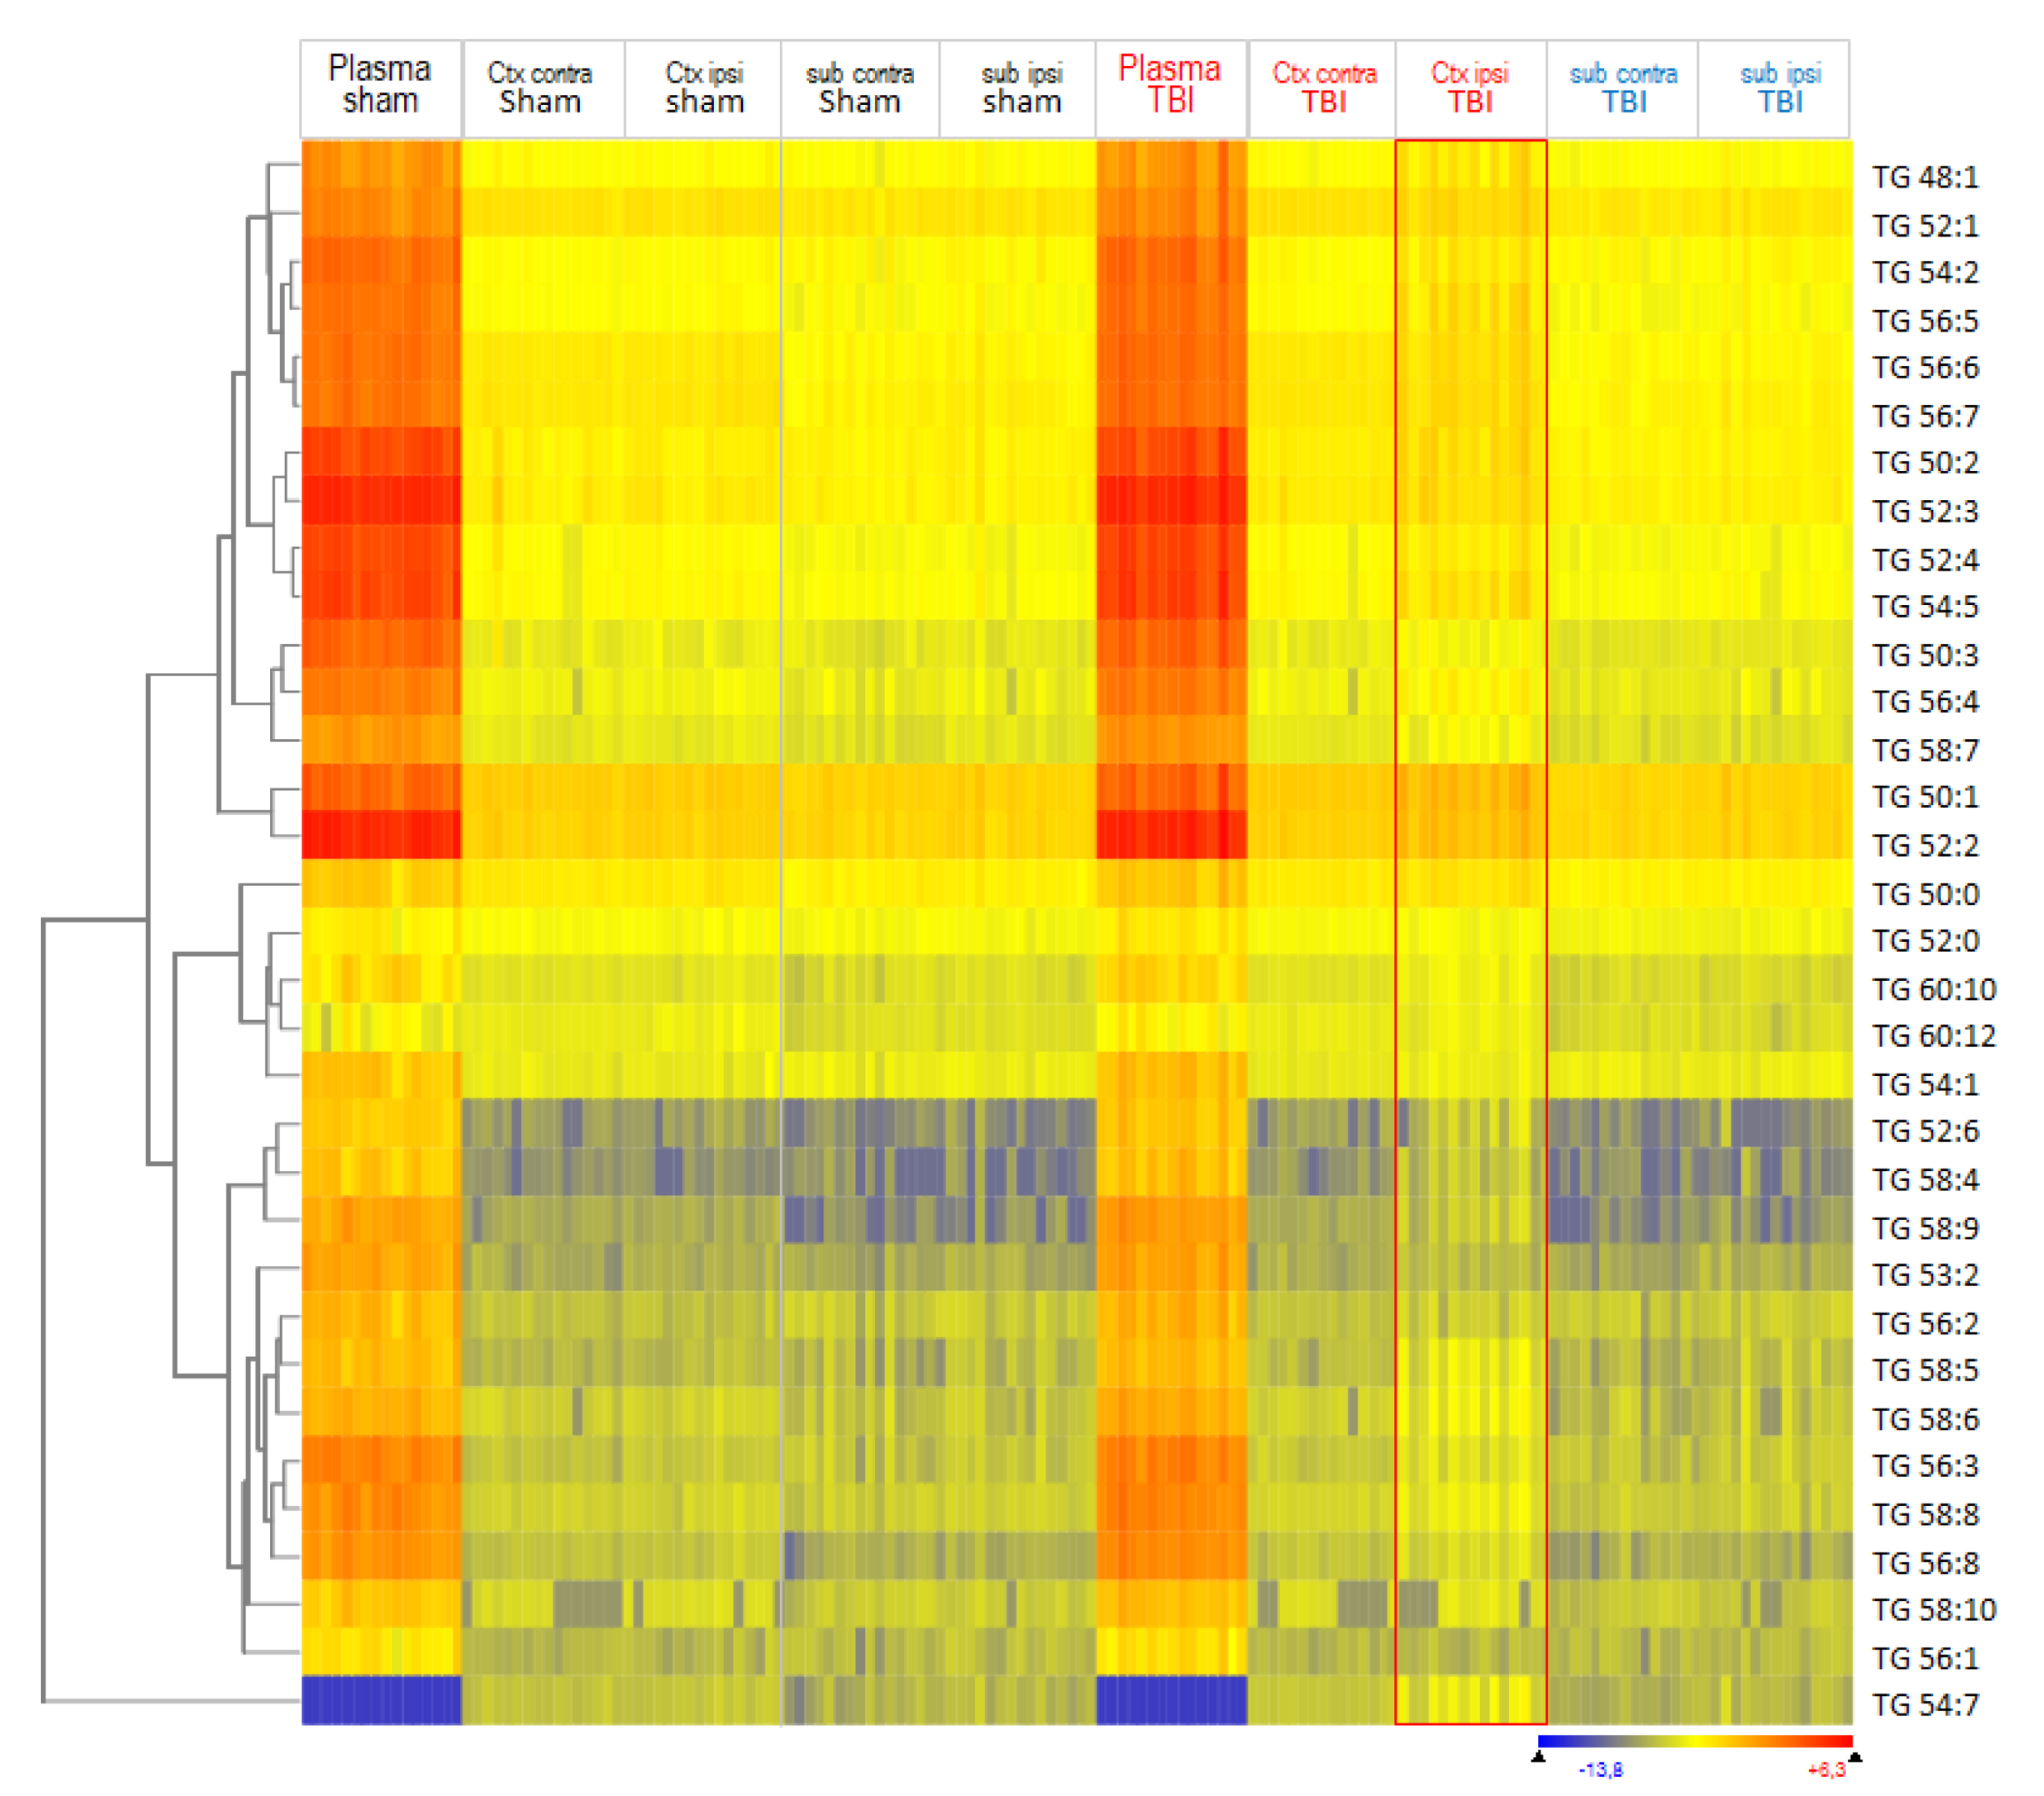
3.1. Lipidome Patterns in Brain Tissue and Plasma
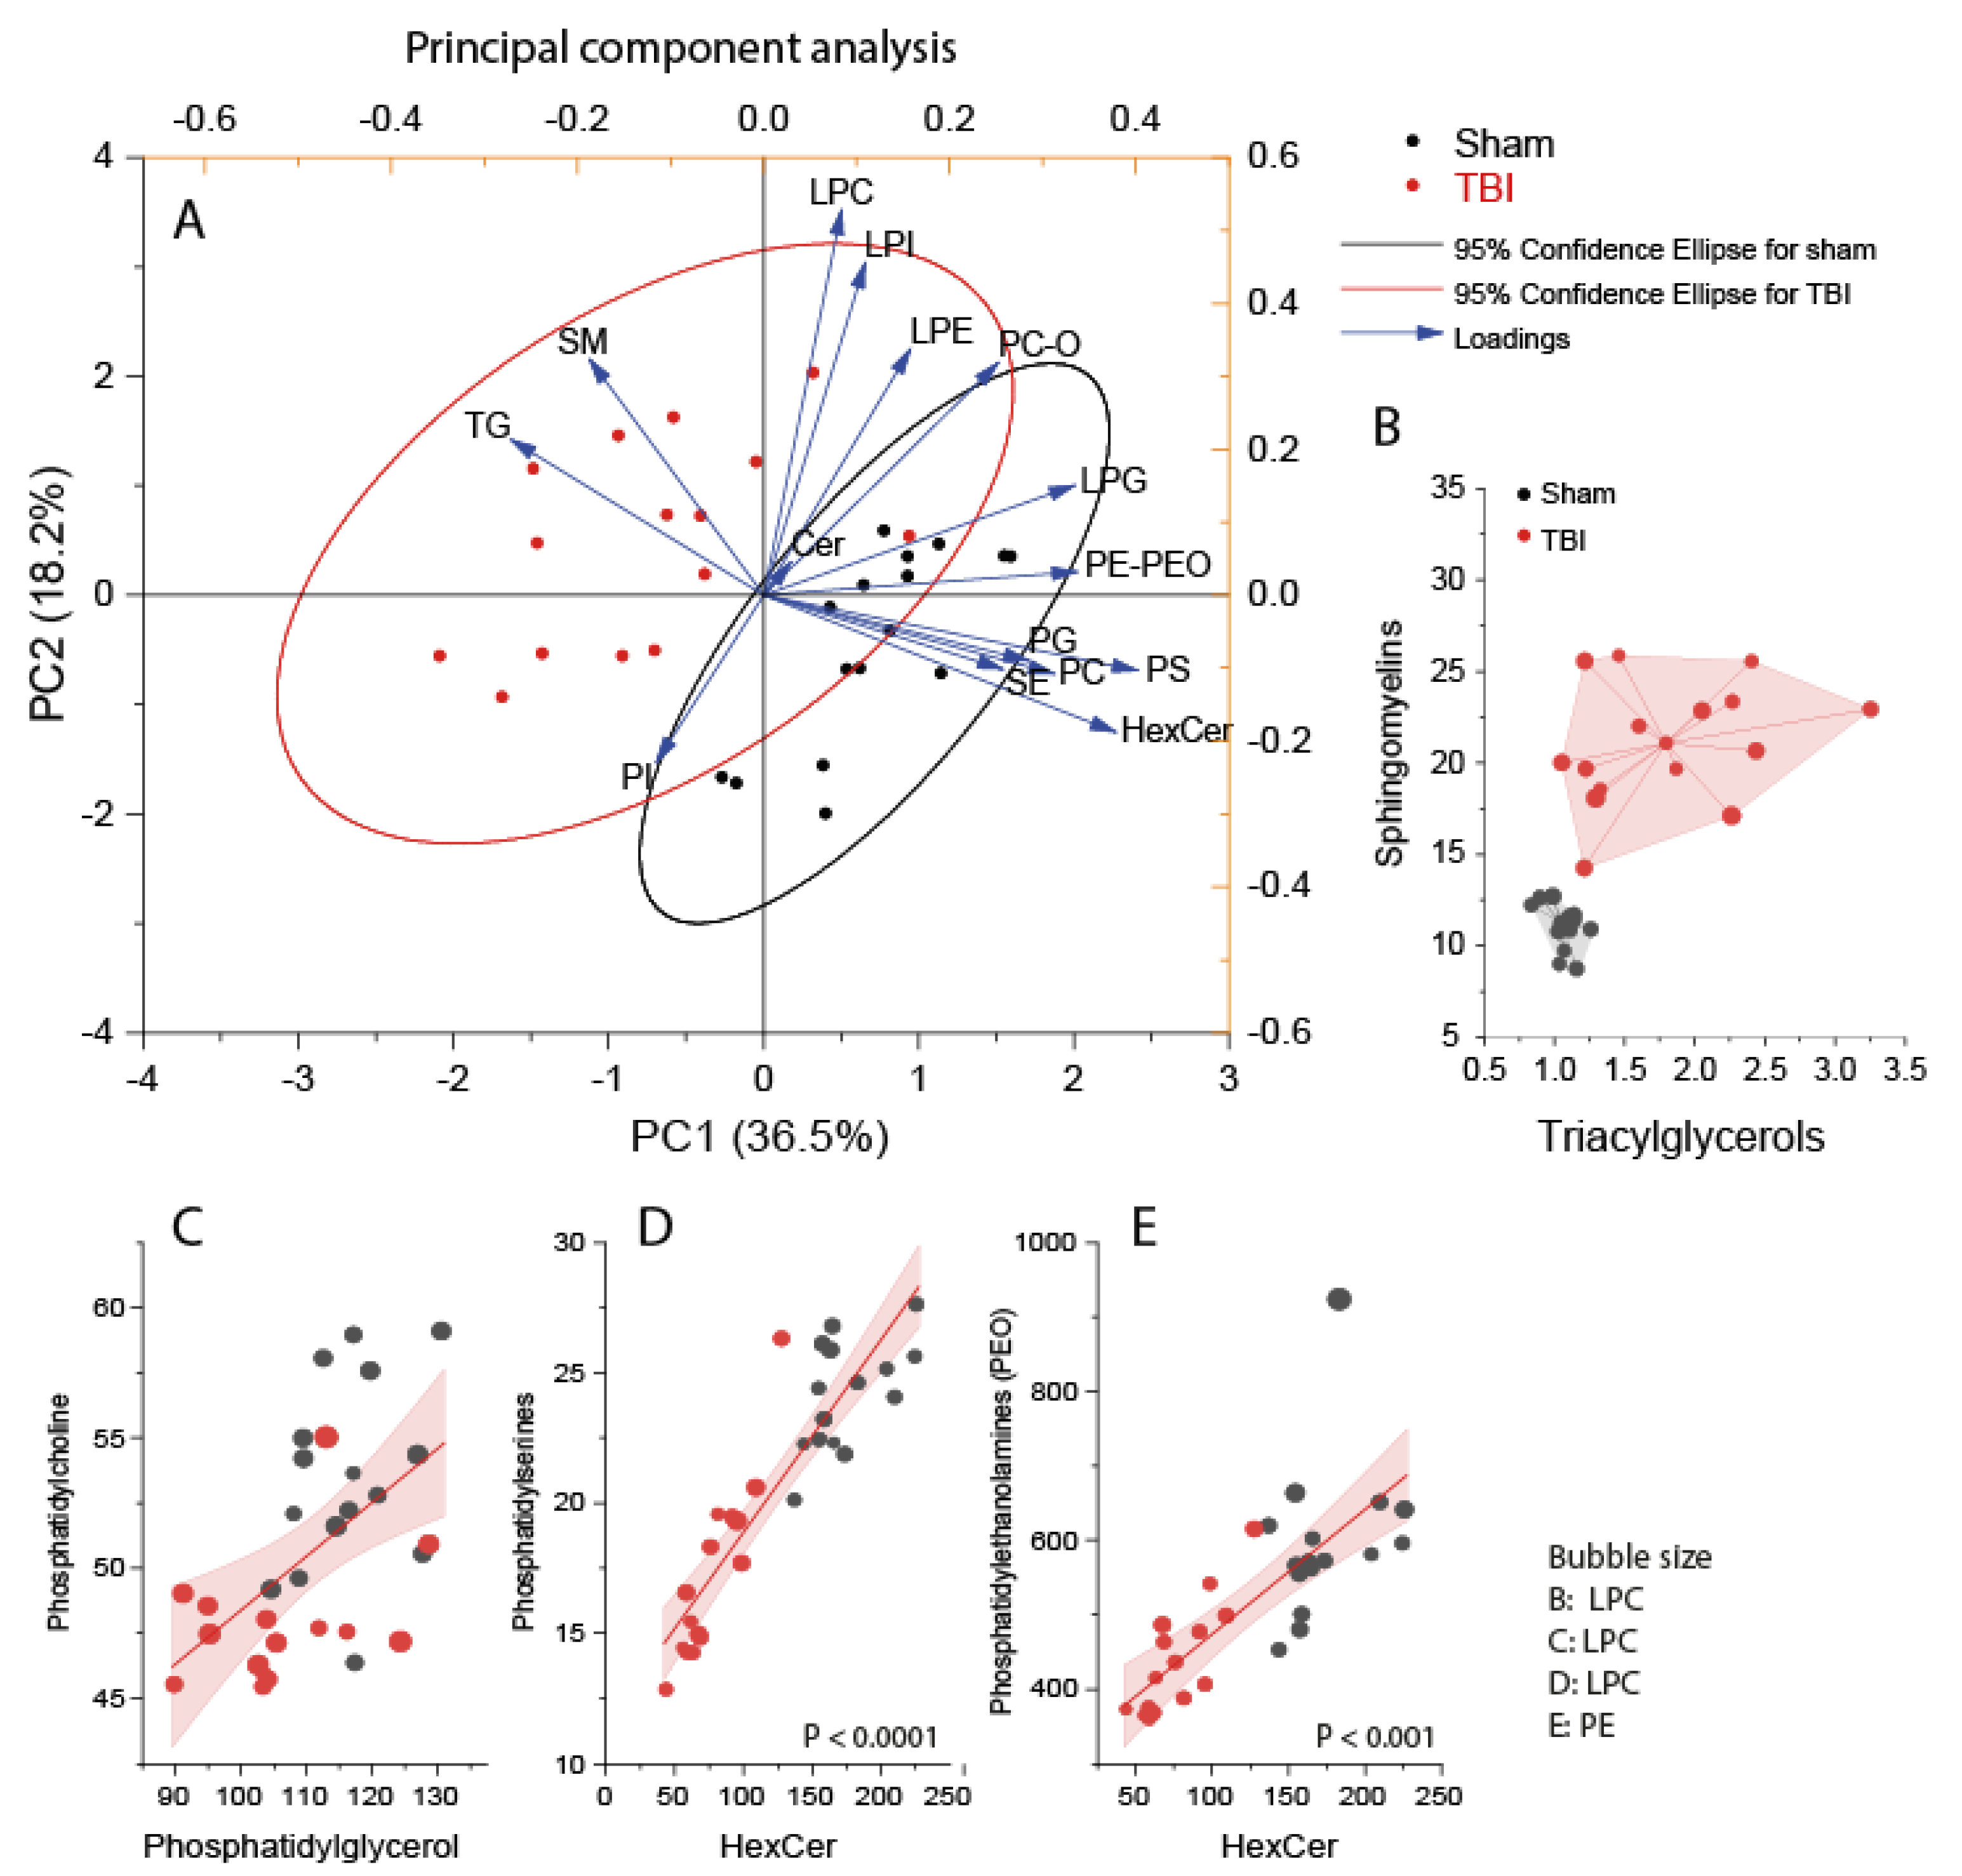
3.2. Interrelationship of Deregulated Lipids
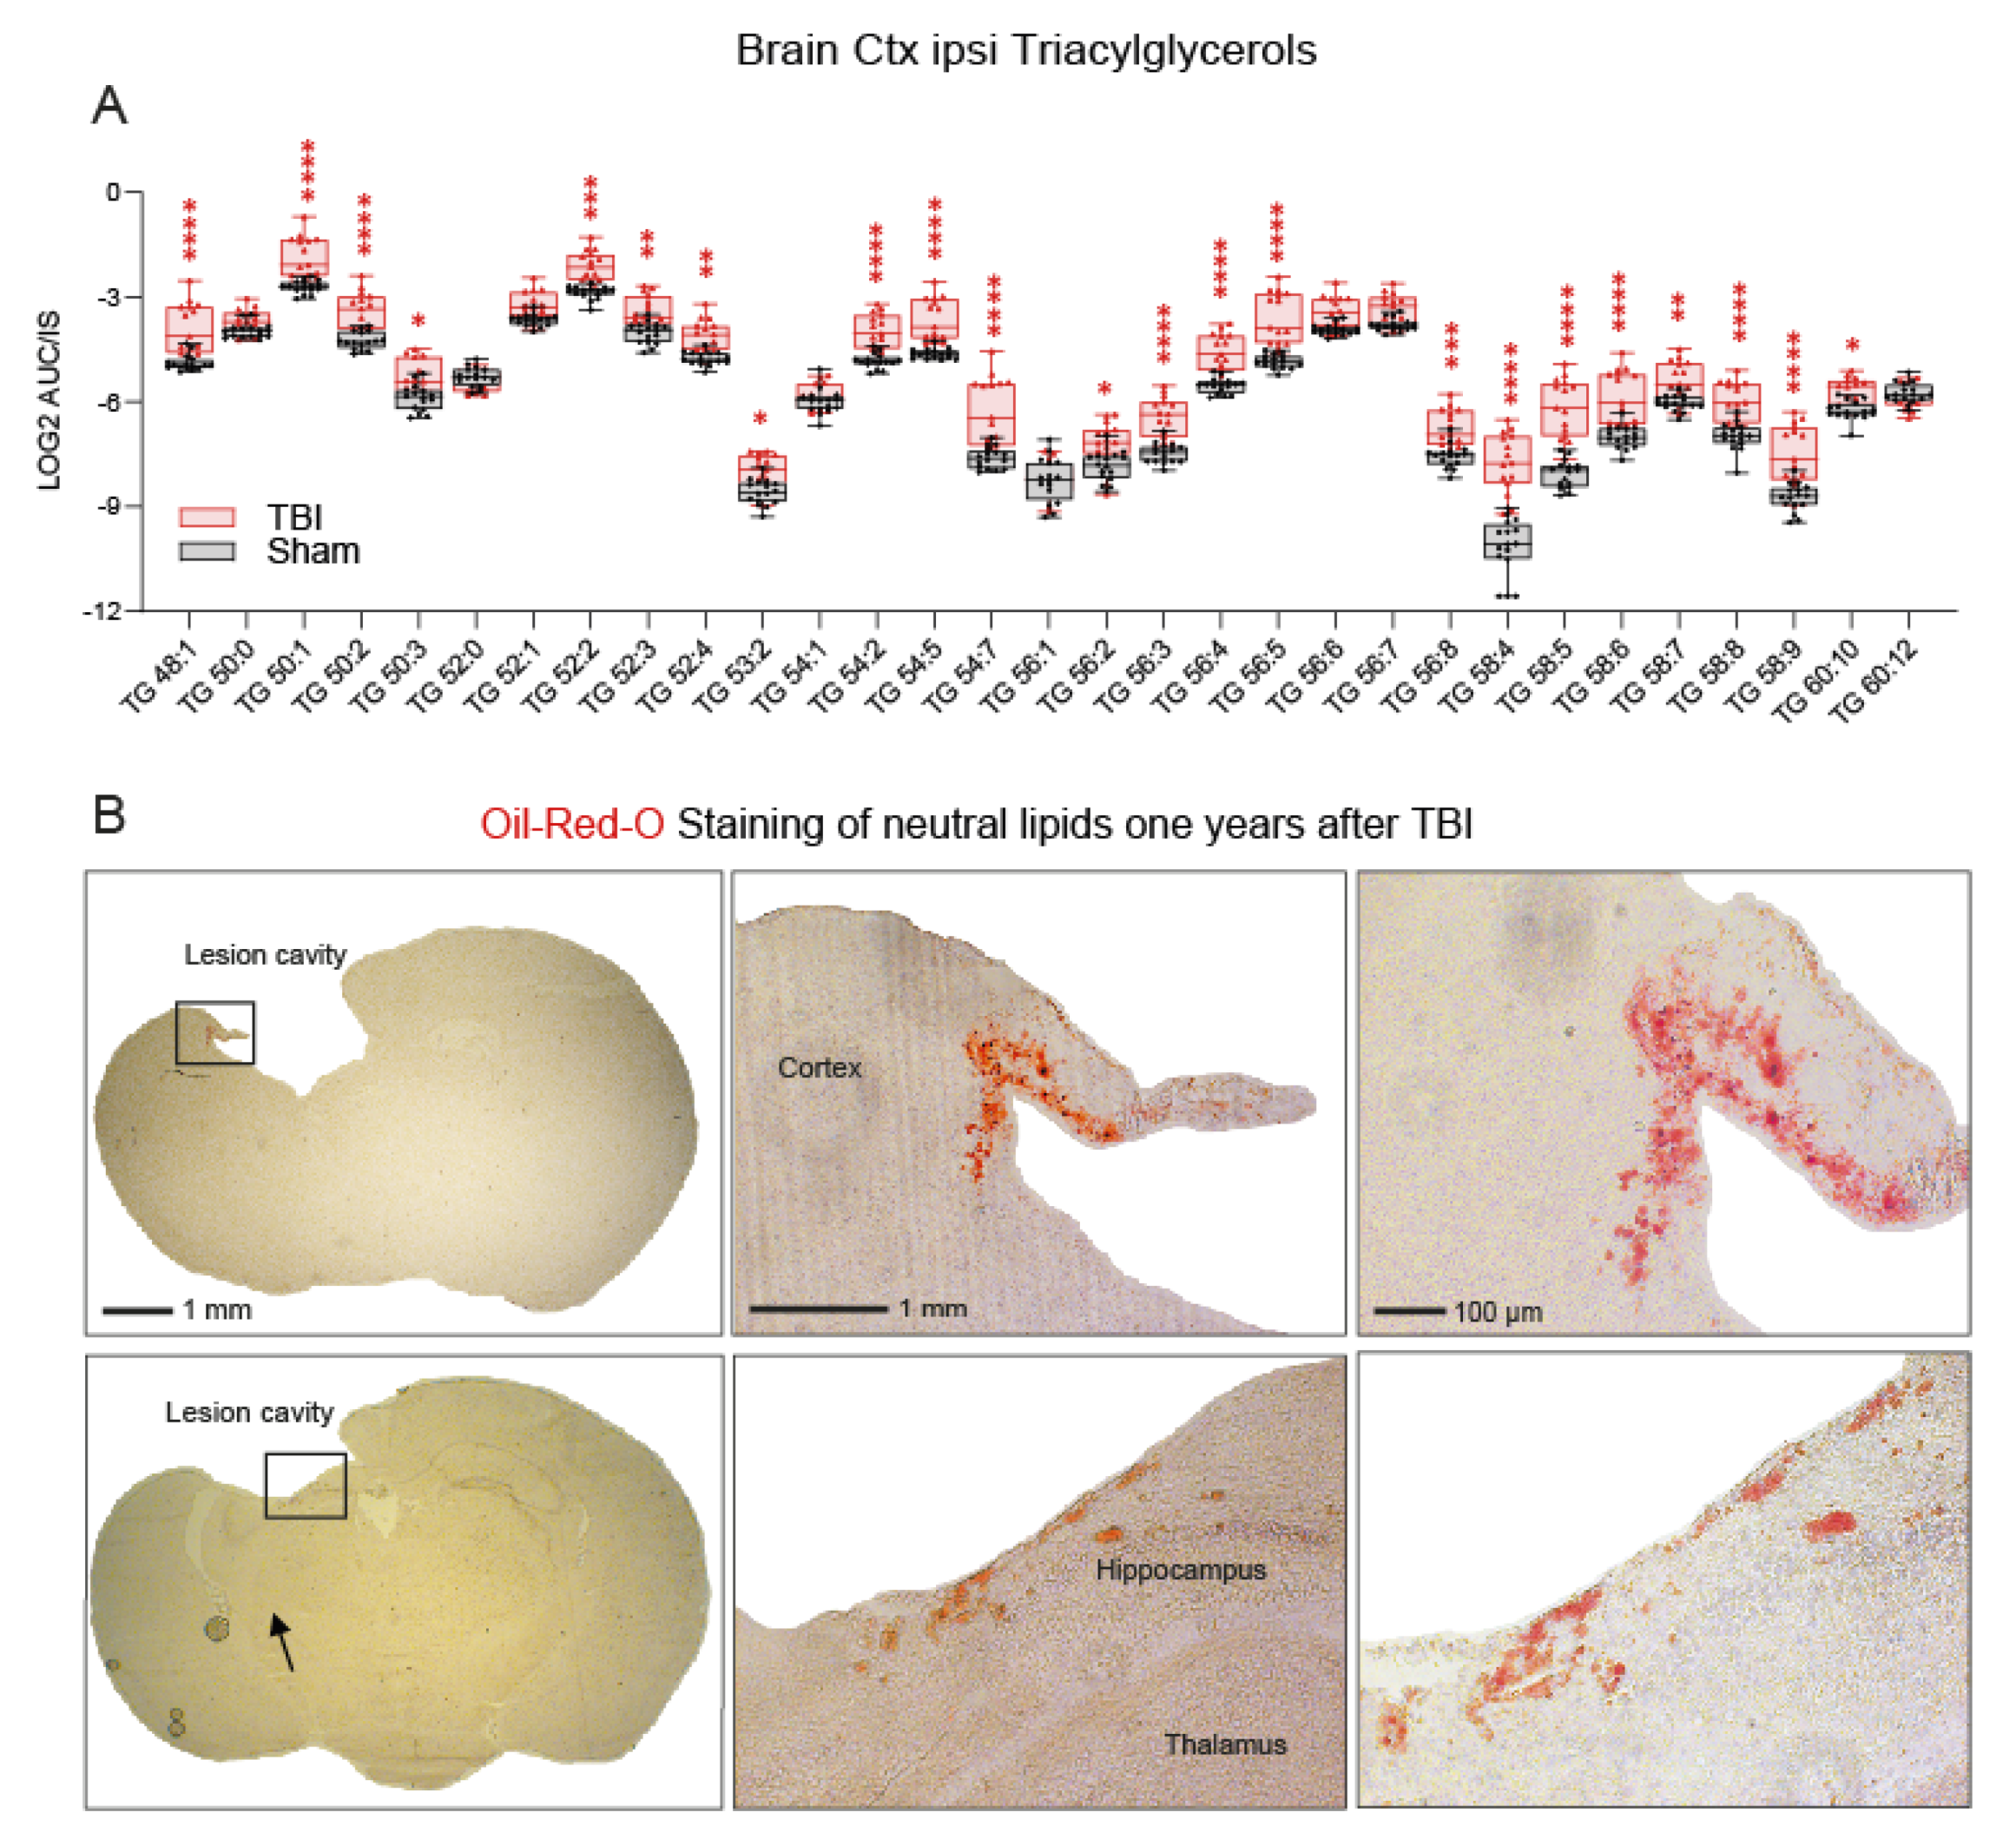
3.3. Accumulation of Triacylglycerols in the Perilesional Cortex after TBI
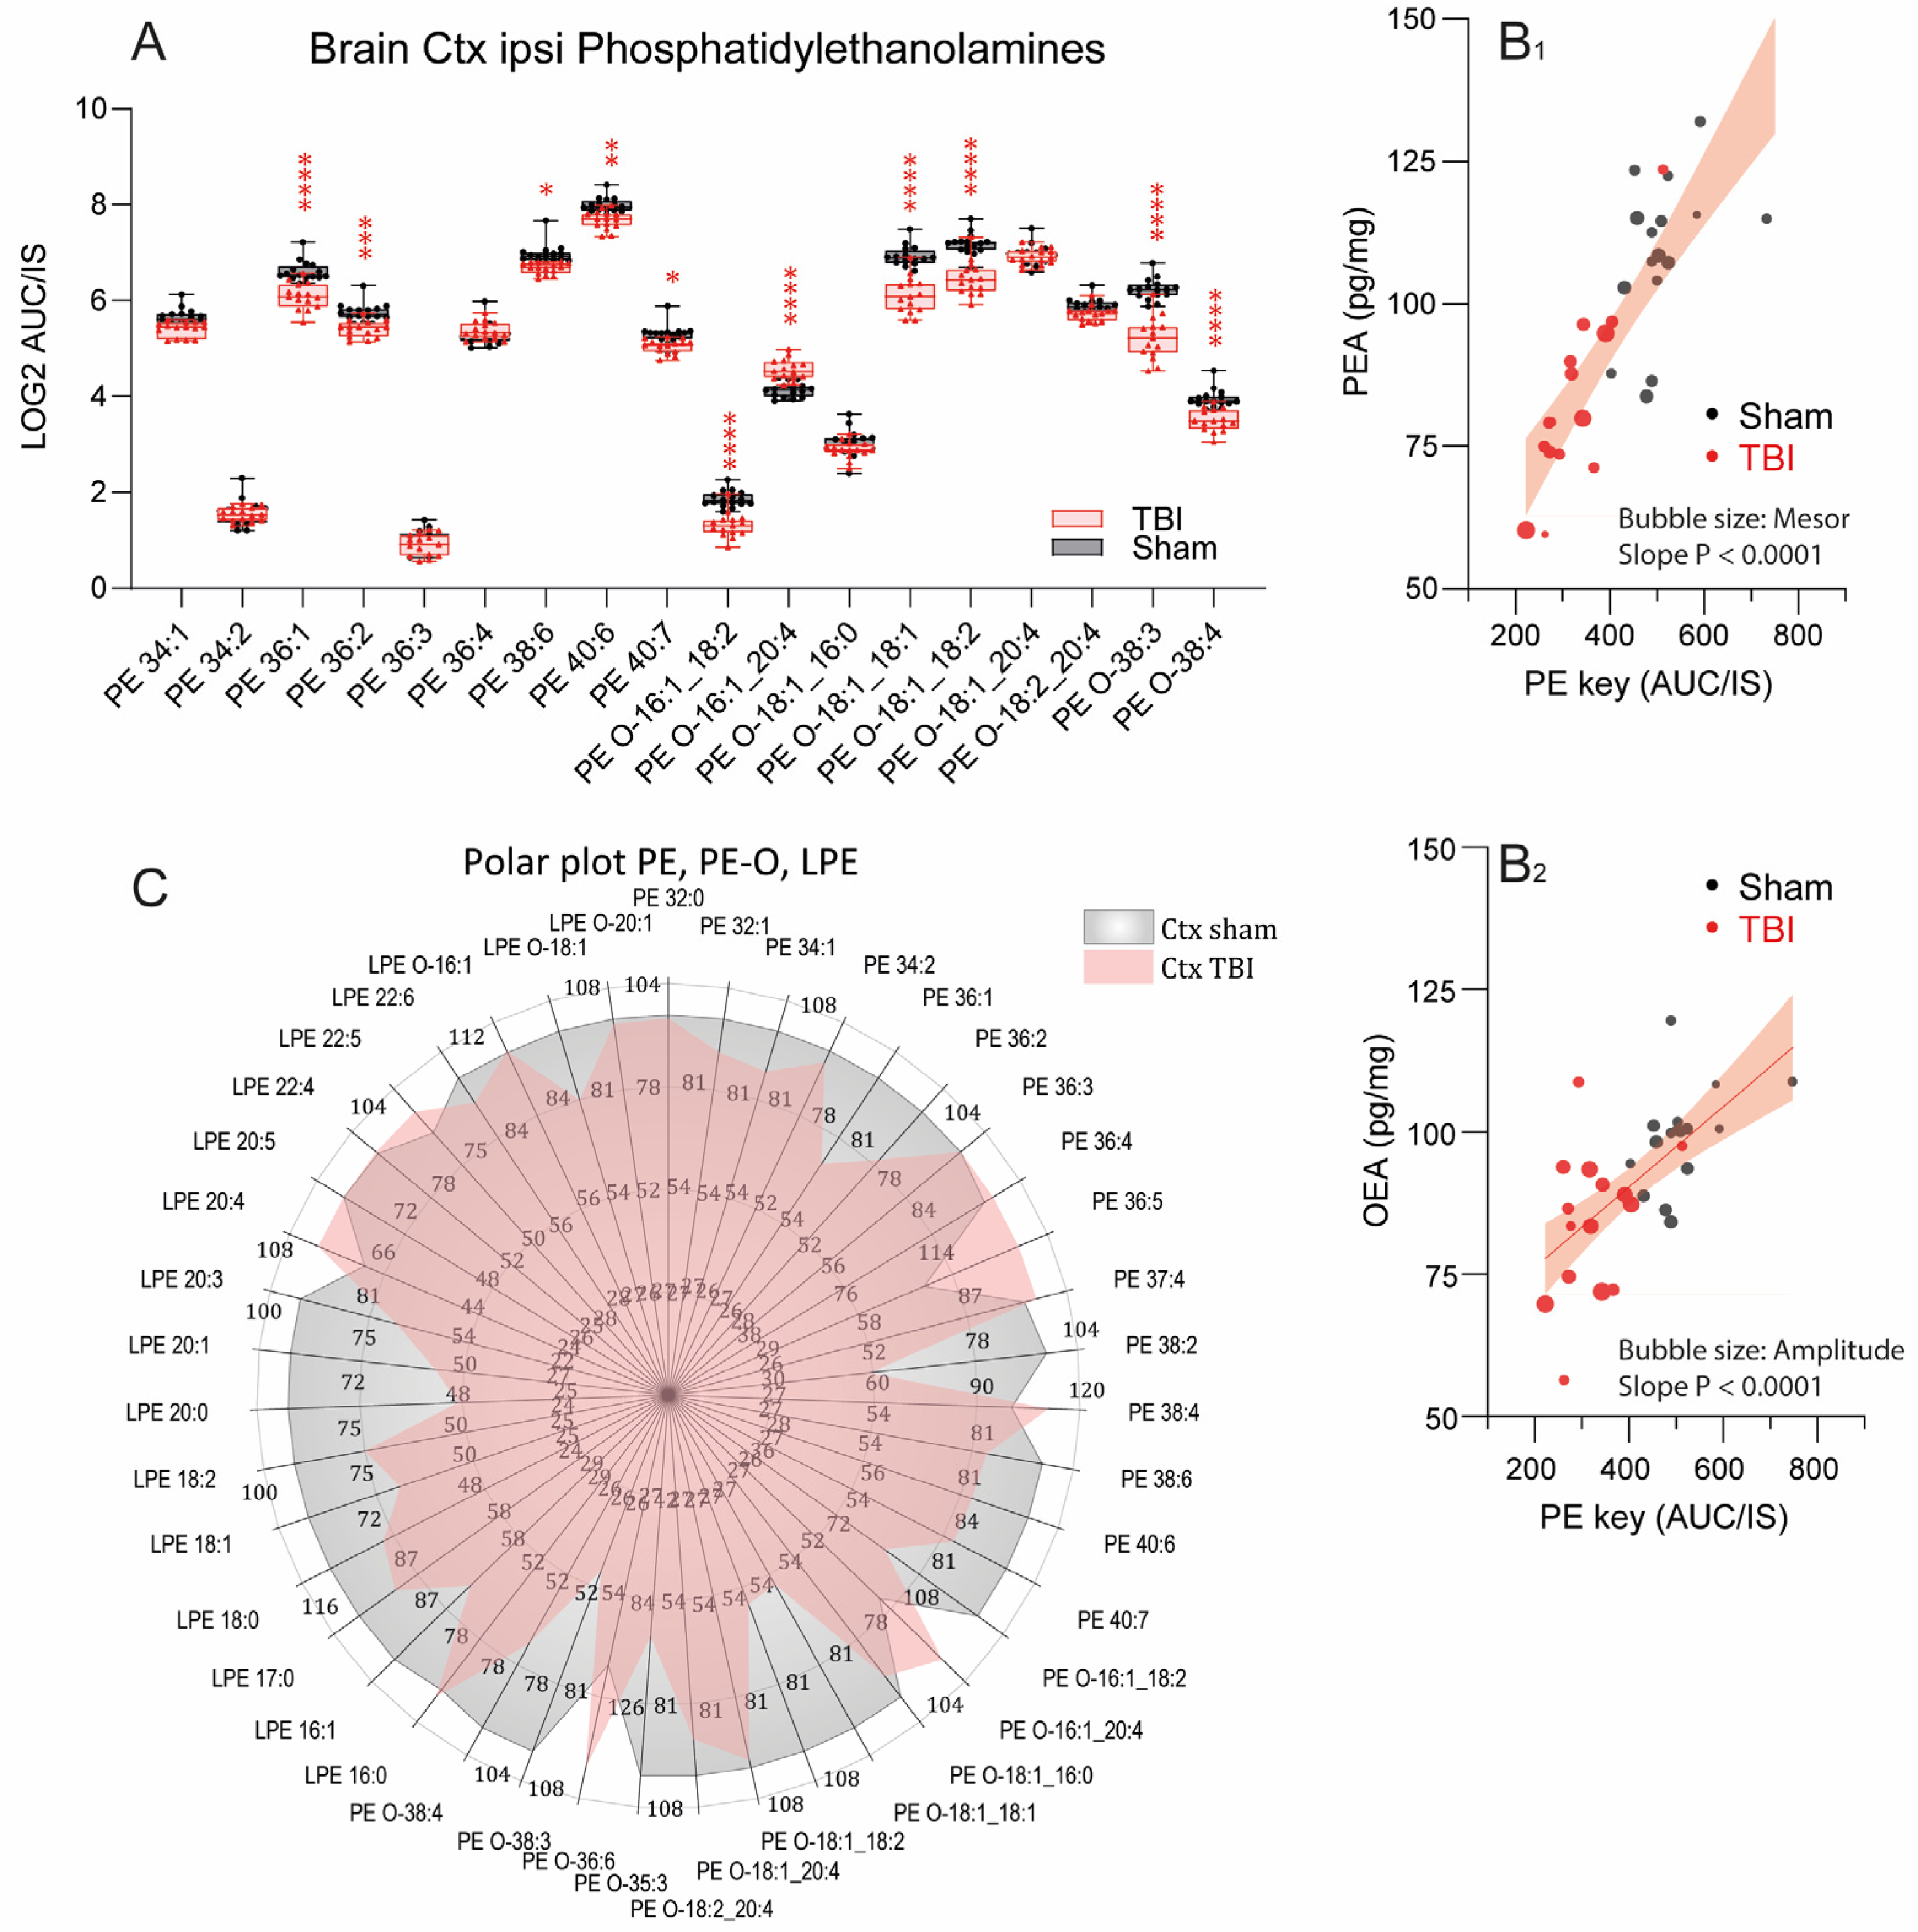
3.4. Reduced Phosphatidylethanolamines in the Ipsilateral Cortex after TBI
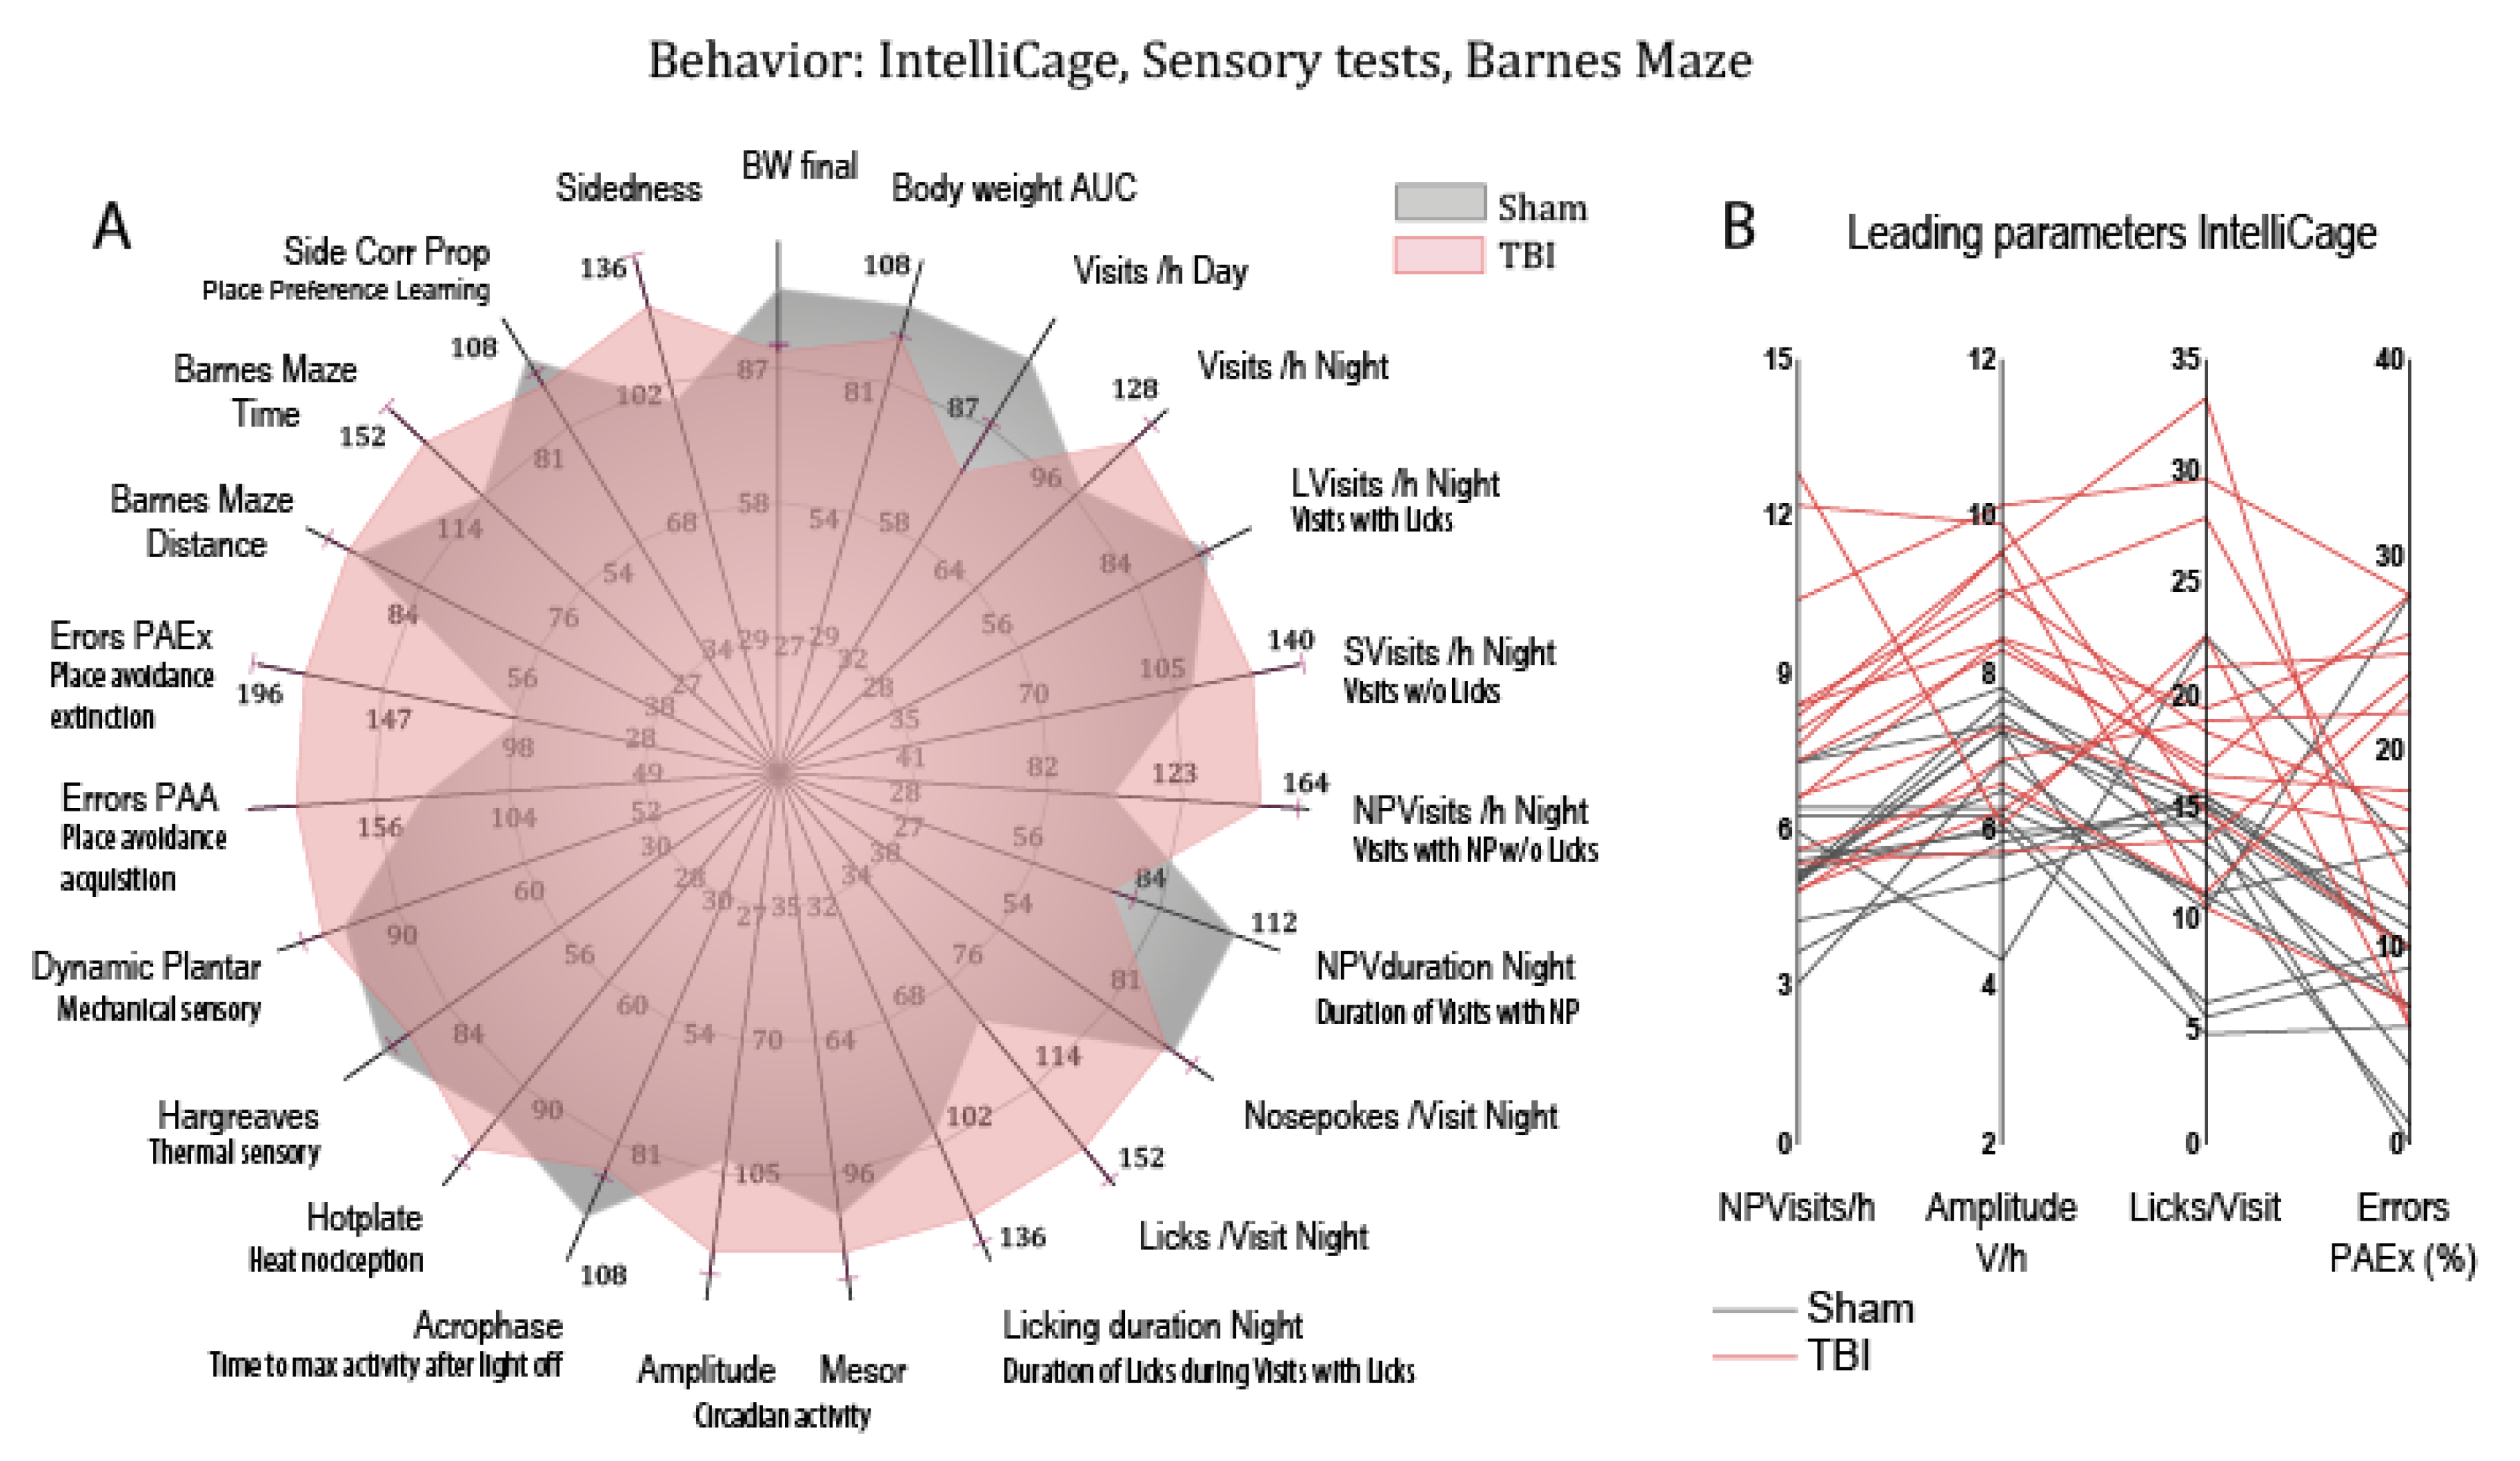
3.5. Post-TBI Behavior
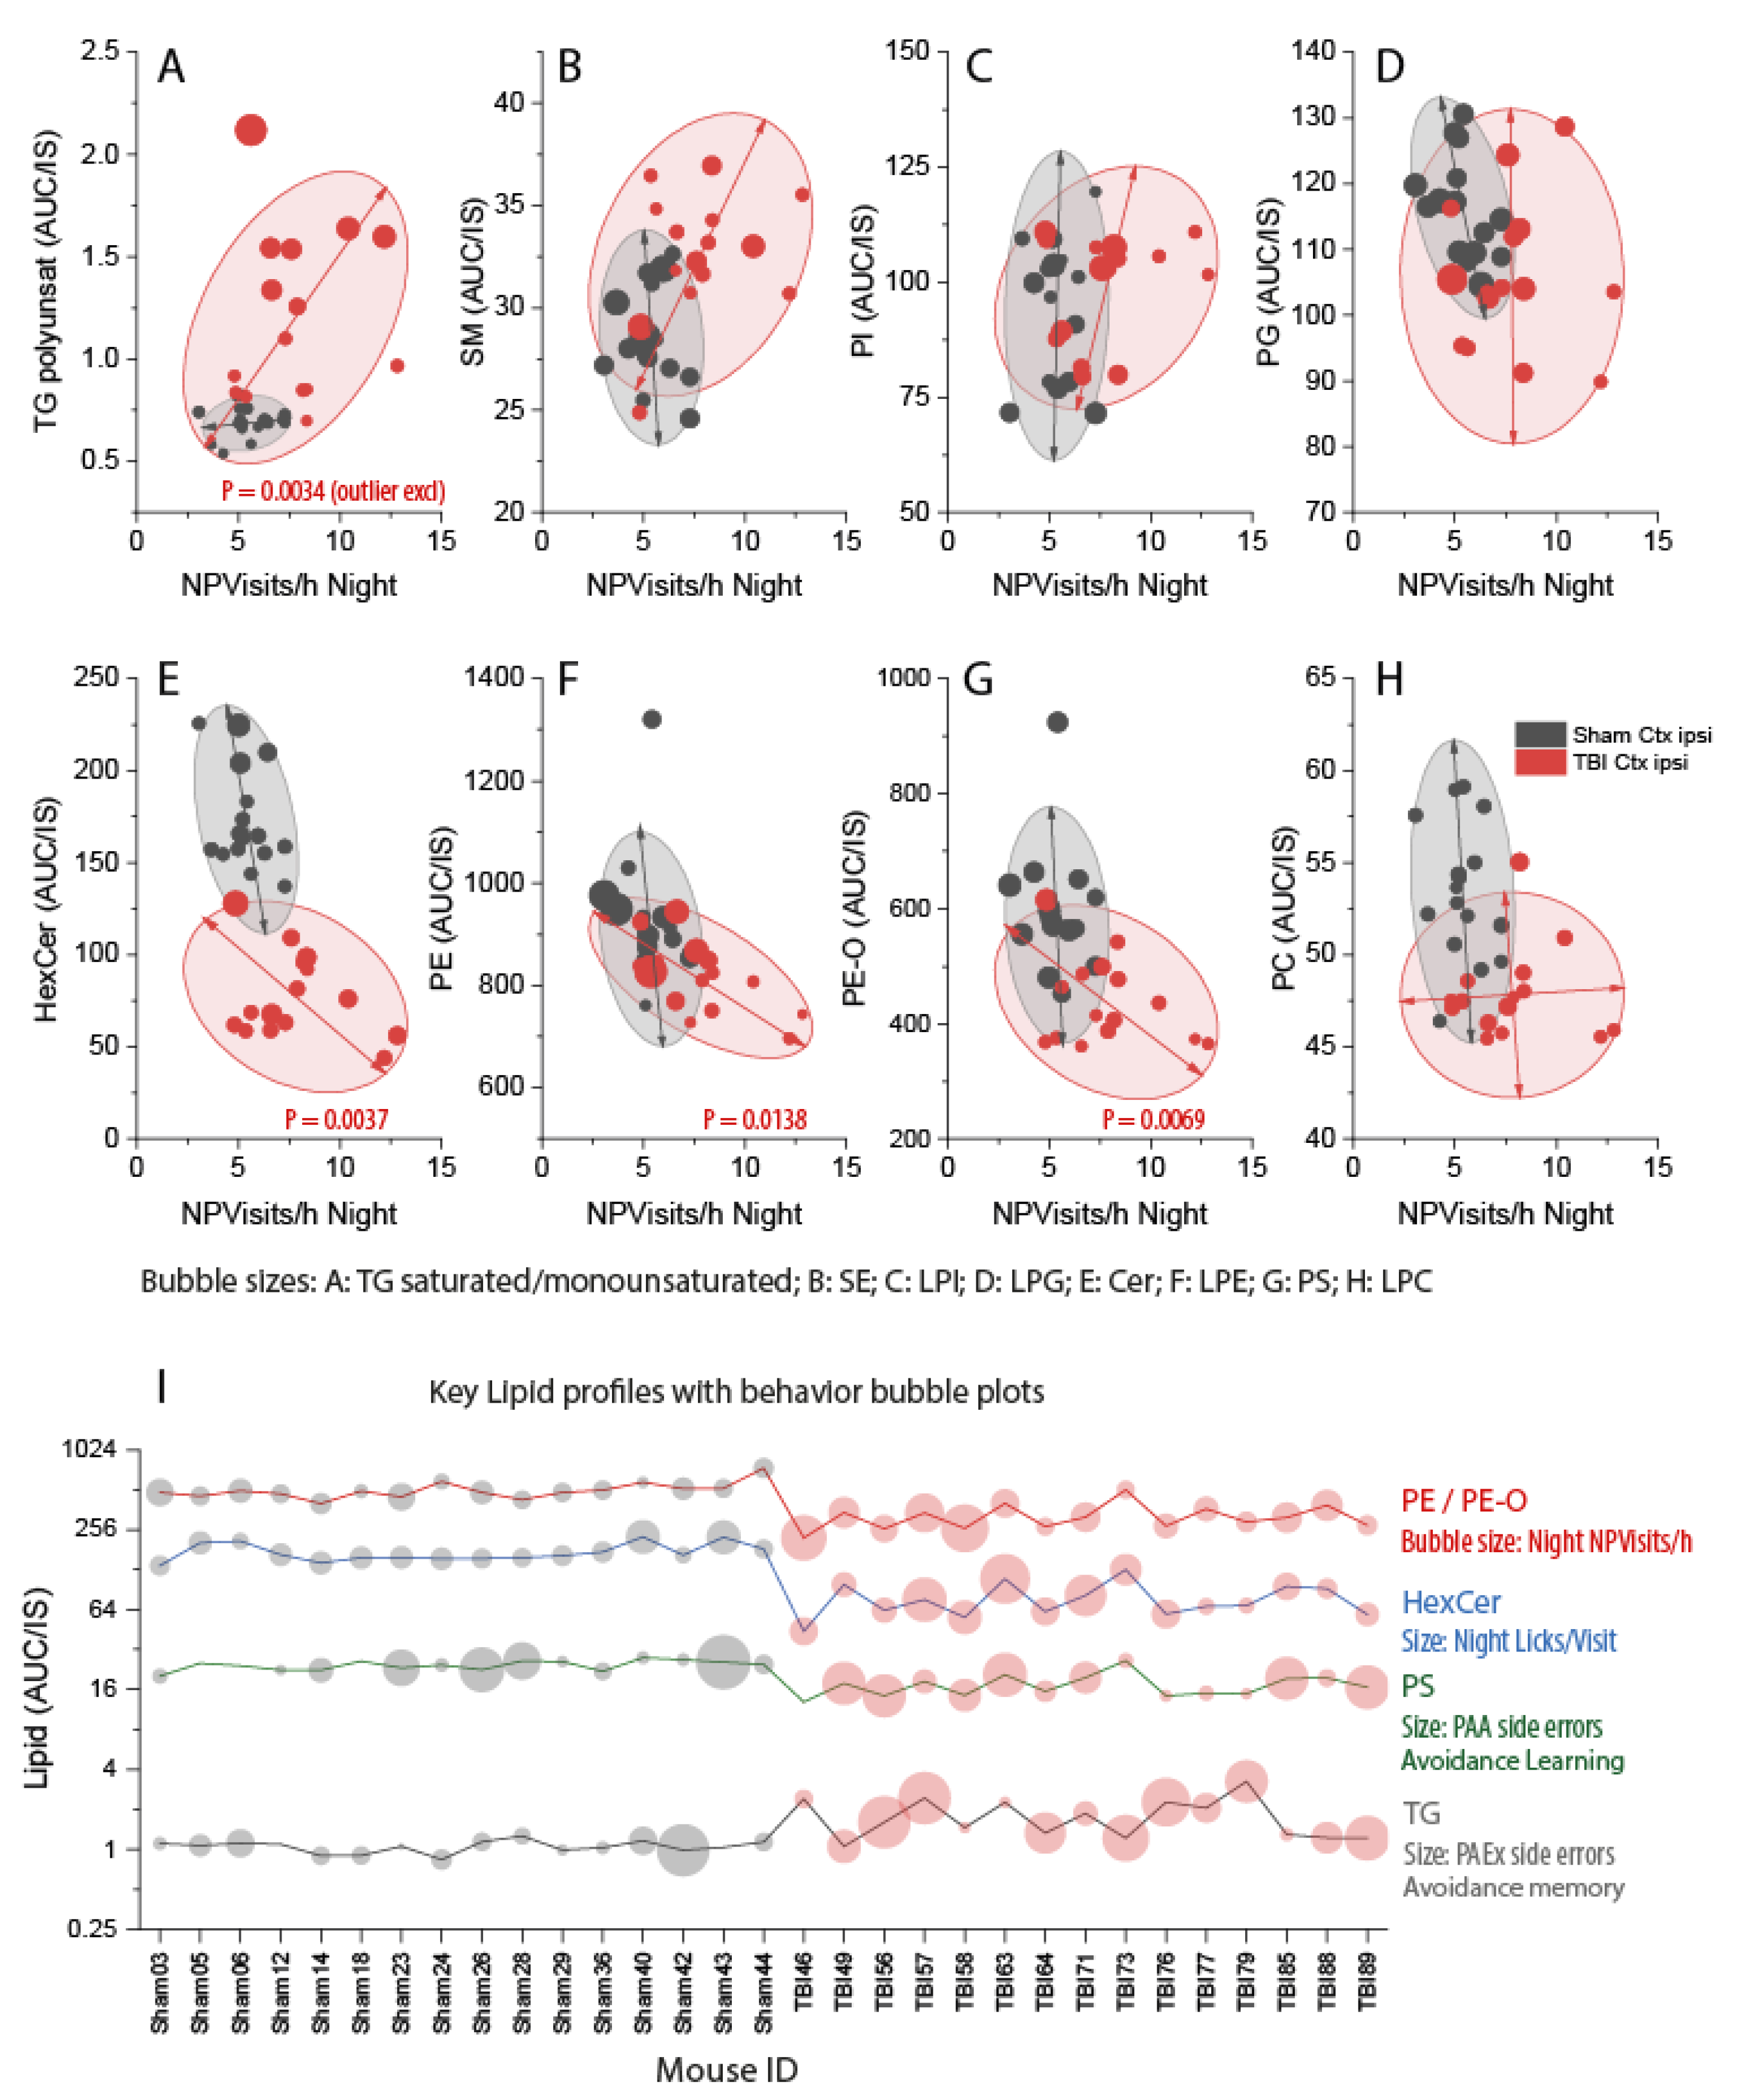
3.6. Associations of Deregulated Lipids with Abnormal Post-TBI Behavior
4. Discussion
Supplementary Materials
Author Contributions
Funding
Institutional Review Board Statement
Informed Consent Statement
Data Availability Statement
Acknowledgments
Conflicts of Interest
References
- Corps, K.N.; Roth, T.L.; McGavern, D.B. Inflammation and neuroprotection in traumatic brain injury. JAMA Neurol. 2015, 72, 355–362. [Google Scholar] [CrossRef] [PubMed] [Green Version]
- Gardner, R.C.; Langa, K.M.; Yaffe, K. Subjective and objective cognitive function among older adults with a history of traumatic brain injury: A population-based cohort study. PLoS Med. 2017, 14, e1002246. [Google Scholar] [CrossRef] [PubMed] [Green Version]
- Chauhan, N.B. Chronic neurodegenerative consequences of traumatic brain injury. Restor. Neurol. Neurosci. 2014, 32, 337–365. [Google Scholar] [CrossRef]
- Xiong, Y.; Mahmood, A.; Chopp, M. Animal models of traumatic brain injury. Nat. Rev. Neurosci. 2013, 14, 128–142. [Google Scholar] [CrossRef] [Green Version]
- Roth, T.L.; Nayak, D.; Atanasijevic, T.; Koretsky, A.P.; Latour, L.L.; McGavern, D.B. Transcranial amelioration of inflammation and cell death after brain injury. Nature 2014, 505, 223–228. [Google Scholar] [CrossRef] [PubMed] [Green Version]
- Schafer, M.K.E.; Tegeder, I. Ng2/cspg4 and progranulin in the posttraumatic glial scar. Matrix Biol. 2018, 68–69, 571–588. [Google Scholar] [CrossRef] [PubMed]
- Kyyriainen, J.; Ekolle Ndode-Ekane, X.; Pitkanen, A. Dynamics of pdgfrbeta expression in different cell types after brain injury. Glia 2017, 65, 322–341. [Google Scholar] [CrossRef] [PubMed]
- Kenne, E.; Erlandsson, A.; Lindbom, L.; Hillered, L.; Clausen, F. Neutrophil depletion reduces edema formation and tissue loss following traumatic brain injury in mice. J. Neuroinflamm. 2012, 9, 17. [Google Scholar] [CrossRef] [Green Version]
- Sahbaie, P.; Irvine, K.A.; Liang, D.Y.; Shi, X.; Clark, J.D. Mild traumatic brain injury causes nociceptive sensitization through spinal chemokine upregulation. Sci. Rep. 2019, 9, 19500. [Google Scholar] [CrossRef]
- Jarrahi, A.; Braun, M.; Ahluwalia, M.; Gupta, R.V.; Wilson, M.; Munie, S.; Ahluwalia, P.; Vender, J.R.; Vale, F.L.; Dhandapani, K.M.; et al. Revisiting traumatic brain injury: From molecular mechanisms to therapeutic interventions. Biomedicines 2020, 8, 389. [Google Scholar] [CrossRef]
- Pottker, B.; Stober, F.; Hummel, R.; Angenstein, F.; Radyushkin, K.; Goldschmidt, J.; Schafer, M.K.E. Traumatic brain injury causes long-term behavioral changes related to region-specific increases of cerebral blood flow. Brain Struct. Funct. 2017, 222, 4005–4021. [Google Scholar] [CrossRef] [PubMed]
- Yin, T.C.; Voorhees, J.R.; Genova, R.M.; Davis, K.C.; Madison, A.M.; Britt, J.K.; Cintron-Perez, C.J.; McDaniel, L.; Harper, M.M.; Pieper, A.A. Acute axonal degeneration drives development of cognitive, motor, and visual deficits after blast-mediated traumatic brain injury in mice. eNeuro 2016, 3, ENEURO.0220-16.2016. [Google Scholar] [CrossRef] [PubMed]
- Tucker, L.B.; Velosky, A.G.; Fu, A.H.; McCabe, J.T. Chronic neurobehavioral sex differences in a murine model of repetitive concussive brain injury. Front. Neurol. 2019, 10, 509. [Google Scholar] [CrossRef] [PubMed]
- Klemenhagen, K.C.; O’Brien, S.P.; Brody, D.L. Repetitive concussive traumatic brain injury interacts with post-injury foot shock stress to worsen social and depression-like behavior in mice. PLoS ONE 2013, 8, e74510. [Google Scholar] [CrossRef]
- Vogel, A.; Wilken-Schmitz, A.; Hummel, R.; Lang, M.; Gurke, R.; Schreiber, Y.; Schäfer, M.K.E.; Tegeder, I. Low brain endocannabinoids associated with persistent non-goal directed nighttime hyperactivity after traumatic brain injury in mice. Sci. Rep. 2020, 10, 14929. [Google Scholar] [CrossRef]
- Ahmad, A.; Crupi, R.; Impellizzeri, D.; Campolo, M.; Marino, A.; Esposito, E.; Cuzzocrea, S. Administration of palmitoylethanolamide (pea) protects the neurovascular unit and reduces secondary injury after traumatic brain injury in mice. Brain. Behav. Immun. 2012, 26, 1310–1321. [Google Scholar] [CrossRef]
- Tchantchou, F.; Tucker, L.B.; Fu, A.H.; Bluett, R.J.; McCabe, J.T.; Patel, S.; Zhang, Y. The fatty acid amide hydrolase inhibitor pf-3845 promotes neuronal survival, attenuates inflammation and improves functional recovery in mice with traumatic brain injury. Neuropharmacology 2014, 85, 427–439. [Google Scholar] [CrossRef] [Green Version]
- Katz, P.S.; Sulzer, J.K.; Impastato, R.A.; Teng, S.X.; Rogers, E.K.; Molina, P.E. Endocannabinoid degradation inhibition improves neurobehavioral function, blood-brain barrier integrity, and neuroinflammation following mild traumatic brain injury. J. Neurotrauma 2015, 32, 297–306. [Google Scholar] [CrossRef] [Green Version]
- Selvaraj, P.; Wen, J.; Tanaka, M.; Zhang, Y. Therapeutic effect of a novel fatty acid amide hydrolase inhibitor pf04457845 in the repetitive closed head injury mouse model. J. Neurotrauma 2019, 36, 1655–1669. [Google Scholar] [CrossRef]
- Impellizzeri, D.; Cordaro, M.; Bruschetta, G.; Siracusa, R.; Crupi, R.; Esposito, E.; Cuzzocrea, S. N-palmitoylethanolamine-oxazoline as a new therapeutic strategy to control neuroinflammation: Neuroprotective effects in experimental models of spinal cord and brain injury. J. Neurotrauma 2017, 34, 2609–2623. [Google Scholar] [CrossRef]
- Cordaro, M.; Cuzzocrea, S.; Crupi, R. An update of palmitoylethanolamide and luteolin effects in preclinical and clinical studies of neuroinflammatory events. Antioxidants 2020, 9, 216. [Google Scholar] [CrossRef] [PubMed] [Green Version]
- Campolo, M.; Crupi, R.; Cordaro, M.; Cardali, S.M.; Ardizzone, A.; Casili, G.; Scuderi, S.A.; Siracusa, R.; Esposito, E.; Conti, A.; et al. Co-ultra pealut enhances endogenous repair response following moderate traumatic brain injury. Int. J. Mol. Sci. 2021, 22, 8717. [Google Scholar] [CrossRef] [PubMed]
- Nguyen, B.M.; Kim, D.; Bricker, S.; Bongard, F.; Neville, A.; Putnam, B.; Smith, J.; Plurad, D. Effect of marijuana use on outcomes in traumatic brain injury. Am. Surg. 2014, 80, 979–983. [Google Scholar] [CrossRef] [PubMed]
- Lisboa, S.F.; Vila-Verde, C.; Rosa, J.; Uliana, D.L.; Stern, C.A.J.; Bertoglio, L.J.; Resstel, L.B.; Guimaraes, F.S. Tempering aversive/traumatic memories with cannabinoids: A review of evidence from animal and human studies. Psychopharmacology 2019, 236, 201–226. [Google Scholar] [CrossRef]
- Rabinak, C.A.; Blanchette, A.; Zabik, N.L.; Peters, C.; Marusak, H.A.; Iadipaolo, A.; Elrahal, F. Cannabinoid modulation of corticolimbic activation to threat in trauma-exposed adults: A preliminary study. Psychopharmacology 2020, 237, 1813–1826. [Google Scholar] [CrossRef]
- Kamada, H.; Sato, K.; Iwai, M.; Ohta, K.; Nagano, I.; Shoji, M.; Abe, K. Changes of free cholesterol and neutral lipids after transient focal brain ischemia in rats. Acta Neurochir. Suppl. 2003, 86, 177–180. [Google Scholar]
- Alza, N.P.; Conde, M.A.; Scodelaro-Bilbao, P.G.; Salvador, G.A. Neutral lipids as early biomarkers of cellular fate: The case of α-synuclein overexpression. Cell Death Dis. 2021, 12, 52. [Google Scholar] [CrossRef]
- Nugent, A.A.; Lin, K.; van Lengerich, B.; Lianoglou, S.; Przybyla, L.; Davis, S.S.; Llapashtica, C.; Wang, J.; Kim, D.J.; Xia, D.; et al. Trem2 regulates microglial cholesterol metabolism upon chronic phagocytic challenge. Neuron 2020, 105, 837–854.e839. [Google Scholar] [CrossRef]
- Hannay, H.J.; Feldman, Z.; Phan, P.; Keyani, A.; Panwar, N.; Goodman, J.C.; Robertson, C.S. Validation of a controlled cortical impact model of head injury in mice. J. Neurotrauma 1999, 16, 1103–1114. [Google Scholar] [CrossRef]
- Wu, J.C.; Chen, K.Y.; Yo, Y.W.; Huang, S.W.; Shih, H.M.; Chiu, W.T.; Chiang, Y.H.; Shiau, C.Y. Different sham procedures for rats in traumatic brain injury experiments induce corresponding increases in levels of trauma markers. J. Surg. Res. 2013, 179, 138–144. [Google Scholar] [CrossRef]
- Cole, J.T.; Yarnell, A.; Kean, W.S.; Gold, E.; Lewis, B.; Ren, M.; McMullen, D.C.; Jacobowitz, D.M.; Pollard, H.B.; O’Neill, J.T.; et al. Craniotomy: True sham for traumatic brain injury, or a sham of a sham? J. Neurotrauma 2011, 28, 359–369. [Google Scholar] [CrossRef] [PubMed] [Green Version]
- Krämer, T.; Grob, T.; Menzel, L.; Hirnet, T.; Griemert, E.; Radyushkin, K.; Thal, S.C.; Methner, A.; Schaefer, M.K.E. Dimethyl fumarate treatment after traumatic brain injury prevents depletion of antioxidative brain glutathione and confers neuroprotection. J. Neurochem. 2017, 143, 523–533. [Google Scholar] [CrossRef] [PubMed]
- Hummel, R.; Ulbrich, S.; Appel, D.; Li, S.; Hirnet, T.; Zander, S.; Bobkiewicz, W.; Gölz, C.; Schäfer, M.K.E. Administration of all-trans retinoic acid after experimental traumatic brain injury is brain protective. Br. J. Pharmacol. 2020, 177, 5208–5223. [Google Scholar] [CrossRef] [PubMed]
- Hahnefeld, L.; Gurke, R.; Thomas, D.; Schreiber, Y.; Schäfer, S.M.G.; Trautmann, S.; Snodgrass, I.F.; Kratz, D.; Geisslinger, G.; Ferreirós, N. Implementation of lipidomics in clinical routine: Can fluoride/citrate blood sampling tubes improve preanalytical stability? Talanta 2020, 209, 120593. [Google Scholar] [CrossRef] [PubMed]
- Voikar, V.; Krackow, S.; Lipp, H.P.; Rau, A.; Colacicco, G.; Wolfer, D.P. Automated dissection of permanent effects of hippocampal or prefrontal lesions on performance at spatial, working memory and circadian timing tasks of c57bl/6 mice in intellicage. Behav. Brain Res. 2018, 352, 8–22. [Google Scholar] [CrossRef] [Green Version]
- Tegeder, I.; Kögel, D. When lipid homeostasis runs havoc: Lipotoxicity links lysosomal dysfunction to autophagy. Matrix Biol. 2020, 100–101, 99–117. [Google Scholar] [CrossRef]
- Beschorner, R.; Nguyen, T.D.; Gozalan, F.; Pedal, I.; Mattern, R.; Schluesener, H.J.; Meyermann, R.; Schwab, J.M. Cd14 expression by activated parenchymal microglia/macrophages and infiltrating monocytes following human traumatic brain injury. Acta Neuropathol. 2002, 103, 541–549. [Google Scholar] [CrossRef]
- Vuokila, N.; Aronica, E.; Korotkov, A.; van Vliet, E.A.; Nuzhat, S.; Puhakka, N.; Pitkänen, A. Chronic regulation of mir-124-3p in the perilesional cortex after experimental and human tbi. Int. J. Mol. Sci. 2020, 21, 2418. [Google Scholar] [CrossRef] [Green Version]
- Ueda, N.; Okamoto, Y.; Tsuboi, K. Endocannabinoid-related enzymes as drug targets with special reference to n-acylphosphatidylethanolamine-hydrolyzing phospholipase d. Curr. Med. Chem. 2005, 12, 1413–1422. [Google Scholar] [CrossRef]
- Leung, D.; Saghatelian, A.; Simon, G.M.; Cravatt, B.F. Inactivation of n-acyl phosphatidylethanolamine phospholipase d reveals multiple mechanisms for the biosynthesis of endocannabinoids. Biochemistry 2006, 45, 4720–4726. [Google Scholar] [CrossRef] [Green Version]
- Liu, J.; Wang, L.; Harvey-White, J.; Osei-Hyiaman, D.; Razdan, R.; Gong, Q.; Chan, A.C.; Zhou, Z.; Huang, B.X.; Kim, H.Y.; et al. A biosynthetic pathway for anandamide. Proc. Natl. Acad. Sci. USA 2006, 103, 13345–13350. [Google Scholar] [CrossRef] [PubMed] [Green Version]
- Ioannou, M.S.; Jackson, J.; Sheu, S.H.; Chang, C.L.; Weigel, A.V.; Liu, H.; Pasolli, H.A.; Xu, C.S.; Pang, S.; Matthies, D.; et al. Neuron-astrocyte metabolic coupling protects against activity-induced fatty acid toxicity. Cell 2019, 177, 1522–1535.e1514. [Google Scholar] [CrossRef] [PubMed]
- Liu, L.; MacKenzie, K.R.; Putluri, N.; Maletić-Savatić, M.; Bellen, H.J. The glia-neuron lactate shuttle and elevated ros promote lipid synthesis in neurons and lipid droplet accumulation in glia via apoe/d. Cell Metab. 2017, 26, 719–737.e716. [Google Scholar] [CrossRef] [PubMed] [Green Version]
- Qi, G.; Mi, Y.; Shi, X.; Gu, H.; Brinton, R.D.; Yin, F. Apoe4 impairs neuron-astrocyte coupling of fatty acid metabolism. Cell Rep. 2021, 34, 108572. [Google Scholar] [CrossRef]
- Farmer, B.C.; Kluemper, J.; Johnson, L.A. Apolipoprotein e4 alters astrocyte fatty acid metabolism and lipid droplet formation. Cells 2019, 8, 182. [Google Scholar] [CrossRef] [Green Version]
- Mukherjee, S.; Suresh, S.N. Neuron-astrocyte liaison to maintain lipid metabolism of brain. Trends Endocrinol. Metab. 2019, 30, 573–575. [Google Scholar] [CrossRef]
- Kwon, Y.H.; Kim, J.; Kim, C.S.; Tu, T.H.; Kim, M.S.; Suk, K.; Kim, D.H.; Lee, B.J.; Choi, H.S.; Park, T.; et al. Hypothalamic lipid-laden astrocytes induce microglia migration and activation. FEBS Lett. 2017, 591, 1742–1751. [Google Scholar] [CrossRef] [Green Version]
- Guttenplan, K.A.; Weigel, M.K.; Prakash, P.; Wijewardhane, P.R.; Hasel, P.; Rufen-Blanchette, U.; Münch, A.E.; Blum, J.A.; Fine, J.; Neal, M.C.; et al. Neurotoxic reactive astrocytes induce cell death via saturated lipids. Nature 2021, 599, 102–107. [Google Scholar] [CrossRef]
- Popa-Wagner, A.; Dinca, I.; Yalikun, S.; Walker, L.; Kroemer, H.; Kessler, C. Accelerated delimitation of the infarct zone by capillary-derived nestin-positive cells in aged rats. Curr. Neurovasc. Res. 2006, 3, 3–13. [Google Scholar] [CrossRef]
- Guedes, V.A.; Lai, C.; Devoto, C.; Edwards, K.A.; Mithani, S.; Sass, D.; Vorn, R.; Qu, B.X.; Rusch, H.L.; Martin, C.A.; et al. Extracellular vesicle proteins and micrornas are linked to chronic post-traumatic stress disorder symptoms in service members and veterans with mild traumatic brain injury. Front. Pharmacol. 2021, 12, 745348. [Google Scholar] [CrossRef]
- Vorn, R.; Suarez, M.; White, J.C.; Martin, C.A.; Kim, H.S.; Lai, C.; Yun, S.J.; Gill, J.M.; Lee, H. Exosomal microrna differential expression in plasma of young adults with chronic mild traumatic brain injury and healthy control. Biomedicines 2021, 10, 36. [Google Scholar] [CrossRef] [PubMed]
- Zhang, N.; He, F.; Li, T.; Chen, J.; Jiang, L.; Ouyang, X.P.; Zuo, L. Role of exosomes in brain diseases. Front. Cell. Neurosci. 2021, 15, 743353. [Google Scholar] [CrossRef] [PubMed]
- Devoto, C.; Lai, C.; Qu, B.X.; Guedes, V.A.; Leete, J.; Wilde, E.; Walker, W.C.; Diaz-Arrastia, R.; Kenney, K.; Gill, J. Exosomal micrornas in military personnel with mild traumatic brain injury: Preliminary results from the chronic effects of neurotrauma consortium biomarker discovery project. J. Neurotrauma 2020, 37, 2482–2492. [Google Scholar] [CrossRef]
- Shaw, T.A.; Singaravelu, R.; Powdrill, M.H.; Nhan, J.; Ahmed, N.; Özcelik, D.; Pezacki, J.P. Microrna-124 regulates fatty acid and triglyceride homeostasis. iScience 2018, 10, 149–157. [Google Scholar] [CrossRef] [PubMed] [Green Version]
- Impellizzeri, D.; Siracusa, R.; Cordaro, M.; Crupi, R.; Peritore, A.F.; Gugliandolo, E.; D’Amico, R.; Petrosino, S.; Evangelista, M.; Di Paola, R.; et al. N-palmitoylethanolamine-oxazoline (pea-oxa): A new therapeutic strategy to reduce neuroinflammation, oxidative stress associated to vascular dementia in an experimental model of repeated bilateral common carotid arteries occlusion. Neurobiol. Dis. 2019, 125, 77–91. [Google Scholar] [CrossRef]
- Rubovitch, V.; Zilberstein, Y.; Chapman, J.; Schreiber, S.; Pick, C.G. Restoring gm1 ganglioside expression ameliorates axonal outgrowth inhibition and cognitive impairments induced by blast traumatic brain injury. Sci. Rep. 2017, 7, 41269. [Google Scholar] [CrossRef] [Green Version]
- Benady, A.; Freidin, D.; Pick, C.G.; Rubovitch, V. Gm1 ganglioside prevents axonal regeneration inhibition and cognitive deficits in a mouse model of traumatic brain injury. Sci. Rep. 2018, 8, 13340. [Google Scholar] [CrossRef] [Green Version]
- Niu, F.; Qian, K.; Qi, H.; Zhao, Y.; Jiang, Y.; Sun, M. Antiapoptotic and anti-inflammatory effects of cpcgi in rats with traumatic brain injury. Neuropsychiatr. Dis. Treat. 2020, 16, 2975–2987. [Google Scholar] [CrossRef]
- Knobloch, M.; Braun, S.M.; Zurkirchen, L.; von Schoultz, C.; Zamboni, N.; Arauzo-Bravo, M.J.; Kovacs, W.J.; Karalay, O.; Suter, U.; Machado, R.A.; et al. Metabolic control of adult neural stem cell activity by fasn-dependent lipogenesis. Nature 2013, 493, 226–230. [Google Scholar] [CrossRef] [Green Version]
- Jones, S.F.; Infante, J.R. Molecular pathways: Fatty acid synthase. Clin. Cancer Res. 2015, 21, 5434–5438. [Google Scholar] [CrossRef] [Green Version]
- van Deijk, A.F.; Camargo, N.; Timmerman, J.; Heistek, T.; Brouwers, J.F.; Mogavero, F.; Mansvelder, H.D.; Smit, A.B.; Verheijen, M.H. Astrocyte lipid metabolism is critical for synapse development and function in vivo. Glia 2017, 65, 670–682. [Google Scholar] [CrossRef]
- Kaushik, S.; Cuervo, A.M. Degradation of lipid droplet-associated proteins by chaperone-mediated autophagy facilitates lipolysis. Nat. Cell Biol. 2015, 17, 759–770. [Google Scholar] [CrossRef] [PubMed] [Green Version]
- Singh, R.; Kaushik, S.; Wang, Y.; Xiang, Y.; Novak, I.; Komatsu, M.; Tanaka, K.; Cuervo, A.M.; Czaja, M.J. Autophagy regulates lipid metabolism. Nature 2009, 458, 1131–1135. [Google Scholar] [CrossRef] [PubMed] [Green Version]
- Jarc, E.; Petan, T. Lipid droplets and the management of cellular stress. Yale J. Biol. Med. 2019, 92, 435–452. [Google Scholar] [PubMed]
- Khawar, M.B.; Gao, H.; Li, W. Autophagy and lipid metabolism. Adv. Exp. Med. Biol. 2019, 1206, 359–374. [Google Scholar] [PubMed]
- Kloska, A.; Węsierska, M.; Malinowska, M.; Gabig-Cimińska, M.; Jakóbkiewicz-Banecka, J. Lipophagy and lipolysis status in lipid storage and lipid metabolism diseases. Int. J. Mol. Sci. 2020, 21, 6113. [Google Scholar] [CrossRef]
- Cui, W.; Sathyanarayan, A.; Lopresti, M.; Aghajan, M.; Chen, C.; Mashek, D.G. Lipophagy-derived fatty acids undergo extracellular efflux via lysosomal exocytosis. Autophagy 2020, 17, 690–705. [Google Scholar] [CrossRef]
- Wen, L.; Xu, J.; Zhan, T.; Wang, H.; Huang, X.; Liu, W.; Yang, X.; Zhan, R. The occurrence of diffuse axonal injury in the brain: Associated with the accumulation and clearance of myelin debris. Neural Regen. Res. 2014, 9, 1902–1906. [Google Scholar]
- Trotter, J.; DeJong, L.J.; Smith, M.E. Opsonization with antimyelin antibody increases the uptake and intracellular metabolism of myelin in inflammatory macrophages. J. Neurochem. 1986, 47, 779–789. [Google Scholar] [CrossRef]
- Camargo, N.; Goudriaan, A.; van Deijk, A.F.; Otte, W.M.; Brouwers, J.F.; Lodder, H.; Gutmann, D.H.; Nave, K.A.; Dijkhuizen, R.M.; Mansvelder, H.D.; et al. Oligodendroglial myelination requires astrocyte-derived lipids. PLoS Biol. 2017, 15, e1002605. [Google Scholar] [CrossRef]
- Eraso-Pichot, A.; Brasó-Vives, M.; Golbano, A.; Menacho, C.; Claro, E.; Galea, E.; Masgrau, R. Gsea of mouse and human mitochondriomes reveals fatty acid oxidation in astrocytes. Glia 2018, 66, 1724–1735. [Google Scholar] [CrossRef] [PubMed]
- Skoug, C.; Holm, C.; Duarte, J.M.N. Hormone-sensitive lipase is localized at synapses and is necessary for normal memory functioning in mice. J. Lipid Res. 2022, 100195. [Google Scholar] [CrossRef] [PubMed]
- Etschmaier, K.; Becker, T.; Eichmann, T.O.; Schweinzer, C.; Scholler, M.; Tam-Amersdorfer, C.; Poeckl, M.; Schuligoi, R.; Kober, A.; Chirackal Manavalan, A.P.; et al. Adipose triglyceride lipase affects triacylglycerol metabolism at brain barriers. J. Neurochem. 2011, 119, 1016–1028. [Google Scholar] [CrossRef] [PubMed]
- Dupont, N.; Chauhan, S.; Arko-Mensah, J.; Castillo, E.F.; Masedunskas, A.; Weigert, R.; Robenek, H.; Proikas-Cezanne, T.; Deretic, V. Neutral lipid stores and lipase pnpla5 contribute to autophagosome biogenesis. Curr. Biol. 2014, 24, 609–620. [Google Scholar] [CrossRef] [PubMed] [Green Version]
- Han, X.; Zhu, J.; Zhang, X.; Song, Q.; Ding, J.; Lu, M.; Sun, S.; Hu, G. Plin4-dependent lipid droplets hamper neuronal mitophagy in the mptp/p-induced mouse model of parkinson’s disease. Front. Neurosci. 2018, 12, 397. [Google Scholar] [CrossRef] [Green Version]
- Fitzner, D.; Bader, J.M.; Penkert, H.; Bergner, C.G.; Su, M.; Weil, M.T.; Surma, M.A.; Mann, M.; Klose, C.; Simons, M. Cell-type- and brain-region-resolved mouse brain lipidome. Cell Rep. 2020, 32, 108132. [Google Scholar] [CrossRef]
- Liu, J.; Wang, L.; Harvey-White, J.; Huang, B.X.; Kim, H.Y.; Luquet, S.; Palmiter, R.D.; Krystal, G.; Rai, R.; Mahadevan, A.; et al. Multiple pathways involved in the biosynthesis of anandamide. Neuropharmacology 2008, 54, 1–7. [Google Scholar] [CrossRef] [Green Version]
- Shohami, E.; Cohen-Yeshurun, A.; Magid, L.; Algali, M.; Mechoulam, R. Endocannabinoids and traumatic brain injury. Br. J. Pharmacol. 2011, 163, 1402–1410. [Google Scholar] [CrossRef] [Green Version]
- Lambert, D.M.; Vandevoorde, S.; Jonsson, K.O.; Fowler, C.J. The palmitoylethanolamide family: A new class of anti-inflammatory agents? Curr. Med. Chem. 2002, 9, 663–674. [Google Scholar] [CrossRef] [Green Version]
- Walter, L.; Franklin, A.; Witting, A.; Wade, C.; Xie, Y.; Kunos, G.; Mackie, K.; Stella, N. Nonpsychotropic cannabinoid receptors regulate microglial cell migration. J. Neurosci. 2003, 23, 1398–1405. [Google Scholar] [CrossRef] [Green Version]
- Eljaschewitsch, E.; Witting, A.; Mawrin, C.; Lee, T.; Schmidt, P.M.; Wolf, S.; Hoertnagl, H.; Raine, C.S.; Schneider-Stock, R.; Nitsch, R.; et al. The endocannabinoid anandamide protects neurons during cns inflammation by induction of mkp-1 in microglial cells. Neuron 2006, 49, 67–79. [Google Scholar] [CrossRef] [PubMed] [Green Version]
- Esposito, E.; Cordaro, M.; Cuzzocrea, S. Roles of fatty acid ethanolamides (fae) in traumatic and ischemic brain injury. Pharmacol. Res. 2014, 86, 26–31. [Google Scholar] [CrossRef] [PubMed]
- Hill, M.N.; Bierer, L.M.; Makotkine, I.; Golier, J.A.; Galea, S.; McEwen, B.S.; Hillard, C.J.; Yehuda, R. Reductions in circulating endocannabinoid levels in individuals with post-traumatic stress disorder following exposure to the world trade center attacks. Psychoneuroendocrinology 2013, 38, 2952–2961. [Google Scholar] [CrossRef] [PubMed] [Green Version]
- Mayo, L.M.; Rabinak, C.A.; Hill, M.N.; Heilig, M. Targeting the endocannabinoid system in the treatment of posttraumatic stress disorder: A promising case of preclinical-clinical translation? Biol. Psychiatry 2022, 91, 262–272. [Google Scholar] [CrossRef] [PubMed]
- Brunkhorst-Kanaan, N.; Trautmann, S.; Schreiber, Y.; Thomas, D.; Kittel-Schneider, S.; Gurke, R.; Geisslinger, G.; Reif, A.; Tegeder, I. Sphingolipid and endocannabinoid profiles in adult attention deficit hyperactivity disorder. Biomedicines 2021, 9, 1173. [Google Scholar] [CrossRef]
- Coogan, A.N.; Baird, A.L.; Popa-Wagner, A.; Thome, J. Circadian rhythms and attention deficit hyperactivity disorder: The what, the when and the why. Prog. Neuropsychopharmacol. Biol. Psychiatry 2016, 67, 74–81. [Google Scholar] [CrossRef] [Green Version]
- Paterniti, I.; Impellizzeri, D.; Di Paola, R.; Navarra, M.; Cuzzocrea, S.; Esposito, E. A new co-ultramicronized composite including palmitoylethanolamide and luteolin to prevent neuroinflammation in spinal cord injury. J. Neuroinflamm. 2013, 10, 91. [Google Scholar] [CrossRef] [Green Version]
- Cordaro, M.; Impellizzeri, D.; Paterniti, I.; Bruschetta, G.; Siracusa, R.; De Stefano, D.; Cuzzocrea, S.; Esposito, E. Neuroprotective effects of co-ultrapealut on secondary inflammatory process and autophagy involved in traumatic brain injury. J. Neurotrauma 2016, 33, 132–146. [Google Scholar] [CrossRef]
- Klatt-Schreiner, K.; Valek, L.; Kang, J.S.; Khlebtovsky, A.; Trautmann, S.; Hahnefeld, L.; Schreiber, Y.; Gurke, R.; Thomas, D.; Wilken-Schmitz, A.; et al. High glucosylceramides and low anandamide contribute to sensory loss and pain in parkinson’s disease. Mov. Disord. 2020, 35, 1822–1833. [Google Scholar] [CrossRef]
- Do, J.; McKinney, C.; Sharma, P.; Sidransky, E. Glucocerebrosidase and its relevance to parkinson disease. Mol. Neurodegener. 2019, 14, 36. [Google Scholar] [CrossRef] [Green Version]
- Beavan, M.; McNeill, A.; Proukakis, C.; Hughes, D.A.; Mehta, A.; Schapira, A.H. Evolution of prodromal clinical markers of parkinson disease in a gba mutation-positive cohort. JAMA Neurol. 2015, 72, 201–208. [Google Scholar] [CrossRef] [PubMed] [Green Version]
- Sun, Y.; Liou, B.; Ran, H.; Skelton, M.R.; Williams, M.T.; Vorhees, C.V.; Kitatani, K.; Hannun, Y.A.; Witte, D.P.; Xu, Y.H.; et al. Neuronopathic gaucher disease in the mouse: Viable combined selective saposin c deficiency and mutant glucocerebrosidase (v394l) mice with glucosylsphingosine and glucosylceramide accumulation and progressive neurological deficits. Hum. Mol. Genet. 2010, 19, 1088–1097. [Google Scholar] [CrossRef] [PubMed] [Green Version]
- Farfel-Becker, T.; Vitner, E.B.; Kelly, S.L.; Bame, J.R.; Duan, J.; Shinder, V.; Merrill, A.H., Jr.; Dobrenis, K.; Futerman, A.H. Neuronal accumulation of glucosylceramide in a mouse model of neuronopathic gaucher disease leads to neurodegeneration. Hum. Mol. Genet. 2014, 23, 843–854. [Google Scholar] [CrossRef] [PubMed] [Green Version]
- Zigdon, H.; Meshcheriakova, A.; Farfel-Becker, T.; Volpert, G.; Sabanay, H.; Futerman, A.H. Altered lysosome distribution is an early neuropathological event in neurological forms of gaucher disease. FEBS Lett. 2017, 591, 774–783. [Google Scholar] [CrossRef] [Green Version]
- Murphy, K.E.; Gysbers, A.M.; Abbott, S.K.; Tayebi, N.; Kim, W.S.; Sidransky, E.; Cooper, A.; Garner, B.; Halliday, G.M. Reduced glucocerebrosidase is associated with increased alpha-synuclein in sporadic parkinson’s disease. Brain 2014, 137, 834–848. [Google Scholar] [CrossRef] [Green Version]
- Henderson, M.X.; Sedor, S.; McGeary, I.; Cornblath, E.J.; Peng, C.; Riddle, D.M.; Li, H.L.; Zhang, B.; Brown, H.J.; Olufemi, M.F.; et al. Glucocerebrosidase activity modulates neuronal susceptibility to pathological α-synuclein insult. Neuron 2020, 105, 822–836.e827. [Google Scholar] [CrossRef]
- Kim, S.; Yun, S.P.; Lee, S.; Umanah, G.E.; Bandaru, V.V.R.; Yin, X.; Rhee, P.; Karuppagounder, S.S.; Kwon, S.H.; Lee, H.; et al. Gba1 deficiency negatively affects physiological alpha-synuclein tetramers and related multimers. Proc. Natl. Acad. Sci. USA 2018, 115, 798–803. [Google Scholar] [CrossRef] [Green Version]
- Fazzari, M.; Lunghi, G.; Chiricozzi, E.; Mauri, L.; Sonnino, S. Gangliosides and the treatment of neurodegenerative diseases: A long italian tradition. Biomedicines 2022, 10, 363. [Google Scholar] [CrossRef]


Publisher’s Note: MDPI stays neutral with regard to jurisdictional claims in published maps and institutional affiliations. |
© 2022 by the authors. Licensee MDPI, Basel, Switzerland. This article is an open access article distributed under the terms and conditions of the Creative Commons Attribution (CC BY) license (https://creativecommons.org/licenses/by/4.0/).
Share and Cite
Hahnefeld, L.; Vogel, A.; Gurke, R.; Geisslinger, G.; Schäfer, M.K.E.; Tegeder, I. Phosphatidylethanolamine Deficiency and Triglyceride Overload in Perilesional Cortex Contribute to Non-Goal-Directed Hyperactivity after Traumatic Brain Injury in Mice. Biomedicines 2022, 10, 914. https://0-doi-org.brum.beds.ac.uk/10.3390/biomedicines10040914
Hahnefeld L, Vogel A, Gurke R, Geisslinger G, Schäfer MKE, Tegeder I. Phosphatidylethanolamine Deficiency and Triglyceride Overload in Perilesional Cortex Contribute to Non-Goal-Directed Hyperactivity after Traumatic Brain Injury in Mice. Biomedicines. 2022; 10(4):914. https://0-doi-org.brum.beds.ac.uk/10.3390/biomedicines10040914
Chicago/Turabian StyleHahnefeld, Lisa, Alexandra Vogel, Robert Gurke, Gerd Geisslinger, Michael K. E. Schäfer, and Irmgard Tegeder. 2022. "Phosphatidylethanolamine Deficiency and Triglyceride Overload in Perilesional Cortex Contribute to Non-Goal-Directed Hyperactivity after Traumatic Brain Injury in Mice" Biomedicines 10, no. 4: 914. https://0-doi-org.brum.beds.ac.uk/10.3390/biomedicines10040914