Article

Molecular Signature of Neuroinflammation Induced in Cytokine-Stimulated Human Cortical Spheroids

by
Kim M. A. De Kleijn
1,2,*,
Kirsten R. Straasheijm
2,
Wieteke A. Zuure
1 and
Gerard J. M. Martens
1,2
1
Donders Centre for Neuroscience (DCN), Department of Molecular Animal Physiology, Faculty of Science, Donders Institute for Brain, Cognition and Behavior, Radboud University, 6525 GA Nijmegen, The Netherlands
2
NeuroDrug Research Ltd., 6525 ED Nijmegen, The Netherlands
*
Author to whom correspondence should be addressed.
Submission received: 24 March 2022 / Revised: 22 April 2022 / Accepted: 25 April 2022 / Published: 29 April 2022
(This article belongs to the Special Issue Cytokines and Cytokine Receptors in Brain Homeostasis)

Abstract

:
Crucial in the pathogenesis of neurodegenerative diseases is the process of neuroinflammation that is often linked to the pro-inflammatory cytokines Tumor necrosis factor alpha (TNFα) and Interleukin-1beta (IL-1β). Human cortical spheroids (hCSs) constitute a valuable tool to study the molecular mechanisms underlying neurological diseases in a complex three-dimensional context. We recently designed a protocol to generate hCSs comprising all major brain cell types. Here we stimulate these hCSs for three time periods with TNFα and with IL-1β. Transcriptomic analysis reveals that the main process induced in the TNFα- as well as in the IL-1β-stimulated hCSs is neuroinflammation. Central in the neuroinflammatory response are endothelial cells, microglia and astrocytes, and dysregulated genes encoding cytokines, chemokines and their receptors, and downstream NFκB- and STAT-pathway components. Furthermore, we observe sets of neuroinflammation-related genes that are specifically modulated in the TNFα-stimulated and in the IL-1β-stimulated hCSs. Together, our results help to molecularly understand human neuroinflammation and thus a key mechanism of neurodegeneration.

1. Introduction

The pro-inflammatory cytokines tumor necrosis factor alpha (TNFα) and interleukin-1beta (IL-1β) play a crucial role in the homeostasis of the central nervous system (CNS), a number of neurological diseases, and CNS injury and repair [1,2,3,4,5,6,7]. For instance, levels of TNFα are elevated in patients suffering from Alzheimer’s disease (AD) [6], major depression [8,9], multiple sclerosis (MS) [10] and acute brain trauma and other encephalopathies [6]. Elevated IL-1β-levels have been reported in AD, Parkinson’s disease (PD), MS [11], epilepsy and stroke [3,7]. Furthermore, TNFα and IL-1β have important functions during human fetal brain development [12]. To explore how TNFα and IL-1β may contribute to disease onset, progression and maintenance is challenging, as studying the effects of these cytokines in an animal model entails translational issues and research with a cell line or co-culture cell model represents a reductionistic approach. Human brain organoids constitute an attractive three-dimensional (3D) model to study human brain developmental processes as well as the pathophysiological mechanisms underlying neurodevelopmental and neurodegenerative diseases, including neuroinflammatory processes [13,14,15,16].
Recently, we designed a protocol to generate human cortical spheroids (hCSs) comprising neuroectoderm-derived neural progenitor cells (NPCs), excitatory and inhibitory neurons, astrocytes and oligodendrocyte lineage cells as well as mesoderm-derived microglial and endothelial cells. In the current study, we set out to explore the effects of stimulating our hCSs for three time periods with TNFα and IL-1β. We use transcriptome-wide RNA-sequencing (RNA-seq) analysis to show that the major process induced by TNFα as well as by IL-1β is neuroinflammation. Central in this process are endothelial cells, microglia and astrocytes, and activation of the NFκB and STAT pathways. In addition to this equivalent impact of TNFα and IL-1β, we find that each of the two cytokines has specific and stimulation-time-dependent effects on hCS gene expression, and that IL-1β exhibits a faster self-inhibitory feedback response to dampen neuroinflammation than TNFα.

2. Materials and Methods

2.1. Culture of H9 Embryonic Stem Cells (ESCs)

H9 ESCs (WA09; WiCell, passage number 24) were grown feeder independently in E8 medium with Revitacell (diluted 1:100; Thermo Fisher, Waltham, MA, USA, A26445-01) supplemented with Penicillin-Streptomycin (Pen-Strep, 1:100, Thermo Fisher, 15140-122) on Corning Matrigel-coated surfaces (1:60; Corning, Wiesbaden, Germany, CLS354277) at 37 °C and 5% CO2. H9 ESCs were passaged twice per week at 1:20–25 splitting ratio. Cells were dissociated by a 5-min 37 °C incubation with Accutase (Invitrogen, Carlsbad, CA, USA, 00-4555-56), centrifuged at 1000 rpm for 5-min in Dulbecco’s phosphate-buffered saline (DPBS) and resuspended in E8 medium. Daily visual inspections were performed to ensure the undifferentiated state of the ESC cultures, and differentiated colonies were marked with a cell-culture marker and removed by micropipette suction. MycoAlert Mycoplasma tests (Lonza, Basel, Switzerland, LT07-118) were performed four times per year to ensure the mycoplasma-free status of the H9 ESC cultures.

2.2. Generation of hCSs

To generate hCSs, intact H9 ESC-colonies were detached with ReLESR (STEMcell technologies, Vancouver, BC, Canada, 05872) and low-adherence V-bottom 96-wells (S-Bio, #MS-9096VZ) were seeded with ~1.25 × 10⁴ cells per well. For the first seven days, spheroids were incubated with Spheroid Starter Medium (SSM: DMEM-F12 (Gibco, Madrid, Spain, 31331-028) with 20% knock-out serum (Gibco, 10828-028), 1% non-essential amino acids (Gibco, 11140050), 1% Pen-Strep and 0.1% 2-mercaptoethanol (Thermo Fisher, 31350-010) supplemented with 10 μM of the TGF-β signaling inhibitor SB-431542 (Sigma-Aldrich, Merck Life Science NV, Amsterdam, The Netherlands, S4317) and 1 μM of the BMP4 signaling inhibitor dorsomorphin (Sigma-Aldrich, P5499). Only during cell seeding was 2 μM ROCK inhibitor thiazovivin (Sigma-Aldrich, SML1045) added. The medium was then switched to Neurobasal-A spheroid medium (Thermo Fisher, 10888-022) with 2% B27 supplement minus vitamin A (Gibco; 12587-010), 1% GlutaMAX (Gibco, 35050-061) and 1% Pen-Strep (NSMnogel) (day 7 (d7) until day 25) and subsequently to NSMnogel medium with 15 μg/mL Geltrex (Thermo Fisher, A1413302) (NSM medium) until day 150 (d150). Between d14 and d25 half of the medium was refreshed daily. At d25, hCSs were transferred to 6-well low-attachment plates with a P1000 cut-open tip (~24 spheroids in 6 mL per dish). Between d25 and d150 half of the medium was refreshed every other day. Between d27 and d43 the NSM medium was supplemented with 20 ng/mL NT-3 (Sigma-Aldrich, SRP3128) and 20 ng/mL BDNF (Sigma-Aldrich, SRP3014). Between d43 and d51 the NSM medium was not supplemented with NT-3 and BDNF. Between d51 and d61 the NSM medium was supplemented with 10 ng/mL PDGF-AA (Sigma-Aldrich; H8291) and 10 ng/mL IGF1 (R&D systems, Minneapolis, MN, USA, 291-G1-200). From d61 until d73, half of the medium was refreshed with NSM medium containing 4 μM ketoconazole (Sigma-Aldrich, K1003). From d73 onwards, the medium consisted of NSM only. The sizes of our d150 hCSs were between 0.5 and 1.5 mm. During the entire growth period and all experiments, hCSs were kept at 37 °C and 5% CO2. Mycoplasma testing of the hCSs was performed four times per year.

2.3. Culture of Human Microglia (HMC3) and Human Oligodendrocyte (HOG) Cell Lines

HMC3 cells were purchased from ATCC (American Type Culture Collection, Manassas, VA, USA, CRL-3304). The HOG cell line was a kind gift of Dr. José Antonio López Guerrero (University of Madrid, Spain). The HMC3 and HOG cells were grown in EMEM (Lonza, BE12-662F) with 10% heat-treated FBS (Gibco, 10270106), 1% glutamax and 1% Pen-Strep, and passaged twice per week at a 1:20 splitting ratio (maximum passage number 35). The medium was refreshed every other day. Mycoplasma testing of the cell lines was performed tri-annually.

2.4. Pro-Inflammatory Cytokine Stimulation

For cytokine-stimulation experiments, d150 hCSs were transferred to low-attachment 6-well plates (Corning) that were placed on a gentle cell-culture incubator rocker in order to achieve an optimal flow of cytokines during the stimulation period. hCSs were incubated with 5 ng/mL TNFα (Sigma-Aldrich T0157-10UG; in PBS) or 5 ng/mL IL-1β (Sigma-Aldrich SRP3083-10UG; in PBS) for 4 h, 12 h or 36 h. The cytokine concentrations and stimulation time points were chosen based on our previous studies, studies utilizing 2D cell models [17,18,19,20,21], and the only study published thus far that dealt with cytokine (TNFα) stimulation of a 3D human brain organoid [22]. Following stimulation, spheroids were harvested for RNA isolation and the RNA was subjected to RNA-seq analysis as described below. Unstimulated hCSs from the same batch were used as controls. For pro-inflammatory stimulation experiments with HMC3 and HOG cells, the cells were incubated with 100 ng/mL LPS (Sigma-Aldrich, L4391-1MG) (dissolved in PBS) for 24 h (24 h) with subsequent incubation with 5 ng/mL TNFα (in PBS) and 5 ng/mL IL-1β (in PBS). Following stimulation, HMC3 and HOG cells were harvested for RNA isolation and the RNA was subjected to RNA-seq analysis, as described below.

2.5. RNA Isolation

Each hCS was transferred with a cut-open P1000 tip to 300 μL TRIzol reagent (Thermo Fisher; 15596026), snap frozen in liquid nitrogen and stored at −20 °C. For RNA isolation, hCSs were thawed and lysed in 400 μL TRIzol at room temperature for 5 min, then broken into smaller pieces with a P200 tip and incubated for an additional 30 min on ice. HMC3 and HOG cell pellets were snap frozen upon collection, thawed in 400 μL TriZOL and incubated for 30 min on ice. Chloroform was added to the lysed hCSs, HMC3 and HOG cells, and total RNA was extracted, precipitated with 100% 2-propanol and glycogen, washed twice with ice-cold 75% ethanol and dissolved in nuclease-free water. RNA was stored at −20 °C until further processing.

2.6. RNA-Seq Analysis

For RNA-seq analysis (BGI Genomics, Shenzhen, China), equal amounts of total RNA samples from 4–5 hCSs were pooled to a total of 700 ng RNA or 1.5 μg total RNA per HMC3 and HOG sample was used. For the determination of total RNA sample quality (RNA concentration, RNA integrity number (RIN) value, 28S/18S and the fragment length distribution), an Agilent 2100 Bioanalyzer (Agilent RNA 6000 Nano Kit, Agilent Technologies, Waldbronn, Germany) was used. Bulk RNA-seq analysis of total RNA samples (RIN value over 7.0, except for the hCSs LPS + TNFα + IL-1β sample: RIN 6.1) was performed on a DNBseq platform with a read depth of 30,000 reads; clean reads were mapped to reference genome h38 using HISAT2 (v2.0.4) and between 17,000 and 18,000 genes were identified. For the identification of differentially expressed genes (DEGs), clean reads were mapped to reference by Bowtie2 (v2.2.5), RNA expression levels were calculated with RSEM (v1.2.12) [23], and DEGs were detected with PoissonDis, as previously described [24] (fold change, FC, equal to or over 2.00 and false discovery rate, FDR, equal to or below 0.001). For the basal expression levels of all genes (fragments per kilobase of exon per million mapped fragments, FPKM), see Supplementary Information S1. For gene nomenclature, Log2 FC-values relative to 0 h stimulation and FDR-corrected p-values of the DEGs, see Supplementary Information S2. The RNA-seq data for the hCSs has been deposited under GEO accession number GSE200779, and for HMC3 and HOG under GEO accession number GSE200354. The RNA-seq data was validated by qPCR analysis and we calculated per time point the one-tailed Pearson correlation coefficient between the Log2 FC-values as obtained by RNA-seq and the mean Log2 FC-values as obtained by qPCR.

2.7. Bioinformatics Analysis

For an overview of the bioinformatics analysis of DEGs in the stimulated hCSs, see Supplementary Figure S1. The KEGG-pathway tool was used for pathway classification and functional enrichment (via the Phyper R-function) of DEGs in hCSs stimulated by TNFα or IL-1β for 4 h, 12 h or 36 h. The p-value per pathway was calculated via the hypergeometric distribution method, and the FDR was calculated per p-value (FDR < 0.01 are significantly enriched). The most biologically relevant pathways (core KEGG pathways) were identified based on a p-value below 10−11 and comprised “Cytokine-Cytokine receptor interaction”, “TNF signaling” and “NFκB signaling”.
Per stimulation time point, and for both TNFα or IL-1β, we constructed molecular landscapes reflecting the functional interactions between the proteins encoded by the DEGs in the three core KEGG pathways. We next constructed a molecular landscape based on the 95 DEGs that were present in the hCS DEG-lists of at least one TNFα and one IL-1β stimulation time point (a total of 1076 common genes) and that were annotated to one of the three core KEGG pathways.
The functions of the proteins encoded by the 95 DEGs were deduced on the basis of information obtained from GeneCards (Human Genome Database) and UniprotKB (Swiss Institute of Bioinformatics), and used to build the molecular landscape that was depicted in Biorender (www.Biorender.com; accessed on 22 March 2022).
To analyze the time courses of mRNA expression (hCS stimulation periods of 4 h, 12 h and 36 h relative to no stimulation), the expression profiles of the 1076 common DEGs were subjected to cluster analysis. Based on the Log2 transformed FC at the stimulation time points (4 h, 12 h or 36 h) relative to no stimulation and using a threshold of Log2 FC of 2.5 for the Boolean clustering strategy, this analysis revealed 22 clusters (Supplementary Table S1). As such, virtually all of the 1076 genes were allocated to a cluster (99.07% and 99.54% of the TNFα- and IL-1β-induced DEGs were clustered, respectively; Supplementary Table S2). A relatively low percentage of the DEGs overlapped between the TNFα- and IL-1β-clusters, except for clusters 8 and 22 (Supplementary Table S3); note that the two latter clusters contain a high number of DEGs (Supplementary Table S3) and that these DEGs display a relatively low Log2 FC at all three time points (between −2.5 and 0, or between 0 and 2.5) (Supplementary Table S1). The biological functions of the genes allocated to a TNFα-specific or IL-1β-specific cluster were deduced on the basis of information obtained from GeneCards and UniprotKB.
From a human fetal brain single-cell RNA-seq dataset (gestational weeks 22–23; [25]), we identified gene markers in five different brain regions (frontal cortex, parietal cortex, temporal cortex, occipital cortex and non-cortical regions) for neural progenitors (39–91 markers per brain region), excitatory neurons (691–1444 markers), inhibitory neurons (152–381 markers), astrocytes (92–262 markers), oligodendrocyte precursors (50–71 markers), microglia (491–708 markers) and endothelial cells (316–473 markers) on the basis of their mRNA expression levels in the other cell types being at least ten-fold lower (Supplementary Information S3). In order to estimate to which extent each brain cell type was affected by the cytokine treatment, for each cell type its number of marker genes present in the list of DEGs from our TNFα- or IL-1β-stimulated hCSs was determined, and this number was divided by the total number of marker genes for this cell type.
We further calculated the percentages of overlap between the DEGs in our TNFα- or IL-1β-stimulated hCSs and marker genes for neurodegenerative disease brain cell types as determined in [26] and derived from datasets of the superior frontal gyrus from AD (GEO accession number GSE48350; GSE26927), PD (GSE8397) and MS (GSE26927). In addition, we utilized the nCounter Analysis System from the Nanostring project (www.nanostring.com, accessed on 22 March 2022) to obtain genes genetically associated with AD, PD and MS, as well as genes annotated to the molecular signaling pathways “NFκB”, “neuroinflammation” and “inflammation” to determine their extent of overlap with the DEGs in our TNFα- or IL-1β-stimulated hCSs as well as their extent of overlap with the brain cell-type markers (derived from [25]) that were modulated by TNFα- or IL-1β.

2.8. Quantitative PCR (qPCR) Analysis

Following DNAse treatment of the RNA, cDNA synthesis was performed with the Revert Aid H-minus first-strand cDNA synthesis kit (Thermo Scientific). qPCR reactions were performed with SensiFAST™ Probe No-ROX (Meridian Bioscience-Bioline, Memphis, TN, USA, BIO-86005) on 1:10 diluted cDNA (for primer sequences, see Supplementary Table S4) in a Corbett Life Sciences Rotor-Gene 6000. We amplified cDNA for 50 cycles of 95 °C (5 s), 60 °C (10 s) and 72 °C (15 s), and melt-curve analysis was performed to confirm the correct amplicon size. Relative mRNA expression levels were calculated as described in Vandesompele et al. (2002) [27], on take-off (ct) values normalized to GAPDH/YWHAZ expression, with the following formula:
  Q x = μ e f f ( c t m i n c t x )
In which μ e f f is the average amplification efficiency of all samples amplified with a certain primer pair, c t m i n is the minimum ct value of these samples and c t x is the ct value of the sample for which the Qx-value is calculated. This formula takes into account the mean amplification efficiency for one primer pair and scales all values between 0 and 1 for relative comparisons.

2.9. Immunocytochemistry

hCSs were fixed in 4% paraformaldehyde (PFA, prepared in phosphate buffer) for 45 min at room temperature, washed twice with PBS, incubated for 2 h in 15% sucrose in PBS (4 °C) and then incubated overnight in 30% sucrose in PBS (4 °C). Next, hCSs were embedded in O.C.T. Compound (VWR, Amsterdam, The Netherlands, 361603E) and cut into 5 μm sections on SuperFrost PLUS slides (VWR; J1800AMNZ) at −20 °C. For immunocytochemistry, sections were rehydrated for 5 min in PBS, blocked in home-made blocking buffer (5% goat/donkey/horse serum, 1% BSA, 1% Glycine, 0.1% D-lysine, in PBS) with or without 0.4% Triton-X100 for 30 min at room temperature. Antibodies were diluted in either PBS or PBS-Tween 20 0.1%. We used the antibodies MAP2 (Aves labs, Davis, CA, USA, AB_2313549; 1:200), TAU (Aves labs, AB_2313563; 1:200), GFAP (UC Davis/NIH NeuroMab facility, Davis, CA, USA, N206B/9; 1:500), O1 (Invitrogen, 14-6506-82; 1:200), P2RY12 (Biolegend, San Diego, CA, USA, 848002; 1:250), TMEM119 (Sigma, HPA051870; 1:500) and PECAM1/CD31 (NovusBio, Centennial, CO, USA, JC/70A; 1:100). All primary antibodies were incubated overnight at 4 °C and all secondary antibodies (1:500) for 2 h at room temperature. Washes were performed with PBS or PBS-Tween 20 0.1% (depending on the antibody protocol). DAPI was incubated in PBS (1:5000) for 30 min at room temperature. To test for any background staining, primary antibodies first validated in hCSs at a culture time point at which, based on mRNA expression data, no antigen expression was expected. Sections were imaged with the EVOS FL Auto 2 microscope (Thermo Fisher) with a 60× Olympus oil objective (Thermo Fisher).

2.10. Statistical Analysis

The difference between the mRNA expression levels of cell-type-specific markers in H9 hESCs and H9-derived d150 hCSs (Supplementary Figure S2A) was statistically tested with independent sample t-tests. When the p-value of the Levene’s test for equality of variances was below 0.05, we report the p-value without assumed equality of variances. To analyse the mRNA expression levels of a number of neuroinflammation-related genes modulated in stimulated hCSs (Supplementary Figure S3), One-way ANOVA with Dunnett’s post hoc test (one-sided) relative to the unstimulated (0 h) hCSs was used, which involved multiple testing correction. p-values below 0.05 were considered statistically significant. Errors bars in mRNA expression graphs represent the standard error of the mean.

3. Results

3.1. Neuroinflammation Is the Main Process Elicited in hCSs Stimulated with the Pro-inflammatory Cytokines TNFα and IL-1β

To investigate the effects of cytokine stimulation on our 3D hCSs comprising multiple brain cell types derived from both the neuroectoderm (neural progenitor cells, excitatory neurons, inhibitory neurons, astrocytes and oligodendrocytes) and the mesoderm (microglia and endothelial cells) (Supplementary Figure S2A,B), spheroids were incubated for either 4 h, 12 h or 36 h in the presence of 5 ng/mL TNFα or 5 ng/mL IL-1β. RNA-seq analysis of total RNA extracted from hCSs stimulated with TNFα and from control, unstimulated hCSs revealed 1119 DEGs (4 h TNFα; 646 upregulated, 473 downregulated), 1255 DEGs (12 h TNFα; 627 upregulated, 628 downregulated) and 1083 DEGs (36 h TNFα; 534 upregulated, 549 downregulated). In IL-1β-stimulated hCSs, we found 962 DEGs (4 h IL-1β; 420 upregulated, 542 downregulated), 588 DEGs (12 h IL-1β; 436 upregulated, 152 downregulated) and 602 DEGs (36 h IL-1β; 350 upregulated, 252 downregulated). The RNA-seq data was validated by qPCR analysis of a number of neuroinflammation-related genes modulated in the stimulated hCSs (Supplementary Figure S3), showing at all time points a highly significant correlation between the RNA-seq and qPCR data from the TNFα-stimulated hCSs (Supplementary Table S5) as well as between the RNA-seq and qPCR data from the IL-1β-stimulated hCSs (Supplementary Table S6).
KEGG-pathway analysis of the DEGs revealed that among the top-4 pathways at the three time points examined and in both TNFα- and IL-1β-stimulated hCSs, the three most frequently annotated (core) pathways were “Cytokine-cytokine receptor interaction” (ko04060), “TNF signaling pathway” (ko04668) and “NF-kappa B (NFκB) signaling pathway” (ko04065) (Figure 1A). The genes comprising the TNF signaling and NFκB signaling pathways showed the highest overlap (27.7% of the TNF signaling genes are also NFκB signaling genes), while the genes in the Cytokine-cytokine receptor interaction pathway displayed an overlap of only 7.8% and 9.5% with TNF signaling and NFκB signaling genes, respectively (Figure 1B). Gene ontology (GO) analysis of the DEGs also yielded mainly inflammation-related pathways, including “cytokine activity”, “cytokine receptor binding”, and “receptor ligand activity” (Supplementary Figure S4A). About half of the genes in the three core-KEGG-pathways were also present in the three core-GO-pathways (Supplementary Figure S4B). GO-analysis of the upregulated DEGs revealed mostly (neuro) inflammation-related pathways, while the downregulated DEGs were mostly related to “Extracellular matrix remodeling” (Supplementary Figure S4C).

3.2. Genes Dysregulated in TNFα- and IL-1β-Stimulated hCSs Are Involved in Positive and Negative Feedback Loops of Neuroinflammatory Signaling Pathways

To identify shared components of the neuroinflammatory response induced in the TNFα- as well as in the IL-1β-stimulated hCSs, we constructed a molecular landscape that showed the functional interactions between the proteins encoded by the common DEGs present in the three core KEGG pathways (Supplementary Figure S5A; Supplementary Information S4). The main biological processes apparent from the molecular landscape were NFκB- and STAT-dependent transcriptional activation. Crucially, the activation of transcriptional programs by NFκB (via IKK, NFKBIA, NFKB1/2 and RELB) and STAT (via JAK1/2, TYK2 and STAT1/3/5/6) (Supplementary Figure S5B,C) induces the expression of pro-inflammatory factors that on their turn trigger these programs to produce cytokines, chemokines and interleukins (such as CXCL1/2/8, CCL9/20 and IL1A/1B/5/6), resulting in a positive feedback loop. Concomitantly, inhibitory NFκB-signaling genes (such as TNFAIP3, BCL3 and NFKBIA) and inhibitory STAT-signaling genes (SOCS3) were rapidly induced following the cytokine stimulation (Supplementary Figure S5B,C), leading to a negative feedback loop. The presence of concurrent positive and negative NFκB- and STAT-feedback loops illustrates the complexity of the cytokine-induced neuroinflammatory response. These data show that at the three time points both TNFα and IL-1β elicit in hCSs an NFκB- and STAT-dependent regulation of various pro-inflammatory cytokines and chemokines, anti-inflammatory modulators, plasma membrane receptors as well as downstream transcription factors.

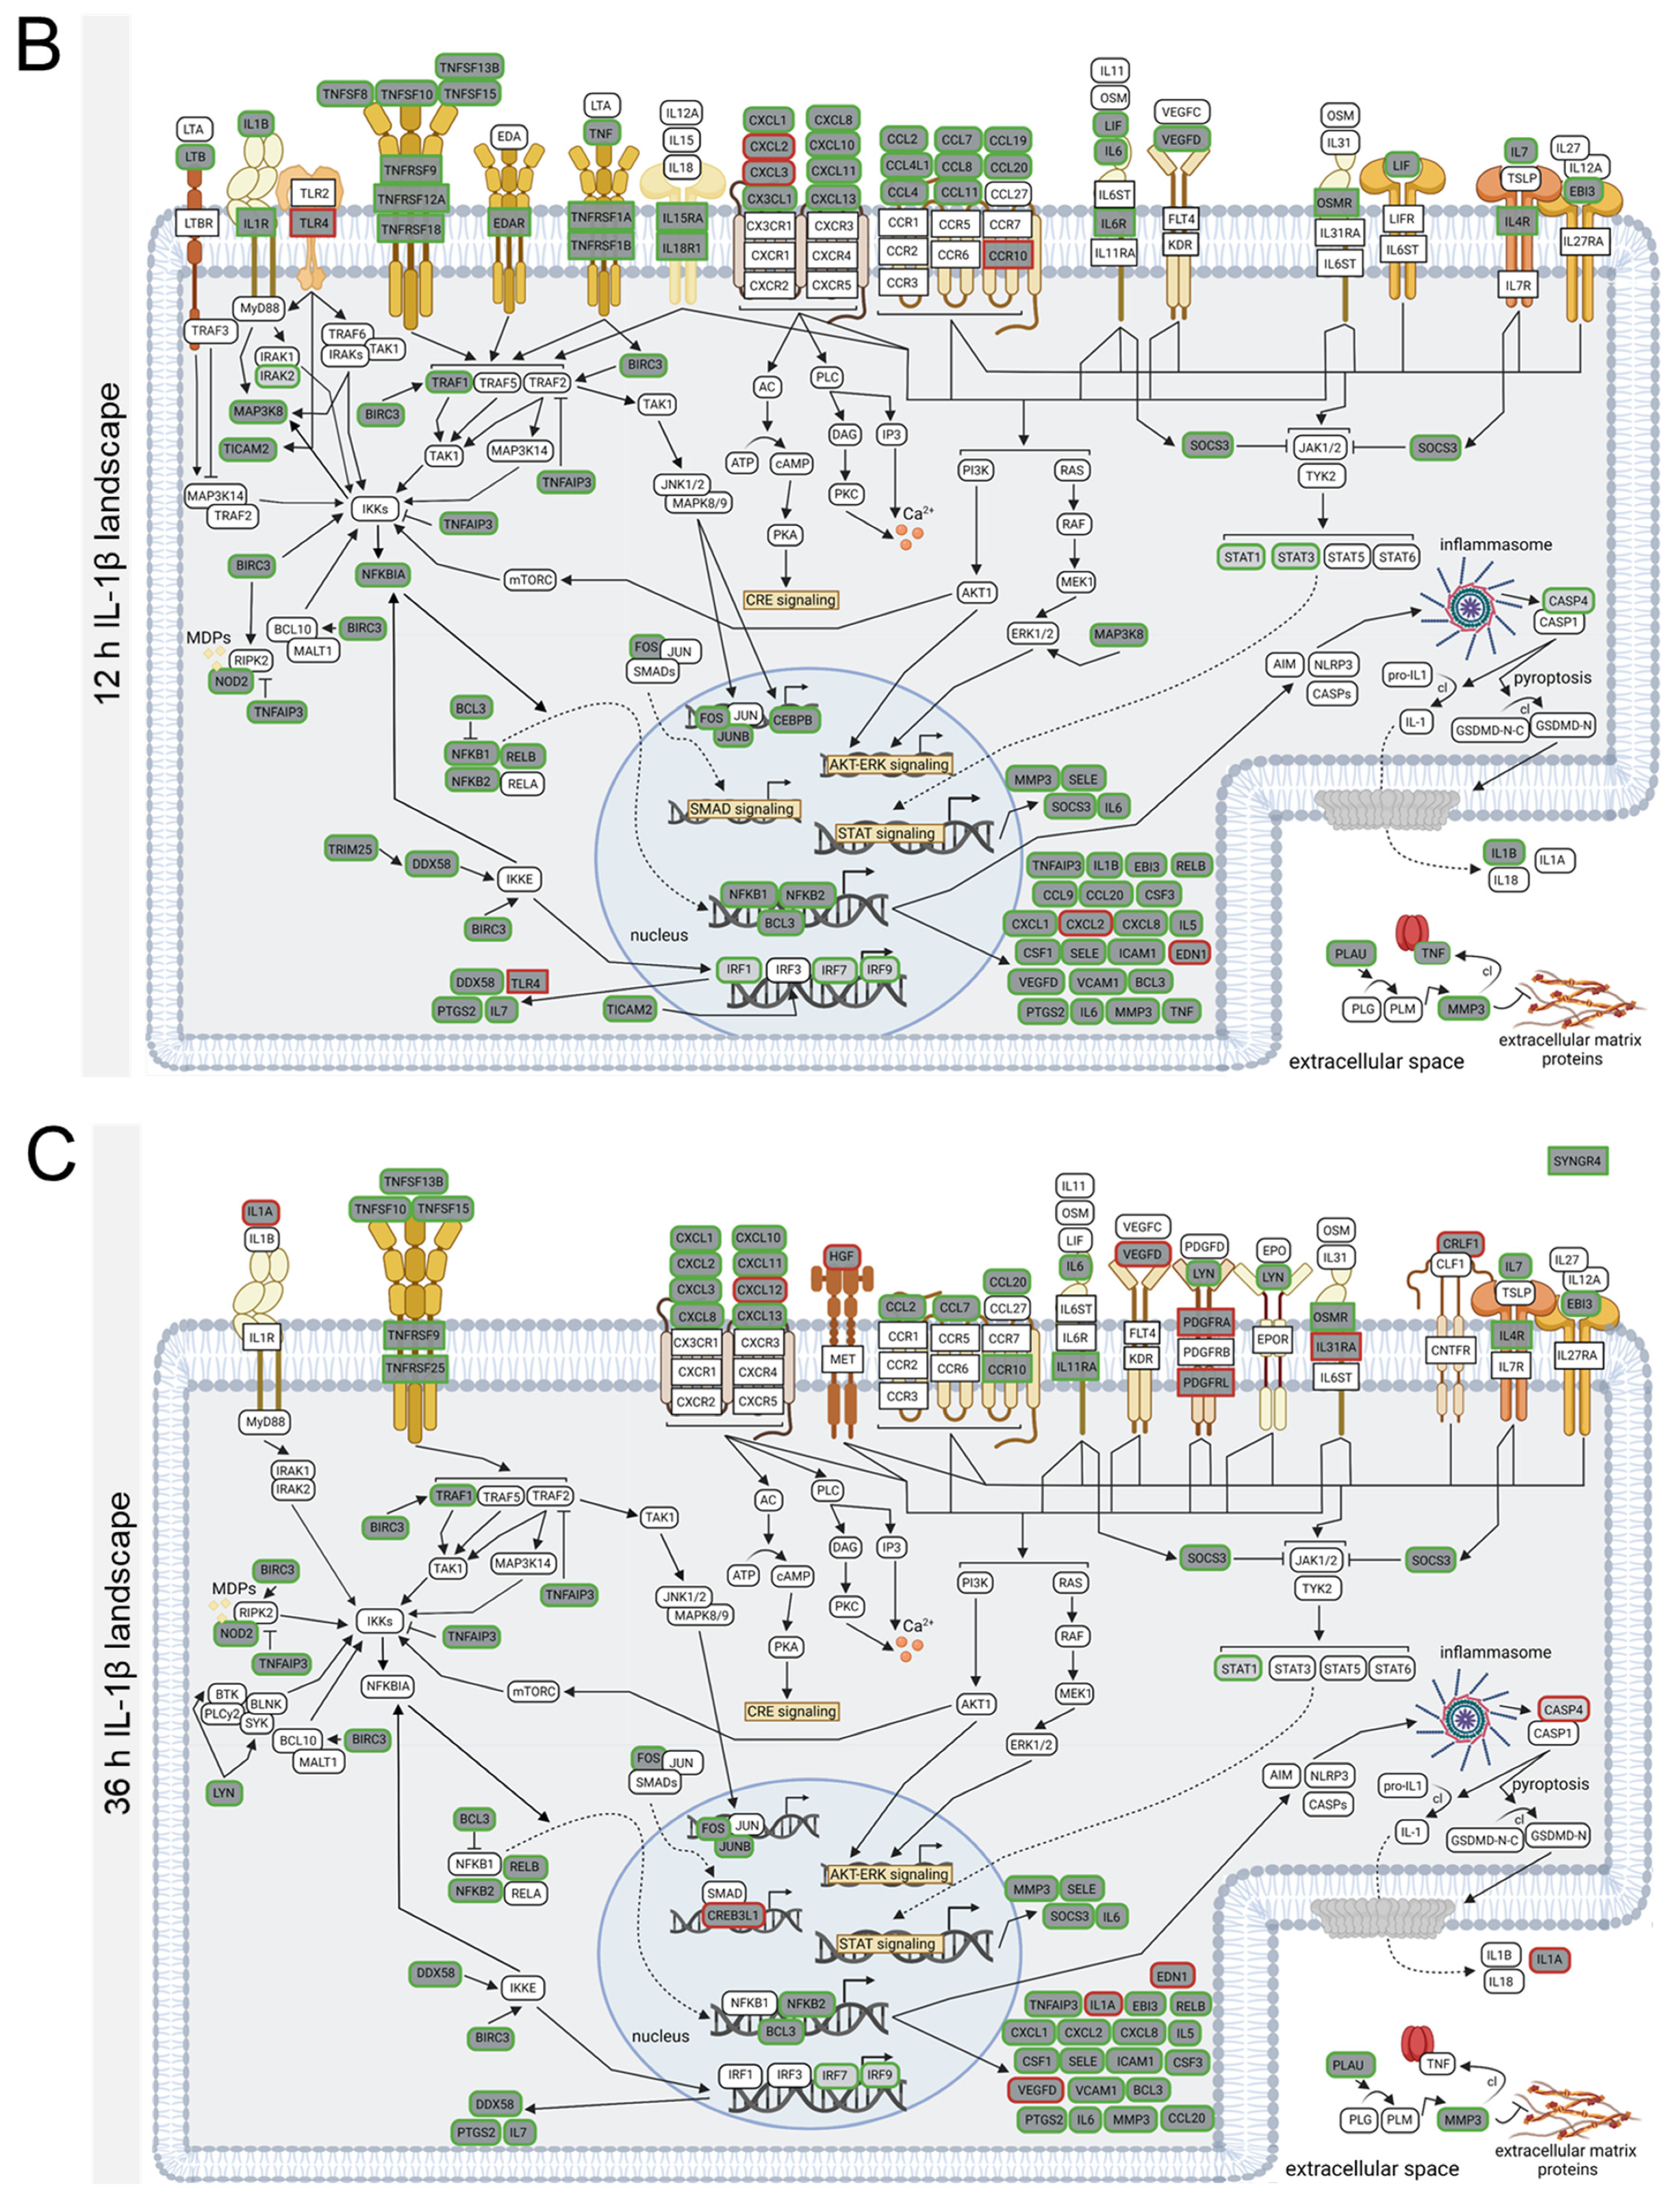
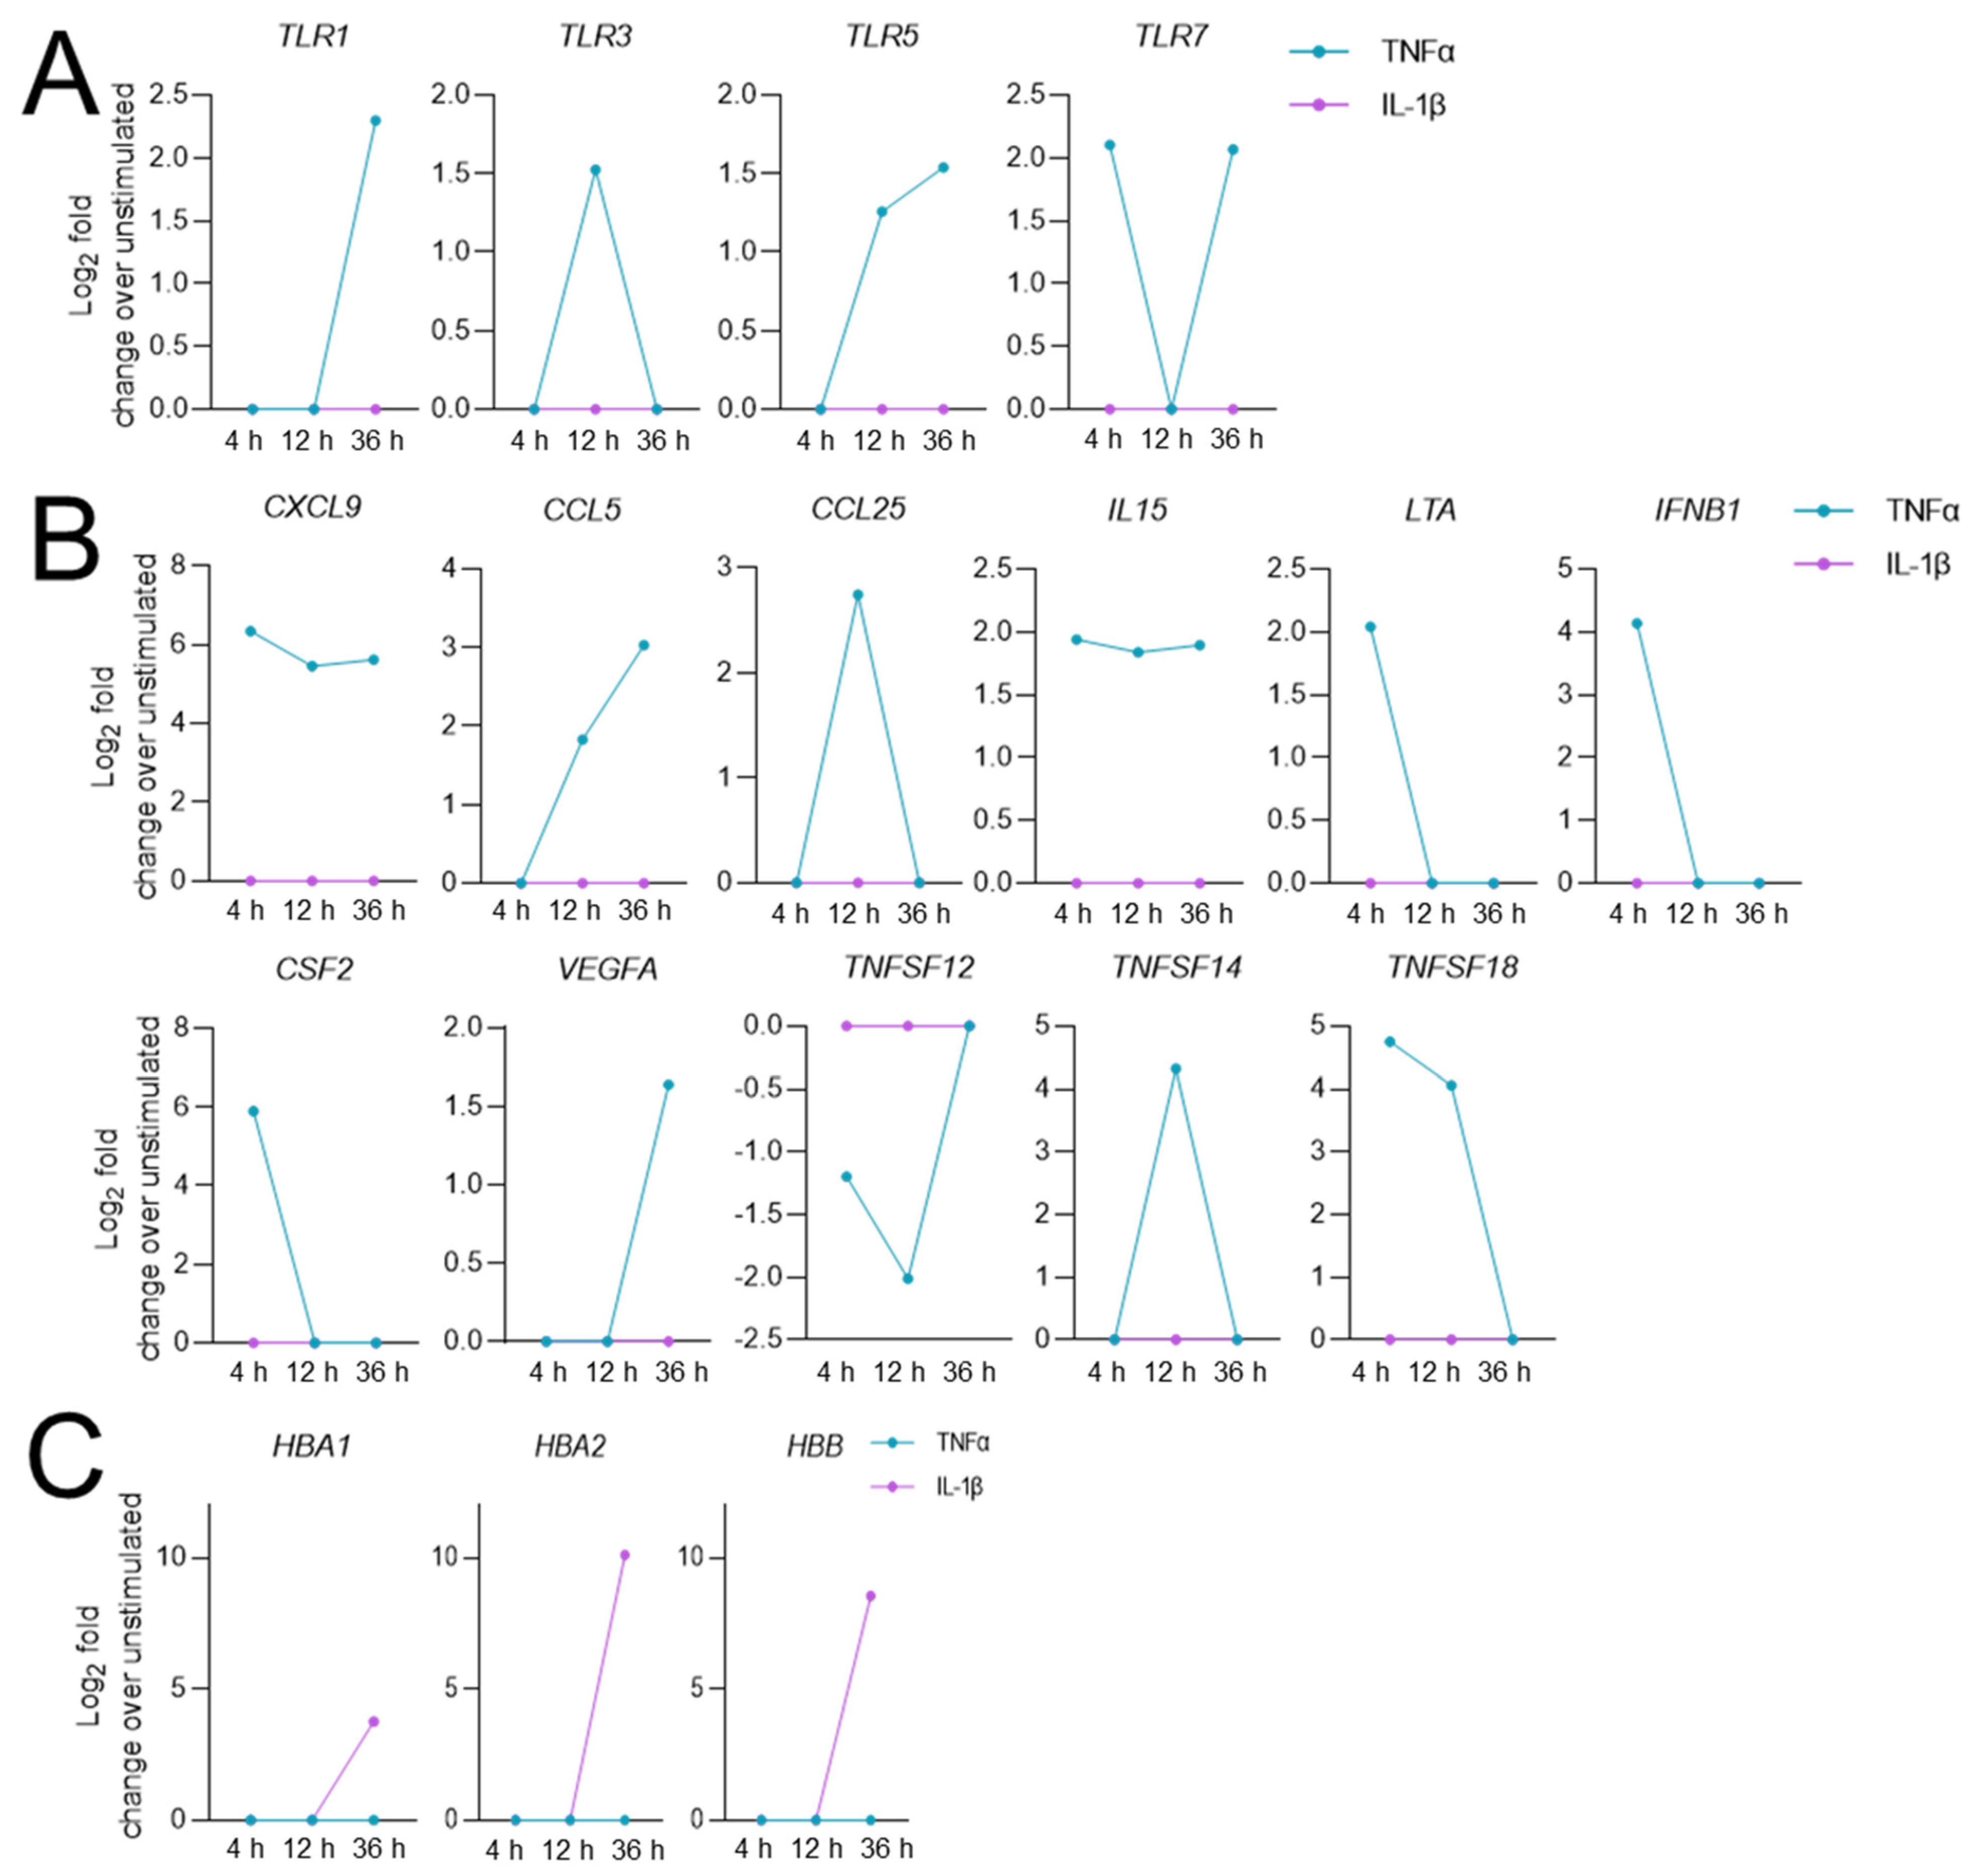
3.3. Stimulation-Time-Dependent Sets of DEGs in TNFα- and IL-1β-Stimulated hCSs

In the TNFα- and IL-1β-stimulated hCSs, we thus identified neuroinflammation-related pathways at all three time points. Yet, at the three time points the TNFα-modulated sets of DEGs showed an overlap of only ~50% (Supplementary Figure S6A), and the overlap between the three IL-1β-modulated DEG sets was only ~40% (Supplementary Figure S6B). Furthermore, the top-upregulated as well as the top-downregulated DEGs (based on Log2 FC) in the TNFα- and IL-1β-stimulated hCSs clearly showed different time-course expression profiles (Supplementary Figure S6C,D), indicating that for each of the two cytokines the compositions of the DEG sets were different at the three time points. On the basis of the TNFα-modulated DEGs annotated to the three core KEGG pathways, we constructed time-point-specific molecular landscapes that showed the marked differences in the various pathway compositions at the three time points (Figure 2A–C; Supplementary Information S5). Similarly, marked pathway composition differences were found by constructing time-point-specific molecular IL-1β landscapes (Figure 3A–C; Supplementary Information S6).
In the hCSs stimulated with TNFα for 4 h, we found the upregulated expression of TNF receptors (TNFRs)4/5/8/9/12A/18, IL receptors (ILRs) 4/6/7/15/18/31 and chemokine receptor CCR10, and their ligands, such as TNFSF7/9/10/13B/15/18, IL6/7/12A/15, CCL2/4/7/8/11/19/20, and CXCL1/2/3/8/9/10/11, acting upstream of NFκB- and STAT-signaling (Figure 2A). The majority of these receptors and ligands remained upregulated following 12 h and 36 h of TNFα stimulation, except for IL12A at 12 h and CCL4/7/11 and TNFSF9/18 at 36 h (Figure 2B,C). In addition, the expression of the early response genes FOS and JUN was upregulated at 4 h TNFα (Figure 2A), and normalized at 12 h and 36 h (Figure 2B,C). Interestingly, already at the 4 h time point, the expression of NFκB-activating (RIPK2, NFKB1, NFKB2, RELB) as well as NFκB-inhibiting (TNFAIP3, BCL3) genes was upregulated (Figure 2A). A similar situation holds for 12 h and 36 h of TNFα stimulation (Figure 2B,C), except for NFKB1 which was no longer a DEG at 36 h TNFα (Figure 2C). The expression of TNF itself was only induced following 4 h and 12 h of TNFα stimulation (Figure 2A,B), in line with a time-dependent normalization of the NFκB response. At all three TNFα-stimulation time points we observed a downregulation of the vascular endothelial receptor KDR (Figure 2A–C). Surprisingly, only at 12 h, but not at 4 h and 36 h, the upstream NFκB-inhibiting receptor LTBR and NFκB-stimulating receptor TLR4 were downregulated (Figure 2B), indicating a simultaneous reduction in the activation and inhibition of the NFκB-pathway. In addition, only at 12 h were the SMAD-activating receptors TGFBR2 and TGFBR3L, and the STAT-activating receptors PDGFRB/L downregulated (Figure 2B). Interestingly, at the 36 h time point we observed the downregulation of two genes related to cilia motility (RSPH10B and RSPH10B2) (Figure 2C).
Similar to the 4 h-TNFα-landscape, the molecular landscape of the 4 h IL-1β time point displayed upregulated expression of the NFκB-activating TNF-receptor superfamily members TNFRSF4/9/12A/18, but not TNFRSF1A and TNFSFR1B (Figure 3A), which showed upregulation only at 12 h IL-1β (Figure 3B). Remarkably, only 2, 3 and 4 out of the 7 TNFα-upregulated TNFSFs were induced at 4 h, 12 h and 36 h IL-1β, respectively (Figure 3A–C). In addition, at the 4 h time point the expression of various other receptors upstream of NFκB-signaling (LTBR) and STAT-signaling (PDGFRB/L, IL11RA) was already downregulated by IL-1β but not TNFα (Figure 2A and Figure 3A). A number of additional 4 h-TNFα-upregulated genes were already downregulated or not a DEG in the 4 h-IL-1β landscape, suggesting that the IL-1β-elicited neuroinflammatory response may have dampened faster than the TNFα-induced response. Indeed, at 12 h and 36 h following IL-1β stimulation PDGFRB, CCR1 and LTBR expression was normalized to baseline levels and the 36 h IL-1β incubation resulted in further normalization to baseline levels of NFκB-activating genes such as IL11RA, IL31RA, NFKB1, NFKBIA and CRLF1 (not DEGs anymore). Also in line with an early dampening of the NFκB-response and in contrast to the findings following 4 h, 12 h and 36 h TNFα stimulation (Figure 2A–C), the expression of the specific NFκB-inhibiting gene PRKQC was only downregulated at the 4 h IL-1β-stimulation time point and normalized to baseline levels at 12 h and 36 h IL-1β (Figure 3A–C). Interestingly, in contrast to the downregulation by 36 h TNFα we observed a downregulation of the cilium motility-related gene RSPH10B (but not RSPH10B2) only following 4 h of IL-1β-stimulation (Figure 3A). These results indicate that despite of the fact that the three core KEGG pathways modulated by TNFα and IL-1β at the three time points were the same, pronounced differences were found in the time-point-dependent and up- or downregulated sets of DEGs contained within these core pathways, whereby the IL-1β stimulation resulted in a faster activation and subsequent normalization of the NFκB- and STAT-pathways.
Next, the 1076 DEGs overlapping between the two cytokine-modulated gene sets at the three stimulation time points were partitioned into 22 clusters, based on the time-course DEG expression profiles following TNFα-stimulation (Figure 4A) and IL-1β-stimulation (Figure 4B); Supplementary Tables S1 and S2 present the clustering strategy and the percentages of DEGs per cluster, respectively. For 12 out of the 22 clusters, we observed less than 25% overlap between the TNFα- and IL-1β-modulated DEGs (Supplementary Table S3; Supplementary Figure S7A), indicating that in the 12 clusters a significant number of genes showed a different time course of expression following either TNFα- or IL-1β-stimulation of the hCSs. To functionally characterize the DEGs with distinct TNFα- or IL-1β- induced time-course expression profiles within the 12 clusters, we performed a literature-based search for the biological roles of these genes. In seven out of the 12 clusters, a number of nonoverlapping genes displayed a notable functional similarity and a role related to neuroinflammation, such as antigen-presentation (4 out of 18 genes in cluster 5; 4/30 in cluster 3), TNF signaling (5/30 in cluster 3; 3/18 in cluster 5), interferon-signaling/NFκB-signaling/STAT-signaling (13/40 in cluster 4; 7/40 in cluster 7), chemoattraction and cell migration (6/42 in cluster 4), extracellular matrix (ECM; 8/49 in cluster 21), cytoskeleton-related (3/5 in cluster 17), proteasome (3/30 in cluster 3), Wnt signaling (3/30 in cluster 3) and fibrin/collagen-associated (9/54 in cluster 21) genes (Supplementary Figure S7B). This shows that beyond genes annotated to the three core KEGG pathways, other genes induced in the TNFα- and IL-1β-stimulated hCSs display distinct time-course expression profiles and are also related to neuroinflammation.

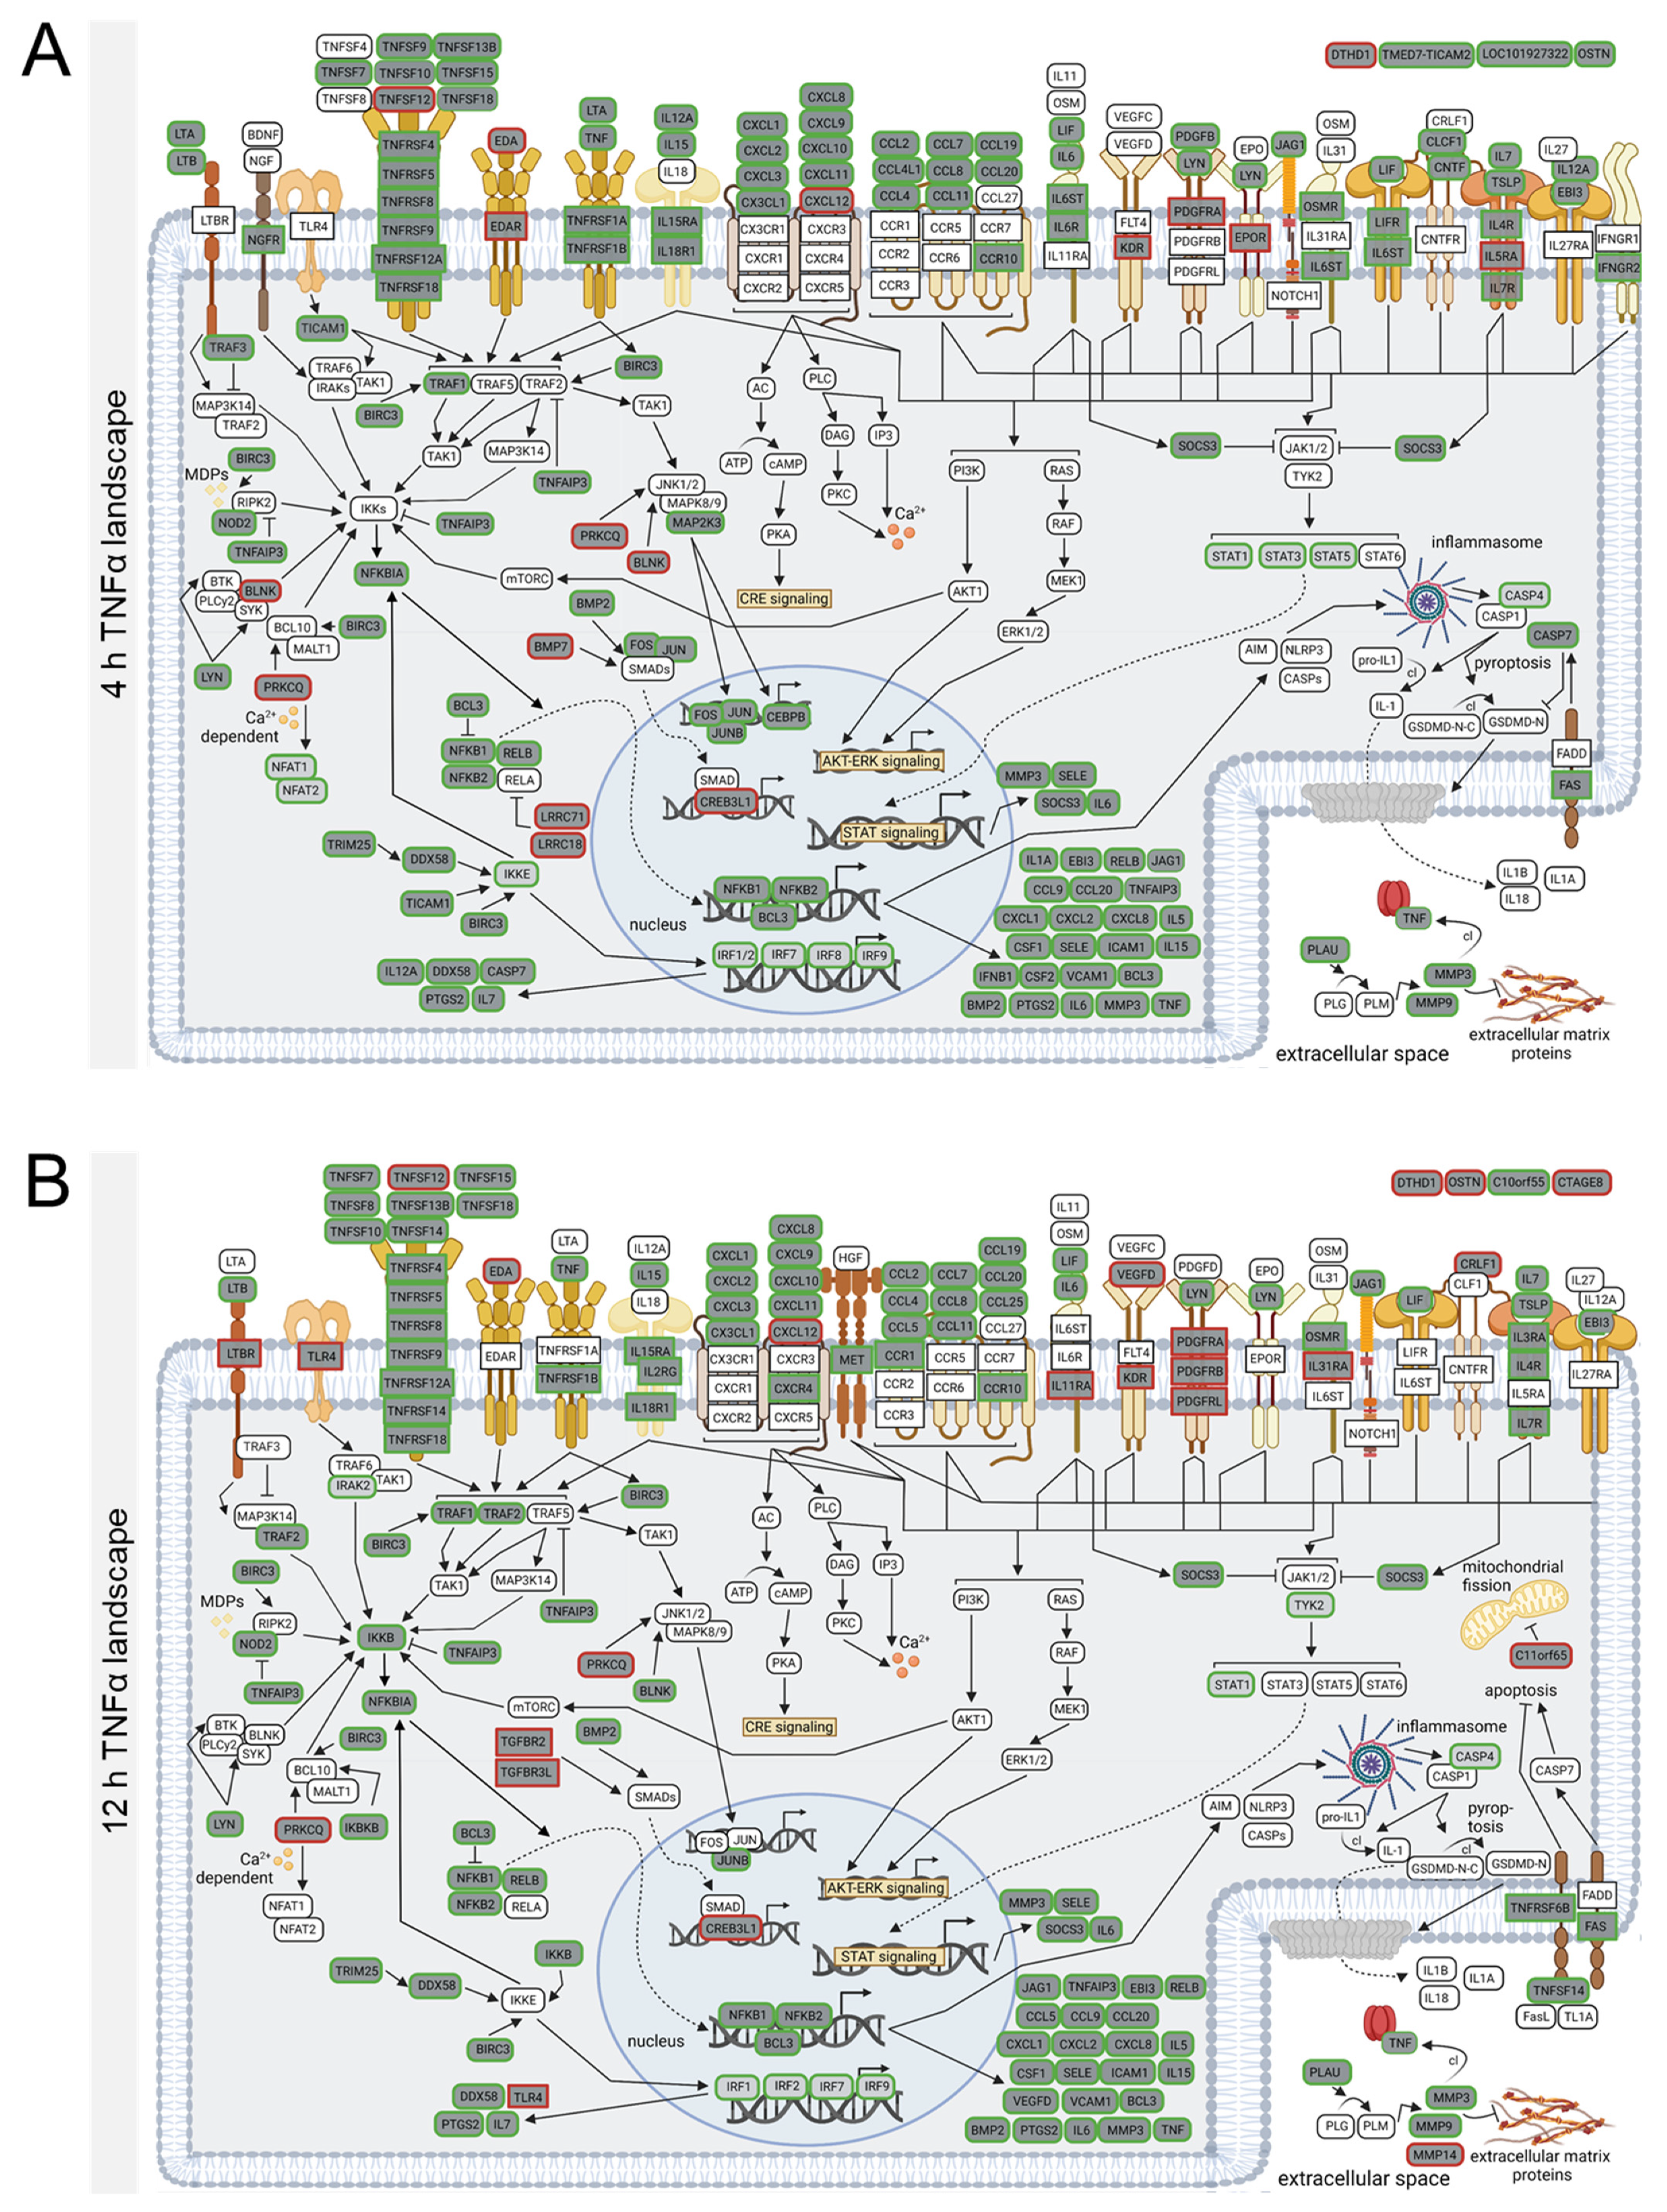
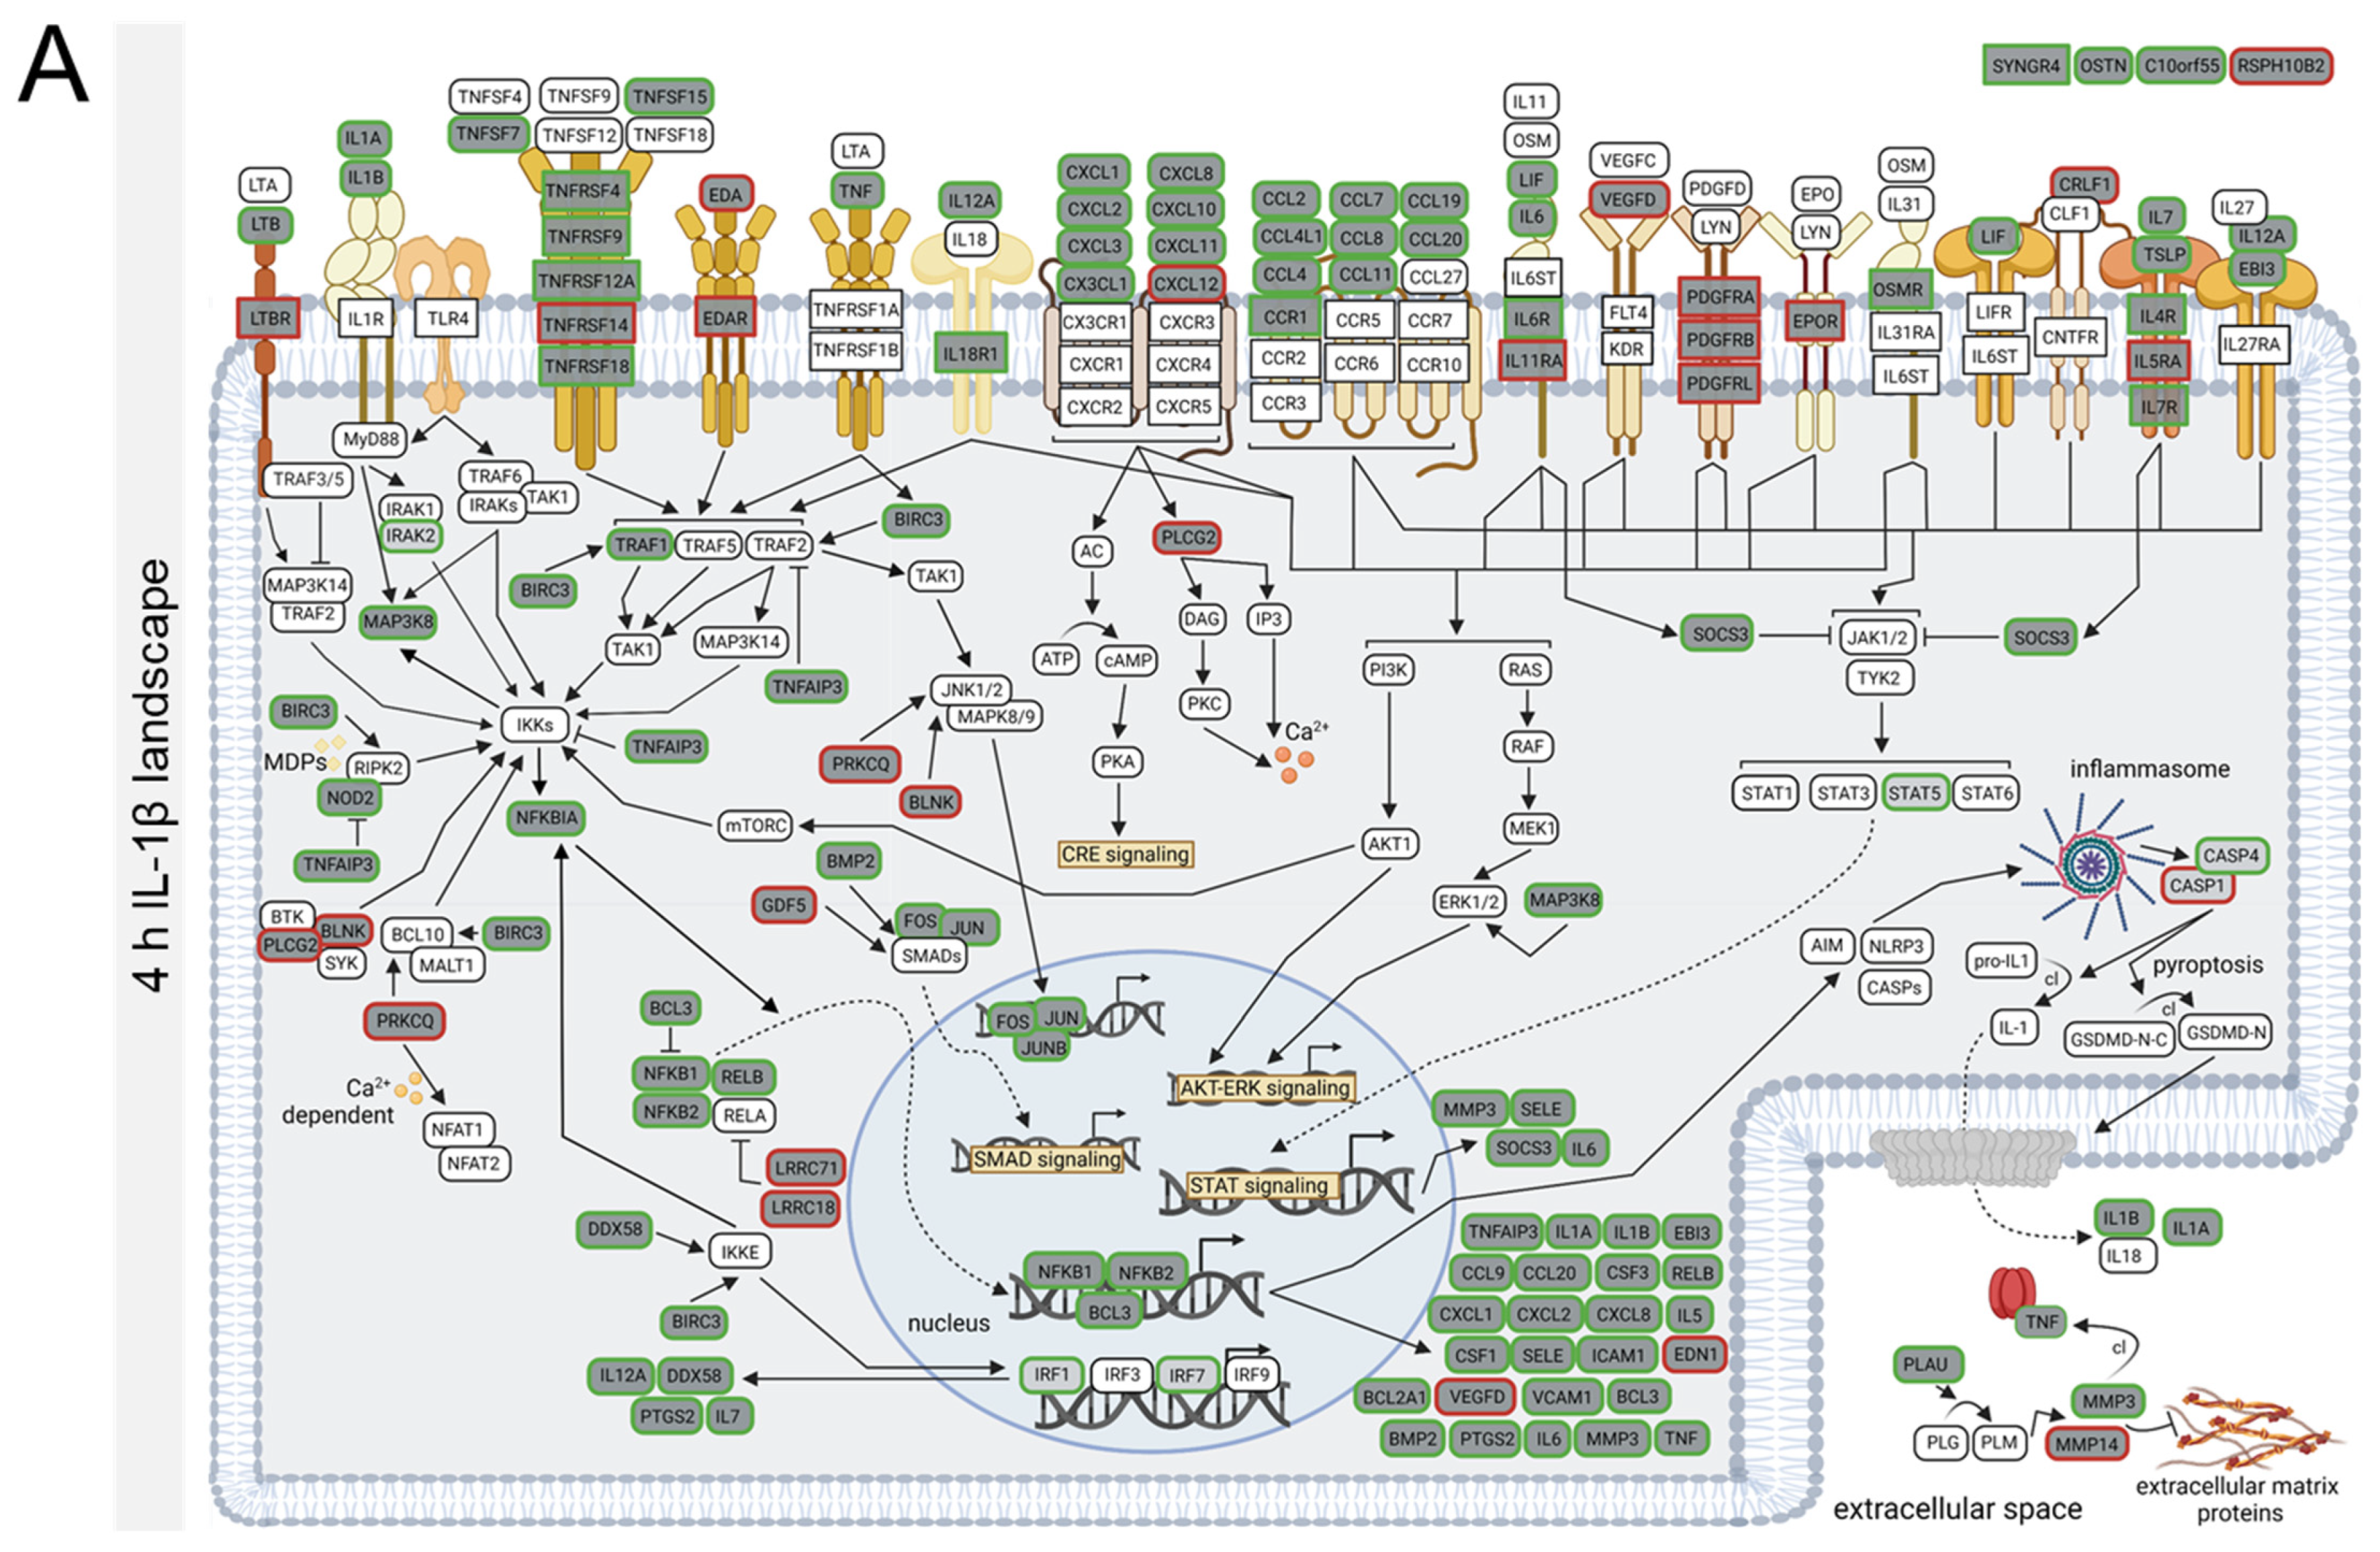
3.4. TNFα- and IL-1β-Specific Effects on Neuroinflammatory Signaling Pathways

In addition to the time-point-dependent differences between the expression profiles of the 1076 overlapping TNFα- and IL-1β-modulated DEGs (Supplementary Figure S8A), we also found unique expression profiles of DEGs induced by either TNFα- or IL-1β. Furthermore, the rather low number of genes that were present in the DEG lists of hCSs stimulated with TNFα- as well as in the IL-1β DEG lists of either of the three time points (e.g., 4 h: TNFα, 48% and IL-1β, 62%; 12 h: TNFα, 34% and IL-1β, 72%; 36 h: TNFα, 34% and IL-1β, 62%) (Supplementary Figure S8B,C) was also indicative of the existence of unique sets of TNFα-modulated DEGs and unique IL-1β-modulated DEG sets (from here on referred to as “category A” and “category B”, respectively; Supplementary Figure S8A). GO analysis revealed no significant pathways for the IL-1β-specific DEGs in category B (119 genes; Log2 FC >1.5 or <−1.5), while the GO molecular pathways “NAD+ nucleosidase activity” (7 DEGs) and “cytokine activity” (16 DEGs) were found for the TNFα-specific DEGs in category A (356 genes; Log2 FC >1.5 or <−1.5). Remarkably, 4 out of the 7 TNFα-specific DEGs from the “NAD+ nucleosidase activity” pathway were TLR subfamily members (TLR1/3/5/7) (Figure 5A), and 11 out of the 16 “cytokine activity” TNFα-specific DEGs represented chemokines, cytokines and other signaling molecules (CXCL9, CCL5/25, IL15, LTA, IFNB1, CSF2, TNFSF12/14/18 and VEGFA) (Figure 5B). On the other hand, IL-1β but not TNFα induced the expression of three hemoglobin-related genes (HBA1, HBA2, HBB) (Figure 5C).

3.5. TNFα- and IL-1β-Induced Neuroinflammation Primarily Occurs in Endothelial, Microglia and Astrocyte Cell Populations, and Is More Related to MS Than to AD and PD

To gain insight into which of the cell types in our hCSs (neuroectoderm-derived neural progenitors, excitatory and inhibitory neurons, astrocytes and oligodendrocyte precursors, and mesoderm-derived microglia and endothelial cells) were primarily affected by the TNFα- and IL-1β-stimulations, we first defined cell-type-specific markers (Supplementary Information S3) based on a single-cell RNA-seq dataset of human fetal brain regions [25]. Using these brain cell-type-specific markers, we found that following the 4 h, 12 h and 36 h TNFα-stimulations in particular, the markers for endothelial cells and to a lesser extent microglia- and astrocyte-markers were the most prevalent in the lists of TNFα-modulated DEGs (Figure 6A). Endothelial-, microglia- and astrocyte-markers were also most prominent at all three time points in the IL-1β-modulated DEG lists, with, in addition, the clear presence of oligodendrocyte precursor cell (OPC) markers in the 4 h IL-1β-DEG list (Figure 6B). It is of further interest to note that the three sets of endothelial cell markers that were DEGs following 4 h, 12 h and 36 h of TNFα-stimulation overlapped for only ~50% (Supplementary Figure S9A). A similar situation holds for the degree of overlap among the microglia- and astrocyte-marker sets following the 4 h, 12 h and 36 h TNFα-stimulations, and the endothelial cell-, microglia- and astrocyte-marker sets following stimulation by 4 h, 12 h and 36 h of IL-1β (Supplementary Figure S9A,B). These results suggest that TNFα- and IL-1β-stimulation of hCSs affects glial and endothelial cell populations to a higher degree than the neuronal (progenitor) populations, and that the sets of cell-type-specific markers that are dysregulated by these cytokines vary among the three stimulation time points.
Interestingly, we found a considerable overlap between the DEG list from a microglial cell line (HMC3) that we stimulated with pro-inflammatory stimuli and the DEG lists from the 4 h-, 12 h- and 36 h TNFα-stimulated hCSs (35–37%) as well as between the HMC3 DEG list and the three IL-1β-stimulated hCS DEG lists (32–50%). In contrast, we only found an overlap of 6–12% between the DEG list from a pro-inflammatory stimuli-treated glial progenitor cell line (HOG) and the various DEG lists from the TNFα- and IL-1β-stimulated hCSs (Figure 6C). These findings are in line with the relatively high sensitivity of microglial populations to cytokines [28,29].
We next compared the lists of DEGs from the 4 h, 12 h and 36 h TNFα-stimulated hCSs as well as the 4 h, 12 h, 36 h IL-1β-stimulated hCS DEG lists with cell-type-specific marker genes identified on the basis of the suprafrontal gyrus microarray datasets derived from post-mortem brain tissues of AD-, PD- and MS-patients [26]. This analysis showed that at all three hCS stimulation time points the highest percentages of overlap were also found for microglia, endothelial cells and astrocytes; these percentages of overlap were roughly the same for the AD-, PD- and MS-datasets (Figure 6D). We then determined the percentages of overlap between the TNFα- and IL-1β-stimulated hCS DEG lists and genes genetically linked to AD, PD and MS (deduced from the Nanostring project). Intriguingly, our cytokine-modulated hCS DEGs are clearly more related to the genes associated with the neuroinflammatory disease MS (33% and 28% overlap with TNFα-stimulated and IL-1β-stimulated hCS DEGs, respectively) than with AD (8% and 9%, respectively) or with PD (6% and 4%, respectively) (Figure 6E). In addition, the TNFα- and IL-1β-modulated hCS DEGs showed a considerable degree of overlap with Nanostring-derived gene sets related to NFκB (~40%), inflammation (~35%) and neuroinflammation (~20%) (Figure 6F). Furthermore, a substantial percentage of the microglia-cell-type marker genes modulated in our hCSs by TNFα and IL-1β overlapped with genes from the Nanostring-derived neuroinflammation gene list (24.3% and 25.6%, respectively), much more than with the modulated cell-type marker genes of endothelial cells (5.4% and 4.6%), astrocytes (6.2% and 8.5%), NPCs (0% and 0%), excitatory neurons (6.1% and 8.6%), inhibitory neurons (4.2% and 5.1%), OPCs (4.7% and 0%) and other unlabeled cell populations (6.4% and 7.1%) (Figure 6G). Also, the overlap between the TNFα- and IL-1β-modulated microglia marker genes and the Nanostring-derived inflammation genes (14% and 15.8%, respectively) was higher than the overlap with other modulated cell-type marker genes (0–10.3% and 0–10.5%) (Figure 6H). Similarly, the overlap between the TNFα- and IL-1β-modulated microglia-cell-type marker genes and the Nanostring-derived NFκB gene list (3.0% and 6.2%, respectively) was clearly higher than the overlap with the other modulated cell-type markers (0–1.4% and 0–2.1%, respectively) (Figure 6I). These observations indicate that in the cytokine-stimulated hCSs most of the dysregulated (neuro)inflammation- and NFκB-associated genes are preferentially expressed in microglia.

4. Discussion

In this study, we performed unbiased RNA-seq and DEG analysis of TNFα- and IL-1β-stimulated hCSs containing multiple brain cell types (neuronal, astrocyte, oligodendrocyte, microglial and endothelial cell populations). The analysis revealed the induction of a neuroinflammatory response, with the NFκB- and STAT-pathways being the major pathways affected. This finding was found in both the TNFα- and IL-1β-stimulated hCSs, and at all three time points at which the spheroids were stimulated. However, the DEG compositions of these shared pathways were markedly different between the two cytokine-stimulated hCSs and among the three stimulation time points. In addition, a number of the common DEGs showed distinct time courses of expression. Furthermore, we identified TNFα- and IL-1β-specific DEGs at each of the three stimulation time points. The hCS cell types most responsive to TNFα- and IL-1β-stimulation, and thus driving the neuroinflammatory response, appeared to be endothelial cells, microglia and astrocytes.
As already at 4 h following TNFα- and IL-1β-stimulation the NFκB- and STAT-pathways were modulated, the induction of neuroinflammation represents an early event in the response of the hCSs. This is in agreement with the previously reported role of TNFα and IL-1β as early drivers of (neuro)inflammation [3,7,30,31], making these cytokines interesting targets for therapeutic interventions. Under pathophysiological conditions, the neuroinflammation-linked NFκB- and STAT-pathways are activated through the binding of extracellular ligands, including cytokines and chemokines, to plasma-membrane-bound receptors, such as the TNFR and ILR families, but also TLRs, various chemokine- and other cytokine receptors, pattern-recognition receptors and a number of G-protein-coupled receptors [32,33]. Expression of a variety of these ligands and receptors, such as CXCL1/2/3/8/10/11/12, CCL2/4/7/8/19/20, TNFSF7/8/10/13B/15 and TNFRSF4/9/14/18/25 as well as of the crucial transcriptional activation components of the downstream NFκB pathway (NFKBIA, NFKB1, NFKB2) was indeed affected in our cytokine-stimulated hCSs. In the canonical NFκB pathway, ligand-receptor binding activates multi-subunit IκB kinase (IKK) complexes that trigger the degradation of IκBa by phosphorylation [34,35], resulting in a rapid nuclear translocation of a number of NFκB family members, RelA and c-Rel. We indeed found upregulation of genes triggering this IKK-dependent IκBa-phosphorylation, such as TRAF1, BIRC3, BLNK and LYN. We further noticed that the receptors PDGFR, ILR, CCR and CXCR, and their ligands PDGF, LYN, LIF, CCL2/4/4L1/7/8/11/19/20/25 and CXCL1/2/3/8/9/10/11/12 that signal through STATs displayed affected expression in the cytokine-stimulated hCSs. In inflammatory and autoimmune diseases, the transcriptional activation of the STAT pathway is regulated via the transcription factors STAT1/3/5/6 [36,37,38]. STAT1 was upregulated at all TNFα time points and the 12 h- and 36 h-IL-1β time points. On the other hand, STAT3/5 were only upregulated following 4 h of TNFα-stimulation, but not at later stimulation time points, while STAT5 and STAT3 were upregulated at 4 h and 12 h IL-1β-stimulation, respectively. These different time courses of STAT1 versus STAT3/5 expression are in line with reports of antagonistic roles of STAT1 (enhances inflammation) and STAT3/5 (diminishes inflammation) in response to neuroinflammatory stimuli [39,40,41] and during ischemia [42].
Most (~80%) of the components of the NFκB- and STAT-pathways in the TNFα- and IL-1β-stimulated hCSs represented genes that were upregulated. In the downregulated gene set, we found a number of genes related to ECM remodeling, such as COL4A4, COL6A and EMILIN3 following all three TNFα time points and COL15A1, COL21A1, MFAP4 and OGN following all three IL-1β time points. Interestingly, a direct link between neuroinflammation and ECM remodeling/damage has been described during spinal cord injury [43], angiogenesis [44], and immune cell differentiation and migration [45], as well as microglial activation [46] and the pathogenesis of various neurological diseases [47,48,49], further indicating that our TNFα- and IL-1β- stimulated hCSs may well represent a valuable model of neuroinflammation.
A characteristic of the NFκB pathway is that the expression of cytokines activating NFκB is itself induced by this pathway, as such producing a positive feedback loop [34]. Transcription of the NFκB-activating cytokines CCL9/20, CXCL1/2/8, IL1A/1B5/6/15 and TNF, regulated via the upregulation of NFκB-activating TNFRs, TRAFs, and RIPK2, was indeed increased in the stimulated hCSs. Interestingly, during inflammation, NFκB-activation also initiates negative feedback (self-inhibitory) loops that lead to the relief of inflammation [50,51]. In both the TNFα- and IL-1β-stimulated hCSs, we in fact found the downregulated expression of NFκB-activating factors, such as BLNK, and upregulated expression of NFκB-inhibiting factors, such as BCL3, NFKBIA and TNFAIP3. Most membrane-bound NFκB-activating receptors and downstream signaling molecules were upregulated following 4 h of TNFα-stimulation and therefore the hCSs were already in the NFκB-activation phase at this point in time. In addition, a number of inhibitory signaling genes were upregulated, reflecting an early self-inhibitory NFκB feedback loop. At the later TNFα-stimulation time points, the dampening of NFκB-activation was evident from the unaffected or downregulated expression of a number of NFκB-activating receptors and downstream molecules. Since in IL-1β-stimulated hCSs the dampening of the NFκB-pathway was already evident at 4 h, we conclude that the IL-1β-elicited neuroinflammatory response faded out earlier than the TNFα-induced response, which is in line with findings in a non-human, peripheral cell system (primary murine hepatocytes) [52].
An unbiased clustering strategy revealed differences in the time courses of the expression of the common TNFα- and IL-1β-dysregulated genes. For example, we identified clusters of genes displaying different TNFα- and IL-1β-modulated expression patterns and with roles in neuroinflammatory processes, such as chemoattraction (ICAM4, ADGRG3), antigen-presentation (HLA-DRB1, HLA-DPA1, HLA-C, B2M, HLA-DQA1, HLA-DMB, HLA-F, HLA-B) and TNF signaling (XAF1); note that the bioinformatics analysis did not classify these genes within the three core KEGG pathways “Cytokine-Cytokine receptor signaling”, “TNF signaling” and “NFκB signaling”. Furthermore, we observed genes with distinct TNFα- and IL-1β-modulated time-course expression profiles and associated with structural/cytoskeletal functions, ECM remodeling, Wnt signaling and the proteasome, which have all been previously linked to neuroinflammation [48,53,54].
A remarkable finding was that the expression of four TLRs (TLR1/3/5/7), three specific cytokines (CXCL9, CCL5/25) and additional inflammatory molecules (IL15, LTA, IFNB1, CSF2, VEGFA, TNFSF12/14/18) was upregulated during the TNFα-, but not the IL-1β-induced neuroinflammatory response. At present, we do not know the explanation for this TNFα-specific effect. It is of further interest to note that 36 h of stimulation by IL-1β, but not TNFα, induced the expression of three hemoglobin genes (HBA1, HBA2, HBB). We speculate that IL-1β may activate a molecular cascade in endothelial cells that leads to the production of these hemoglobins, which are modulators of vascular tone [55,56]. This is in line with the fact that the IL-1R is highly expressed in endothelial cells and involved in angiogenic responses [57,58,59], although TNFα receptors also exhibit endothelial-cell expression and angiogenic activity [60,61]. Specific TNFα- and IL-1β effects have been previously reported in peripheral immune cells and brain cells, namely that the two cytokines differentially affect the expression of certain cytokines (e.g., CXCL8/IL8; [62]), pro-adhesion molecules (e.g., ICAM1 and VCAM1; [63]), and pentraxin 3 [64]. Thus, despite the fact that both TNFα and IL-1β have a pro-inflammatory function, the molecular neuroinflammatory signatures elicited by these cytokines appear to be markedly different.
NFκB orchestrates the neuroinflammatory response to ATP, ion imbalance, excess glutamate, oxidative stress and cytokines in CNS cells, such as microglia, astrocytes, neurons and oligodendrocytes [35,57,65,66]. We found that the neuroinflammatory response elicited by TNFα and IL-1β in hCSs is primarily driven by endothelial cells, microglia and astrocytes, consistent with previous findings showing that under inflammatory conditions the two cytokines affect (micro)glial functions [67,68] and angiogenesis [63,69,70]. In view of the pivotal support functions of endothelial cells, microglia and astrocytes in the brain [71,72,73], activation of these cells in the hCSs may on its turn have affected other brain cell types such as oligodendrocytes and neuronal (progenitor) populations. Such aberrant neuroinflammation-provoked crosstalk between glial cells and other brain cell types has been previously observed in neuroinflammatory diseases [74,75,76]. We found that the list of DEGs from our TNFα- and IL-1β-stimulated hCSs showed a higher similarity to that from pro-inflammatory-stimulated human fetal microglia (HMC3) than human adult glial progenitor (HOG) cells, indicating that these cell lines do recapitulate the known difference in sensitivity of the various brain cell types to cytokines [28,29,77]. Nevertheless, one has to realize that, in vitro, in the absence of other cell types and in a 2D environment, TNFα- or IL-1β-stimulated brain cell lines may well respond markedly different from our 3D TNFα- and IL-1β-stimulated hCSs.
A prolonged activation of NFκB in brain cell types appears to contribute to pathogenic neurological processes, [78] and NFκB-associated neuroinflammation is a hallmark of various neurological diseases, including AD, PD and MS [35,79]. Our comparison of the lists of TNFα- and IL-1β-modulated hCS DEGs with genes genetically associated with AD, PD or MS revealed that the highest percentage of DEGs was related to MS, in line with the clear neuroinflammatory contribution to the pathogenesis of this disease [80,81]. Interestingly, when comparing the cytokine-modulated hCS DEG lists with the transcriptomes of various AD-, PD- and MS-cell types, we did not find a preference for MS-related genes. We presume that this apparent discrepancy is explained by the fact that the genetically linked genes contribute to the development of the disease, while the transcriptomes reflect endpoints of disease pathogenesis.
Besides its relevance for the pathogenesis of a number of neurological diseases, more knowledge about NFκB-mediated neuroinflammation is crucial, since this complex process is associated with a variety of opposing responses, from cell survival to cell death [79]. Our molecular dissection of the TNFα- and IL-1β-induced neuroinflammatory responses was performed in ESC-derived self-assembling 3D-hCSs containing all major brain cell types. Therefore, the processes elicited in our cytokine-stimulated hCSs may well mimic the neuroinflammatory response in the brains of neurological disease patients, in particular during MS pathogenesis, and the identification of their molecular signatures contributes to the development of TNFα-, IL-1β- and NFκB-directed therapies.

5. Patents

The protocol to generate human cortical spheroids presented here is part of a pending patent application.

Supplementary Materials

The following supporting information can be downloaded at: https://0-www-mdpi-com.brum.beds.ac.uk/article/10.3390/biomedicines10051025/s1 [82,83,84,85,86,87,88,89,90,91,92,93,94,95,96,97,98,99,100,101,102,103,104,105,106,107,108,109,110,111,112,113,114,115,116,117,118,119,120,121,122,123,124,125,126,127,128,129,130,131,132,133,134,135,136,137,138,139,140,141,142,143,144,145,146,147,148,149,150,151,152,153,154,155,156,157,158,159,160,161,162,163,164,165,166,167,168,169,170,171,172,173,174,175,176,177,178,179,180,181,182,183,184,185,186,187,188,189,190,191,192,193,194,195,196,197,198,199,200,201,202,203,204,205,206,207,208,209,210,211,212,213,214,215,216,217,218,219,220,221,222,223,224,225,226,227,228,229,230,231,232,233,234,235,236,237,238,239,240,241,242,243,244,245,246,247,248,249,250,251,252,253,254,255,256,257,258,259,260,261,262,263,264], Figure S1: Overview of the analysis of differentially expressed genes (DEGs) in human cortical spheroids (hCSs) stimulated with the pro-inflammatory cytokines TNFα or IL-1β for 4 h, 12 h and 36 h. Per time point, a molecular landscape for TNFα-stimulated or IL-1β-stimulated hCSs was built based on functional interactions between the proteins encoded by the DEGs in the three core annotated KEGG pathways. A further molecular landscape was constructed based on the DEGs that were common in the three core annotated KEGG pathways of the hCSs stimulated with TNFα and IL1β for 4 h, 12 h and 36 h. Clustering analysis of the common 1076 DEGs was performed to reveal 22 clusters of time-course gene expression profiles. Also, DEGs unique in TNFα- or IL-1β-stimulated hCSs were grouped into a distinct category (category A for TNFα and category B for IL-1β). Biological functions were deduced based on information obtained from UniprotKB (https://www.uniprot.org/; accessed on 1 January 2022) and Genecards (https://www.genecards.org; accessed on 15 January 2022); Figure S2: Our human cortical spheroids (hCSs) contain neuroectoderm- and mesoderm-derived cell types. (A) Levels of mRNA expression (measured by qPCR) of neural progenitor marker PAX6, mature neuron marker NEFL, excitatory neuron marker SLC17A7, inhibitory neuron marker GAD1, astrocyte marker AQP4, oligodendrocyte marker MBP, microglia marker CX3CR1 and endothelial cell marker SPARC in embryonic stem cell line H9 (n = 3) and in hCSs (n = 3) at day 150 (d150), relative to embryonic H9 stem cells. *** p < 0.001, ** p < 0.01, * p < 0.05, # p < 0.1. (B) Representative immunocytochemistry images of d150 hCS stainings for neuronal dendritic marker MAP2 and axonal marker TAU, astrocyte marker GFAP, oligodendrocyte marker O1, microglia markers P2RY12 and TMEM119, and endothelial surface marker PECAM1; Figure S3: Pro-inflammatory stimuli increase mRNA expression of neuroinflammatory-related genes in human cortical spheroids (hCSs). Normalized mRNA expression levels of IL-6, CXCL8, CCL5, CCL20, NFKB1, STAT1 and STAT3 at (A) various TNFα (5 ng/ml) incubation time points and (B) various IL-1β (5 ng/ml) incubation time points and quantified by qPCR. *** p < 0.001, ** p < 0.01, * p < 0.05, # p < 0.1; Figure S4: Gene ontology (GO) analysis of differentially expressed genes (DEGs) in human cortical spheroids stimulated with TNFα or IL-1β for 4 h, 12 h and 36 h. (A) GO top-4 pathways (based on false discovery rate (FDR)-corrected p-value). (B) Number of DEGs in the three core KEGG pathways (left), the three most-often found GO pathways (right) and overlapping between the three core KEGG and GO pathways (214 out of 436 (49.1%) KEGG genes are also GO genes; 214 out of 604 (35.4%) GO genes are also KEGG genes). (C) GO top-4 pathways (based on FDR p-value) resulting from the analysis of upregulated DEGs (UP) or downregulated DEGs (DOWN); Figure S5: (A) Molecular landscape constructed on the basis of differentially expressed genes (DEGs) in human cortical spheroids following stimulation with TNFα and with IL-1β for 4 h, 12 h and 36 h (“common” DEGs). Protein functions and interactions were deduced based on information obtained from UniprotKB (https://www.uniprot.org/; accessed on 1 January 2022) and Genecards (https://www.genecards.org; accessed on 15 January 2022). A detailed description of the protein-protein interactions occurring in this molecular landscape can be found in Supplementary Information S4. Rectangularly framed protein: membrane-bound receptor; protein in dark-gray-filled (rounded) rectangle: encoded by a core KEGG pathway DEG; protein in light-gray-filled (rounded) rectangle: encoded by a DEG not in the core KEGG pathways; protein in white-filled (rounded) rectangle: not encoded by a DEG. Black arrows: stimulation or induction; inhibition arcs: inhibition; dotted arrows: translocation; fading arrows: enzymatic conversion; cl: cleavage. Encircled numbers refer to the two main dysregulated molecular pathways; 1: NFκB signaling, 2: STAT-dependent transcription. (B) Gene expression profiles of NFκB-master regulator genes NFKBIA, NFKB1, NFKB2, RELB, BCL3 and TNFAIP3. (C) Gene expression profiles of STAT-master regulator genes STAT1, STAT3 and SOCS3.; Figure S6: Number and time-course expression profiles of upregulated (left) and downregulated (right) differentially expressed genes (DEGs) in human cortical spheroids stimulated with TNFα (A and C) or IL-1β (B and D) for 4 h, 12 h and 36 h. For time-course expression profiles, per time point top DEGs are based on Log2 fold change with a cut-off of 4 (upregulated DEGs; UP) or -4 (downregulated DEGs; DOWN); Figure S7: Cluster analysis and biological functions of common differentially expressed genes (DEGs) in human cortical spheroids stimulated with TNFα and IL-1β for 4 h, 12 h or 36 h. (A) Percentages of common DEGs in TNFα- and IL-1β-clusters resulting from DEG cluster analysis. Dotted red line: cut-off (overlap score between corresponding TNFα- and IL-1β-clusters <25%), (B) Biological functions of cluster DEGs with a <25% overlap score between corresponding TNFα- and IL-1β-clusters. Functions were deduced from literature-based studies; Figure S8: Number of differentially expressed genes (DEGs) in human cortical spheroids stimulated with TNFα or IL-1β for 4 h, 12 h and 36 h. (A) Number of common DEGs dysregulated at one of the three time-points of TNFα- and IL-1β-stimulation (overlap), and number of DEGs uniquely dysregulated following TNFα-stimulation (left) and IL-1β-stimulation (right). (B) Number of common DEGs overlapping between the TNFα- and IL-1β-DEG lists (overlap), and number of DEGs unique to the TNFα-DEG list (left) and IL-1β-DEG list (right) per stimulation time point. (C) Number of common DEGs overlapping between the TNFα- and IL-1β-DEG lists (overlap), and number of DEGs unique to the TNFα-DEG lists (left) and IL-1β-DEG lists (right) among the various stimulation time points; Figure S9: Number of endothelial cell-, microglia- and astrocyte-marker genes that are dysregulated in human cortical spheroids following stimulation with (A) TNFα or (B) IL-1β for 4 h, 12 h or 36 h. Marker genes (Supplementary Information S3) were based on a single-cell RNA-seq dataset of human fetal brain regions [25]; Table S1: Boolean clustering of the time-course expression profiles of common differentially expressed genes (DEGs) selected on the basis of their presence in the DEG-lists of human cortical spheroids (hCSs) stimulated with TNFα for 4 h, 12 h or 36 h as well as in the DEG-lists of hCSs stimulated with IL-1β for 4 h, 12 h or 36 h. In the column “Pattern”, “high” refers to a Log2 fold change (FC) >2.5 or <−2.5 and “low” refers to a Log2 FC between 0 and 2.5 or between −2.5 and 0. In the column “Direction”, “pos” indicates that the FC-value is above 0 and “neg” indicates that the FC-value is below 0. The boundary at the DEG threshold of Log2 FC = 1 could not be set as some genes were only a DEG at one time point and thus values with a Log2 FC between 1 and −1 were also present in the dataset; Table S2: Listed are per cluster (see Figure 4) the percentages of TNFα-modulated differentially expressed genes (DEGs) and the percentages of IL-1β-modulated DEGs. Percentages are relative to the total number of common TNFα- and IL-1β-modulated DEGs (1076 DEGs); Table S3. Listed are per cluster (see Figure 4) the number of genes in the time-course expression cluster of TNFα- and IL-1β-modulated differentially expressed genes (DEGs), the number of genes common in the time-course expression clusters of TNFα- and IL-1β-modulated DEGs and the percentage of genes common in the time-course expression clusters of TNFα- and IL-1β-modulated DEGs; Table S4: Primer sequences used for qPCR validation of RNA-seq data in day-150 human cortical spheroids; Table S5: Validation of RNA-sequencing (RNA-seq) data by quantitative PCR (qPCR) analysis of the expression of genes modulated in human cortical spheroids (hCSs) stimulated with TNFα for 4 h, 12 h or 36 h. Listed are Log2 fold-change (FC) values in the stimulated hCSs over the unstimulated (0 h) hCSs. Correlation RNAseq-qPCR 4 h: 0.685, p-value: 0.001; correlation RNAseq-qPCR 12 h: 0.862, p-value: <0.001; correlation RNAseq-qPCR 36 h: 0.819, p-value: <0.001; Table S6: Validation of RNA-sequencing (RNA-seq) data by quantitative PCR (qPCR) analysis of the expression of genes modulated in human cortical spheroids (hCSs) stimulated with IL-1β for 4 h, 12 h or 36 h. Listed are Log2 fold-change (FC) values in the stimulated hCSs over the unstimulated (0 h) hCSs. Correlation RNAseq-qPCR 4 h: 0.758, p-value: <0.001; correlation RNAseq-qPCR 12 h: 0.702, p-value: 0.001; correlation RNAseq-qPCR 36 h: 0.857, p-value: <0.001.

Author Contributions

Conceptualization, K.M.A.D.K. and G.J.M.M.; Data curation, K.M.A.D.K.; Formal analysis, K.M.A.D.K.; Funding acquisition, G.J.M.M.; Investigation, K.M.A.D.K., K.R.S. and W.A.Z.; Methodology, K.M.A.D.K., K.R.S. and W.A.Z.; Project administration, K.M.A.D.K. and G.J.M.M.; Resources, K.M.A.D.K., K.R.S., W.A.Z. and G.J.M.M.; Supervision, G.J.M.M.; Validation, K.M.A.D.K., K.R.S., W.A.Z. and G.J.M.M.; Visualization, K.M.A.D.K. and G.J.M.M.; Writing—original draft, K.M.A.D.K. and G.J.M.M.; Writing—review & editing, K.M.A.D.K., K.R.S., W.A.Z. and G.J.M.M. All authors have read and agreed to the published version of the manuscript.

Funding

This work was supported by Jan Kelders Beheer Ltd. (grant#62002478).

Institutional Review Board Statement

Not applicable.

Informed Consent Statement

Not applicable.

Data Availability Statement

The raw RNA-seq data for the hCSs has been deposited under GEO accession number GSE200779 (and are also available in Supplementary Information S1 and S2), and for HMC3 and HOG under GEO accession number GSE200354.

Acknowledgments

Figure 2 and Figure 3, Supplementary Figures S1 and S5A were prepared with Biorender (www.Biorender.com; accessed on 22 March 2022).

Conflicts of Interest

The funders had no role in the design of the study; in the collection, analyses, or interpretation of data; in the writing of the manuscript, or in the decision to publish the results. G.J.M.M and K.M.A.D.K. are inventors on a pending patent application.

References

  1. Mygind, L.; Bergh, M.S.; Tejsi, V.; Vaitheeswaran, R.; Lambertsen, K.L.; Finsen, B.; Metaxas, A. Tumor Necrosis Factor Tnf Is Required for Spatial Learning and Memory in Male Mice under Physiological, but Not Immune-Challenged Conditions. Cells 2021, 10, 608. [Google Scholar] [CrossRef] [PubMed]
  2. Jung, Y.J.; Tweedie, D.; Scerba, M.T.; Greig, N.H. Neuroinflammation as a Factor of Neurodegenerative Disease: Thalidomide Analogs as Treatments. Front. Cell Dev. Biol. 2019, 7, 313. [Google Scholar] [CrossRef] [PubMed]
  3. Hewett, S.J.; Jackman, N.A.; Claycomb, R.J. Interleukin-1beta in Central Nervous System Injury and Repair. Eur. J. Neurodegener. Dis. 2012, 1, 195–211. [Google Scholar] [PubMed]
  4. Portales-Casamar, E.; Thongjuea, S.; Kwon, A.T.; Arenillas, D.; Zhao, X.; Valen, E.; Yusuf, D.; Lenhard, B.; Wasserman, W.W.; Sandelin, A. The Greatly Expanded Open-Access Database of Transcription Factor Binding Profiles. Nucleic Acids Res. 2010, 38, D105–D110. [Google Scholar] [CrossRef] [PubMed] [Green Version]
  5. Holbrook, J.; Lara-Reyna, S.; Jarosz-Griffiths, H.; McDermott, M. Tumour Necrosis Factor Signalling in Health and Disease. F1000Research 2019, 8. [Google Scholar] [CrossRef] [PubMed]
  6. Clark, I.A.; Alleva, L.M.; Vissel, B. The Roles of Tnf in Brain Dysfunction and Disease. Pharmacol. Ther. 2010, 128, 519–548. [Google Scholar] [CrossRef]
  7. Shaftel, S.S.; Griffin, W.S.; O’Banion, M.K. The Role of Interleukin-1 in Neuroinflammation and Alzheimer Disease: An Evolving Perspective. J. Neuroinflamm. 2008, 5, 7. [Google Scholar] [CrossRef] [Green Version]
  8. Khairova, R.A.; Machado-Vieira, R.; Du, J.; Manji, H.K. A Potential Role for Pro-Inflammatory Cytokines in Regulating Synaptic Plasticity in Major Depressive Disorder. Int. J. Neuropsychopharmacol. 2009, 12, 561–578. [Google Scholar] [CrossRef]
  9. Kim, Y.K.; Na, K.S.; Shin, K.H.; Jung, H.Y.; Choi, S.H.; Kim, J.B. Cytokine Imbalance in the Pathophysiology of Major Depressive Disorder. Prog. Neuro-Psychopharmacol. Biol. Psychiatry 2007, 31, 1044–1053. [Google Scholar] [CrossRef]
  10. Fresegna, D.; Bullitta, S.; Musella, A.; Rizzo, F.R.; De Vito, F.; Guadalupi, L.; Caioli, S.; Balletta, S.; Sanna, K.; Dolcetti, E.; et al. Re-Examining the Role of Tnf in Ms Pathogenesis and Therapy. Cells 2020, 9, 2290. [Google Scholar] [CrossRef]
  11. Lin, C.C.; Edelson, B.T. New Insights into the Role of Il-1beta in Experimental Autoimmune Encephalomyelitis and Multiple Sclerosis. J. Immunol. 2017, 198, 4553–4560. [Google Scholar] [CrossRef] [PubMed] [Green Version]
  12. Deverman, B.E.; Patterson, P.H. Cytokines and Cns Development. Neuron 2009, 64, 61–78. [Google Scholar] [CrossRef] [PubMed] [Green Version]
  13. Sidhaye, J.; Knoblich, J.A. Brain Organoids: An Ensemble of Bioassays to Investigate Human Neurodevelopment and Disease. Cell Death Differ. 2021, 28, 52–67. [Google Scholar] [CrossRef] [PubMed]
  14. Shou, Y.; Liang, F.; Xu, S.; Li, X. The Application of Brain Organoids: From Neuronal Development to Neurological Diseases. Front. Cell Dev. Biol. 2020, 8, 579659. [Google Scholar] [CrossRef]
  15. Agboola, O.S.; Hu, X.; Shan, Z.; Wu, Y.; Lei, L. Brain Organoid: A 3d Technology for Investigating Cellular Composition and Interactions in Human Neurological Development and Disease Models in Vitro. Stem Cell Res. Ther. 2021, 12, 430. [Google Scholar] [CrossRef]
  16. Chiaradia, I.; Lancaster, M.A. Brain Organoids for the Study of Human Neurobiology at the Interface of in Vitro and in Vivo. Nat. Neurosci. 2020, 23, 1496–1508. [Google Scholar] [CrossRef]
  17. Saha, R.N.; Ghosh, A.; Palencia, C.A.; Fung, Y.K.; Dudek, S.M.; Pahan, K. Tnf-Alpha Preconditioning Protects Neurons Via Neuron-Specific up-Regulation of Creb-Binding Protein. J. Immunol. 2009, 183, 2068–2078. [Google Scholar] [CrossRef]
  18. Huang, Y.; Smith, D.E.; Ibanez-Sandoval, O.; Sims, J.E.; Friedman, W.J. Neuron-Specific Effects of Interleukin-1beta Are Mediated by a Novel Isoform of the Il-1 Receptor Accessory Protein. J. Neurosci. 2011, 31, 18048–18059. [Google Scholar] [CrossRef] [Green Version]
  19. Park, S.Y.; Kang, M.J.; Han, J.S. Interleukin-1 Beta Promotes Neuronal Differentiation through the Wnt5a/Rhoa/Jnk Pathway in Cortical Neural Precursor Cells. Mol. Brain 2018, 11, 39. [Google Scholar] [CrossRef]
  20. Bras, J.P.; Bravo, J.; Freitas, J.; Barbosa, M.A.; Santos, S.G.; Summavielle, T.; Almeida, M.I. Tnf-Alpha-Induced Microglia Activation Requires Mir-342: Impact on Nf-Kb Signaling and Neurotoxicity. Cell Death Dis. 2020, 11, 415. [Google Scholar] [CrossRef]
  21. Hyvarinen, T.; Hagman, S.; Ristola, M.; Sukki, L.; Veijula, K.; Kreutzer, J.; Kallio, P.; Narkilahti, S. Co-Stimulation with Il-1beta and Tnf-Alpha Induces an Inflammatory Reactive Astrocyte Phenotype with Neurosupportive Characteristics in a Human Pluripotent Stem Cell Model System. Sci. Rep. 2019, 9, 16944. [Google Scholar] [CrossRef] [PubMed]
  22. Benson, C.A.; Powell, H.R.; Liput, M.; Dinham, S.; Freedman, D.A.; Ignatowski, T.A.; Stachowiak, E.K.; Stachowiak, M.K. Immune Factor, Tnfalpha, Disrupts Human Brain Organoid Development Similar to Schizophrenia-Schizophrenia Increases Developmental Vulnerability to Tnfalpha. Front. Cell Neurosci. 2020, 14, 233. [Google Scholar] [CrossRef] [PubMed]
  23. Li, B.; Dewey, C.N. Rsem: Accurate Transcript Quantification from Rna-Seq Data with or without a Reference Genome. BMC Bioinform. 2011, 12, 323. [Google Scholar] [CrossRef] [PubMed] [Green Version]
  24. Audic, S.; Claverie, J.M. The Significance of Digital Gene Expression Profiles. Genome Res. 1997, 7, 986–995. [Google Scholar] [CrossRef] [PubMed]
  25. Fan, X.; Dong, J.; Zhong, S.; Wei, Y.; Wu, Q.; Yan, L.; Yong, J.; Sun, L.; Wang, X.; Zhao, Y.; et al. Spatial Transcriptomic Survey of Human Embryonic Cerebral Cortex by Single-Cell Rna-Seq Analysis. Cell Res. 2018, 28, 730–745. [Google Scholar] [CrossRef] [Green Version]
  26. Itoh, Y.; Voskuhl, R.R. Cell Specificity Dictates Similarities in Gene Expression in Multiple Sclerosis, Parkinson’s Disease, and Alzheimer’s Disease. PLoS ONE 2017, 12, e0181349. [Google Scholar] [CrossRef] [Green Version]
  27. Vandesompele, J.; De Preter, K.; Pattyn, F.; Poppe, B.; Van Roy, N.; De Paepe, A.; Speleman, F. Accurate Normalization of Real-Time Quantitative Rt-Pcr Data by Geometric Averaging of Multiple Internal Control Genes. Genome Biol. 2002, 3, RESEARCH0034. [Google Scholar] [CrossRef] [Green Version]
  28. Hanisch, U.K. Microglia as a Source and Target of Cytokines. Glia 2002, 40, 140–155. [Google Scholar] [CrossRef]
  29. Kettenmann, H.; Hanisch, U.K.; Noda, M.; Verkhratsky, A. Physiology of Microglia. Physiol. Rev. 2011, 91, 461–553. [Google Scholar] [CrossRef]
  30. Muhammad, M. Tumor Necrosis Factor Alpha: A Major Cytokine of Brain Neuroinflammation. In Cytokines; Behzadi, P., Ed.; IntechOpen: London, UK, 2019. [Google Scholar]
  31. Zelova, H.; Hosek, J. Tnf-Alpha Signalling and Inflammation: Interactions between Old Acquaintances. Inflamm. Res. 2013, 62, 641–651. [Google Scholar] [CrossRef]
  32. Shabab, T.; Khanabdali, R.; Moghadamtousi, S.Z.; Kadir, H.A.; Mohan, G. Neuroinflammation Pathways: A General Review. Int. J. Neurosci. 2017, 127, 624–633. [Google Scholar] [CrossRef] [PubMed]
  33. Kumar, V. Toll-Like Receptors in the Pathogenesis of Neuroinflammation. J. Neuroimmunol. 2019, 332, 16–30. [Google Scholar] [CrossRef] [PubMed]
  34. Liu, T.; Zhang, L.; Joo, D.; Sun, S.C. Nf-Kappab Signaling in Inflammation. Signal Transduct. Target. Ther. Vol. 2017, 2, 17023. [Google Scholar] [CrossRef] [PubMed] [Green Version]
  35. Dresselhaus, E.C.; Meffert, M.K. Cellular Specificity of Nf-Kappab Function in the Nervous System. Front. Immunol. 2019, 10, 1043. [Google Scholar] [CrossRef]
  36. Banerjee, S.; Biehl, A.; Gadina, M.; Hasni, S.; Schwartz, D.M. Jak-Stat Signaling as a Target for Inflammatory and Autoimmune Diseases: Current and Future Prospects. Drugs 2017, 77, 521–546. [Google Scholar] [CrossRef]
  37. Tzeng, H.T.; Chyuan, I.T.; Lai, J.H. Targeting the Jak-Stat Pathway in Autoimmune Diseases and Cancers: A Focus on Molecular Mechanisms and Therapeutic Potential. Biochem. Pharmacol. 2021, 193, 114760. [Google Scholar] [CrossRef]
  38. Salas, A.; Hernandez-Rocha, C.; Duijvestein, M.; Faubion, W.; McGovern, D.; Vermeire, S.; Vetrano, S.; Casteele, N.V. Jak-Stat Pathway Targeting for the Treatment of Inflammatory Bowel Disease. Nat. Rev. Gastroenterol. Hepatol. 2020, 17, 323–337. [Google Scholar] [CrossRef]
  39. Qing, Y.; Stark, G.R. Alternative Activation of Stat1 and Stat3 in Response to Interferon-Gamma. J. Biol. Chem. 2004, 279, 41679–41685. [Google Scholar] [CrossRef] [Green Version]
  40. Tanabe, Y.; Nishibori, T.; Su, L.; Arduini, R.M.; Baker, D.P.; David, M. Cutting Edge: Role of Stat1, Stat3, and Stat5 in Ifn-Alpha Beta Responses in T Lymphocytes. J. Immunol. 2005, 174, 609–613. [Google Scholar] [CrossRef]
  41. Butturini, E.; de Prati, A.C.; Mariotto, S. Redox Regulation of Stat1 and Stat3 Signaling. Int. J. Mol. Sci. 2020, 21, 7034. [Google Scholar] [CrossRef]
  42. Suzuki, S.; Tanaka, K.; Nogawa, S.; Dembo, T.; Kosakai, A.; Fukuuchi, Y. Phosphorylation of Signal Transducer and Activator of Transcription-3 Stat3 after Focal Cerebral Ischemia in Rats. Exp. Neurol. 2001, 170, 63–71. [Google Scholar] [CrossRef]
  43. Gaudet, A.D.; Popovich, P.G. Extracellular Matrix Regulation of Inflammation in the Healthy and Injured Spinal Cord. Exp. Neurol. 2014, 258, 24–34. [Google Scholar] [CrossRef] [Green Version]
  44. Arroyo, A.G.; Iruela-Arispe, M.L. Extracellular Matrix, Inflammation, and the Angiogenic Response. Cardiovasc. Res 2010, 86, 226–235. [Google Scholar] [CrossRef] [Green Version]
  45. Sorokin, L. The Impact of the Extracellular Matrix on Inflammation. Nat. Rev. Immunol. 2010, 10, 712–723. [Google Scholar] [CrossRef]
  46. Milner, R.; Campbell, I.L. The Extracellular Matrix and Cytokines Regulate Microglial Integrin Expression and Activation. J. Immunol. 2003, 170, 3850–3858. [Google Scholar] [CrossRef] [Green Version]
  47. Ghorbani, S.; Yong, V.W. The Extracellular Matrix as Modifier of Neuroinflammation and Remyelination in Multiple Sclerosis. Brain 2021, 144, 1958–1973. [Google Scholar] [CrossRef]
  48. Jang, D.G.; Sim, H.J.; Song, E.K.; Kwon, T.; Park, T.J. Extracellular Matrixes and Neuroinflammation. BMB Rep. 2020, 53, 491–499. [Google Scholar] [CrossRef]
  49. Ulbrich, P.; Khoshneviszadeh, M.; Jandke, S.; Schreiber, S.; Dityatev, A. Interplay between Perivascular and Perineuronal Extracellular Matrix Remodelling in Neurological and Psychiatric Diseases. Eur. J. Neurosci. 2021, 53, 3811–3830. [Google Scholar] [CrossRef]
  50. Hanada, T.; Yoshimura, A. Regulation of Cytokine Signaling and Inflammation. Cytokine Growth Factor Rev. 2002, 13, 413–421. [Google Scholar] [CrossRef]
  51. Lawrence, T.; Gilroy, D.W.; Colville-Nash, P.R.; Willoughby, D.A. Possible New Role for Nf-Kappab in the Resolution of Inflammation. Nat. Med. 2001, 7, 1291–1297. [Google Scholar] [CrossRef]
  52. Rex, J.; Lutz, A.; Faletti, L.E.; Albrecht, U.; Thomas, M.; Bode, J.G.; Borner, C.; Sawodny, O.; Merfort, I. Il-1beta and Tnfalpha Differentially Influence Nf-Kappab Activity and Fasl-Induced Apoptosis in Primary Murine Hepatocytes During Lps-Induced Inflammation. Front. Physiol. 2019, 10, 117. [Google Scholar] [CrossRef] [PubMed] [Green Version]
  53. Jridi, I.; Cante-Barrett, K.; Pike-Overzet, K.; Staal, F.J.T. Inflammation and Wnt Signaling: Target for Immunomodulatory Therapy? Front. Cell Dev. Biol. 2020, 8, 615131. [Google Scholar] [CrossRef] [PubMed]
  54. Goetzke, C.C.; Ebstein, F.; Kallinich, T. Role of Proteasomes in Inflammation. J. Clin. Med. 2021, 10, 1783. [Google Scholar] [CrossRef] [PubMed]
  55. Straub, A.C.; Lohman, A.W.; Billaud, M.; Johnstone, S.R.; Dwyer, S.T.; Lee, M.Y.; Bortz, P.S.; Best, A.K.; Columbus, L.; Gaston, B.; et al. Endothelial Cell Expression of Haemoglobin Alpha Regulates Nitric Oxide Signalling. Nature 2012, 491, 473–477. [Google Scholar] [CrossRef] [PubMed] [Green Version]
  56. Sangwung, P.; Zhou, G.; Lu, Y.; Liao, X.; Wang, B.; Mutchler, S.M.; Miller, M.; Chance, M.R.; Straub, A.C.; Jain, M.K. Regulation of Endothelial Hemoglobin Alpha Expression by Kruppel-Like Factors. Vasc. Med. 2017, 22, 363–369. [Google Scholar] [CrossRef] [PubMed]
  57. Liu, X.; Nemeth, D.P.; McKim, D.B.; Zhu, L.; DiSabato, D.J.; Berdysz, O.; Gorantla, G.; Oliver, B.; Witcher, K.G.; Wang, Y.; et al. Cell-Type-Specific Interleukin 1 Receptor 1 Signaling in the Brain Regulates Distinct Neuroimmune Activities. Immunity 2019, 50, 317–333.e6. [Google Scholar] [CrossRef] [Green Version]
  58. Fahey, E.; Doyle, S.L. Il-1 Family Cytokine Regulation of Vascular Permeability and Angiogenesis. Front. Immunol. 2019, 10, 1426. [Google Scholar] [CrossRef] [Green Version]
  59. Hauptmann, J.; Johann, L.; Marini, F.; Kitic, M.; Colombo, E.; Mufazalov, I.A.; Krueger, M.; Karram, K.; Moos, S.; Wanke, F.; et al. Interleukin-1 Promotes Autoimmune Neuroinflammation by Suppressing Endothelial Heme Oxygenase-1 at the Blood-Brain Barrier. Acta Neuropathol. 2020, 140, 549–567. [Google Scholar] [CrossRef]
  60. Chen, J.X.; Chen, Y.; DeBusk, L.; Lin, W.; Lin, P.C. Dual Functional Roles of Tie-2/Angiopoietin in Tnf-Alpha-Mediated Angiogenesis. Am. J. Physiol. Heart Circ. Physiol. 2004, 287, H187–H195. [Google Scholar] [CrossRef]
  61. Sainson, R.C.; Johnston, D.A.; Chu, H.C.; Holderfield, M.T.; Nakatsu, M.N.; Crampton, S.P.; Davis, J.; Conn, E.; Hughes, C.C. Tnf Primes Endothelial Cells for Angiogenic Sprouting by Inducing a Tip Cell Phenotype. Blood 2008, 111, 4997–5007. [Google Scholar] [CrossRef]
  62. Stahl, J.L.; Cook, E.B.; Graziano, F.M.; Barney, N.P. Differential and Cooperative Effects of Tnfα, Il-1β, and Ifnγ on Human Conjunctival Epithelial Cell Receptor Expression and Chemokine Release. Investig. Opthalmology Vis. Sci. 2003, 44, 2010–2015. [Google Scholar] [CrossRef] [PubMed] [Green Version]
  63. O’Carroll, S.J.; Kho, D.T.; Wiltshire, R.; Nelson, V.; Rotimi, O.; Johnson, R.; Angel, C.E.; Graham, E.S. Pro-Inflammatory Tnfalpha and Il-1beta Differentially Regulate the Inflammatory Phenotype of Brain Microvascular Endothelial Cells. J. Neuroinflamm. 2015, 12, 131. [Google Scholar] [CrossRef] [PubMed] [Green Version]
  64. Skelly, D.T.; Hennessy, E.; Dansereau, M.A.; Cunningham, C. A Systematic Analysis of the Peripheral and Cns Effects of Systemic Lps, Il-1beta, [Corrected] Tnf-Alpha and Il-6 Challenges in C57bl/6 Mice. PLoS ONE 2013, 8, e69123. [Google Scholar] [CrossRef]
  65. Ferrari, D.; Wesselborg, S.; Bauer, M.K.; Schulze-Osthoff, K. Extracellular Atp Activates Transcription Factor Nf-Kappab through the P2z Purinoreceptor by Selectively Targeting Nf-Kappab P65. J. Cell Biol. 1997, 139, 1635–1643. [Google Scholar] [CrossRef] [PubMed]
  66. Morgan, M.J.; Liu, Z.G. Crosstalk of Reactive Oxygen Species and Nf-Kappab Signaling. Cell Res. 2011, 21, 103–115. [Google Scholar] [CrossRef] [PubMed] [Green Version]
  67. Liddelow, S.A.; Guttenplan, K.A.; Clarke, L.E.; Bennett, F.C.; Bohlen, C.J.; Schirmer, L.; Bennett, M.L.; Munch, A.E.; Chung, W.S.; Peterson, T.C.; et al. Neurotoxic Reactive Astrocytes Are Induced by Activated Microglia. Nature 2017, 541, 481–487. [Google Scholar] [CrossRef] [PubMed]
  68. Liu, X.; Quan, N. Microglia and Cns Interleukin-1: Beyond Immunological Concepts. Front. Neurol. 2018, 9, 8. [Google Scholar] [CrossRef] [Green Version]
  69. Frater-Schroder, M.; Risau, W.; Hallmann, R.; Gautschi, P.; Bohlen, P. Tumor Necrosis Factor Type Alpha, a Potent Inhibitor of Endothelial Cell Growth in Vitro, Is Angiogenic in Vivo. Proc. Natl. Acad. Sci. USA 1987, 84, 5277–5281. [Google Scholar] [CrossRef] [Green Version]
  70. Mohr, T.; Haudek-Prinz, V.; Slany, A.; Grillari, J.; Micksche, M.; Gerner, C. Proteome Profiling in Il-1beta and Vegf-Activated Human Umbilical Vein Endothelial Cells Delineates the Interlink between Inflammation and Angiogenesis. PLoS ONE 2017, 12, e0179065. [Google Scholar] [CrossRef] [Green Version]
  71. Sofroniew, M.V.; Vinters, H.V. Astrocytes: Biology and Pathology. Acta Neuropathol. 2010, 119, 7–35. [Google Scholar] [CrossRef] [Green Version]
  72. Lenz, K.M.; Nelson, L.H. Microglia and Beyond: Innate Immune Cells as Regulators of Brain Development and Behavioral Function. Front. Immunol. 2018, 9, 698. [Google Scholar] [CrossRef] [PubMed] [Green Version]
  73. Kadry, H.; Noorani, B.; Cucullo, L. A Blood-Brain Barrier Overview on Structure, Function, Impairment, and Biomarkers of Integrity. Fluids Barriers CNS 2020, 17, 69. [Google Scholar] [CrossRef] [PubMed]
  74. Tian, L.; Ma, L.; Kaarela, T.; Li, Z. Neuroimmune Crosstalk in the Central Nervous System and Its Significance for Neurological Diseases. J. Neuroinflamm. 2012, 9, 155. [Google Scholar] [CrossRef] [PubMed] [Green Version]
  75. Linnerbauer, M.; Wheeler, M.A.; Quintana, F.J. Astrocyte Crosstalk in Cns Inflammation. Neuron 2020, 108, 608–622. [Google Scholar] [CrossRef] [PubMed]
  76. Bernaus, A.; Blanco, S.; Sevilla, A. Glia Crosstalk in Neuroinflammatory Diseases. Front. Cell Neurosci. 2020, 14, 209. [Google Scholar] [CrossRef]
  77. Li, J.; Ramenaden, E.R.; Peng, J.; Koito, H.; Volpe, J.J.; Rosenberg, P.A. Tumor Necrosis Factor Alpha Mediates Lipopolysaccharide-Induced Microglial Toxicity to Developing Oligodendrocytes When Astrocytes Are Present. J. Neurosci. 2008, 28, 5321–5330. [Google Scholar] [CrossRef] [Green Version]
  78. Engelmann, C.; Weih, F.; Haenold, R. Role of Nuclear Factor Kappa B in Central Nervous System Regeneration. Neural Regen. Res. 2014, 9, 707–711. [Google Scholar]
  79. Mincheva-Tasheva, S.; Soler, R.M. Nf-Kappab Signaling Pathways: Role in Nervous System Physiology and Pathology. Neuroscientist 2013, 19, 175–194. [Google Scholar] [CrossRef] [Green Version]
  80. Ramaglia, V.; Rojas, O.; Naouar, I.; Gommerman, J.L. The Ins and Outs of Central Nervous System Inflammation-Lessons Learned from Multiple Sclerosis. Annu. Rev. Immunol. 2021, 39, 199–226. [Google Scholar] [CrossRef]
  81. Frischer, J.M.; Bramow, S.; Dal-Bianco, A.; Lucchinetti, C.F.; Rauschka, H.; Schmidbauer, M.; Laursen, H.; Sorensen, P.S.; Lassmann, H. The Relation between Inflammation and Neurodegeneration in Multiple Sclerosis Brains. Brain 2009, 132, 1175–1189. [Google Scholar] [CrossRef] [Green Version]
  82. Jiang, X.; Takahashi, N.; Matsui, N.; Tetsuka, T.; Okamoto, T. The Nf-Kappa B Activation in Lymphotoxin Beta Receptor Signaling Depends on the Phosphorylation of P65 at Serine 536. J. Biol. Chem. 2003, 278, 919–926. [Google Scholar] [CrossRef] [PubMed] [Green Version]
  83. Bista, P.; Zeng, W.; Ryan, S.; Bailly, V.; Browning, J.L.; Lukashev, M.E. Traf3 Controls Activation of the Canonical and Alternative Nfkappab by the Lymphotoxin Beta Receptor. J. Biol. Chem. 2010, 285, 12971–12978. [Google Scholar] [CrossRef] [PubMed] [Green Version]
  84. Crowe, P.D.; VanArsdale, T.L.; Walter, B.N.; Ware, C.F.; Hession, C.; Ehrenfels, B.; Browning, J.L.; Din, W.S.; Goodwin, R.G.; Smith, C.A. A Lymphotoxin-Beta-Specific Receptor. Science 1994, 264, 707–710. [Google Scholar] [CrossRef]
  85. Wesche, H.; Henzel, W.J.; Shillinglaw, W.; Li, S.; Cao, Z. Myd88: An Adapter That Recruits Irak to the Il-1 Receptor Complex. Immunity 1997, 7, 837–847. [Google Scholar] [CrossRef] [Green Version]
  86. Yan, X.; Chen, S.; Huang, H.; Peng, T.; Lan, M.; Yang, X.; Dong, M.; Chen, S.; Xu, A.; Huang, S. Functional Variation of Il-1r-Associated Kinases in the Conserved Myd88-Traf6 Pathway During Evolution. J. Immunol. 2020, 204, 832–843. [Google Scholar] [CrossRef] [PubMed]
  87. Muroi, M.; Tanamoto, K. Traf6 Distinctively Mediates Myd88- and Irak-1-Induced Activation of Nf-Kappab. J. Leukoc. Biol. 2008, 83, 702–707. [Google Scholar] [CrossRef] [PubMed]
  88. Muzio, M.; Ni, J.; Feng, P.; Dixit, V.M. Irak Pelle Family Member Irak-2 and Myd88 as Proximal Mediators of Il-1 Signaling. Science 1997, 278, 1612–1615. [Google Scholar] [CrossRef]
  89. Zheng, C.; Chen, J.; Chu, F.; Zhu, J.; Jin, T. Inflammatory Role of Tlr-Myd88 Signaling in Multiple Sclerosis. Front. Mol. Neurosci. 2019, 12, 314. [Google Scholar] [CrossRef]
  90. Lin, S.C.; Lo, Y.C.; Wu, H. Helical Assembly in the Myd88-Irak4-Irak2 Complex in Tlr/Il-1r Signalling. Nature 2010, 465, 885–890. [Google Scholar] [CrossRef] [Green Version]
  91. Senftleben, U.; Cao, Y.; Xiao, G.; Greten, F.R.; Krahn, G.; Bonizzi, G.; Chen, Y.; Hu, Y.; Fong, A.; Sun, S.C.; et al. Activation by Ikkalpha of a Second, Evolutionary Conserved, Nf-Kappa B Signaling Pathway. Science 2001, 293, 1495–1499. [Google Scholar] [CrossRef]
  92. Yamamoto, H.; Kishimoto, T.; Minamoto, S. Nf-Kappab Activation in Cd27 Signaling: Involvement of Tnf Receptor-Associated Factors in Its Signaling and Identification of Functional Region of Cd27. J. Immunol. 1998, 161, 4753–4759. [Google Scholar] [PubMed]
  93. Arch, R.H.; Thompson, C.B. 4-1bb and Ox40 Are Members of a Tumor Necrosis Factor Tnf-Nerve Growth Factor Receptor Subfamily That Bind Tnf Receptor-Associated Factors and Activate Nuclear Factor Kappab. Mol. Cell. Biol. 1998, 18, 558–565. [Google Scholar] [CrossRef] [PubMed] [Green Version]
  94. Jang, I.K.; Lee, Z.H.; Kim, Y.J.; Kim, S.H.; Kwon, B.S. Human 4-1bb Cd137 Signals Are Mediated by Traf2 and Activate Nuclear Factor-Kappa B. Biochem. Biophys. Res. Commun. 1998, 242, 613–620. [Google Scholar] [CrossRef] [PubMed]
  95. Sun, S.C. Non-Canonical Nf-Kappab Signaling Pathway. Cell Res. 2011, 21, 71–85. [Google Scholar] [CrossRef] [PubMed] [Green Version]
  96. Marsters, S.A.; Ayres, T.M.; Skubatch, M.; Gray, C.L.; Rothe, M.; Ashkenazi, A. Herpesvirus Entry Mediator, a Member of the Tumor Necrosis Factor Receptor Tnfr Family, Interacts with Members of the Tnfr-Associated Factor Family and Activates the Transcription Factors Nf-Kappab and Ap-1. J. Biol. Chem. 1997, 272, 14029–14032. [Google Scholar] [CrossRef] [Green Version]
  97. Hsu, H.; Solovyev, I.; Colombero, A.; Elliott, R.; Kelley, M.; Boyle, W.J. Atar, a Novel Tumor Necrosis Factor Receptor Family Member, Signals through Traf2 and Traf5. J. Biol. Chem. 1997, 272, 13471–13474. [Google Scholar] [CrossRef] [Green Version]
  98. Nocentini, G.; Riccardi, C. Gitr: A Multifaceted Regulator of Immunity Belonging to the Tumor Necrosis Factor Receptor Superfamily. Eur. J. Immunol. 2005, 35, 1016–1022. [Google Scholar] [CrossRef]
  99. Marsters, S.A.; Sheridan, J.P.; Donahue, C.J.; Pitti, R.M.; Gray, C.L.; Goddard, A.D.; Bauer, K.D.; Ashkenazi, A. Apo-3, a New Member of the Tumor Necrosis Factor Receptor Family, Contains a Death Domain and Activates Apoptosis and Nf-Κb. Curr. Biol. 1996, 6, 1669–1676. [Google Scholar] [CrossRef] [Green Version]
  100. Kumar, A.; Eby, M.T.; Sinha, S.; Jasmin, A.; Chaudhary, P.M. The Ectodermal Dysplasia Receptor Activates the Nuclear Factor-Kappab, Jnk, and Cell Death Pathways and Binds to Ectodysplasin A. J. Biol. Chem. 2001, 276, 2668–2677. [Google Scholar] [CrossRef] [Green Version]
  101. Brenner, D.; Blaser, H.; Mak, T.W. Regulation of Tumour Necrosis Factor Signalling: Live or Let Die. Nat. Rev. Immunol. 2015, 15, 362–374. [Google Scholar] [CrossRef]
  102. Canning, P.; Ruan, Q.; Schwerd, T.; Hrdinka, M.; Maki, J.L.; Saleh, D.; Suebsuwong, C.; Ray, S.; Brennan, P.E.; Cuny, G.D.; et al. Inflammatory Signaling by Nod-Ripk2 Is Inhibited by Clinically Relevant Type Ii Kinase Inhibitors. Chem. Biol. 2015, 22, 1174–1184. [Google Scholar] [CrossRef] [PubMed] [Green Version]
  103. Moscat, J.; Diaz-Meco, M.T.; Rennert, P. Nf-Kappab Activation by Protein Kinase C Isoforms and B-Cell Function. EMBO Rep. 2003, 4, 31–36. [Google Scholar] [CrossRef] [PubMed] [Green Version]
  104. Ishiai, M.; Kurosaki, M.; Pappu, R.; Okawa, K.; Ronko, I.; Fu, C.; Shibata, M.; Iwamatsu, A.; Chan, A.C.; Kurosaki, T. Blnk Required for Coupling Syk to Plcγ2 and Rac1-Jnk in B Cells. Immunity 1999, 10, 117–125. [Google Scholar] [CrossRef] [Green Version]
  105. Roy, S.K.; Hu, J.; Meng, Q.; Xia, Y.; Shapiro, P.S.; Reddy, S.P.; Platanias, L.C.; Lindner, D.J.; Johnson, P.F.; Pritchard, C.; et al. Mekk1 Plays a Critical Role in Activating the Transcription Factor C/Ebp-Beta-Dependent Gene Expression in Response to Ifn-Gamma. Proc. Natl. Acad. Sci. USA 2002, 99, 7945–7950. [Google Scholar] [CrossRef] [Green Version]
  106. Scapini, P.; Pereira, S.; Zhang, H.; Lowell, C.A. Multiple Roles of Lyn Kinase in Myeloid Cell Signaling and Function. Immunol. Rev. 2009, 228, 23–40. [Google Scholar] [CrossRef] [Green Version]
  107. Zhang, Q.; Didonato, J.A.; Karin, M.; McKeithan, T.W. Bcl3 Encodes a Nuclear Protein Which Can Alter the Subcellular Location of Nf-Kappa B Proteins. Mol. Cell. Biol. 1994, 14, 3915–3926. [Google Scholar]
  108. Wang, V.Y.; Li, Y.; Kim, D.; Zhong, X.; Du, Q.; Ghassemian, M.; Ghosh, G. Bcl3 Phosphorylation by Akt, Erk2, and Ikk Is Required for Its Transcriptional Activity. Mol. Cell 2017, 67, 484–497.e5. [Google Scholar] [CrossRef]
  109. Dimitrakopoulos, F.D.; Antonacopoulou, A.G.; Kottorou, A.E.; Panagopoulos, N.; Kalofonou, F.; Sampsonas, F.; Scopa, C.; Kalofonou, M.; Koutras, A.; Makatsoris, T.; et al. Expression of Intracellular Components of the Nf-Kappab Alternative Pathway Nf-Kappab2, Relb, Nik and Bcl3 Is Associated with Clinical Outcome of Nsclc Patients. Sci. Rep. 2019, 9, 14299. [Google Scholar] [CrossRef] [Green Version]
  110. Lin, X.; O’Mahony, A.; Mu, Y.; Geleziunas, R.; Greene, W.C. Protein Kinase C-Theta Participates in Nf-Kappab Activation Induced by Cd3-Cd28 Costimulation through Selective Activation of Ikappab Kinase Beta. Mol. Cell. Biol. 2000, 20, 2933–2940. [Google Scholar] [CrossRef] [Green Version]
  111. Sun, Z.; Arendt, C.W.; Ellmeier, W.; Schaeffer, E.M.; Sunshine, M.J.; Gandhi, L.; Annes, J.; Petrzilka, D.; Kupfer, A.; Schwartzberg, P.L.; et al. Pkc-Theta Is Required for Tcr-Induced Nf-Kappab Activation in Mature but Not Immature T Lymphocytes. Nature 2000, 404, 402–407. [Google Scholar] [CrossRef]
  112. Ghaffari-Tabrizi, N.; Bauer, B.; Villunger, A.; Baier-Bitterlich, G.; Altman, A.; Utermann, G.; Überall, F.; Baier, G. Protein Kinase Cθ, a Selective Upstream Regulator of Jnk/Sapk and Il-2 Promoter Activation in Jurkat T Cells. Eur. J. Immunol. 1999, 29, 132–142. [Google Scholar] [CrossRef]
  113. Zhou, A.Y.; Shen, R.R.; Kim, E.; Lock, Y.J.; Xu, M.; Chen, Z.J.; Hahn, W.C. Ikkepsilon-Mediated Tumorigenesis Requires K63-Linked Polyubiquitination by a Ciap1/Ciap2/Traf2 E3 Ubiquitin Ligase Complex. Cell Rep. 2013, 3, 724–733. [Google Scholar] [CrossRef] [PubMed] [Green Version]
  114. Bertrand, M.J.; Lippens, S.; Staes, A.; Gilbert, B.; Roelandt, R.; de Medts, J.; Gevaert, K.; Declercq, W.; Vandenabeele, P. Ciap1/2 Are Direct E3 Ligases Conjugating Diverse Types of Ubiquitin Chains to Receptor Interacting Proteins Kinases 1 to 4 Rip1-4. PLoS ONE 2011, 6, e22356. [Google Scholar] [CrossRef] [PubMed] [Green Version]
  115. Dobrzanski, P.; Ryseck, R.P.; Bravo, R. Differential Interactions of Rel-Nf-Kappa B Complexes with I Kappa B Alpha Determine Pools of Constitutive and Inducible Nf-Kappa B Activity. EMBO J. 1994, 13, 4608–4616. [Google Scholar] [CrossRef]
  116. Savinova, O.V.; Hoffmann, A.; Ghosh, G. The Nfkb1 and Nfkb2 Proteins P105 and P100 Function as the Core of High-Molecular-Weight Heterogeneous Complexes. Mol. Cell 2009, 34, 591–602. [Google Scholar] [CrossRef] [Green Version]
  117. Feng, Y.; Duan, T.; Du, Y.; Jin, S.; Wang, M.; Cui, J.; Wang, R.F. Lrrc25 Functions as an Inhibitor of Nf-Kappab Signaling Pathway by Promoting P65/Rela for Autophagic Degradation. Sci. Rep. 2017, 7, 13448. [Google Scholar] [CrossRef] [Green Version]
  118. Kogan, M.; Haine, V.; Ke, Y.; Wigdahl, B.; Fischer-Smith, T.; Rappaport, J. Macrophage Colony Stimulating Factor Regulation by Nuclear Factor Kappa B: A Relevant Pathway in Human Immunodeficiency Virus Type 1 Infected Macrophages. DNA Cell Biol. 2012, 31, 280–289. [Google Scholar] [CrossRef] [Green Version]
  119. Whelan, J.; Ghersa, P.; van Huijsduijnen, R.H.; Gray, J.; Chandra, G.; Talabot, F.; DeLamarter, J.F. An Nf Kappa B-Like Factor Is Essential but Not Sufficient for Cytokine Induction of Endothelial Leukocyte Adhesion Molecule 1 Elam-1 Gene Transcription. Nucleic Acids Res. 1991, 19, 2645–2653. [Google Scholar] [CrossRef] [Green Version]
  120. Schindler, U.; Baichwal, V.R. Three Nf-Kappa B Binding Sites in the Human E-Selectin Gene Required for Maximal Tumor Necrosis Factor Alpha-Induced Expression. Mol. Cell. Biol. 1994, 14, 5820–5831. [Google Scholar]
  121. Libermann, T.A.; Baltimore, D. Activation of Interleukin-6 Gene Expression through the Nf-Kappa B Transcription Factor. Mol Cell. Biol. 1990, 10, 2327–2334. [Google Scholar]
  122. Son, Y.H.; Jeong, Y.T.; Lee, K.A.; Choi, K.H.; Kim, S.M.; Rhim, B.Y.; Kim, K. Roles of Mapk and Nf-Kappab in Interleukin-6 Induction by Lipopolysaccharide in Vascular Smooth Muscle Cells. J. Cardiovasc. Pharmacol. 2008, 51, 71–77. [Google Scholar] [CrossRef] [PubMed]
  123. Barroso, M.; Kao, D.; Blom, H.J.; de Almeida, I.T.; Castro, R.; Loscalzo, J.; Handy, D.E. S-Adenosylhomocysteine Induces Inflammation through Nfkb: A Possible Role for Ezh2 in Endothelial Cell Activation. Biochim. Biophys. Acta 2016, 1862, 82–92. [Google Scholar] [CrossRef] [PubMed] [Green Version]
  124. Astarci, E.; Sade, A.; Cimen, I.; Savas, B.; Banerjee, S. The Nf-Kappab Target Genes Icam-1 and Vcam-1 Are Differentially Regulated During Spontaneous Differentiation of Caco-2 Cells. FEBS J. 2012, 279, 2966–2986. [Google Scholar] [CrossRef] [PubMed]
  125. Kaltschmidt, B.; Linker, R.A.; Deng, J.; Kaltschmidt, C. Cyclooxygenase-2 Is a Neuronal Target Gene of Nf-Kappab. BMC Mol. Biol. 2002, 3, 16. [Google Scholar] [CrossRef] [PubMed]
  126. Taniguchi, K.; Matsuoka, A.; Kizuka, F.; Lee, L.; Tamura, I.; Maekawa, R.; Asada, H.; Taketani, T.; Tamura, H.; Sugino, N. Prostaglandin F2alpha Pgf2alpha Stimulates Ptgs2 Expression and Pgf2alpha Synthesis through Nfkb Activation Via Reactive Oxygen Species in the Corpus Luteum of Pseudopregnant Rats. Reproduction 2010, 140, 885–892. [Google Scholar] [CrossRef] [Green Version]
  127. Kiriakidis, S.; Andreakos, E.; Monaco, C.; Foxwell, B.; Feldmann, M.; Paleolog, E. Vegf Expression in Human Macrophages Is Nf-Kappab-Dependent: Studies Using Adenoviruses Expressing the Endogenous Nf-Kappab Inhibitor Ikappabalpha and a Kinase-Defective Form of the Ikappab Kinase 2. J. Cell Sci. 2003, 116, 665–674. [Google Scholar] [CrossRef] [Green Version]
  128. Burke, S.J.; Lu, D.; Sparer, T.E.; Masi, T.; Goff, M.R.; Karlstad, M.D.; Collier, J.J. Nf-Κb and Stat1 Control Cxcl1 and Cxcl2 Gene Transcription. Am. J. Physiol-Endocrinol. Metab. 2014, 306, E131–E149. [Google Scholar] [CrossRef] [Green Version]
  129. Bitko, V.; Velazquez, A.; Yang, L.; Yang, Y.C.; Barik, S. Transcriptional Induction of Multiple Cytokines by Human Respiratory Syncytial Virus Requires Activation of Nf-Kappa B and Is Inhibited by Sodium Salicylate and Aspirin. Virology 1997, 232, 369–378. [Google Scholar] [CrossRef] [Green Version]
  130. Kunsch, C.; Rosen, C.A. Nf-Kappa B Subunit-Specific Regulation of the Interleukin-8 Promoter. Mol. Cell. Biol. 1993, 13, 6137–6146. [Google Scholar]
  131. Kang, H.B.; Kim, Y.E.; Kwon, H.J.; Sok, D.E.; Lee, Y. Enhancement of Nf-Kappab Expression and Activity Upon Differentiation of Human Embryonic Stem Cell Line Snuhes3. Stem Cells Dev. 2007, 16, 615–623. [Google Scholar] [CrossRef]
  132. Hiscott, J.; Marois, J.; Garoufalis, J.; D’Addario, M.; Roulston, A.; Kwan, I.; Pepin, N.; Lacoste, J.; Nguyen, H.; Bensi, G.; et al. Characterization of a Functional Nf-Kappa B Site in the Human Interleukin 1 Beta Promoter: Evidence for a Positive Autoregulatory Loop. Mol. Cell. Biol. 1993, 13, 6231–6240. [Google Scholar] [PubMed] [Green Version]
  133. Mori, N.; Prager, D. Transactivation of the Interleukin-1alpha Promoter by Human T-Cell Leukemia Virus Type I and Type Ii Tax Proteins. Blood 1996, 87, 3410–3417. [Google Scholar] [CrossRef] [PubMed]
  134. Poleganov, M.A.; Bachmann, M.; Pfeilschifter, J.; Muhl, H. Genome-Wide Analysis Displays Marked Induction of Ebi3/Il-27b in Il-18-Activated Aml-Derived Kg1 Cells: Critical Role of Two Kappab Binding Sites in the Human Ebi3 Promotor. Mol. Immunol. 2008, 45, 2869–2880. [Google Scholar] [CrossRef] [PubMed]
  135. Pietila, T.E.; Veckman, V.; Lehtonen, A.; Lin, R.; Hiscott, J.; Julkunen, I. Multiple Nf-Kappab and Ifn Regulatory Factor Family Transcription Factors Regulate Ccl19 Gene Expression in Human Monocyte-Derived Dendritic Cells. J. Immunol. 2007, 178, 253–261. [Google Scholar] [CrossRef] [Green Version]
  136. Lee, J.S.; Lee, J.Y.; Son, J.W.; Oh, J.H.; Shin, D.M.; Yuk, J.M.; Song, C.H.; Paik, T.H.; Jo, E.K. Expression and Regulation of the Cc-Chemokine Ligand 20 During Human Tuberculosis. Scand. J. Immunol. 2008, 67, 77–85. [Google Scholar] [CrossRef]
  137. Battaglia, F.; Delfino, S.; Merello, E.; Puppo, M.; Piva, R.; Varesio, L.; Bosco, M.C. Hypoxia Transcriptionally Induces Macrophage-Inflammatory Protein-3alpha/Ccl-20 in Primary Human Mononuclear Phagocytes through Nuclear Factor Nf-Kappab. J. Leukoc. Biol. 2008, 83, 648–662. [Google Scholar] [CrossRef] [Green Version]
  138. Shakhov, A.N.; Collart, M.A.; Vassalli, P.; Nedospasov, S.A.; Jongeneel, C.V. Kappa B-Type Enhancers Are Involved in Lipopolysaccharide-Mediated Transcriptional Activation of the Tumor Necrosis Factor Alpha Gene in Primary Macrophages. J. Exp. Med. 1990, 171, 35–47. [Google Scholar] [CrossRef]
  139. Collart, M.A.; Baeuerle, P.; Vassalli, P. Regulation of Tumor Necrosis Factor Alpha Transcription in Macrophages: Involvement of Four Kappa B-Like Motifs and of Constitutive and Inducible Forms of Nf-Kappa B. Mol. Cell. Biol. 1990, 10, 1498–1506. [Google Scholar]
  140. Kim, J.-O.; Kim, H.W.; Baek, K.-M.; Kang, C.-Y. Nf-Κb and Ap-1 Regulate Activation-Dependent Cd137 4-1bb Expression in T Cells. FEBS Lett. 2003, 541, 163–170. [Google Scholar] [CrossRef] [Green Version]
  141. Feng, J.Q.; Xing, L.; Zhang, J.H.; Zhao, M.; Horn, D.; Chan, J.; Boyce, B.F.; Harris, S.E.; Mundy, G.R.; Chen, D. Nf-Kappab Specifically Activates Bmp-2 Gene Expression in Growth Plate Chondrocytes in Vivo and in a Chondrocyte Cell Line in Vitro. J. Biol. Chem. 2003, 278, 29130–29135. [Google Scholar] [CrossRef] [Green Version]
  142. Fukui, N.; Ikeda, Y.; Ohnuki, T.; Hikita, A.; Tanaka, S.; Yamane, S.; Suzuki, R.; Sandell, L.J.; Ochi, T. Pro-Inflammatory Cytokine Tumor Necrosis Factor-Alpha Induces Bone Morphogenetic Protein-2 in Chondrocytes Via Mrna Stabilization and Transcriptional up-Regulation. J. Biol. Chem. 2006, 281, 27229–27241. [Google Scholar] [CrossRef] [PubMed] [Green Version]
  143. Lai, T.Y.; Wu, S.D.; Tsai, M.H.; Chuang, E.Y.; Chuang, L.L.; Hsu, L.C.; Lai, L.C. Transcription of Tnfaip3 Is Regulated by Nf-Kappab and P38 Via C/Ebpbeta in Activated Macrophages. PLoS ONE 2013, 8, e73153. [Google Scholar]
  144. Lu, R.; Moore, P.A.; Pitha, P.M. Stimulation of Irf-7 Gene Expression by Tumor Necrosis Factor Alpha: Requirement for Nfkappa B Transcription Factor and Gene Accessibility. J. Biol. Chem. 2002, 277, 16592–16598. [Google Scholar] [CrossRef] [PubMed] [Green Version]
  145. Bren, G.D.; Solan, N.J.; Miyoshi, H.; Pennington, K.N.; Pobst, L.J.; Paya, C.V. Transcription of the Relb Gene Is Regulated by Nf-Kappab. Oncogene 2001, 20, 7722–7733. [Google Scholar] [CrossRef] [Green Version]
  146. Sanchavanakit, N.; Saengtong, W.; Manokawinchoke, J.; Pavasant, P. Tnf-Alpha Stimulates Mmp-3 Production Via Pge2 Signalling through the Nf-Kb and P38 Mapk Pathway in a Murine Cementoblast Cell Line. Arch. Oral Biol. 2015, 60, 1066–1074. [Google Scholar] [CrossRef]
  147. Bond, M. Inhibition of Transcription Factor Nf-Κb Reduces Matrix Metalloproteinase-1, -3 and -9 Production by Vascular Smooth Muscle Cells. Cardiovasc. Res. 2001, 50, 556–565. [Google Scholar] [CrossRef]
  148. Pach, E.; Kumper, M.; Fromme, J.E.; Zamek, J.; Metzen, F.; Koch, M.; Mauch, C.; Zigrino, P. Extracellular Matrix Remodeling by Fibroblast-Mmp14 Regulates Melanoma Growth. Int. J. Mol. Sci. 2021, 22, 12276. [Google Scholar] [CrossRef]
  149. Wan, J.; Zhang, G.; Li, X.; Qiu, X.; Ouyang, J.; Dai, J.; Min, S. Matrix Metalloproteinase 3: A Promoting and Destabilizing Factor in the Pathogenesis of Disease and Cell Differentiation. Front. Physiol. 2021, 12, 663978. [Google Scholar] [CrossRef]
  150. Lee, E.J.; Moon, P.G.; Baek, M.C.; Kim, H.S. Comparison of the Effects of Matrix Metalloproteinase Inhibitors on Tnf-Alpha Release from Activated Microglia and Tnf-Alpha Converting Enzyme Activity. Biomol. Ther. 2014, 22, 414–419. [Google Scholar] [CrossRef] [Green Version]
  151. Davis, G.E.; Allen, K.A.P.; Salazar, R.; Maxwell, S.A. Matrix Metalloproteinase-1 and -9 Activation by Plasmin Regulates a Novel Endothelial Cell-Mediated Mechanism of Collagen Gel Contraction and Capillary Tube Regression in Three-Dimensional Collagen Matrices. J. Cell Sci. 2001, 114, 917–930. [Google Scholar] [CrossRef]
  152. Hahn-Dantona, E.; Ramos-DeSimone, N.; Sipley, J.; Nagase, H.; French, D.L.; Quigley, J.P. Activation of Prommp-9 by a Plasmin/Mmp-3 Cascade in a Tumor Cell Model. Regulation by Tissue Inhibitors of Metalloproteinases. Ann. N. Y. Acad Sci. 1999, 878, 372–387. [Google Scholar] [CrossRef] [PubMed]
  153. Leonard, W.J.; Lin, J.X. Cytokine Receptor Signaling Pathways. J. Allergy Clin. Immunol. 2000, 105, 877–888. [Google Scholar] [CrossRef] [PubMed]
  154. Li, H.; Meng, Y.H.; Shang, W.Q.; Liu, L.B.; Chen, X.; Yuan, M.M.; Jin, L.P.; Li, M.Q.; Li, D.J. Chemokine Ccl24 Promotes the Growth and Invasiveness of Trophoblasts through Erk1/2 and Pi3k Signaling Pathways in Human Early Pregnancy. Reproduction 2015, 150, 417–427. [Google Scholar] [CrossRef] [PubMed] [Green Version]
  155. Hu, Y.; Ivashkiv, L.B. Costimulation of Chemokine Receptor Signaling by Matrix Metalloproteinase-9 Mediates Enhanced Migration of Ifn-Alpha Dendritic Cells. J. Immunol. 2006, 176, 6022–6033. [Google Scholar] [CrossRef] [PubMed] [Green Version]
  156. Fei, L.; Ren, X.; Yu, H.; Zhan, Y. Targeting the Ccl2/Ccr2 Axis in Cancer Immunotherapy: One Stone, Three Birds? Front. Immunol. 2021, 12, 771210. [Google Scholar] [CrossRef] [PubMed]
  157. Kulkarni, N.; Meitei, H.T.; Sonar, S.A.; Sharma, P.K.; Mujeeb, V.R.; Srivastava, S.; Boppana, R.; Lal, G. Ccr6 Signaling Inhibits Suppressor Function of Induced-Treg During Gut Inflammation. J. Autoimmun. 2018, 88, 121–130. [Google Scholar] [CrossRef] [PubMed]
  158. Lin, H.Y.; Sun, S.M.; Lu, X.F.; Chen, P.Y.; Chen, C.F.; Liang, W.Q.; Peng, C.Y. Ccr10 Activation Stimulates the Invasion and Migration of Breast Cancer Cells through the Erk1/2/Mmp-7 Signaling Pathway. Int. Immunopharmacol. 2017, 51, 124–130. [Google Scholar] [CrossRef]
  159. Rodríguez-Fernández, J.L.; Criado-García, O. The Chemokine Receptor Ccr7 Uses Distinct Signaling Modules with Biased Functionality to Regulate Dendritic Cells. Front. Immunol. 2020, 1, 528. [Google Scholar] [CrossRef]
  160. Prado, G.N.; Suetomi, K.; Shumate, D.; Maxwell, C.; Ravindran, A.; Rajarathnam, K.; Navarro, J. Chemokine Signaling Specificity: Essential Role for the N-Terminal Domain of Chemokine Receptors. Biochemistry 2007, 46, 8961–8968. [Google Scholar] [CrossRef] [Green Version]
  161. Legler, D.F.; Thelen, M. New Insights in Chemokine Signaling. F1000Research 2018, 7, 95. [Google Scholar] [CrossRef]
  162. Lin, L.; Han, M.M.; Wang, F.; Xu, L.L.; Yu, H.X.; Yang, P.Y. Cxcr7 Stimulates Mapk Signaling to Regulate Hepatocellular Carcinoma Progression. Cell Death Dis. 2014, 5, e1488. [Google Scholar] [CrossRef] [PubMed]
  163. Pozzobon, T.; Goldoni, G.; Viola, A.; Molon, B. Cxcr4 Signaling in Health and Disease. Immunol. Lett. 2016, 177, 6–15. [Google Scholar] [CrossRef] [PubMed]
  164. Murdoch, C.; Finn, A. Chemokine Receptors and Their Role in Inflammation and Infectious Diseases. Blood 2000, 95, 3032–3043. [Google Scholar] [CrossRef] [PubMed]
  165. Kuropatwinski, K.K.; de Imus, C.; Gearing, D.; Baumann, H.; Mosley, B. Influence of Subunit Combinations on Signaling by Receptors for Oncostatin M, Leukemia Inhibitory Factor, and Interleukin-6. J. Biol. Chem. 1997, 272, 15135–15144. [Google Scholar] [CrossRef] [Green Version]
  166. Kitanaka, N.; Nakano, R.; Sugiura, K.; Kitanaka, T.; Namba, S.; Konno, T.; Nakayama, T.; Sugiya, H. Interleukin-1beta Promotes Interleulin-6 Expression Via Erk1/2 Signaling Pathway in Canine Dermal Fibroblasts. PLoS ONE 2019, 14, e0220262. [Google Scholar] [CrossRef]
  167. Johnson, D.E.; O’Keefe, R.A.; Grandis, J.R. Targeting the Il-6/Jak/Stat3 Signalling Axis in Cancer. Nat. Rev. Clin. Oncol. 2018, 15, 234–248. [Google Scholar] [CrossRef]
  168. Huang, L.; Hu, B.; Ni, J.; Wu, J.; Jiang, W.; Chen, C.; Yang, L.; Zeng, Y.; Wan, R.; Hu, G.; et al. Transcriptional Repression of Socs3 Mediated by Il-6/Stat3 Signaling Via Dnmt1 Promotes Pancreatic Cancer Growth and Metastasis. J. Exp. Clin. Cancer Res. 2016, 35, 27. [Google Scholar] [CrossRef] [Green Version]
  169. Biffi, G.; Oni, T.E.; Spielman, B.; Hao, Y.; Elyada, E.; Park, Y.; Preall, J.; Tuveson, D.A. Il1-Induced Jak/Stat Signaling Is Antagonized by Tgfbeta to Shape Caf Heterogeneity in Pancreatic Ductal Adenocarcinoma. Cancer Discov. 2019, 9, 282–301. [Google Scholar] [CrossRef] [Green Version]
  170. Whitley, S.K.; Balasubramani, A.; Zindl, C.L.; Sen, R.; Shibata, Y.; Crawford, G.E.; Weathington, N.M.; Hatton, R.D.; Weaver, C.T. Il-1r Signaling Promotes Stat3 and Nf-Kappab Factor Recruitment to Distal Cis-Regulatory Elements That Regulate Il17a/F Transcription. J. Biol. Chem. 2018, 293, 15790–15800. [Google Scholar] [CrossRef] [Green Version]
  171. Gao, P.; Leung, D.Y.; Rafaels, N.M.; Hand, T.; Boguniewicz, M.; Hata, T.R.; Schneider, L.; Hanifin, J.M.; Gallo, R.L.; Gao, L. Genetic Variants in Tslp and Its Receptor, Il7r, Contribute to an Increased Risk for Atopic Dermatitis and Eczema Herpeticum in Two American Populations. J. Allergy Clin. Immunol. 2009, 123, S70. [Google Scholar] [CrossRef]
  172. Pflanz, S.; Timans, J.C.; Cheung, J.; Rosales, R.; Kanzler, H.; Gilbert, J.; Hibbert, L.; Churakova, T.; Travis, M.; Vaisberg, E.; et al. Il-27, a Heterodimeric Cytokine Composed of Ebi3 and P28 Protein, Induces Proliferation of Naive Cd4+ T Cells. Immunity 2002, 16, 779–790. [Google Scholar] [CrossRef] [Green Version]
  173. Lucas, S.; Ghilardi, N.; Li, J.; de Sauvage, F.J. Il-27 Regulates Il-12 Responsiveness of Naive Cd4+ T Cells through Stat1-Dependent and -Independent Mechanisms. Proc. Natl. Acad. Sci. USA 2003, 100, 15047–15052. [Google Scholar] [CrossRef] [PubMed] [Green Version]
  174. Hibbert, L.; Pflanz, S.; Malefyt, R.d.; Kastelein, R.A. Il-27 and Ifn-Alpha Signal Via Stat1 and Stat3 and Induce T-Bet and Il-12rbeta2 in Naive T Cells. J. Interferon Cytokine Res. 2003, 23, 513–522. [Google Scholar] [CrossRef]
  175. Fabbi, M.; Carbotti, G.; Ferrini, S. Dual Roles of Il-27 in Cancer Biology and Immunotherapy. Mediat. Inflamm. 2017, 2017, 3958069. [Google Scholar] [CrossRef] [PubMed] [Green Version]
  176. Owaki, T.; Asakawa, M.; Kamiya, S.; Takeda, K.; Fukai, F.; Mizuguchi, J.; Yoshimoto, T. Il-27 Suppresses Cd28-Mediated [Correction of Medicated] Il-2 Production through Suppressor of Cytokine Signaling 3. J. Immunol. 2006, 176, 2773–2780. [Google Scholar] [CrossRef] [PubMed] [Green Version]
  177. Mishra, A.; Sullivan, L.; Caligiuri, M.A. Molecular Pathways: Interleukin-15 Signaling in Health and in Cancer. Clin. Cancer Res. 2014, 20, 2044–2050. [Google Scholar] [CrossRef] [PubMed] [Green Version]
  178. Carroll, H.P.; Paunovic, V.; Gadina, M. Signalling, Inflammation and Arthritis: Crossed Signals: The Role of Interleukin-15 and -18 in Autoimmunity. Rheumatol. Oxf. 2008, 47, 1269–1277. [Google Scholar] [CrossRef] [PubMed] [Green Version]
  179. McKay, M.M.; Morrison, D.K. Integrating Signals from Rtks to Erk/Mapk. Oncogene 2007, 26, 3113–3121. [Google Scholar] [CrossRef] [Green Version]
  180. Kowanetz, M.; Ferrara, N. Vascular Endothelial Growth Factor Signaling Pathways: Therapeutic Perspective. Clin. Cancer Res. 2006, 12, 5018–5022. [Google Scholar] [CrossRef] [Green Version]
  181. Bartoli, M.; Gu, X.; Tsai, N.T.; Venema, R.C.; Brooks, S.E.; Marrero, M.B.; Caldwell, R.B. Vascular Endothelial Growth Factor Activates Stat Proteins in Aortic Endothelial Cells. J. Biol. Chem. 2000, 275, 33189–33192. [Google Scholar] [CrossRef] [Green Version]
  182. Zhang, H.; Bajraszewski, N.; Wu, E.; Wang, H.; Moseman, A.P.; Dabora, S.L.; Griffin, J.D.; Kwiatkowski, D.J. Pdgfrs Are Critical for Pi3k/Akt Activation and Negatively Regulated by Mtor. J. Clin. Investig. 2007, 117, 730–738. [Google Scholar] [CrossRef] [PubMed] [Green Version]
  183. Gharibi, B.; Ghuman, M.S.; Hughes, F.J. Akt- and Erk-Mediated Regulation of Proliferation and Differentiation During Pdgfrbeta-Induced Msc Self-Renewal. J. Cell. Mol. Med. 2012, 16, 2789–2801. [Google Scholar] [CrossRef] [PubMed]
  184. Dell’Albani, P.; Kahn, M.A.; Cole, R.; Condorelli, D.F.; Giuffrida-Stella, A.M.; de Vellis, J. Oligodendroglial Survival Factors, Pdgf-Aa and Cntf, Activate Similar Jak/Stat Signaling Pathways. J. Neurosci. Res. 1998, 54, 191–205. [Google Scholar] [CrossRef]
  185. Neeli, I.; Liu, Z.; Dronadula, N.; Ma, Z.A.; Rao, G.N. An Essential Role of the Jak-2/Stat-3/Cytosolic Phospholipase a2 Axis in Platelet-Derived Growth Factor Bb-Induced Vascular Smooth Muscle Cell Motility. J. Biol. Chem. 2004, 279, 46122–46128. [Google Scholar] [CrossRef] [Green Version]
  186. Li, B.; Zhang, G.; Li, C.; Li, R.; Lu, J.; He, Z.; Wang, Q.; Peng, Z.; Wang, J.; Dong, Y.; et al. Lyn Mediates Fip1l1-Pdgfra Signal Pathway Facilitating Il-5ra Intracellular Signal through Fip1l1-Pdgfra/Jak2/Lyn/Akt Network Complex in Cel. Oncotarget 2017, 8, 64984–64998. [Google Scholar] [CrossRef]
  187. Tothova, Z.; Tomc, J.; Debeljak, N.; Solar, P. Stat5 as a Key Protein of Erythropoietin Signalization. Int. J. Mol. Sci. 2021, 22, 7109. [Google Scholar] [CrossRef]
  188. Dillon, S.R.; Sprecher, C.; Hammond, A.; Bilsborough, J.; Rosenfeld-Franklin, M.; Presnell, S.R.; Haugen, H.S.; Maurer, M.; Harder, B.; Johnston, J.; et al. Interleukin 31, a Cytokine Produced by Activated T Cells, Induces Dermatitis in Mice. Nat. Immunol. 2004, 5, 752–760. [Google Scholar] [CrossRef]
  189. Hintzen, C.; Evers, C.; Lippok, B.E.; Volkmer, R.; Heinrich, P.C.; Radtke, S.; Hermanns, H.M. Box 2 Region of the Oncostatin M Receptor Determines Specificity for Recruitment of Janus Kinases and Stat5 Activation. J. Biol. Chem. 2008, 283, 19465–19477. [Google Scholar] [CrossRef] [Green Version]
  190. Viswanadhapalli, S.; Dileep, K.V.; Zhang, K.Y.J.; Nair, H.B.; Vadlamudi, R.K. Targeting Lif/Lifr Signaling in Cancer. Genes Dis. 2021, in press. [CrossRef]
  191. Suman, P.; Malhotra, S.S.; Gupta, S.K. Lif-Stat Signaling and Trophoblast Biology. JAKSTAT 2013, 2, e25155. [Google Scholar] [CrossRef] [Green Version]
  192. Malaval, L.; Liu, F.; Vernallis, A.B.; Aubin, J.E. Gp130/Osmr Is the Only Lif/Il-6 Family Receptor Complex to Promote Osteoblast Differentiation of Calvaria Progenitors. J. Cell. Physiol. 2005, 204, 585–593. [Google Scholar] [CrossRef] [PubMed]
  193. Balakrishnan, L.; Soman, S.; Patil, Y.B.; Advani, J.; Thomas, J.K.; Desai, D.V.; Kulkarni-Kale, U.; Harsha, H.C.; Prasad, T.S.; Raju, R.; et al. Il-11/Il11ra Receptor Mediated Signaling: A Web Accessible Knowledgebase. Cell Commun. Adhes. 2013, 20, 81–86. [Google Scholar] [CrossRef] [PubMed] [Green Version]
  194. Larsen, J.V.; Kristensen, A.M.; Pallesen, L.T.; Bauer, J.; Vaegter, C.B.; Nielsen, M.S.; Madsen, P.; Petersen, C.M. Cytokine-Like Factor 1, an Essential Facilitator of Cardiotrophin-Like Cytokine:Ciliary Neurotrophic Factor Receptor Alpha Signaling and Sorla-Mediated Turnover. Mol. Cell. Biol. 2016, 36, 1272–1286. [Google Scholar] [CrossRef] [PubMed] [Green Version]
  195. Hashimoto, Y.; Kurita, M.; Aiso, S.; Nishimoto, I.; Matsuoka, M. Humanin Inhibits Neuronal Cell Death by Interacting with a Cytokine Receptor Complex or Complexes Involving Cntf Receptor Alpha/Wsx-1/Gp130. Mol. Biol. Cell 2009, 20, 2864–2873. [Google Scholar] [CrossRef] [Green Version]
  196. Lelievre, E.; Plun-Favreau, H.; Chevalier, S.; Froger, J.; Guillet, C.; Elson, G.C.; Gauchat, J.F.; Gascan, H. Signaling Pathways Recruited by the Cardiotrophin-Like Cytokine/Cytokine-Like Factor-1 Composite Cytokine: Specific Requirement of the Membrane-Bound Form of Ciliary Neurotrophic Factor Receptor Alpha Component. J. Biol. Chem. 2001, 276, 22476–22484. [Google Scholar] [CrossRef] [Green Version]
  197. Kim, J.W.; Marquez, C.P.; Sperberg, R.A.P.; Wu, J.; Bae, W.G.; Huang, P.S.; Sweet-Cordero, E.A.; Cochran, J.R. Engineering a Potent Receptor Superagonist or Antagonist from a Novel Il-6 Family Cytokine Ligand. Proc. Natl. Acad. Sci. USA 2020, 117, 14110–14118. [Google Scholar] [CrossRef]
  198. Sun, Z.J.; Chen, G.; Hu, X.; Zhang, W.; Liu, Y.; Zhu, L.X.; Zhou, Q.; Zhao, Y.F. Activation of Pi3k/Akt/Ikk-Alpha/Nf-Kappab Signaling Pathway Is Required for the Apoptosis-Evasion in Human Salivary Adenoid Cystic Carcinoma: Its Inhibition by Quercetin. Apoptosis 2010, 15, 850–863. [Google Scholar] [CrossRef]
  199. Dan, H.C.; Cooper, M.J.; Cogswell, P.C.; Duncan, J.A.; Ting, J.P.; Baldwin, A.S. Akt-Dependent Regulation of Nf-{Kappa}B Is Controlled by Mtor and Raptor in Association with Ikk. Genes Dev. 2008, 22, 1490–1500. [Google Scholar] [CrossRef] [Green Version]
  200. Li, Z.; Yang, Z.; Passaniti, A.; Lapidus, R.G.; Liu, X.; Cullen, K.J.; Dan, H.C. A Positive Feedback Loop Involving Egfr/Akt/Mtorc1 and Ikk/Nf-Kb Regulates Head and Neck Squamous Cell Carcinoma Proliferation. Oncotarget 2016, 7, 31892–31906. [Google Scholar] [CrossRef]
  201. Romashkova, J.A.; Makarov, S.S. Nf-Kappab Is a Target of Akt in Anti-Apoptotic Pdgf Signalling. Nature 1999, 401, 86–90. [Google Scholar] [CrossRef]
  202. Legendre, F.; Dudhia, J.; Pujol, J.P.; Bogdanowicz, P. Jak/Stat but Not Erk1/Erk2 Pathway Mediates Interleukin Il-6/Soluble Il-6r Down-Regulation of Type Ii Collagen, Aggrecan Core, and Link Protein Transcription in Articular Chondrocytes. Association with a Down-Regulation of Sox9 Expression. J. Biol. Chem. 2003, 278, 2903–2912. [Google Scholar] [CrossRef] [PubMed] [Green Version]
  203. Cutler, S.J.; Doecke, J.D.; Ghazawi, I.; Yang, J.; Griffiths, L.R.; Spring, K.J.; Ralph, S.J.; Mellick, A.S. Novel Stat Binding Elements Mediate Il-6 Regulation of Mmp-1 and Mmp-3. Sci. Rep. 2017, 7, 8526. [Google Scholar] [CrossRef] [PubMed]
  204. Ye, N.; Ding, Y.; Wild, C.; Shen, Q.; Zhou, J. Small Molecule Inhibitors Targeting Activator Protein 1 Ap-1. J. Med. Chem. 2014, 57, 6930–6948. [Google Scholar] [CrossRef] [PubMed]
  205. Zhang, Y.; Feng, X.H.; Derynck, R. Smad3 and Smad4 Cooperate with C-Jun/C-Fos to Mediate Tgf-Beta-Induced Transcription. Nature 1998, 394, 909–913. [Google Scholar] [CrossRef]
  206. Washio, A.; Kitamura, C.; Morotomi, T.; Terashita, M.; Nishihara, T. Possible Involvement of Smad Signaling Pathways in Induction of Odontoblastic Properties in Kn-3 Cells by Bone Morphogenetic Protein-2: A Growth Factor to Induce Dentin Regeneration. Int. J. Dent. 2012, 2012, 258469. [Google Scholar] [CrossRef] [Green Version]
  207. Chen, Q.; Lee, C.E.; Denard, B.; Sustained, J.Y. Induction of Collagen Synthesis by Tgf-Beta Requires Regulated Intramembrane Proteolysis of Creb3l1. PLoS ONE 2014, 9, e108528. [Google Scholar]
  208. Greenwood, M.P.; Greenwood, M.; Gillard, B.T.; Devi, R.C.; Murphy, D. Regulation of Camp Responsive Element Binding Protein 3-Like 1 Creb3l1 Expression by Orphan Nuclear Receptor Nr4a1. Front. Mol. Neurosci. 2017, 10, 413. [Google Scholar] [CrossRef] [Green Version]
  209. Oshiumi, H.; Miyashita, M.; Matsumoto, M.; Seya, T. A Distinct Role of Riplet-Mediated K63-Linked Polyubiquitination of the Rig-I Repressor Domain in Human Antiviral Innate Immune Responses. PLoS Pathog. 2013, 9, e1003533. [Google Scholar] [CrossRef] [Green Version]
  210. Gack, M.U.; Shin, Y.C.; Joo, C.H.; Urano, T.; Liang, C.; Sun, L.; Takeuchi, O.; Akira, S.; Chen, Z.; Inoue, S.; et al. Trim25 Ring-Finger E3 Ubiquitin Ligase Is Essential for Rig-I-Mediated Antiviral Activity. Nature 2007, 446, 916–920. [Google Scholar] [CrossRef]
  211. Shi, Y.; Yuan, B.; Zhu, W.; Zhang, R.; Li, L.; Hao, X.; Chen, S.; Hou, F. Ube2d3 and Ube2n Are Essential for Rig-I-Mediated Mavs Aggregation in Antiviral Innate Immunity. Nat. Commun. 2017, 8, 15138. [Google Scholar] [CrossRef] [Green Version]
  212. Cadena, C.; Ahmad, S.; Xavier, A.; Willemsen, J.; Park, S.; Park, J.W.; Oh, S.W.; Fujita, T.; Hou, F.; Binder, M.; et al. Ubiquitin-Dependent and -Independent Roles of E3 Ligase Riplet in Innate Immunity. Cell 2019, 177, 1187–1200.e16. [Google Scholar] [CrossRef] [PubMed]
  213. Zhang, S.; Thomas, K.; Blanco, J.C.; Salkowski, C.A.; Vogel, S.N. The Role of the Interferon Regulatory Factors, Irf-1 and Irf-2, in Lps-Induced Cyclooxygenase-2 Cox-2 Expression in Vivo and in Vitro. J. Endotoxin Res. 2002, 8, 379–388. [Google Scholar] [CrossRef] [PubMed]
  214. Oshima, S.; Nakamura, T.; Namiki, S.; Okada, E.; Tsuchiya, K.; Okamoto, R.; Yamazaki, M.; Yokota, T.; Aida, M.; Yamaguchi, Y.; et al. Interferon Regulatory Factor 1 Irf-1 and Irf-2 Distinctively up-Regulate Gene Expression and Production of Interleukin-7 in Human Intestinal Epithelial Cells. Mol. Cell. Biol. 2004, 24, 6298–6310. [Google Scholar] [CrossRef] [PubMed] [Green Version]
  215. Song, G.; Fleming, J.A.; Kim, J.; Spencer, T.E.; Bazer, F.W. Pregnancy and Interferon Tau Regulate Ddx58 and Plscr1 in the Ovine Uterus During the Peri-Implantation Period. Reproduction 2011, 141, 127–138. [Google Scholar] [CrossRef] [Green Version]
  216. Trinchieri, G. Interleukin-12 and the Regulation of Innate Resistance and Adaptive Immunity. Nat. Rev. Immunol. 2003, 3, 133–146. [Google Scholar] [CrossRef]
  217. Maratheftis, C.I.; Giannouli, S.; Spachidou, M.P.; Panayotou, G.; Voulgarelis, M. Rna Interference of Interferon Regulatory Factor-1 Gene Expression in Thp-1 Cell Line Leads to Toll-Like Receptor-4 Overexpression/Activation as Well as up-Modulation of Annexin-Ii. Neoplasia 2007, 9, 1012–1020. [Google Scholar] [CrossRef] [Green Version]
  218. Pigino, G.; Ishikawa, T. Axonemal Radial Spokes: 3d Structure, Function and Assembly. Bioarchitecture 2012, 2, 50–58. [Google Scholar] [CrossRef]
  219. Lobry, C.; Lopez, T.; Israel, A.; Weil, R. Negative Feedback Loop in T Cell Activation through Ikappab Kinase-Induced Phosphorylation and Degradation of Bcl10. Proc. Natl. Acad. Sci. USA 2007, 104, 908–913. [Google Scholar] [CrossRef] [Green Version]
  220. Lopez-Pelaez, M.; Lamont, D.J.; Peggie, M.; Shpiro, N.; Gray, N.S.; Cohen, P. Protein Kinase Ikkbeta-Catalyzed Phosphorylation of Irf5 at Ser462 Induces Its Dimerization and Nuclear Translocation in Myeloid Cells. Proc. Natl. Acad. Sci. USA 2014, 111, 17432–17437. [Google Scholar] [CrossRef] [Green Version]
  221. Clark, K.; Peggie, M.; Plater, L.; Sorcek, R.J.; Young, E.R.; Madwed, J.B.; Hough, J.; McIver, E.G.; Cohen, P. Novel Cross-Talk within the Ikk Family Controls Innate Immunity. Biochem. J. 2011, 434, 93–104. [Google Scholar] [CrossRef] [Green Version]
  222. Han, K.J.; Su, X.; Xu, L.G.; Bin, L.H.; Zhang, J.; Shu, H.B. Mechanisms of the Trif-Induced Interferon-Stimulated Response Element and Nf-Kappab Activation and Apoptosis Pathways. J. Biol. Chem. 2004, 279, 15652–15661. [Google Scholar] [CrossRef] [PubMed] [Green Version]
  223. Takada, Y.K.; Yu, J.; Shimoda, M.; Takada, Y. Integrin Binding to the Trimeric Interface of Cd40l Plays a Critical Role in Cd40/Cd40l Signaling. J. Immunol. 2019, 203, 1383–1391. [Google Scholar] [CrossRef] [PubMed]
  224. Aizawa, S.; Nakano, H.; Ishida, T.; Horie, R.; Nagai, M.; Ito, K.; Yagita, H.; Okumura, K.; Inoue, J.; Watanabe, T. Tumor Necrosis Factor Receptor-Associated Factor Traf 5 and Traf2 Are Involved in Cd30-Mediated Nfkappab Activation. J. Biol. Chem. 1997, 272, 2042–2045. [Google Scholar] [CrossRef] [PubMed] [Green Version]
  225. Zhan, C.; Patskovsky, Y.; Yan, Q.; Li, Z.; Ramagopal, U.; Cheng, H.; Brenowitz, M.; Hui, X.; Nathenson, S.G.; Almo, S.C. Decoy Strategies: The Structure of Tl1a:Dcr3 Complex. Structure 2011, 19, 162–171. [Google Scholar] [CrossRef] [PubMed] [Green Version]
  226. Carter, B.D.; Kaltschmidt, C.; Kaltschmidt, B.; Offenhauser, N.; Bohm-Matthaei, R.; Baeuerle, P.A.; Barde, Y.A. Selective Activation of Nf-Kappa B by Nerve Growth Factor through the Neurotrophin Receptor P75. Science 1996, 272, 542–545. [Google Scholar] [CrossRef] [PubMed]
  227. Schreck, R.; Baeuerle, P.A. Nf-Kappa B as Inducible Transcriptional Activator of the Granulocyte-Macrophage Colony-Stimulating Factor Gene. Mol. Cell. Biol. 1990, 10, 1281–1286. [Google Scholar]
  228. Azimi, N.; Brown, K.; Bamford, R.N.; Tagaya, Y.; Siebenlist, U.; Waldmann, T.A. Human T Cell Lymphotropic Virus Type I Tax Protein Trans-Activates Interleukin 15 Gene Transcription through an Nf-Kappab Site. Proc. Natl. Acad. Sci. USA 1998, 95, 2452–2457. [Google Scholar] [CrossRef] [Green Version]
  229. Lenardo, M.J.; Fan, C.-M.; Maniatis, T.; Baltimore, D. The Involvement of Nf-Κb in Β-Interferon Gene Regulation Reveals Its Role as Widely Inducible Mediator of Signal Transduction. Cell 1989, 57, 287–294. [Google Scholar] [CrossRef]
  230. Hiscott, J.; Alper, D.; Cohen, L.; Leblanc, J.F.; Sportza, L.; Wong, A.; Xanthoudakis, S. Induction of Human Interferon Gene Expression Is Associated with a Nuclear Factor That Interacts with the Nf-Kappa B Site of the Human Immunodeficiency Virus Enhancer. J. Virol. 1989, 63, 2557–2566. [Google Scholar] [CrossRef] [Green Version]
  231. Bash, J.; Zong, W.X.; Banga, S.; Rivera, A.; Ballard, D.W.; Ron, Y.; Gelinas, C. Rel/Nf-Kappab Can Trigger the Notch Signaling Pathway by Inducing the Expression of Jagged1, a Ligand for Notch Receptors. EMBO J. 1999, 18, 2803–2811. [Google Scholar] [CrossRef] [Green Version]
  232. Wickremasinghe, M.I.; Thomas, L.H.; O’Kane, C.M.; Uddin, J.; Friedland, J.S. Transcriptional Mechanisms Regulating Alveolar Epithelial Cell-Specific Ccl5 Secretion in Pulmonary Tuberculosis. J. Biol. Chem. 2004, 279, 27199–27210. [Google Scholar] [CrossRef] [PubMed] [Green Version]
  233. Yabluchanskiy, A.; Ma, Y.; Iyer, R.P.; Hall, M.E.; Lindsey, M.L. Matrix Metalloproteinase-9: Many Shades of Function in Cardiovascular Disease. Physiol. 2013, 28, 391–403. [Google Scholar] [CrossRef] [PubMed] [Green Version]
  234. Charlet, A.; Kappenstein, M.; Keye, P.; Klasener, K.; Endres, C.; Poggio, T.; Gorantla, S.P.; Kreutmair, S.; Sanger, J.; Illert, A.L.; et al. The Il-3, Il-5, and Gm-Csf Common Receptor Beta Chain Mediates Oncogenic Activity of Flt3-Itd-Positive Aml. Leukemia 2022, 36, 701–711. [Google Scholar] [CrossRef]
  235. Ratthe, C.; Girard, D. Interleukin-15 Enhances Human Neutrophil Phagocytosis by a Syk-Dependent Mechanism: Importance of the Il-15ralpha Chain. J. Leukoc. Biol. 2004, 76, 162–168. [Google Scholar] [CrossRef] [PubMed]
  236. Rosenzweig, S.D.; Schwartz, O.M.; Brown, M.R.; Leto, T.L.; Holland, S.M. Characterization of a Dipeptide Motif Regulating Ifn-Gamma Receptor 2 Plasma Membrane Accumulation and Ifn-Gamma Responsiveness. J. Immunol. 2004, 173, 3991–3999. [Google Scholar] [CrossRef] [Green Version]
  237. Kotenko, S.V.; Izotova, L.S.; Pollack, B.P.; Mariano, T.M.; Donnelly, R.J.; Muthukumaran, G.; Cook, J.R.; Garotta, G.; Silvennoinen, O.; Ihle, J.N.; et al. Interaction between the Components of the Interferon Gamma Receptor Complex. J. Biol. Chem. 1995, 270, 20915–20921. [Google Scholar] [CrossRef] [Green Version]
  238. Sakatsume, M.; Igarashi, K.; Winestock, K.D.; Garotta, G.; Larner, A.C.; Finbloom, D.S. The Jak Kinases Differentially Associate with the Alpha and Beta Accessory Factor Chains of the Interferon Gamma Receptor to Form a Functional Receptor Unit Capable of Activating Stat Transcription Factors. J. Biol. Chem. 1995, 270, 17528–17534. [Google Scholar] [CrossRef] [Green Version]
  239. Grafone, T.; Palmisano, M.; Nicci, C.; Storti, S. An Overview on the Role of Flt3-Tyrosine Kinase Receptor in Acute Myeloid Leukemia: Biology and Treatment. Oncol. Rev. 2012, 6, e8. [Google Scholar] [CrossRef] [Green Version]
  240. Kazlauskas, A. Pdgfs and Their Receptors. Gene 2017, 614, 1–7. [Google Scholar] [CrossRef]
  241. Kamalakar, A.; McKinney, J.M.; Duron, D.S.; Amanso, A.M.; Ballestas, S.A.; Drissi, H.; Willett, N.J.; Bhattaram, P.; Garcia, A.J.; Wood, L.B.; et al. Jagged1 Stimulates Cranial Neural Crest Cell Osteoblast Commitment Pathways and Bone Regeneration Independent of Canonical Notch Signaling. Bone 2021, 143, 115657. [Google Scholar] [CrossRef]
  242. Ip, N.Y.; McClain, J.; Barrezueta, N.X.; Aldrich, T.H.; Pan, L.; Li, Y.; Wiegand, S.J.; Friedman, B.; Davis, S.; Yancopoulos, G.D. The A Component of the Cntf Receptor Is Required for Signaling and Defines Potential Cntf Targets in the Adult and During Development. Neuron 1993, 10, 89–102. [Google Scholar] [CrossRef]
  243. Kim, J.W.; Marquez, C.P.; Kostyrko, K.; Koehne, A.L.; Marini, K.; Simpson, D.R.; Lee, A.G.; Leung, S.G.; Sayles, L.C.; Shrager, J.; et al. Antitumor Activity of an Engineered Decoy Receptor Targeting Clcf1-Cntfr Signaling in Lung Adenocarcinoma. Nat. Med. 2019, 25, 1783–1795. [Google Scholar] [CrossRef] [PubMed]
  244. Liu, X.; Sun, R.; Chen, J.; Liu, L.; Cui, X.; Shen, S.; Cui, G.; Ren, Z.; Yu, Z. Crosstalk Mechanisms between Hgf/C-Met Axis and Ncrnas in Malignancy. Front. Cell Dev. Biol. 2020, 8, 23. [Google Scholar] [CrossRef] [PubMed] [Green Version]
  245. Raingeaud, J.; Whitmarsh, A.J.; Barrett, T.; Derijard, B.; Davis, R.J. Mkk3- and Mkk6-Regulated Gene Expression Is Mediated by the P38 Mitogen-Activated Protein Kinase Signal Transduction Pathway. Mol. Cell. Biol. 1996, 16, 1247–1255. [Google Scholar] [CrossRef] [PubMed] [Green Version]
  246. Wieser, R.; Wrana, J.L.; Massagué, J. Gs Domain Mutations That Constitutively Activate T Beta R-I, the Downstream Signaling Component in the Tgf-Beta Receptor Complex. EMBO J. 1995, 1410, 2199–2208. [Google Scholar] [CrossRef]
  247. Macias-Silva, M.; Hoodless, P.A.; Tang, S.J.; Buchwald, M.; Wrana, J.L. Specific Activation of Smad1 Signaling Pathways by the Bmp7 Type I Receptor, Alk2. J. Biol. Chem. 1998, 273, 25628–25636. [Google Scholar] [CrossRef] [Green Version]
  248. Yamamoto, M.; Sato, S.; Mori, K.; Hoshino, K.; Takeuchi, O.; Takeda, K.; Akira, S. Cutting Edge: A Novel Toll/Il-1 Receptor Domain-Containing Adapter That Preferentially Activates the Ifn-Beta Promoter in the Toll-Like Receptor Signaling. J. Immunol. 2002, 169, 6668–6672. [Google Scholar] [CrossRef] [Green Version]
  249. Oshiumi, H.; Matsumoto, M.; Funami, K.; Akazawa, T.; Seya, T. Ticam-1, an Adaptor Molecule That Participates in Toll-Like Receptor 3-Mediated Interferon-Beta Induction. Nat. Immunol. 2003, 4, 161–167. [Google Scholar] [CrossRef]
  250. Taabazuing, C.Y.; Okondo, M.C.; Bachovchin, D.A. Pyroptosis and Apoptosis Pathways Engage in Bidirectional Crosstalk in Monocytes and Macrophages. Cell Chem. Biol. 2017, 24, 507–514.e4. [Google Scholar] [CrossRef] [Green Version]
  251. Scott, F.L.; Stec, B.; Pop, C.; Dobaczewska, M.K.; Lee, J.J.; Monosov, E.; Robinson, H.; Salvesen, G.S.; Schwarzenbacher, R.; Riedl, S.J. The Fas-Fadd Death Domain Complex Structure Unravels Signalling by Receptor Clustering. Nature 2009, 457, 1019–1022. [Google Scholar] [CrossRef] [Green Version]
  252. Chandler, J.M.; Cohen, G.M.; MacFarlane, M. Different Subcellular Distribution of Caspase-3 and Caspase-7 Following Fas-Induced Apoptosis in Mouse Liver. J. Biol. Chem. 1998, 273, 10815–10818. [Google Scholar] [CrossRef] [PubMed] [Green Version]
  253. Lee, J.; Pappalardo, Z.; Chopra, D.G.; Hennings, T.G.; Vaughn, I.; Lan, C.; Choe, J.J.; Ang, K.; Chen, S.; Arkin, M.; et al. A Genetic Interaction Map of Insulin Production Identifies Mfi as an Inhibitor of Mitochondrial Fission. Endocrinology 2018, 159, 3321–3330. [Google Scholar] [CrossRef] [PubMed]
  254. Rodriguez, C.; Pozo, M.; Nieto, E.; Fernandez, M.; Alemany, S. Traf6 and Src Kinase Activity Regulates Cot Activation by Il-1. Cell. Signal. 2006, 18, 1376–1385. [Google Scholar] [CrossRef] [PubMed]
  255. Lang, V.; Symons, A.; Watton, S.J.; Janzen, J.; Soneji, Y.; Beinke, S.; Howell, S.; Ley, S.C. Abin-2 Forms a Ternary Complex with Tpl-2 and Nf-Kappa B1 P105 and Is Essential for Tpl-2 Protein Stability. Mol. Cell. Biol. 2004, 24, 5235–5248. [Google Scholar] [CrossRef] [Green Version]
  256. Stack, J.; Doyle, S.L.; Connolly, D.J.; Reinert, L.S.; O’Keeffe, K.M.; McLoughlin, R.M.; Paludan, S.R.; Bowie, A.G. Tram Is Required for Tlr2 Endosomal Signaling to Type I Ifn Induction. J. Immunol. 2014, 193, 6090–6102. [Google Scholar] [CrossRef] [Green Version]
  257. McGettrick, A.F.; Brint, E.K.; Palsson-McDermott, E.M.; Rowe, D.C.; Golenbock, D.T.; Gay, N.J.; Fitzgerald, K.A.; O’Neill, L.A. Trif-Related Adapter Molecule Is Phosphorylated by Pkc{Epsilon} During Toll-Like Receptor 4 Signaling. Proc. Natl. Acad. Sci. USA 2006, 103, 9196–9201. [Google Scholar] [CrossRef] [Green Version]
  258. Waterfield, M.R.; Zhang, M.; Norman, L.P.; Sun, S.-C. Nf-Κb1/P105 Regulates Lipopolysaccharide-Stimulated Map Kinase Signaling by Governing the Stability and Function of the Tpl2 Kinase. Mol. Cell 2003, 11, 685–694. [Google Scholar] [CrossRef]
  259. Jager, J.; Gremeaux, T.; Gonzalez, T.; Bonnafous, S.; Debard, C.; Laville, M.; Vidal, H.; Tran, A.; Gual, P.; le Marchand-Brustel, Y.; et al. Tpl2 Kinase Is Upregulated in Adipose Tissue in Obesity and May Mediate Interleukin-1beta and Tumor Necrosis Factor-{Alpha} Effects on Extracellular Signal-Regulated Kinase Activation and Lipolysis. Diabetes 2010, 59, 61–70. [Google Scholar] [CrossRef] [Green Version]
  260. Nishizawa, M.; Nagata, S. Regulatory Elements Responsible for Inducible Expression of the Granulocyte Colony-Stimulating Factor Gene in Macrophages. Mol. Cell. Biol. 1990, 10, 2002–2011. [Google Scholar]
  261. Quehenberger, P.; Bierhaus, A.; Fasching, P.; Muellner, C.; Klevesath, M.; Hong, M.; Stier, G.; Sattler, M.; Schleicher, E.; Speiser, W.; et al. Endothelin 1 Transcription Is Controlled by Nuclear Factor-Kappab in Age-Stimulated Cultured Endothelial Cells. Diabetes 2000, 49, 1561–1570. [Google Scholar] [CrossRef] [Green Version]
  262. Vogler, M. Bcl2a1: The Underdog in the Bcl2 Family. Cell Death Differ. 2012, 19, 67–74. [Google Scholar] [CrossRef] [PubMed] [Green Version]
  263. Zong, W.X.; Edelstein, L.C.; Chen, C.; Bash, J.; Gelinas, C. The Prosurvival Bcl-2 Homolog Bfl-1/A1 Is a Direct Transcriptional Target of Nf-Kappab That Blocks Tnfalpha-Induced Apoptosis. Genes Dev. 1999, 13, 382–387. [Google Scholar] [CrossRef] [PubMed]
  264. Stange, K.; Thieme, T.; Hertel, K.; Kuhfahl, S.; Janecke, A.R.; Piza-Katzer, H.; Penttinen, M.; Hietala, M.; Dathe, K.; Mundlos, S.; et al. Molecular Analysis of Two Novel Missense Mutations in the Gdf5 Proregion That Reduce Protein Activity and Are Associated with Brachydactyly Type C. J. Mol. Biol. 2014, 426, 3221–3231. [Google Scholar] [CrossRef] [PubMed] [Green Version]
Figure 1. KEGG-pathway analysis of differentially expressed genes (DEGs) in human cortical spheroids stimulated with the pro-inflammatory cytokines TNFα or IL-1β for 4 h, 12 h, or 36 h. (A) In each case, the top-4 KEGG pathways (based on false discovery rate (FDR)--corrected p-value) are shown. On the basis of this pathway analysis and an FDR p-value cut-off of 10−11, we selected the three most frequent (core) KEGG pathways for further analysis, namely “Cytokine-cytokine receptor interaction” (Cyto; ko04060), “TNF signaling pathway” (TNF; ko04668) and “NF-kappa B signaling pathway” (NFκB; ko04065). (B) Degrees of overlap between the DEGs from the three selected core KEGG pathways.
Biomedicines 10 01025 g001
Figure 2. Molecular landscapes of the proteins encoded by the differentially expressed genes (DEGs) from the three core KEGG pathways (“Cytokine-cytokine receptor signaling”, “TNF signaling” and “NFκB signaling”) following TNFα stimulation of human cortical spheroids for (A) 4 h, (B) 12 h and (C) 36 h. Protein functions and interactions were deduced based on information obtained from UniprotKB (https://www.uniprot.org/; accessed on 1 January 2022) and Genecards (https://www.genecards.org; accessed on 15 January 2022). A detailed description of the protein-protein interactions occurring in these molecular landscapes can be found in Supplementary Information S5. Rectangularly framed protein: membrane-bound receptor; protein in green or red (rounded) rectangle frame: encoded by an up- or downregulated DEG, respectively; protein in dark-gray-filled (rounded) rectangle: encoded by a core KEGG pathway DEG; protein in light-gray-filled (rounded) rectangle: encoded by a DEG not in the core KEGG pathways; protein in white-filled (rounded) rectangle: not encoded by a DEG. Black arrows: stimulation or induction; inhibition arcs: inhibition; dotted arrows: translocation; fading arrow: enzymatic conversion; cl: cleavage.
Biomedicines 10 01025 g002aBiomedicines 10 01025 g002b
Figure 3. Molecular landscapes of the proteins encoded by the differentially expressed genes (DEGs) from the three core KEGG pathways (“Cytokine-cytokine receptor signaling”, “TNF signaling” and “NFκB signaling”) following IL-1β stimulation of human cortical spheroids for (A) 4 h, (B) 12 h and (C) 36 h. Protein functions and interactions were deduced based on information obtained from UniprotKB (https://www.uniprot.org/; accessed on 1 January 2022) and Genecards (https://www.genecards.org; accessed on 15 January 2022). A detailed description of the protein-protein interactions occurring in these molecular landscapes can be found in Supplementary Information S6. Rectangularly framed protein: membrane-bound receptor; protein in green or red (rounded) rectangle frame: encoded by an up- or downregulated DEG, respectively; protein in dark-gray-filled (rounded) rectangle: encoded by a core KEGG pathway DEG; protein in light-gray-filled (rounded) rectangle: encoded by a DEG not in the core KEGG pathways; protein in white-filled (rounded) rectangle: not encoded by a DEG. Black arrows: stimulation or induction; inhibition arcs: inhibition; dotted arrows: translocation; fading arrows: enzymatic conversion; cl: cleavage.
Biomedicines 10 01025 g003aBiomedicines 10 01025 g003b
Figure 4. Cluster analysis of the expression profiles of the differentially expressed genes (DEGs) following (A) TNFα stimulation and (B) IL-1β stimulation of human cortical spheroids (hCSs) for 4 h, 12 h and 36 h. The 1076 DEGs overlapping between the TNFα- and IL-1β-modulated hCS DEG lists of the three stimulation time points were analysed.
Biomedicines 10 01025 g004
Figure 5. Gene expression profiles of (A) Toll-like receptor (TLR) subtypes, (B) Chemokines, cytokines and interleukins, and (C) Hemoglobins that are uniquely differentially expressed in human cortical spheroids following stimulation with either TNFα or IL-1β for 4 h, 12 h and 36 h.
Biomedicines 10 01025 g005
Figure 6. Differentially expressed genes (DEGs) in human cortical spheroids (hCSs) stimulated with TNFα or IL-1β are mainly expressed in endothelial cells, microglia and astrocytes. (A,B) Percentage of overlap between DEGs in hCSs stimulated for 4 h, 12 h and 36 h with (A) TNFα or (B) IL-1β and cell-type marker genes derived from [25], based on a cut-off of >10-fold expression difference with the other cell types; percentage of overlap was averaged over marker genes from five human brain regions. (CF) Percentage of overlap between DEGs in hCSs stimulated for 4 h, 12 h and 36 h with TNFα or IL-1β and (C) DEGs in a human fetal microglia cell line (HMC3) or a human adult oligodendroglioma cell line (HOG) stimulated with pro-inflammatory factors (LPS for 24 h and subsequently TNFα and IL-1β for 24 h (LPS + T + I)), (D) cell-type marker genes for Alzheimer’s disease (AD), Parkinson’s disease (PD) and multiple sclerosis (MS) (cell-type marker genes derived from [26]), (E) genes associated with AD, PD and MS as derived from the Nanostring project, (F) NFκB-, neuroinflammation- and inflammation-associated genes as derived from the Nanostring project. (G) Percentage of overlap between DEGs in TNFα- or IL-1β-stimulated hCSs that are cell-type marker genes (derived from [25]), and neuroinflammation-associated genes, (H) inflammation-associated genes, or (I) NFκB-associated genes derived from the Nanostring project. MG: microglia; AST: astrocyte; ENDO: endothelial cell; OPC: oligodendrocyte precursor cell; NPC: neural progenitor cell; IN: inhibitory neuron; EXC: excitatory neuron; UNL: other, unlabeled cell types.
Biomedicines 10 01025 g006
Publisher’s Note: MDPI stays neutral with regard to jurisdictional claims in published maps and institutional affiliations.

