
Morbid Obesity in Women Is Associated with an Altered Intestinal Expression of Genes Related to Cancer Risk and Immune, Defensive, and Antimicrobial Response

 , ,
, ,
Abstract
:1. Introduction
2. Material and Methods
2.1. Subjects
2.2. Analytical Procedures
2.3. Duodenal Samples
2.4. Microarray Procedure
2.5. Microarray Data Analysis
2.6. Functional Enrichment
2.7. Technical Validation of Microarray Data by Real-Time–Quantitative PCR (RT–qPCR)
2.8. Statistical Methods
3. Results
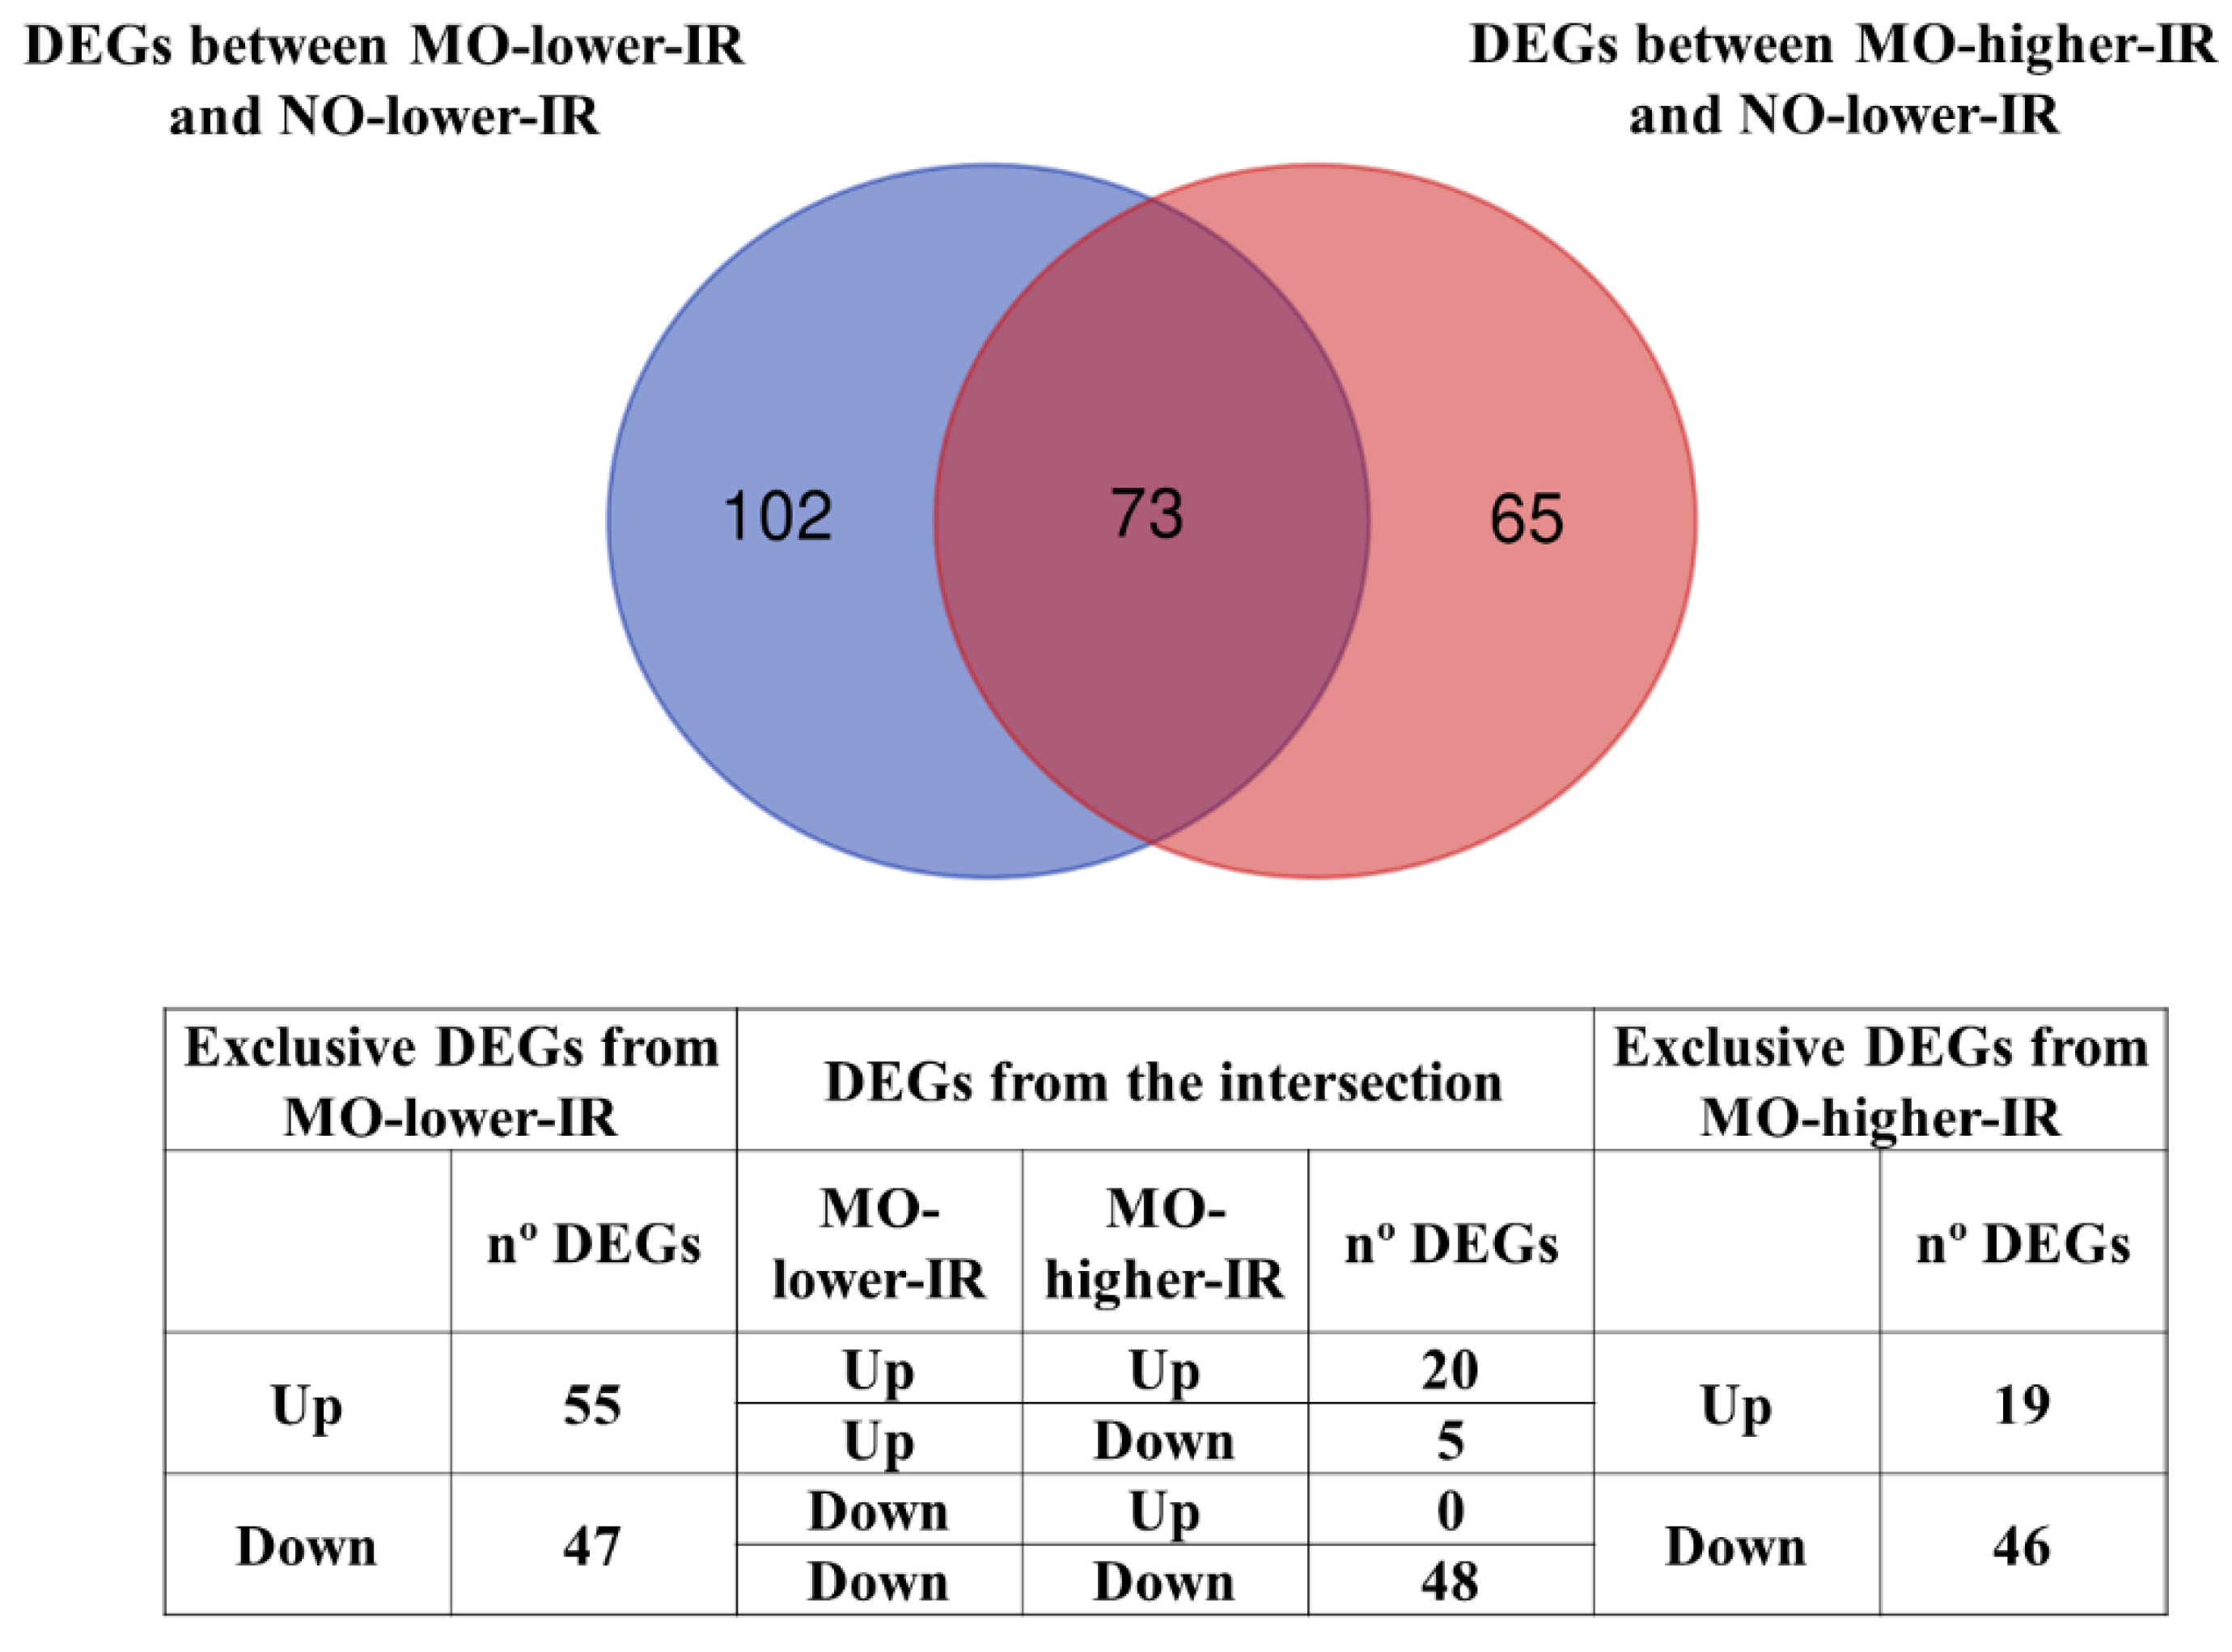
3.1. Differentially Expressed Genes (DEGs) in the Microarray Hybridizations
3.2. Functional Enrichment
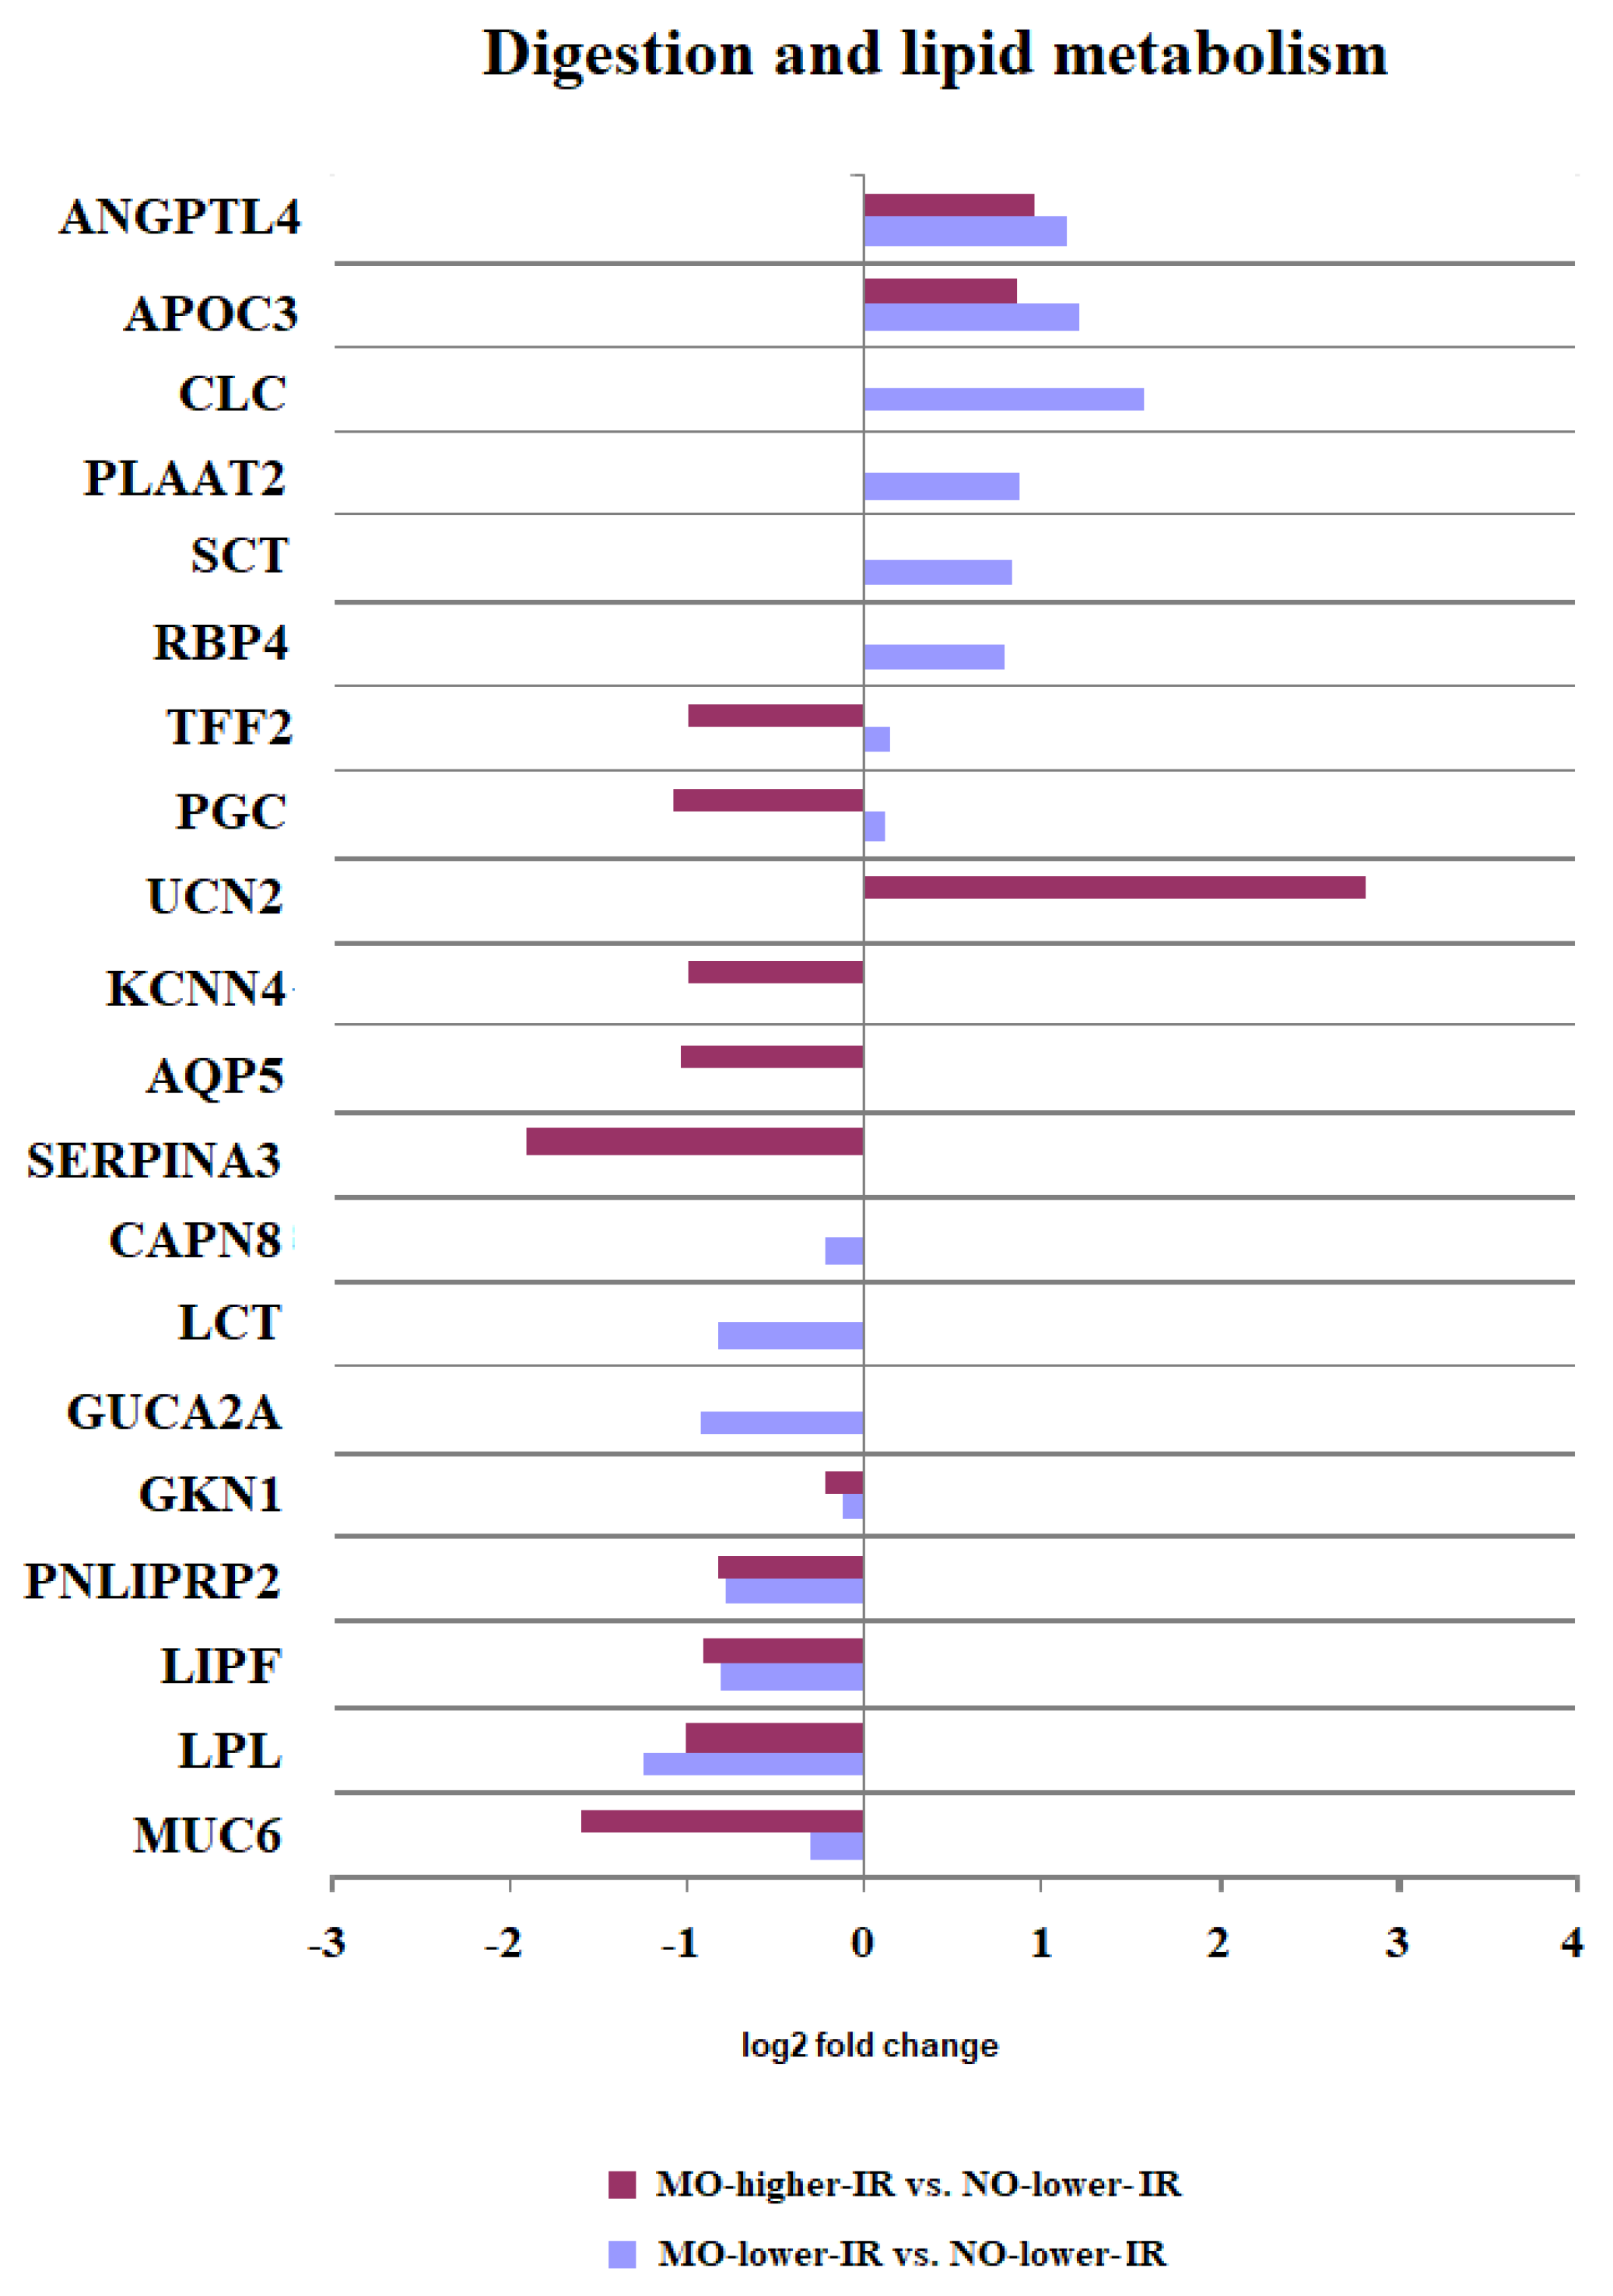
3.2.1. Digestion and Lipid Metabolism
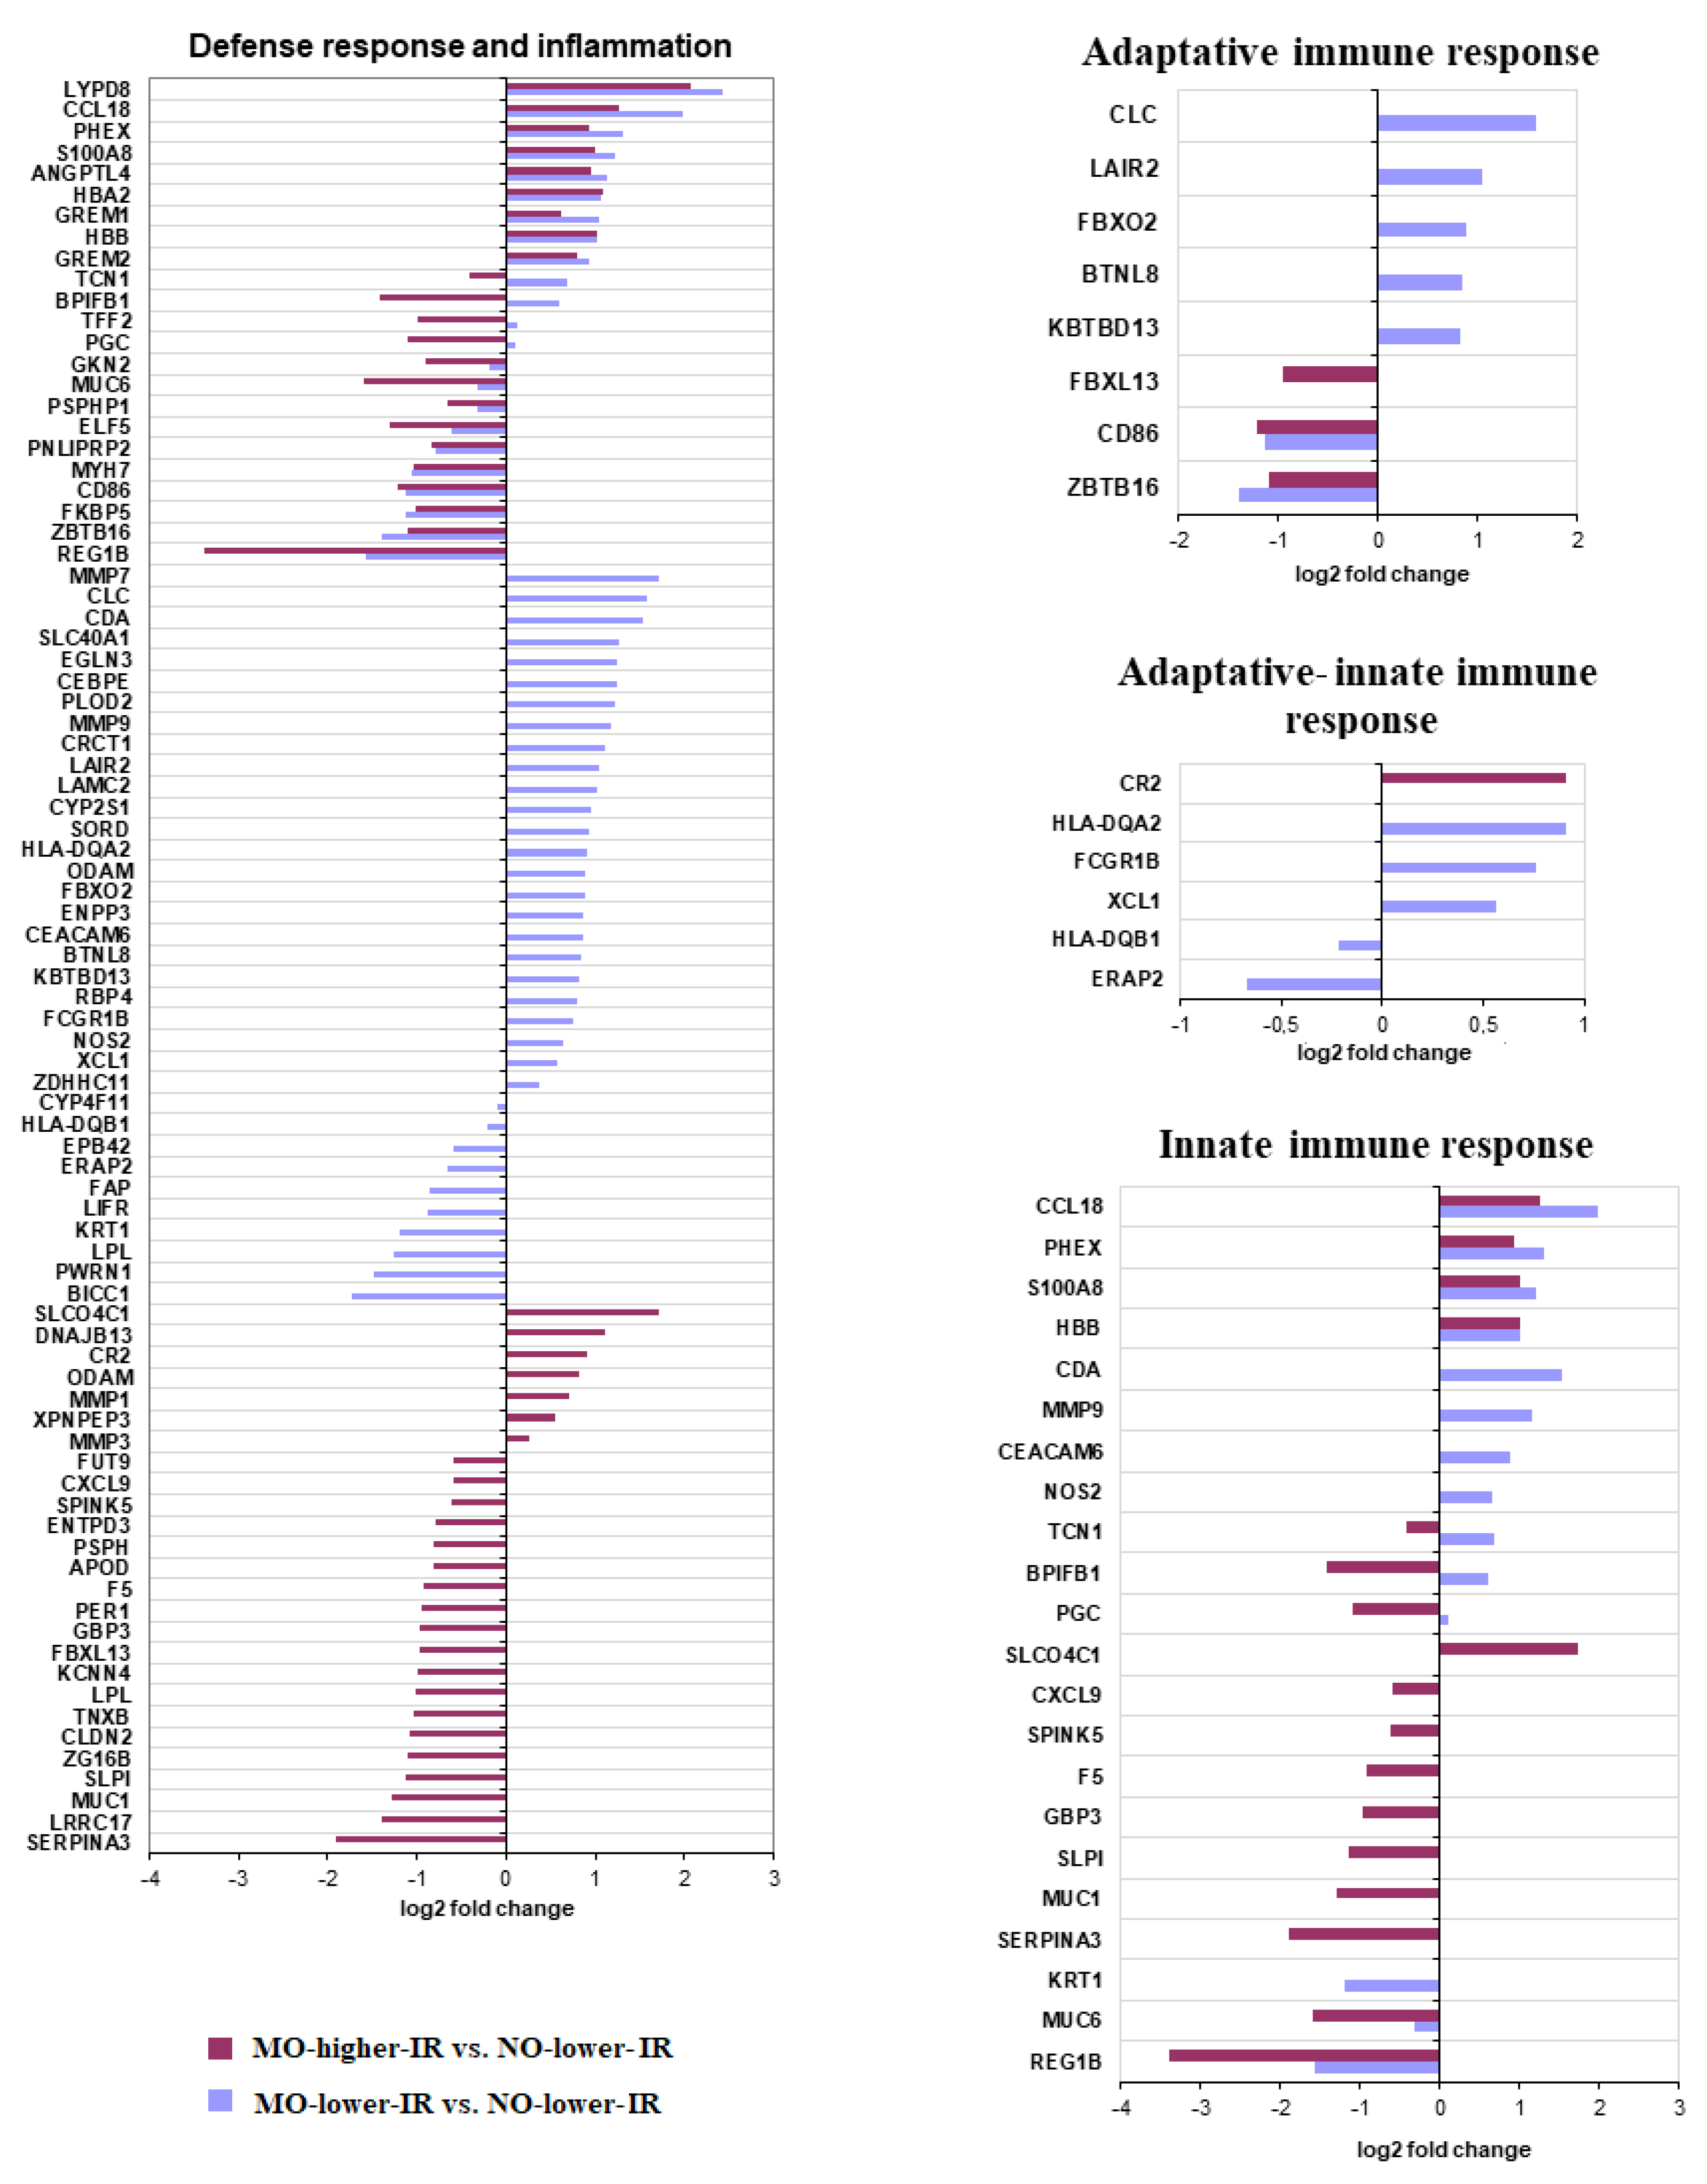
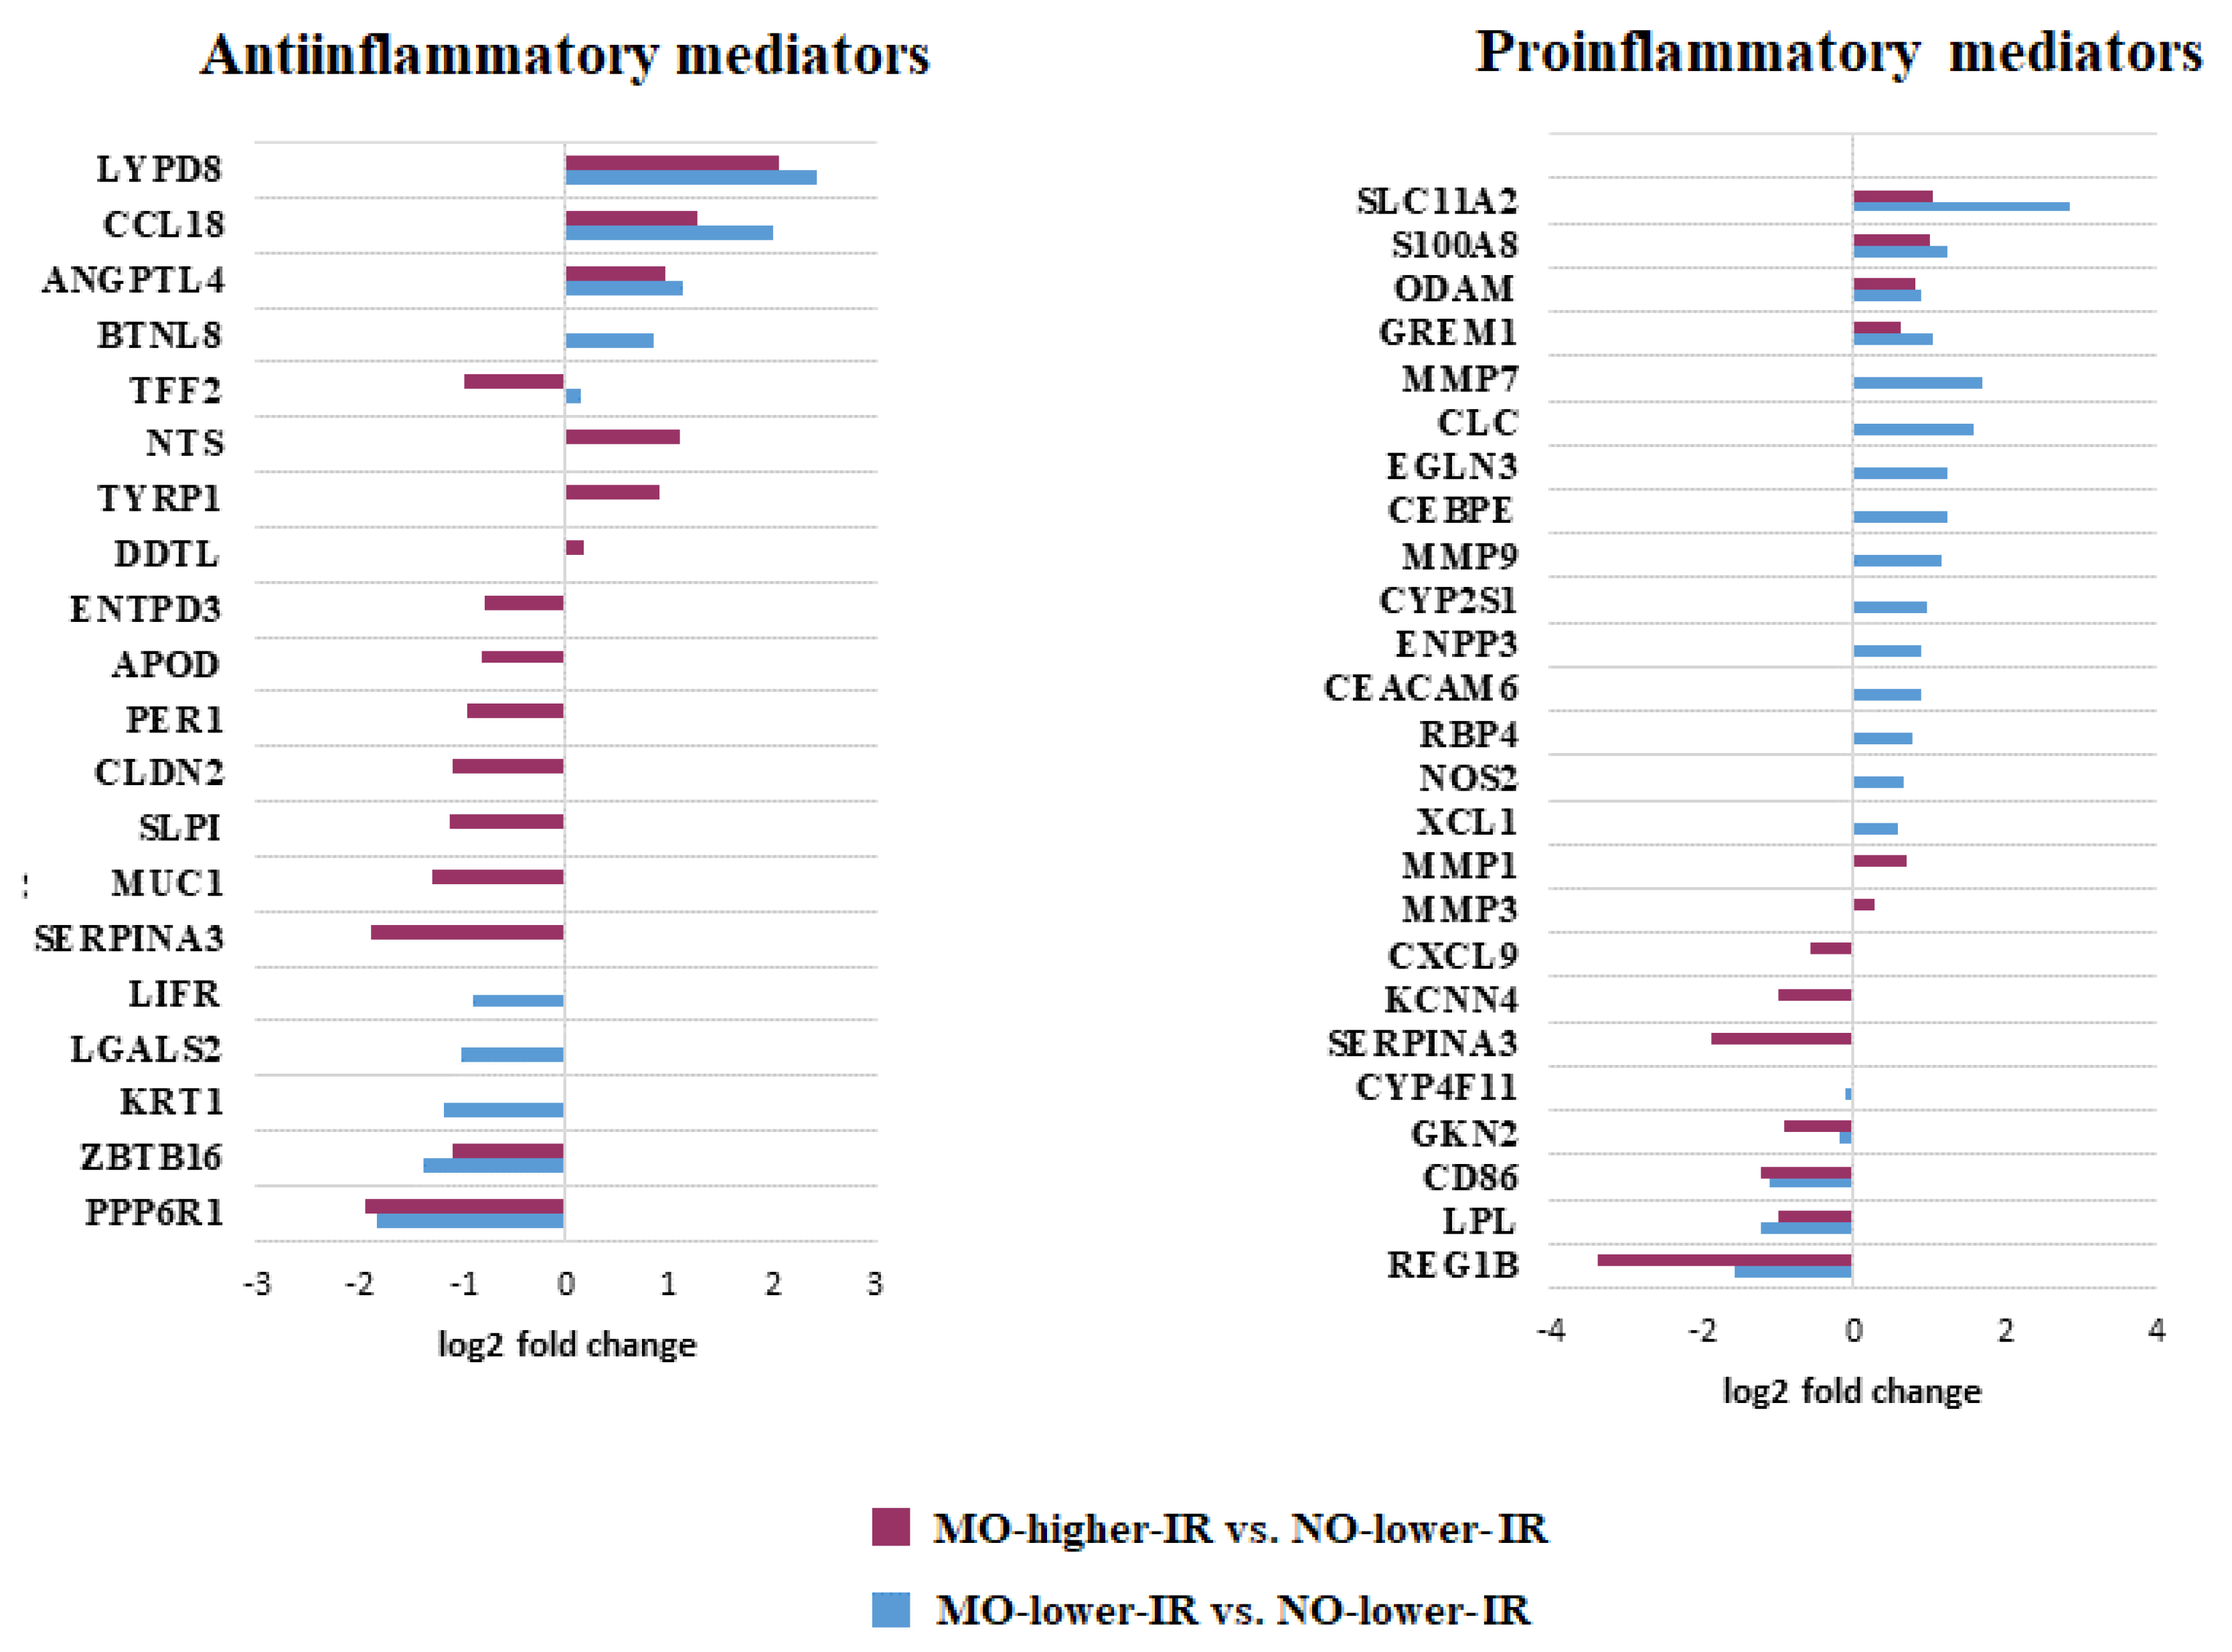
3.2.2. Defense Response and Inflammatory Processes
3.2.3. Hypoxia
3.2.4. Epithelial Maintenance, Wound Healing, and Homeostasis
3.2.5. Cancer
4. Discussion
5. Conclusions
Supplementary Materials
Author Contributions
Funding
Institutional Review Board Statement
Informed Consent Statement
Data Availability Statement
Conflicts of Interest
References
- Saklayen, M.G. The Global Epidemic of the Metabolic Syndrome. Curr. Hypertens. Rep. 2018, 20, 12. [Google Scholar] [CrossRef] [PubMed] [Green Version]
- Samson, S.L.; Garber, A.J. Metabolic syndrome. Endocrinol. Metab. Clin. N. Am. 2014, 43, 1–23. [Google Scholar] [CrossRef] [PubMed]
- González-Muniesa, P.; Mártinez-González, M.A.; Hu, F.B.; Després, J.P.; Matsuzawa, Y.; Loos, R.J.F.; Moreno, L.A.; Bray, G.A.; Martinez, J.A. Obesity. Nat. Rev. Dis. Primers 2017, 3, 17034. [Google Scholar] [CrossRef] [PubMed]
- Emerenziani, S.; Guarino, M.P.L.; Trillo Asensio, L.M.; Altomare, A.; Ribolsi, M.; Balestrieri, P.; Cicala, M. Role of Overweight and Obesity in Gastrointestinal Disease. Nutrients 2019, 12, 111. [Google Scholar] [CrossRef] [PubMed] [Green Version]
- Agustí, A.; García-Pardo, M.P.; López-Almela, I.; Campillo, I.; Maes, M.; Romaní-Pérez, M.; Sanz, Y. Interplay Between the Gut-Brain Axis, Obesity and Cognitive Function. Front. Neurosci. 2018, 12, 155. [Google Scholar] [CrossRef]
- Tran, C.D.; Grice, D.M.; Wade, B.; Kerr, C.A.; Bauer, D.C.; Li, D.; Hannan, G.N. Gut permeability, its interaction with gut microflora and effects on metabolic health are mediated by the lymphatics system, liver and bile acid. Future Microbiol. 2015, 10, 1339–1353. [Google Scholar] [CrossRef] [PubMed] [Green Version]
- Petersen, M.C.; Shulman, G.I. Mechanisms of Insulin Action and Insulin Resistance. Physiol. Rev. 2018, 98, 2133–2223. [Google Scholar] [CrossRef] [Green Version]
- Nguyen, N.T.; Varela, J.E. Bariatric surgery for obesity and metabolic disorders: State of the art. Nat. Rev. Gastroenterol. Hepatol. 2017, 14, 160–169. [Google Scholar] [CrossRef] [PubMed]
- Evans, J.M.; Morris, L.S.; Marchesi, J.R. The gut microbiome: The role of a virtual organ in the endocrinology of the host. J. Endocrinol. 2013, 218, R37–R47. [Google Scholar] [CrossRef] [PubMed] [Green Version]
- Bauer, P.V.; Hamr, S.C.; Duca, F.A. Regulation of energy balance by a gut-brain axis and involvement of the gut microbiota. Cell Mol. Life Sci. 2016, 73, 737–755. [Google Scholar] [CrossRef] [PubMed]
- Mucunguzi, O.; Melouane, A.; Ghanemi, A.; Yoshioka, M.; Boivin, A.; Calvo, E.L.; St-Amand, J. Identification of the principal transcriptional regulators for low-fat and high-fat meal responsive genes in small intestine. Nutr. Metab. 2017, 14, 66. [Google Scholar] [CrossRef] [PubMed] [Green Version]
- Primeaux, S.D.; Braymer, H.D.; Bray, G.A. High fat diet differentially regulates the expression of olfactory receptors in the duodenum of obesity-prone and obesity-resistant rats. Dig. Dis. Sci. 2013, 58, 72–76. [Google Scholar] [CrossRef] [PubMed] [Green Version]
- de Wit, N.J.; Bosch-Vermeulen, H.; de Groot, P.J.; Hooiveld, G.J.; Bromhaar, M.M.; Jansen, J.; Müller, M.; van der Meer, R. The role of the small intestine in the development of dietary fat-induced obesity and insulin resistance in C57BL/6J mice. BMC Med. Genom. 2008, 1, 14. [Google Scholar] [CrossRef] [PubMed]
- Yoshioka, M.; Bolduc, C.; Raymond, V.; St-Amand, J. High-fat meal-induced changes in the duodenum mucosa transcriptome. Obesity 2008, 16, 2302–2307. [Google Scholar] [CrossRef] [PubMed]
- Ho-Plagaro, A.; Santiago-Fernandez, C.; García-Serrano, S.; Rodriguez, C.; Garrido-Sanchez, L.; Escamilla, A.; Gonzalo, M.; Montiel-Casado, C.; Alcaín-Martínez, G.; Garcia-Muñoz, B.; et al. A lower duodenal immune response is associated with an increase of insulin resistance in patients with morbid obesity. Int. J. Obes. 2020, 44, 340–352. [Google Scholar] [CrossRef] [PubMed]
- Ho-Plagaro, A.; Santiago-Fernandez, C.; Rodríguez-Díaz, C.; Lopez-Gómez, C.; Garcia-Serrano, S.; Rodríguez-Pacheco, F.; Valdes, S.; Rodríguez-Cañete, A.; Alcaín-Martínez, G.; Ruiz-Santana, N.; et al. Different Expression of Duodenal Genes Related to Insulin Resistance Between Nonobese Women and Those with Severe Obesity. Obesity 2020, 28, 1708–1717. [Google Scholar] [CrossRef] [PubMed]
- García-Fuentes, E.; García-Almeida, J.M.; García-Arnés, J.; Rivas-Marín, J.; Gallego-Perales, J.L.; González-Jiménez, B.; Cardona, I.; García-Serrano, S.; Garriga, M.J.; Gonzalo, M.; et al. Morbidly obese individuals with impaired fasting glucose have a specific pattern of insulin secretion and sensitivity: Effect of weight loss after bariatric surgery. Obes. Surg. 2006, 16, 1179–1188. [Google Scholar] [CrossRef] [PubMed]
- Rojo-Martínez, G.; Esteva, I.; de Adana, S.R.; Catalá, M.; Merelo, M.J.; Tinahones, F.; Gómez-Zumaquero, J.M.; Cuesta, A.L.; Cardona, F.; Soriguer, F. Patterns of insulin resistance in the general population of southeast Spain. Diabetes Res. Clin. Pract. 2004, 65, 247–256. [Google Scholar] [CrossRef] [PubMed]
- Subramanian, A.; Tamayo, P.; Mootha, V.K.; Mukherjee, S.; Ebert, B.L.; Gillette, M.A.; Paulovich, A.; Pomeroy, S.L.; Golub, T.R.; Lander, E.S.; et al. Gene set enrichment analysis: A knowledge-based approach for interpreting genome-wide expression profiles. Proc. Natl. Acad. Sci. USA 2005, 102, 15545–15550. [Google Scholar] [CrossRef] [Green Version]
- Mootha, V.K.; Lindgren, C.M.; Eriksson, K.F.; Subramanian, A.; Sihag, S.; Lehar, J.; Puigserver, P.; Carlsson, E.; Ridderstråle, M.; Laurila, E.; et al. PGC-1alpha-responsive genes involved in oxidative phosphorylation are coordinately downregulated in human diabetes. Nat. Genet. 2003, 34, 267–273. [Google Scholar] [CrossRef] [PubMed]
- Lee, M.L.T. Analysis of Microarray Gene Expression Data; Kluwer Academic Publishers: New York, NY, USA, 2004; ISBN 0-7923-7087-2. Available online: https://brac.umd.edu/sample-size-and-power-calculations-microarray-studies.html (accessed on 20 April 2022).
- Tsai, C.A.; Wang, S.J.; Chen, D.T.; Chen, J.J. Sample size for gene expression microarray experiments. Bioinformatics 2005, 21, 1502–1508. [Google Scholar] [CrossRef] [PubMed] [Green Version]
- Schraufstatter, I.U.; Zhao, M.; Khaldoyanidi, S.K.; Discipio, R.G. The chemokine CCL18 causes maturation of cultured monocytes to macrophages in the M2 spectrum. Immunology 2012, 135, 287–298. [Google Scholar] [CrossRef] [PubMed] [Green Version]
- Fujita, Y.; Khateb, A.; Li, Y.; Tinoco, R.; Zhang, T.; Bar-Yoseph, H.; Tam, M.A.; Chowers, Y.; Sabo, E.; Gerassy-Vainberg, S.; et al. Regulation of S100A8 Stability by RNF5 in Intestinal Epithelial Cells Determines Intestinal Inflammation and Severity of Colitis. Cell Rep. 2018, 24, 3296–3311.e6. [Google Scholar] [CrossRef] [PubMed] [Green Version]
- Bealer, J.F.; Colgin, M. S100A8/A9: A potential new diagnostic aid for acute appendicitis. Acad. Emerg. Med. 2010, 17, 333–336. [Google Scholar] [CrossRef] [PubMed]
- Kovalovsky, D.; Uche, O.U.; Eladad, S.; Hobbs, R.M.; Yi, W.; Alonzo, E.; Chua, K.; Eidson, M.; Kim, H.J.; Im, J.S.; et al. The BTB-zinc finger transcriptional regulator PLZF controls the development of invariant natural killer T cell effector functions. Nat. Immunol. 2008, 9, 1055–1064. [Google Scholar] [CrossRef]
- Van Coillie, S.; Wiernicki, B.; Xu, J. Molecular and Cellular Functions of CTLA-4. Adv. Exp. Med. Biol. 2020, 1248, 7–32. [Google Scholar] [CrossRef] [PubMed]
- Ohta, T.; Sugiyama, M.; Hemmi, H.; Yamazaki, C.; Okura, S.; Sasaki, I.; Fukuda, Y.; Orimo, T.; Ishii, K.J.; Hoshino, K.; et al. Crucial roles of XCR1-expressing dendritic cells and the XCR1-XCL1 chemokine axis in intestinal immune homeostasis. Sci. Rep. 2016, 6, 23505. [Google Scholar] [CrossRef] [Green Version]
- Furuta, Y.; Tsai, S.H.; Kinoshita, M.; Fujimoto, K.; Okumura, R.; Umemoto, E.; Kurashima, Y.; Kiyono, H.; Kayama, H.; Takeda, K. E-NPP3 controls plasmacytoid dendritic cell numbers in the small intestine. PLoS ONE 2017, 12, e0172509. [Google Scholar] [CrossRef]
- Döhler, C.; Zebisch, M.; Sträter, N. Crystal structure and substrate binding mode of ectonucleotide phosphodiesterase/pyrophosphatase-3 (NPP3). Sci. Rep. 2018, 8, 10874. [Google Scholar] [CrossRef]
- Lumeng, C.N.; Bodzin, J.L.; Saltiel, A.R. Obesity induces a phenotypic switch in adipose tissue macrophage polarization. J. Clin. Investig. 2007, 117, 175–184. [Google Scholar] [CrossRef] [Green Version]
- Calafat, J.; Janssen, H.; Knol, E.F.; Weller, P.F.; Egesten, A. Ultrastructural localization of Charcot-Leyden crystal protein in human eosinophils and basophils. Eur. J. Haematol. 1997, 58, 56–66. [Google Scholar] [CrossRef] [PubMed]
- Shyamsunder, P.; Shanmugasundaram, M.; Mayakonda, A.; Dakle, P.; Teoh, W.W.; Han, L.; Kanojia, D.; Lim, M.C.; Fullwood, M.; An, O.; et al. Identification of a novel enhancer of CEBPE essential for granulocytic differentiation. Blood 2019, 133, 2507–2517. [Google Scholar] [CrossRef] [PubMed]
- Guo, Y.; Wang, A.Y. Novel Immune Check-Point Regulators in Tolerance Maintenance. Front. Immunol. 2015, 6, 421, Erratum in Front. Immunol. 2016, 7, 38. [Google Scholar] [CrossRef] [PubMed] [Green Version]
- Steinhoff, J.S.; Lass, A.; Schupp, M. Biological Functions of RBP4 and Its Relevance for Human Diseases. Front. Physiol. 2021, 12, 659977. [Google Scholar] [CrossRef] [PubMed]
- Heissig, B.; Nishida, C.; Tashiro, Y.; Sato, Y.; Ishihara, M.; Ohki, M.; Gritli, I.; Rosenkvist, J.; Hattori, K. Role of neutrophil-derived matrix metalloproteinase-9 in tissue regeneration. Histol. Histopathol. 2010, 25, 765–770. [Google Scholar] [CrossRef] [PubMed]
- Couture, A.; Garnier, A.; Docagne, F.; Boyer, O.; Vivien, D.; Le-Mauff, B.; Latouche, J.B.; Toutirais, O. HLA-Class II Artificial Antigen Presenting Cells in CD4+ T Cell-Based Immunotherapy. Front. Immunol. 2019, 10, 1081. [Google Scholar] [CrossRef] [PubMed]
- Tokunaga, R.; Zhang, W.; Naseem, M.; Puccini, A.; Berger, M.D.; Soni, S.; McSkane, M.; Baba, H.; Lenz, H.J. CXCL9, CXCL10, CXCL11/CXCR3 axis for immune activation—A target for novel cancer therapy. Cancer Treat. Rev. 2018, 63, 40–47. [Google Scholar] [CrossRef]
- Karczewski, J.; Śledzińska, E.; Baturo, A.; Jończyk, I.; Maleszko, A.; Samborski, P.; Begier-Krasińska, B.; Dobrowolska, A. Obesity and inflammation. Eur. Cytokine Netw. 2018, 29, 83–94. [Google Scholar] [CrossRef] [PubMed]
- Ryckman, C.; Vandal, K.; Rouleau, P.; Talbot, M.; Tessier, P.A. Proinflammatory activities of S100: Proteins S100A8, S100A9, and S100A8/A9 induce neutrophil chemotaxis and adhesion. J. Immunol. 2003, 170, 3233–3242. [Google Scholar] [CrossRef] [PubMed] [Green Version]
- Leach, S.T.; Yang, Z.; Messina, I.; Song, C.; Geczy, C.L.; Cunningham, A.M.; Day, A.S. Serum and mucosal S100 proteins, calprotectin (S100A8/S100A9) and S100A12, are elevated at diagnosis in children with inflammatory bowel disease. Scand. J. Gastroenterol. 2007, 42, 1321–1331. [Google Scholar] [CrossRef] [PubMed]
- Senger, S.; Sapone, A.; Fiorentino, M.R.; Mazzarella, G.; Lauwers, G.Y.; Fasano, A. Celiac Disease Histopathology Recapitulates Hedgehog Downregulation, Consistent with Wound Healing Processes Activation. PLoS ONE 2015, 10, e0144634. [Google Scholar] [CrossRef] [Green Version]
- Allavena, P.; Garlanda, C.; Borrello, M.G.; Sica, A.; Mantovani, A. Pathways connecting inflammation and cancer. Curr. Opin. Genet. Dev. 2008, 18, 3–10. [Google Scholar] [CrossRef] [PubMed]
- Vuckovic, S.; Florin, T.H.; Khalil, D.; Zhang, M.F.; Patel, K.; Hamilton, I.; Hart, D.N. CD40 and CD86 upregulation with divergent CMRF44 expression on blood dendritic cells in inflammatory bowel diseases. Am. J. Gastroenterol. 2001, 96, 2946–2956. [Google Scholar] [CrossRef] [PubMed]
- Rogler, G.; Hausmann, M.; Spöttl, T.; Vogl, D.; Aschenbrenner, E.; Andus, T.; Falk, W.; Schölmerich, J.; Gross, V. T-cell co-stimulatory molecules are upregulated on intestinal macrophages from inflammatory bowel disease mucosa. Eur. J. Gastroenterol. Hepatol. 1999, 11, 1105–1111. [Google Scholar] [CrossRef] [PubMed]
- Sirisinha, S. Insight into the mechanisms regulating immune homeostasis in health and disease. Asian Pac. J. Allergy Immunol. 2011, 29, 1–14. [Google Scholar] [PubMed]
- Basu, D.; Goldberg, I.J. Regulation of lipoprotein lipase-mediated lipolysis of triglycerides. Curr. Opin. Lipidol. 2020, 31, 154–160. [Google Scholar] [CrossRef]
- Gaudet, D.; Brisson, D.; Tremblay, K.; Alexander, V.J.; Singleton, W.; Hughes, S.G.; Geary, R.S.; Baker, B.F.; Graham, M.J.; Crooke, R.M.; et al. Targeting APOC3 in the familial chylomicronemia syndrome. N. Engl. J. Med. 2014, 371, 2200–2206. [Google Scholar] [CrossRef] [PubMed]
- Wang, H.; Eckel, R.H. Lipoprotein lipase: From gene to obesity. Am. J. Physiol. Endocrinol. Metab. 2009, 297, E271–E288. [Google Scholar] [CrossRef] [PubMed] [Green Version]
- Li, N.; Fu, J.; Koonen, D.P.; Kuivenhoven, J.A.; Snieder, H.; Hofker, M.H. Are hypertriglyceridemia and low HDL causal factors in the development of insulin resistance? Atherosclerosis 2014, 233, 130–138. [Google Scholar] [CrossRef] [PubMed]
- Saad, M.J.; Santos, A.; Prada, P.O. Linking Gut Microbiota and Inflammation to Obesity and Insulin Resistance. Physiology 2016, 31, 283–293. [Google Scholar] [CrossRef] [PubMed]
- Xu, W.; Schlagwein, N.; Roos, A.; van den Berg, T.K.; Daha, M.R.; van Kooten, C. Human peritoneal macrophages show functional characteristics of M-CSF-driven anti-inflammatory type 2 macrophages. Eur. J. Immunol. 2007, 37, 1594–1599. [Google Scholar] [CrossRef] [PubMed]
- Okumura, R.; Kodama, T.; Hsu, C.C.; Sahlgren, B.H.; Hamano, S.; Kurakawa, T.; Iida, T.; Takeda, K. Lypd8 inhibits attachment of pathogenic bacteria to colonic epithelia. Mucosal. Immunol. 2020, 13, 75–85. [Google Scholar] [CrossRef] [PubMed]
- van Beelen Granlund, A.; Østvik, A.E.; Brenna, Ø.; Torp, S.H.; Gustafsson, B.I.; Sandvik, A.K. REG gene expression in inflamed and healthy colon mucosa explored by in situ hybridisation. Cell Tissue Res. 2013, 352, 639–646. [Google Scholar] [CrossRef] [Green Version]
- Sias, B.; Ferrato, F.; Pellicer-Rubio, M.T.; Forgerit, Y.; Guillouet, P.; Leboeuf, B.; Carrière, F. Cloning and seasonal secretion of the pancreatic lipase-related protein 2 present in goat seminal plasma. Biochim. Biophys. Acta 2005, 1686, 169–180. [Google Scholar] [CrossRef] [PubMed]
- Alves, B.N.; Leong, J.; Tamang, D.L.; Elliott, V.; Edelnant, J.; Redelman, D.; Singer, C.A.; Kuhn, A.R.; Miller, R.; Lowe, M.E.; et al. Pancreatic lipase-related protein 2 (PLRP2) induction by IL-4 in cytotoxic T lymphocytes (CTLs) and reevaluation of the negative effects of its gene ablation on cytotoxicity. J. Leukoc. Biol. 2009, 86, 701–712. [Google Scholar] [CrossRef] [PubMed] [Green Version]
- Gilleron, M.; Lepore, M.; Layre, E.; Cala-De Paepe, D.; Mebarek, N.; Shayman, J.A.; Canaan, S.; Mori, L.; Carrière, F.; Puzo, G.; et al. Lysosomal Lipases PLRP2 and LPLA2 Process Mycobacterial Multi-acylated Lipids and Generate T Cell Stimulatory Antigens. Cell Chem. Biol. 2016, 23, 1147–1156. [Google Scholar] [CrossRef] [PubMed] [Green Version]
- López-Fandiño, R. Role of dietary lipids in food allergy. Crit. Rev. Food Sci. Nutr. 2020, 60, 1797–1814. [Google Scholar] [CrossRef] [PubMed]
- Broch, M.; Ramírez, R.; Auguet, M.T.; Alcaide, M.J.; Aguilar, C.; Garcia-España, A.; Richart, C. Macrophages are novel sites of expression and regulation of retinol binding protein-4 (RBP4). Physiol. Res. 2010, 59, 299–303. [Google Scholar] [CrossRef] [PubMed]
- Moraes-Vieira, P.M.; Castoldi, A.; Aryal, P.; Wellenstein, K.; Peroni, O.D.; Kahn, B.B. Antigen Presentation and T-Cell Activation Are Critical for RBP4-Induced Insulin Resistance. Diabetes 2016, 65, 1317–1327. [Google Scholar] [CrossRef] [Green Version]
- Cullen, J.J.; Mercer, D.; Hinkhouse, M.; Ephgrave, K.S.; Conklin, J.L. Effects of endotoxin on regulation of intestinal smooth muscle nitric oxide synthase and intestinal transit. Surgery 1999, 125, 339–344. [Google Scholar] [CrossRef] [PubMed]
- Xi, L.; Tekin, D.; Gursoy, E.; Salloum, F.; Levasseur, J.E.; Kukreja, R.C. Evidence that NOS2 acts as a trigger and mediator of late preconditioning induced by acute systemic hypoxia. Am. J. Physiol. Heart Circ. Physiol. 2002, 283, H5–H12. [Google Scholar] [CrossRef] [PubMed] [Green Version]
- Lei, Y.; Takahama, Y. XCL1 and XCR1 in the immune system. Microbes Infect. 2012, 14, 262–267. [Google Scholar] [CrossRef] [PubMed]
- Jubin, V.; Ventre, E.; Leverrier, Y.; Djebali, S.; Mayol, K.; Tomkowiak, M.; Mafille, J.; Teixeira, M.; Teoh, D.Y.; Lina, B.; et al. T inflammatory memory CD8 T cells participate to antiviral response and generate secondary memory cells with an advantage in XCL1 production. Immunol. Res. 2012, 52, 284–293. [Google Scholar] [CrossRef] [PubMed]
- Nevins, A.M.; Subramanian, A.; Tapia, J.L.; Delgado, D.P.; Tyler, R.C.; Jensen, D.R.; Ouellette, A.J.; Volkman, B.F. A Requirement for Metamorphic Interconversion in the Antimicrobial Activity of Chemokine XCL1. Biochemistry 2016, 55, 3784–3793. [Google Scholar] [CrossRef] [PubMed]
- Chapoval, A.I.; Smithson, G.; Brunick, L.; Mesri, M.; Boldog, F.L.; Andrew, D.; Khramtsov, N.V.; Feshchenko, E.A.; Starling, G.C.; Mezes, P.S. BTNL8, a butyrophilin-like molecule that costimulates the primary immune response. Mol. Immunol. 2013, 56, 819–828. [Google Scholar] [CrossRef] [PubMed]
- Walmsley, S.R.; Chilvers, E.R.; Thompson, A.A.; Vaughan, K.; Marriott, H.M.; Parker, L.C.; Shaw, G.; Parmar, S.; Schneider, M.; Sabroe, I.; et al. Prolyl hydroxylase 3 (PHD3) is essential for hypoxic regulation of neutrophilic inflammation in humans and mice. J. Clin. Investig. 2011, 121, 1053–1063. [Google Scholar] [CrossRef] [PubMed]
- Taniguchi, C.M.; Finger, E.C.; Krieg, A.J.; Wu, C.; Diep, A.N.; LaGory, E.L.; Wei, K.; McGinnis, L.M.; Yuan, J.; Kuo, C.J.; et al. Cross-talk between hypoxia and insulin signaling through Phd3 regulates hepatic glucose and lipid metabolism and ameliorates diabetes. Nat. Med. 2013, 19, 1325–1330. [Google Scholar] [CrossRef] [Green Version]
- De Re, V.; Simula, M.P.; Caggiari, L.; Orzes, N.; Spina, M.; Da Ponte, A.; De Appollonia, L.; Dolcetti, R.; Canzonieri, V.; Cannizzaro, R. Proteins specifically hyperexpressed in a coeliac disease patient with aberrant T cells. Clin. Exp. Immunol. 2007, 148, 402–409. [Google Scholar] [CrossRef]
- Ishiguro, K.; Watanabe, O.; Nakamura, M.; Yamamura, T.; Ando, T.; Goto, H.; Hirooka, Y. S100G expression and function in fibroblasts on colitis induction. Int. Immunopharmacol. 2016, 39, 92–96. [Google Scholar] [CrossRef] [PubMed]
- Strober, W. Impact of the gut microbiome on mucosal inflammation. Trends Immunol. 2013, 34, 423–430. [Google Scholar] [CrossRef] [Green Version]
- Thomsen, M.K.; Hansen, G.H.; Danielsen, E.M. Galectin-2 at the enterocyte brush border of the small intestine. Mol. Membr. Biol. 2009, 26, 347–355. [Google Scholar] [CrossRef] [PubMed]
- Gonzalez, F.J.; Xie, C.; Jiang, C. The role of hypoxia-inducible factors in metabolic diseases. Nat. Rev. Endocrinol. 2018, 15, 21–32. [Google Scholar] [CrossRef] [PubMed]
- González-Muniesa, P.; de Oliveira, C.; Pérez de Heredia, F.; Thompson, M.P.; Trayhurn, P. Fatty acids and hypoxia stimulate the expression and secretion of the adipokine ANGPTL4 (angiopoietin-like protein 4/ fasting-induced adipose factor) by human adipocytes. J. Nutrigenet. Nutr. 2011, 4, 146–153. [Google Scholar] [CrossRef] [PubMed]
- Yao, Q.; Shin, M.K.; Jun, J.C.; Hernandez, K.L.; Aggarwal, N.R.; Mock, J.R.; Gay, J.; Drager, L.F.; Polotsky, V.Y. Effect of chronic intermittent hypoxia on triglyceride uptake in different tissues. J. Lipid Res. 2013, 54, 1058–1065. [Google Scholar] [CrossRef] [Green Version]
- Shah, Y.M.; Matsubara, T.; Ito, S.; Yim, S.H.; Gonzalez, F.J. Intestinal hypoxia-inducible transcription factors are essential for iron absorption following iron deficiency. Cell Metab. 2009, 9, 152–164. [Google Scholar] [CrossRef] [Green Version]
- Grebhardt, S.; Veltkamp, C.; Ströbel, P.; Mayer, D. Hypoxia and HIF-1 increase S100A8 and S100A9 expression in prostate cancer. Int. J. Cancer. 2012, 131, 2785–2794. [Google Scholar] [CrossRef] [PubMed]
- Grek, C.L.; Newton, D.A.; Spyropoulos, D.D.; Baatz, J.E. Hypoxia up-regulates expression of hemoglobin in alveolar epithelial cells. Am. J. Respir. Cell Mol. Biol. 2011, 44, 439–447. [Google Scholar] [CrossRef]
- Gabryelska, A.; Karuga, F.F.; Szmyd, B.; Białasiewicz, P. HIF-1α as a Mediator of Insulin Resistance, T2DM, and Its Complications: Potential Links With Obstructive Sleep Apnea. Front. Physiol. 2020, 11, 1035. [Google Scholar] [CrossRef]
- Burke, B. The role of matrix metalloproteinase 7 in innate immunity. Immunobiology 2004, 209, 51–56, Erratum in Immunobiology 2005, 209, 755. [Google Scholar] [CrossRef] [PubMed]
- Xu, Y.; Gao, Q.; Xue, Y.; Li, X.; Xu, L.; Li, C.; Qin, Y.; Fang, J. Prolyl hydroxylase 3 stabilizes the p53 tumor suppressor by inhibiting the p53-MDM2 interaction in a hydroxylase-independent manner. J. Biol. Chem. 2019, 294, 9949–9958. [Google Scholar] [CrossRef]
- Beneke, A.; Guentsch, A.; Hillemann, A.; Zieseniss, A.; Swain, L.; Katschinski, D.M. Loss of PHD3 in myeloid cells dampens the inflammatory response and fibrosis after hind-limb ischemia. Cell Death Dis. 2017, 8, e2976. [Google Scholar] [CrossRef] [PubMed] [Green Version]
- Gutiérrez-Repiso, C.; Moreno-Indias, I.; Martín-Núñez, G.M.; Ho-Plágaro, A.; Rodríguez-Cañete, A.; Gonzalo, M.; García-Fuentes, E.; Tinahones, F.J. Mucosa-associated microbiota in the jejunum of patients with morbid obesity: Alterations in states of insulin resistance and metformin treatment. Surg. Obes. Relat. Dis. 2020, 16, 1575–1585. [Google Scholar] [CrossRef] [PubMed]
- Kuhre, R.E.; Bechmann, L.E.; Wewer Albrechtsen, N.J.; Hartmann, B.; Holst, J.J. Glucose stimulates neurotensin secretion from the rat small intestine by mechanisms involving SGLT1 and GLUT2, leading to cell depolarization and calcium influx. Am. J. Physiol. Endocrinol. Metab. 2015, 308, E1123–E1130. [Google Scholar] [CrossRef] [PubMed] [Green Version]
- Moura, L.I.; Silva, L.; Leal, E.C.; Tellechea, A.; Cruz, M.T.; Carvalho, E. Neurotensin modulates the migratory and inflammatory response of macrophages under hyperglycemic conditions. Biomed. Res. Int. 2013, 2013, 941764. [Google Scholar] [CrossRef] [Green Version]
- Avgerinos, K.I.; Spyrou, N.; Mantzoros, C.S.; Dalamaga, M. Obesity and cancer risk: Emerging biological mechanisms and perspectives. Metabolism 2019, 92, 121–135. [Google Scholar] [CrossRef] [PubMed]
- Barsouk, A.; Rawla, P.; Barsouk, A.; Thandra, K.C. Epidemiology of Cancers of the Small Intestine: Trends, Risk Factors, and Prevention. Med. Sci. 2019, 7, 46. [Google Scholar] [CrossRef] [Green Version]
- Pan, S.Y.; Morrison, H. Epidemiology of cancer of the small intestine. World J. Gastrointest. Oncol. 2011, 3, 33–42. [Google Scholar] [CrossRef]
- Kim, S.-H.; Park, Y.-Y.; Kim, S.-W.; Lee, J.-S.; Wang, D.; Dubois, R.N. ANGPTL4 Induction by Prostaglandin E2 under Hypoxic Conditions Promotes Colorectal Cancer Progression. Cancer Res. 2011, 71, 7010–7020. [Google Scholar] [CrossRef] [Green Version]
- Kwon, C.H.; Moon, H.J.; Park, H.J.; Choi, J.H.; Park, D.Y. S100A8 and S100A9 promotes invasion and migration through p38 mitogen-activated protein kinase-dependent NF-κB activation in gastric cancer cells. Mol. Cells 2013, 35, 226–234. [Google Scholar] [CrossRef] [Green Version]
- Dianatpour, A.; Ghafouri-Fard, S. Long Non Coding RNA Expression Intersecting Cancer and Spermatogenesis: A Systematic Review. Asian Pac. J. Cancer Prev. 2017, 18, 2601–2610. [Google Scholar] [CrossRef]
- Hui, A.W.-H.; Lau, H.-W.; Cao, C.Y.; Zhou, J.-W.; Lai, P.B.-S.; Tsui, S.K.-W. Downregulation of PLZF in human hepatocellular carcinoma and its clinical significance. Oncol. Rep. 2014, 33, 397–402. [Google Scholar] [CrossRef] [PubMed] [Green Version]
- Peng, Y.; Luo, G.; Zhou, J.; Wang, X.; Hu, J.; Cui, Y.; Li, X.C.; Tan, J.; Yang, S.; Zhan, R.; et al. CD86 Is an Activation Receptor for NK Cell Cytotoxicity against Tumor Cells. PLoS ONE 2013, 8, e83913. [Google Scholar] [CrossRef] [PubMed]
- Mao, W.; Chen, J.; Peng, T.-L.; Yin, X.-F.; Chen, L.-Z.; Chen, M.-H. Downregulation of gastrokine-1 in gastric cancer tissues and restoration of its expression induced gastric cancer cells to apoptosis. J. Exp. Clin. Cancer Res. 2012, 31, 49. [Google Scholar] [CrossRef] [PubMed] [Green Version]
- Yoon, J.H.; Choi, W.S.; Kim, O.; Choi, B.J.; Nam, S.W.; Lee, J.Y.; Park, W.S. Gastrokine 1 inhibits gastric cancer cell migration and invasion by downregulating RhoA expression. Gastric Cancer 2016, 20, 274–285. [Google Scholar] [CrossRef] [PubMed] [Green Version]
- Menheniott, T.R.; O’Connor, L.; Chionh, Y.T.; Däbritz, J.; Scurr, M.; Rollo, B.N.; Ng, G.; Jacobs, S.; Catubig, A.; Kurklu, B.; et al. Loss of gastrokine-2 drives premalignant gastric inflammation and tumor progression. J. Clin. Investig. 2016, 126, 1383–1400. [Google Scholar] [CrossRef] [PubMed] [Green Version]
- Kong, Y.; Zheng, Y.; Jia, Y.; Li, P.; Wang, Y. Decreased LIPF expression is correlated with DGKA and predicts poor outcome of gastric cancer. Oncol. Rep. 2016, 36, 1852–1860. [Google Scholar] [CrossRef] [Green Version]
- Kim, J.K.; Kim, P.J.; Jung, K.H.; Noh, J.H.; Eun, J.W.; Bae, H.J.; Xie, H.J.; Shan, J.M.; Ping, W.Y.; Park, W.S.; et al. Decreased ex-pression of annexin A10 in gastric cancer and its overexpression in tumor cell growth suppression. Oncol. Rep. 2010, 24, 607–612. [Google Scholar]
- Leir, S.-H.; Harris, A. MUC6 mucin expression inhibits tumor cell invasion. Exp. Cell Res. 2011, 317, 2408–2419. [Google Scholar] [CrossRef]
- Heinrich, M.-C.; Göbel, C.; Kluth, M.; Bernreuther, C.; Sauer, C.; Schroeder, C.; Möller-Koop, C.; Hube-Magg, C.; Lebok, P.; Burandt, E.; et al. PSCA expression is associated with favorable tumor features and reduced PSA recurrence in operated prostate cancer. BMC Cancer 2018, 18, 612. [Google Scholar] [CrossRef] [Green Version]
- Zhao, L.; Guo, H.; Zhou, B.; Feng, J.; Li, Y.; Han, T.; Liu, L.; Li, L.; Zhang, S.; Liu, Y.; et al. Long non-coding RNA SNHG5 suppresses gastric cancer progression by trapping MTA2 in the cytosol. Oncogene 2016, 35, 5770–5780. [Google Scholar] [CrossRef]
- Bergström, S.H.; Järemo, H.; Nilsson, M.; Adamo, H.H.; Bergh, A. Prostate tumors downregulate microseminoprotein-beta (MSMB) in the surrounding benign prostate epithelium and this response is associated with tumor aggressiveness. Prostate 2017, 78, 257–265. [Google Scholar] [CrossRef] [PubMed]
- Dahlman, A.; Rexhepaj, E.; Brennan, D.J.; Gallagher, W.M.; Gaber, A.; Lindgren, A.; Jirström, K.; Bjartell, A. Evaluation of the prognostic significance of MSMB and CRISP3 in prostate cancer using automated image analysis. Mod. Pathol. 2011, 24, 708–719. [Google Scholar] [CrossRef] [Green Version]
- Whitaker, H.C.; Kote-Jarai, Z.; Ross-Adams, H.; Warren, A.Y.; Burge, J.; George, A.; Bancroft, E.; Jhavar, S.; Leongamornlert, D.; Tymrakiewicz, M.; et al. The rs10993994 Risk Allele for Prostate Cancer Results in Clinically Relevant Changes in Microseminoprotein-Beta Expression in Tissue and Urine. PLoS ONE 2010, 5, e13363. [Google Scholar] [CrossRef] [PubMed] [Green Version]
- Han, Y.; Yang, Y.-N.; Yuan, H.-H.; Zhang, T.-T.; Sui, H.; Wei, X.-L.; Liu, L.; Huang, P.; Zhang, W.-J.; Bai, Y.-X. UCA1, a long non-coding RNA up-regulated in colorectal cancer influences cell proliferation, apoptosis and cell cycle distribution. Pathology 2014, 46, 396–401. [Google Scholar] [CrossRef] [PubMed]
- Xia, Y.-J.; Jiang, X.-T.; Jiang, S.-B.; He, X.-J.; Luo, J.-G.; Liu, Z.-C.; Wang, L.; Tao, H.-Q.; Chen, J.-Z. PHD3 affects gastric cancer progression by negatively regulating HIF1A. Mol. Med. Rep. 2017, 16, 6882–6889. [Google Scholar] [CrossRef] [PubMed] [Green Version]
- Yerushalmi, H.F.; Besselsen, D.G.; Ignatenko, N.A.; Blohm-Mangone, K.A.; Padilla-Torres, J.L.; Stringer, D.E.; Cui, H.; Holubec, H.; Payne, C.M.; Gerner, E.W. The role of NO synthases in arginine-dependent small intestinal and colonic carcinogenesis. Mol. Carcinog. 2005, 45, 93–105. [Google Scholar] [CrossRef] [PubMed]
- Ji, Y.; Li, J.; Li, P.; Wang, L.; Yang, H.; Jiang, G. C/EBPβ Promotion of MMP3-Dependent Tumor Cell Invasion and Association with Metastasis in Colorectal Cancer. Genet. Test. Mol. Biomark. 2018, 22, 5–10. [Google Scholar] [CrossRef]
- Hua, Y.; Liang, C.; Zhu, J.; Miao, C.; Yu, Y.; Xu, A.; Zhang, J.; Li, P.; Li, S.; Bao, M.; et al. Expression of lactate dehydrogenase C correlates with poor prognosis in renal cell carcinoma. Tumor Biol. 2017, 39. [Google Scholar] [CrossRef] [Green Version]
- Garg, M.; Braunstein, G.; Koeffler, H.P. LAMC2 as a therapeutic target for cancers. Expert Opin. Ther. Targets 2014, 18, 979–982. [Google Scholar] [CrossRef] [Green Version]
- Cho, N.H.; Shim, H.S.; Rha, S.Y.; Kang, S.H.; Hong, S.H.; Choi, Y.D.; Cho, S.H. Increased Expression of Matrix Metalloproteinase 9 Correlates with Poor Prognostic Variables in Renal Cell Carcinoma. Eur. Urol. 2003, 44, 560–566. [Google Scholar] [CrossRef]
- Noda, T.; Yamamoto, H.; Takemasa, I.; Yamada, D.; Uemura, M.; Wada, H.; Kobayashi, S.; Marubashi, S.; Eguchi, H.; Tanemura, M.; et al. PLOD2 induced under hypoxia is a novel prognostic factor for hepatocellular carcinoma after curative resection. Liver Int. 2011, 32, 110–118. [Google Scholar] [CrossRef] [PubMed]
- Du, W.; Liu, N.; Zhang, Y.; Liu, X.; Yang, Y.; Chen, W.; He, Y. PLOD2 promotes aerobic glycolysis and cell progression in colorectal cancer by upregulating HK2. Biochem. Cell Biol. 2020, 98, 386–395. [Google Scholar] [CrossRef] [PubMed]
- Yuan, K.; Gao, Z.J.; Yuan, W.D.; Yuan, J.Q.; Wang, Y. High expression of SLC6A10P contributes to poor prognosis in lung adeno-carcinoma. Int. J. Clin. Exp. Pathol. 2018, 11, 720–726. [Google Scholar] [PubMed]
- Lewis, C.; Murdoch, C. Macrophage Responses to Hypoxia: Implications for Tumor Progression and Anti-Cancer Therapies. Am. J. Pathol. 2005, 167, 627–635. [Google Scholar] [CrossRef]
- Wu, N.; Song, Y.; Pang, L.; Chen, Z. CRCT1 regulated by microRNA-520 g inhibits proliferation and induces apoptosis in esophageal squamous cell cancer. Tumor Biol. 2015, 37, 8271–8279. [Google Scholar] [CrossRef] [PubMed]
- Oh, S.-J.; Kim, S.-M.; Kim, Y.-O.; Chang, H.-K. Clinicopathologic Implications of PIWIL2 Expression in Colorectal Cancer. Korean J. Pathol. 2012, 46, 318–323. [Google Scholar] [CrossRef]
- Blumenthal, R.D.; Leon, E.; Hansen, H.J.; Goldenberg, D.M. Expression patterns of CEACAM5 and CEACAM6 in primary and metastatic cancers. BMC Cancer 2007, 7, 2. [Google Scholar] [CrossRef] [Green Version]
- Chen, D.; Sun, Y.; Wei, Y.; Zhang, P.; Rezaeian, A.H.; Teruya-Feldstein, J.; Gupta, S.; Liang, H.; Lin, H.-K.; Hung, M.-C.; et al. LIFR is a breast cancer metastasis suppressor upstream of the Hippo-YAP pathway and a prognostic marker. Nat. Med. 2012, 18, 1511–1517. [Google Scholar] [CrossRef] [Green Version]
- Zhao, J.-H.; Sun, J.-X.; Song, Y.-X.; Chen, X.-W.; Yang, Y.-C.; Ma, B.; Wang, J.; Gao, P.; Wang, Z.-N. A novel long noncoding RNA-LOWEG is low expressed in gastric cancer and acts as a tumor suppressor by inhibiting cell invasion. J. Cancer Res. Clin. Oncol. 2015, 142, 601–609. [Google Scholar] [CrossRef]
- Zhao, E.-H.; Shen, Z.-Y.; Liu, H.; Jin, X.; Cao, H. Clinical significance of human kallikrein 12 gene expression in gastric cancer. World J. Gastroenterol. 2012, 18, 6597–6604. [Google Scholar] [CrossRef]
- Sun, M.; Jin, F.-Y.; Xia, R.; Kong, R.; Li, J.-H.; Xu, T.-P.; Liu, Y.-W.; Zhang, E.-B.; Liu, X.-H.; De, W. Decreased expression of long noncoding RNA GAS5 indicates a poor prognosis and promotes cell proliferation in gastric cancer. BMC Cancer 2014, 14, 319. [Google Scholar] [CrossRef] [PubMed] [Green Version]
- Chen, Z.; Ju, H.; Yu, S.; Zhao, T.; Jing, X.; Li, P.; Jia, J.; Li, N.; Tan, B.; Li, Y. Prader–Willi region non-protein coding RNA 1 suppressed gastric cancer growth as a competing endogenous RNA of miR-425-5p. Clin. Sci. 2018, 132, 1003–1019. [Google Scholar] [CrossRef] [PubMed]
- Bao, W.; Fu, H.-J.; Jia, L.-T.; Zhang, Y.; Li, W.; Jin, B.-Q.; Yao, L.-B.; Chen, S.-Y.; Yang, A.-G. HER2-mediated upregulation of MMP-1 is involved in gastric cancer cell invasion. Arch. Biochem. Biophys. 2010, 499, 49–55. [Google Scholar] [CrossRef] [PubMed]
- Kim, C.J.; Cho, Y.G.; Jeong, S.W.; Kim, Y.S.; Kim, S.Y.; Nam, S.W.; Lee, S.H.; Yoo, N.J.; Lee, J.Y.; Park, W.S. Altered expression of KCNK9 in colorectal cancers. APMIS 2004, 112, 588–594. [Google Scholar] [CrossRef]
- Liot, S.; Aubert, A.; Hervieu, V.; El Kholti, N.; Schalkwijk, J.; Verrier, B.; Valcourt, U.; Lambert, E. Loss of Tenascin-X expression during tumor progression: A new pan-cancer marker. Matrix Biol. Plus 2020, 6-7, 100021. [Google Scholar] [CrossRef]
- Auslander, N.; E Cunningham, C.; Toosi, B.M.; McEwen, E.J.; Yizhak, K.; Vizeacoumar, F.S.; Parameswaran, S.; Gonen, N.; Freywald, T.; Bhanumathy, K.K.; et al. An integrated computational and experimental study uncovers FUT 9 as a metabolic driver of colorectal cancer. Mol. Syst. Biol. 2017, 13, 956. [Google Scholar] [CrossRef]
- Jing, Y.; Jia, D.; Wong, C.-M.; Ng, I.O.-L.; Zhang, Z.; Liu, L.; Wang, Q.; Zhao, F.; Li, J.; Yao, M.; et al. SERPINA5 inhibits tumor cell migration by modulating the fibronectin-integrin β1 signaling pathway in hepatocellular carcinoma. Mol. Oncol. 2013, 8, 366–377. [Google Scholar] [CrossRef]
- Bijsmans, I.T.G.W.; Smits, K.M.; De Graeff, P.; A Wisman, G.B.; Van Der Zee, A.G.J.; Slangen, B.F.; De Bruïne, A.P.; Van Engeland, M.; Sieben, N.L.; Van De Vijver, K.K. Loss of SerpinA5 protein expression is associated with advanced-stage serous ovarian tumors. Mod. Pathol. 2010, 24, 463–470. [Google Scholar] [CrossRef]
- Yang, X.; Wood, P.A.; Ansell, C.M.; Quiton, D.F.T.; Oh, E.-Y.; Du-Quiton, J.; Hrushesky, W.J.M. The Circadian Clock Gene PER1 Suppresses Cancer Cell Proliferation and Tumor Growth at Specific Times of Day. Chronobiol. Int. 2009, 26, 1323–1339. [Google Scholar] [CrossRef]
- Mostafaie, N.; Kállay, E.; Sauerzapf, E.; Bonner, E.; Kriwanek, S.; Cross, H.S.; Huber, K.R.; Krugluger, W. Correlated downregulation of estrogen receptor beta and the circadian clock gene Per1 in human colorectal cancer. Mol. Carcinog. 2009, 48, 642–647. [Google Scholar] [CrossRef]
- Bachelor, M.A.; Lu, Y.; Owens, D.M. l-3-Phosphoserine phosphatase (PSPH) regulates cutaneous squamous cell carcinoma proliferation independent of l-serine biosynthesis. J. Dermatol. Sci. 2011, 63, 164–172. [Google Scholar] [CrossRef] [PubMed] [Green Version]
- Li, X.; Wang, L.; Nunes, D.P.; Troxler, R.F.; Offner, G.D. Suppression of MUC1 synthesis downregulates expression of the epidermal growth factor receptor. Cancer Biol. Ther. 2005, 4, 968–973. [Google Scholar] [CrossRef] [PubMed] [Green Version]


| NO-Lower-IR | MO-Lower-IR | MO-Higher-IR | |
|---|---|---|---|
| N | 6 | 7 | 8 |
| Age (years) | 43.6 (11.0) | 48.0 (10.0) | 45.0 (17.0) |
| Weight (kg) | 55.5 (14.0) | 110.6 (21.0) 3 | 126.3 (34.4) 3 |
| BMI (kg/m2) | 22.1 (6.9) | 46.02 (6.7) 3 | 50.9 (14.3) 3 |
| Waist (cm) | 74.5 (14.3) | 116.0 (18.0) 3 | 131.0 (10.5) 3 |
| Hip (cm) | 103.5 (6.0) | 143 0 (31.0) 2 | 151.5 (23.5) 2 |
| Glucose (mg/dL) | 78.0 (13.0) | 84.0 (7.0) | 95.5 (19.0) |
| Insulin (µIU/mL) | 8.0 (2.5) | 10.5 (4.8) | 24.3 (8.9) 3,* |
| Cholesterol (mg/dL) | 194.5 (32.0) | 186.0 (53.0) | 188.0 (69.0) |
| Triglycerides (mg/dL) | 83.5 (39.0) | 110.0 (57.0) | 142.0 (84.0) |
| HOMA-IR | 1.47 (0.54) | 2.13 (1.10) | 5.2 (2.13) 3,# |
| Function a | Exclusive DEGs in MO-Lower-IR | DEGs in Intersection | Exclusive DEGs in MO-Higher-IR |
|---|---|---|---|
| Defense response and inflammation [1] | BTNL8, CDA, CEACAM6, CEBPE, CLC, CRCT1, CYP2S1, EGLN3, ENPP3, FBXO2, FCGR1B, HLA-DQA2, KBTBD13, LAIR2, LAMC2, MMP7, MMP9, NOS2, PLOD2, RBP4, SLC40A1, SORD, XCL1, ZDHHC11, BICC1, CYP4F11, EPB42, ERAP2, FAP, HLA-DQB1, KRT1, LIFR, PWRN1 | ANGPTL4, BPIFB1 *, CCL18, GREM1, GREM2, HBA2, HBB, LYPD8, ODAM, PGC *, PHEX, S100A8, TFF2 *, TCN1 *, CD86, ELF5, FKBP5, GKN2, LPL, MUC6, MYH7, PNLIPRP2, PSPHP1, REG1B, ZBTB16 | CR2, DNAJB13, MMP1, MMP3, SLCO4C1, XPNPEP3, APOD, CXCL9, ENTPD3, F5, FBXL13, FUT9, GBP3, KCNN4, LRRC17, MUC1, PCDHGC3, PER1, PSPH, SERPINA3, SERPINA5, SLPI, SPINK5, TNXB, ZG16B |
| Adaptative immune response [2] | BTNL8, CLC, FBXO2, FCGR1B, HLA-DQA2, KBTBD13, LAIR2, XCL1, ERAP2, HLA-DQB1 | CD86, ZBTB16 | CR2, FBXL13 |
| Innate immune response [3] | CDA, CEACAM6, FCGR1B, HLA-DQA2, MMP9, NOS2, XCL1, ERAP2, HLA-DQB1, KRT1 | BPIFB1 *, CCL18, HBB, PGC *, PHEX, S100A8, TCN1 *, MUC6, REG1B | CR2,SLCO4C1, CXCL9, F5, GBP3, MUC1, SERPINA3, SLPI, SPINK5 |
| Inflammation [4] | ENPP3,LAMC2, MMP9, NOS2, RBP4, XCL1, BICC1, CYP4F11, EPB42, KRT1, HLA-DQB1 | CCL18, HBA2, HBB, ODAM,S100A8, LPL, ZBTB16 | CR2, DNAJB13, MMP1, MMP3, XPNPEP3, APOD, CXCL9, F5, PER1, PSPH, SERPINA3, SPINK5 |
| Mediators in the production, signaling and response to cytokines [5] | FCGR1B, HLA-DQA2, MMP9, NOS2, XCL1, HLA-DQB1, LIFR | CCL18, GREM2, TFF2 *, CD86 | MMP1, MMP3, CXCL9, GBP3, MUC1, |
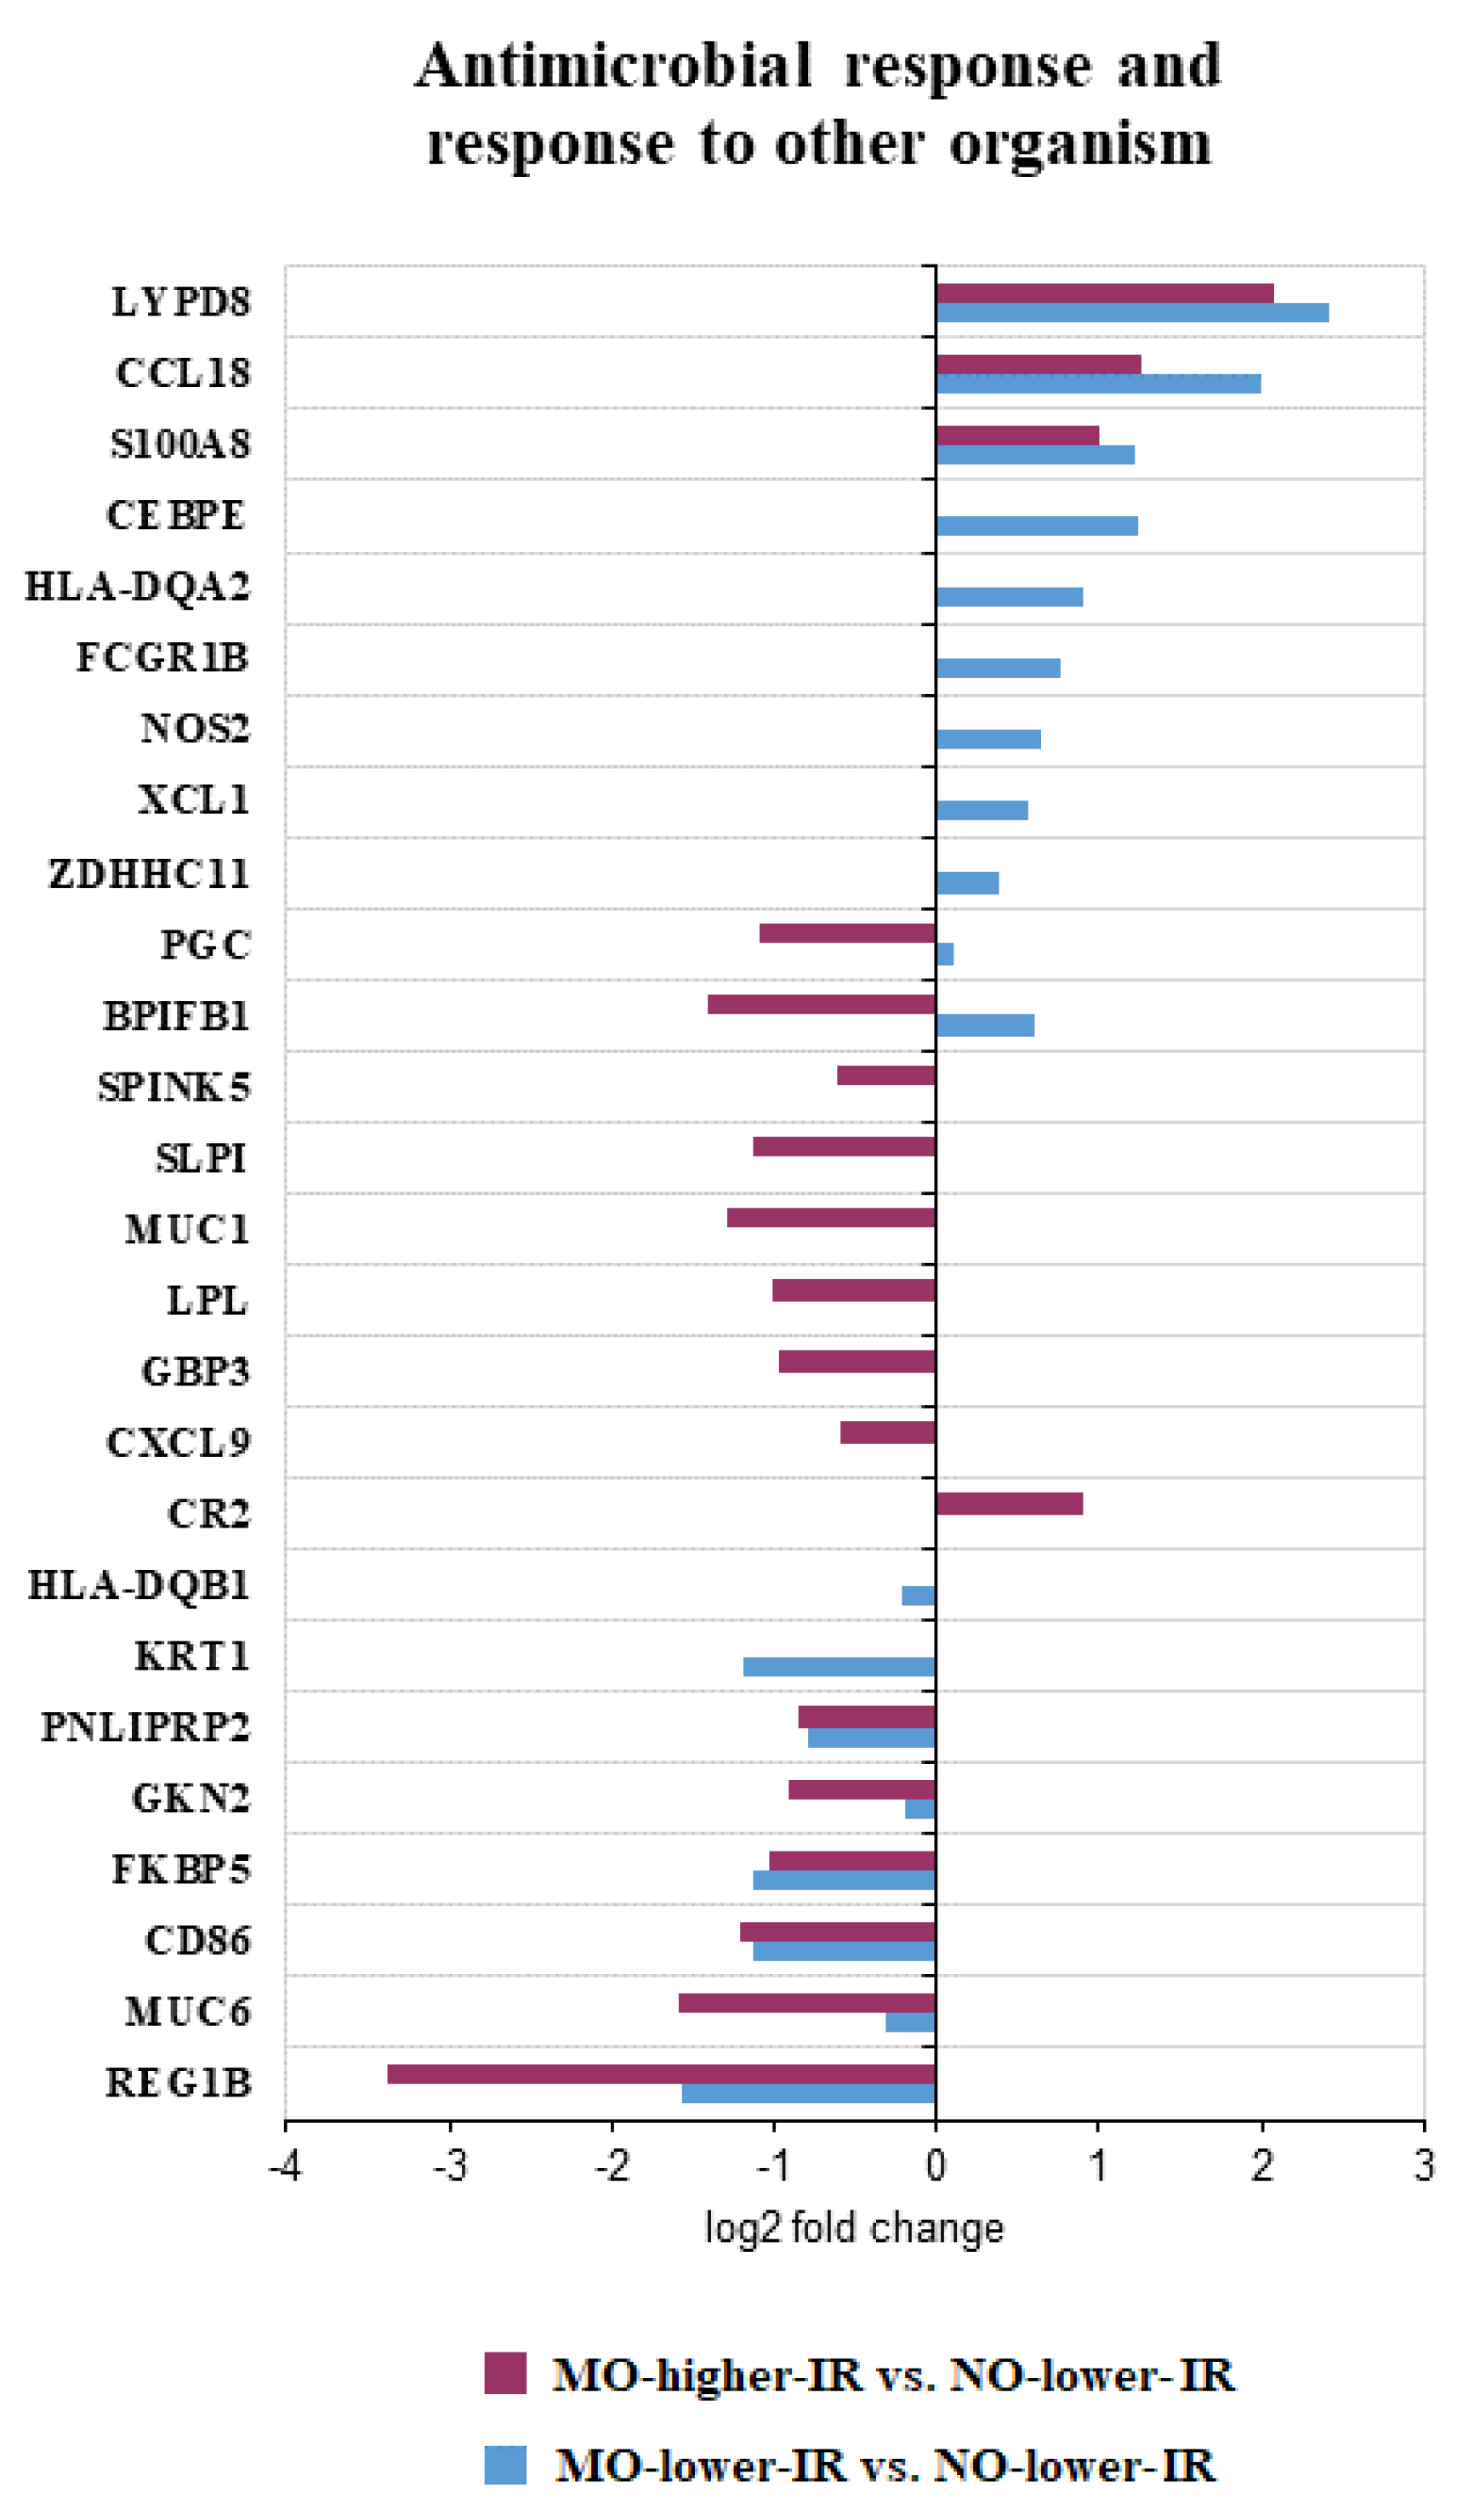
| Antimicrobial response [6] | CEBPE,FCGR1B, HLA-DQA2, NOS2, XCL1, ZDHHC11, HLA-DQB1, KRT1 | BPIFB1 *, CCL18, LYPD8, PGC *, S100A8, CD86, FKBP5, GKN2, LPL, MUC6, PNLIPRP2, REG1B | CR2, CXCL9, GBP3, MUC1, SLPI, SPINK5 |
| Hypoxia [7] | ARSL, EGLN3, MMP7, NOS2, PLOD2, SLC6A8, SLC6A10P, CYP4F11, HLA-DQB1 | ANGPTL4 | APOD, MUC1 |
| Epithelial maintenance and wound healing [8] | CYP4F2, RBP4, CYP4F11, FAP, KRT1 | HBD, HBB, ODAM, S100A8, TFF2 *, MUC6 | HBG1, APOD, F5, SERPINA3, SERPINA5 |
| Homeostasis [9] | CYP4F2, ERN1, NOS2, PM20D1, RBP4, SCT, SLC30A10, SLC40A1, XCL1, EPB42, FTO, KRT1 | APOC3, ANGPTL4, S100A8, SLC11A2, TFF2 *, CCDC66, CLRN1, HMBOX1, JPH4, LPL, MUC6 | MYOC, SCN3B, CXCL9, KCNN4, SERPINA3, ZG16B |
| Fucosylation [10] | FUT2 | FUT9, FUT1 | |
| Cell proliferation [11] | CEACAM6, CLC, EGLN3, ENPP3, ERN1, FBXO2, FUT2, LAMC2, MMP9, NOS2, RBP4, SPEG, XCL1, FTO, FAP, LIFR | A4GNT, GREM1, ODAM, CD86, GKN2, GKN1, REG1B, ZBTB16 | APOD, CXCL9, FUT1, NCCRP1 |
| Digestion and lipid metabolism [12] | CLC, PLAAT2, RBP4, SCT, CAPN8, GUCA2A, LCT | ANGPTL4, APOC3, PGC *, TFF2 *, GKN1, MUC6, LPL, LIPF, PNLIPRP2 | UCN2, AQP5, KCNN4, SERPINA3 |
| Response to biotic stimulus [13] | CEBPE, FCGR1B, HLA-DQA2, NOS2, XCL1, ZDHHC11, FAP, HLA-DQB1, KRT1 | BPIFB1 *, CCL18, LYPD8, PGC *, S100A8, CD86, FKBP5, GKN2, LPL, MUC6, PNLIPRP2, REG1B | CR2, CXCL9, GBP3, MUC1, SLPI, SPINK5 |
| Metabolic process [14] | CDA, CYP4F2, CYP2S1, FUT2, LDHC, MMP7, MMP9, NOS2, PLAAT2, PLOD2, PM20D1, RBP4, SCT, SORD, SULT1C2, SLC6A8, CYP4F11, FAP, UGT2B15 | APOC3, ANGPTL4, HBD, HBB, HBA2, LPL, LIPF, PNLIPRP2, PSPHP1 | HBG1, MMP3, MMP1, TYRP1, APOD, CYP2D6, ENTPD3, FADS6, FUT1, FUT9, PSPH, SERPINA3, TNXB |
| Transport [15] | AQP12A, SCT, SLC30A10, CYP4F2, MMP9, NOS2, PM20D1, RBP4, SLC40A1, SLC6A8, XCL1, KCNJ13 | APOC3, GREM1, HBD, HBB, HBA2, S100A8, SLC11A2, TFF2 *, TCN1 *, JPH4, LPL, VPS18 | HBG1, KCNN2, KCNK9, SCN3B, SLCO4C1, AQP5, APOD, CXCL9, GABRB3, KCNN4, KCNE2, PER1 |
| Proteolysis [16] | EGLN3, FBXO2, MMP9, MMP7, PM20D1, XPNPEP2, ERAP2, FAP, KLK12, SPINK4 | PHEX, PGC *, S100A8, C17orf97 | MMP1, MMP3, XPNPEP3, CPO, FBXL13, KCNE2, NCCRP1, SLPI, SERPINA5, SPINK5, SERPINA3 |
| Response to xenobiotics [17] | CDA, CYP4F2, CYP2S1, RBP4,NOS2, SORD, UGT2B15 | LPL, NAT8 | CYP2D6, KCNE2 |
| Response to drug [18] | CYP2S1, NOS2, SORD, SPINK4 | LPL, NAT8 | APOD, CYP2D6, KCNE2 |
| Response to toxic substance [19] | HBA2, HBB, HBD | HBG1, GSTT1 | |
| Gastrointestinal cancer [20] | BTNL8, CDA, LAMC2, MMP7,PLAAT2, SULT1C2, SLC6A8, TMED6, XPNPEP2, ZDHHC11, GAS5, GUCA2A, HLA-DQB1, HOXC6, LGALS2, LIFR, UGT2B15 | APOC3, GREM2, LCN15, LYPD8, HBB, ODAM, PGC *, S100A8, TFF2 *, TCN1 *, C6orf58, FKBP5, GKN1, GKN2, LPL, LIPF, PNLIPRP2, REG1B, RERE, UCA1, ZBTB16 | CR2, FDCSP, MMP1, MMP3, MYOC, XPNPEP3, TYRP1, CLDN2, C16orf89, ENTPD3, FUT9, GABRB3, HLF, KCNE2, KCNN4, LRRC17, MUC1, SERPINA3, SLPI, SPINK5, VSIG2 |
| Direction of the Gene Expression in MO | DEG | Expression or Action in Immune Cells | Reference | |
|---|---|---|---|---|
| DEGs from the intersection | Upregulated | CCL18 | CCL18 causes maturation of cultured monocytes to macrophages in the M2 spectrum. | [23] |
| S100A8 | S100A8 induces mucosal CD4+ T cells with a Th1 pro-inflammatory response. | [24] | ||
| S100A8/A9 is constitutively expressed in immune and epithelial cells of inflamed tissues. | [25] | |||
| Downregulated | ZBTB16 | ZBTB16 controls the development of invariant natural killer T cell effector functions. | [26] | |
| CD86 | CD86 is typically found on the surface of antigen-presenting cells and can either bind CD28 or CTLA-4, resulting in a costimulatory or a co-inhibitory response, respectively. | [27] | ||
| Exclusive DEGs from MO-low-IR | Upregulated | XCL1 | XCL1 is produced mainly by NK and activated CD8+ T cells and facilitates the activation and migration of intestinal dendritic cells. | [28] |
| ENPP3 | ENPP3 prevents a decrease in plasmacytoid dendritic cell numbers in the small intestine. | [29] | ||
| ENPP3 is highly expressed in activated basophils and mast cells and is rapidly induced by IgE. | [30] | |||
| NOS2 | An increase in Nos2 expression is characteristic of classically activated M1 macrophages. | [31] | ||
| CLC | CLC has lysophospholipase activity and is a characteristic constituent of eosinophils and basophils. | [32] | ||
| CEBPE | CEBPE is an essential transcription factor for granulocytic differentiation. | [33] | ||
| BTNL8 | BTNL8 is highly expressed on neutrophils. | [34] | ||
| RBP4 | RBP4 induces antigen-presenting cells as the drivers of an inflammatory response. | [35] | ||
| MMP9 | MMP9 recruits neutrophils to sites of inflammation. | [36] | ||
| Downregulated | HLA-DQB1 | HLA-DQB1 is expressed in antigen presenting cells. | [37] | |
| Exclusive DEGs from MO-high-IR | Downregulated | CXCL9 | CXCL9 is secreted in response to IFN-γ. Mainly secreted by monocytes, endothelial cells, fibroblasts, and cancer cells in response to IFN-γ | [38] |
Publisher’s Note: MDPI stays neutral with regard to jurisdictional claims in published maps and institutional affiliations. |
© 2022 by the authors. Licensee MDPI, Basel, Switzerland. This article is an open access article distributed under the terms and conditions of the Creative Commons Attribution (CC BY) license (https://creativecommons.org/licenses/by/4.0/).
Share and Cite
Ho-Plágaro, A.; Rodríguez-Díaz, C.; Santiago-Fernández, C.; López-Gómez, C.; García-Serrano, S.; Martín-Reyes, F.; Rodríguez-Pacheco, F.; Rodríguez-Cañete, A.; Alcaín-Martínez, G.; Vázquez-Pedreño, L.; et al. Morbid Obesity in Women Is Associated with an Altered Intestinal Expression of Genes Related to Cancer Risk and Immune, Defensive, and Antimicrobial Response. Biomedicines 2022, 10, 1024. https://0-doi-org.brum.beds.ac.uk/10.3390/biomedicines10051024
Ho-Plágaro A, Rodríguez-Díaz C, Santiago-Fernández C, López-Gómez C, García-Serrano S, Martín-Reyes F, Rodríguez-Pacheco F, Rodríguez-Cañete A, Alcaín-Martínez G, Vázquez-Pedreño L, et al. Morbid Obesity in Women Is Associated with an Altered Intestinal Expression of Genes Related to Cancer Risk and Immune, Defensive, and Antimicrobial Response. Biomedicines. 2022; 10(5):1024. https://0-doi-org.brum.beds.ac.uk/10.3390/biomedicines10051024
Chicago/Turabian StyleHo-Plágaro, Ailec, Cristina Rodríguez-Díaz, Concepción Santiago-Fernández, Carlos López-Gómez, Sara García-Serrano, Flores Martín-Reyes, Francisca Rodríguez-Pacheco, Alberto Rodríguez-Cañete, Guillermo Alcaín-Martínez, Luis Vázquez-Pedreño, and et al. 2022. "Morbid Obesity in Women Is Associated with an Altered Intestinal Expression of Genes Related to Cancer Risk and Immune, Defensive, and Antimicrobial Response" Biomedicines 10, no. 5: 1024. https://0-doi-org.brum.beds.ac.uk/10.3390/biomedicines10051024