Article

Transcriptome-Wide Analysis of CXCR5 Deficient Retinal Pigment Epithelial (RPE) Cells Reveals Molecular Signatures of RPE Homeostasis

1
Department of Ophthalmology, University of Missouri, Columbia, MO 65212, USA
2
Department of Ophthalmology, Institute for Clinical and Experimental Medicine, Faculty of Health Sciences, Linköping University, 58183 Linköping, Sweden
*
Author to whom correspondence should be addressed.
These authors contributed equally to this work.
Submission received: 17 April 2020 / Revised: 30 May 2020 / Accepted: 31 May 2020 / Published: 1 June 2020
(This article belongs to the Section Tumor Cell Biology)

Abstract

:
Age-related macular degeneration (AMD) is the most common cause of irreversible blindness in the elderly population. In our previous studies, we found that deficiency of CXCR5 causes AMD-like pathological phenotypes in mice, characterized by abnormalities and dysfunction of the retinal pigment epithelium (RPE) cells. The abnormalities included abnormal cellular shape and impaired barrier function. In the present study, primary RPE cells were derived separately from CXCR5 knockout (KO) mice and from C57BL6 wild type (WT). The isolated primary cells were cultured for several days, and then total RNA was isolated and used for library preparation, sequencing, and the resultant raw data analyzed. Relative to the WT, a total of 1392 differentially expressed genes (DEG) were identified. Gene ontology analysis showed various biological processes, cellular components, and molecular functions were enriched. Pathway enrichment analysis revealed several pathways, including the PI3K-Akt signaling, mTOR signaling, FoxO, focal adhesion, endocytosis, ubiquitin-mediated proteolysis, TNFα-NF-kB Signaling, adipogenesis genes, p53 signaling, Ras, autophagy, epithelial–mesenchymal transition (EMT), and mitochondrial pathway. This study explores molecular signatures associated with deficiency of CXCR5 in RPE cells. Many of these signatures are important for homeostasis of this tissue. The identified pathways and genes require further evaluation to better understand the pathophysiology of AMD.

Graphical Abstract

1. Introduction

Age-related macular degeneration (AMD) is a progressive degenerative disease affecting mainly the elderly population, and it is known to affect more than 180 million people worldwide [1]. Anti-VEGF agents are currently the approved treatment for the "wet" form of AMD. However, no treatments are available for the "dry" form of AMD. Dry AMD accounts for 85~90% of the total reported AMD cases [2,3]. Chemokines are chemotactic cytokines known to control the migration and localization of various cells, such as immune cells and leukocytes. There are about 20–30 chemokine receptors in the mammalian genome, including humans. Chemokine receptors are hypothesized to be essential for the pathogenesis of AMD, as they regulate the migration of immune and inflammatory cells, which contributes to the initiation and development of AMD [4,5]. The C-X-C motif chemokine receptor 5 (CXCR5), a chemokine transmembrane receptor, belongs to the C-X-C chemokine receptor family. CXCR5 acting via its ligand CXCL13 plays a crucial role in B cell initiation. Primarily recognized in Burkitt lymphoma, and in other several tumors [6], current studies have shown that the CXCL13/CXCR5 signaling axis might play an important role in the central nervous system (CNS), for instance, in pain transduction [7].
Recently, we demonstrated that aged CXCR5 knockout mice (CXCR5−/−, KO) develop retinal degeneration (RD) [8]. The degeneration was characterized by disrupted photoreceptors, upregulation of TNFα, presence of apoptotic cells in the retina, and by the loss of ZO-1, an indication of impaired blood–retinal barrier (BRB) function [9,10]. In humans, neuronal progenitor cells known to express CXCR5, migrated across the blood-brain barrier when exposed to CXCL13. The role of the CXCL13/CXCR5 signaling in AMD has not been explored. AMD pathogenesis frequently starts with dysfunction of the retinal pigment epithelium (RPE), causing both early and late AMD [11]. Therefore, maintaining normal RPE function is of paramount significance to the prevention of AMD initiation and progression. Understanding the regulatory mechanisms underlying RPE cell dysfunction is critical to elucidate the pathophysiology of AMD. This knowledge is important in the search for new therapeutic interventions for this irreversible blinding disease.
Our previous studies showed that deficiency of CXCR5 causes defects in RPE cells resulting in an AMD-like phenotype in mice [8,9]. A most recent study further showed that CXCR5 signaling is required for RPE homeostasis, including establishing an epithelial phenotype, autophagy, and for mitochondrial function (unpublished). The challenge, however, is that the mechanisms by which deficiency of CXCR5 leads to the described AMD-like phenotypes are not fully understood. In the present study, we performed a genome-wide transcriptomic analysis of WT versus CXCR5 KO RPE cells to identify genes and pathways that mediate RPE dysfunction leading to the development of AMD. The genes and pathways identified and presented here may be important for the pathophysiology of AMD, by regulating the homeostasis of the RPE cell layer.

2. Results

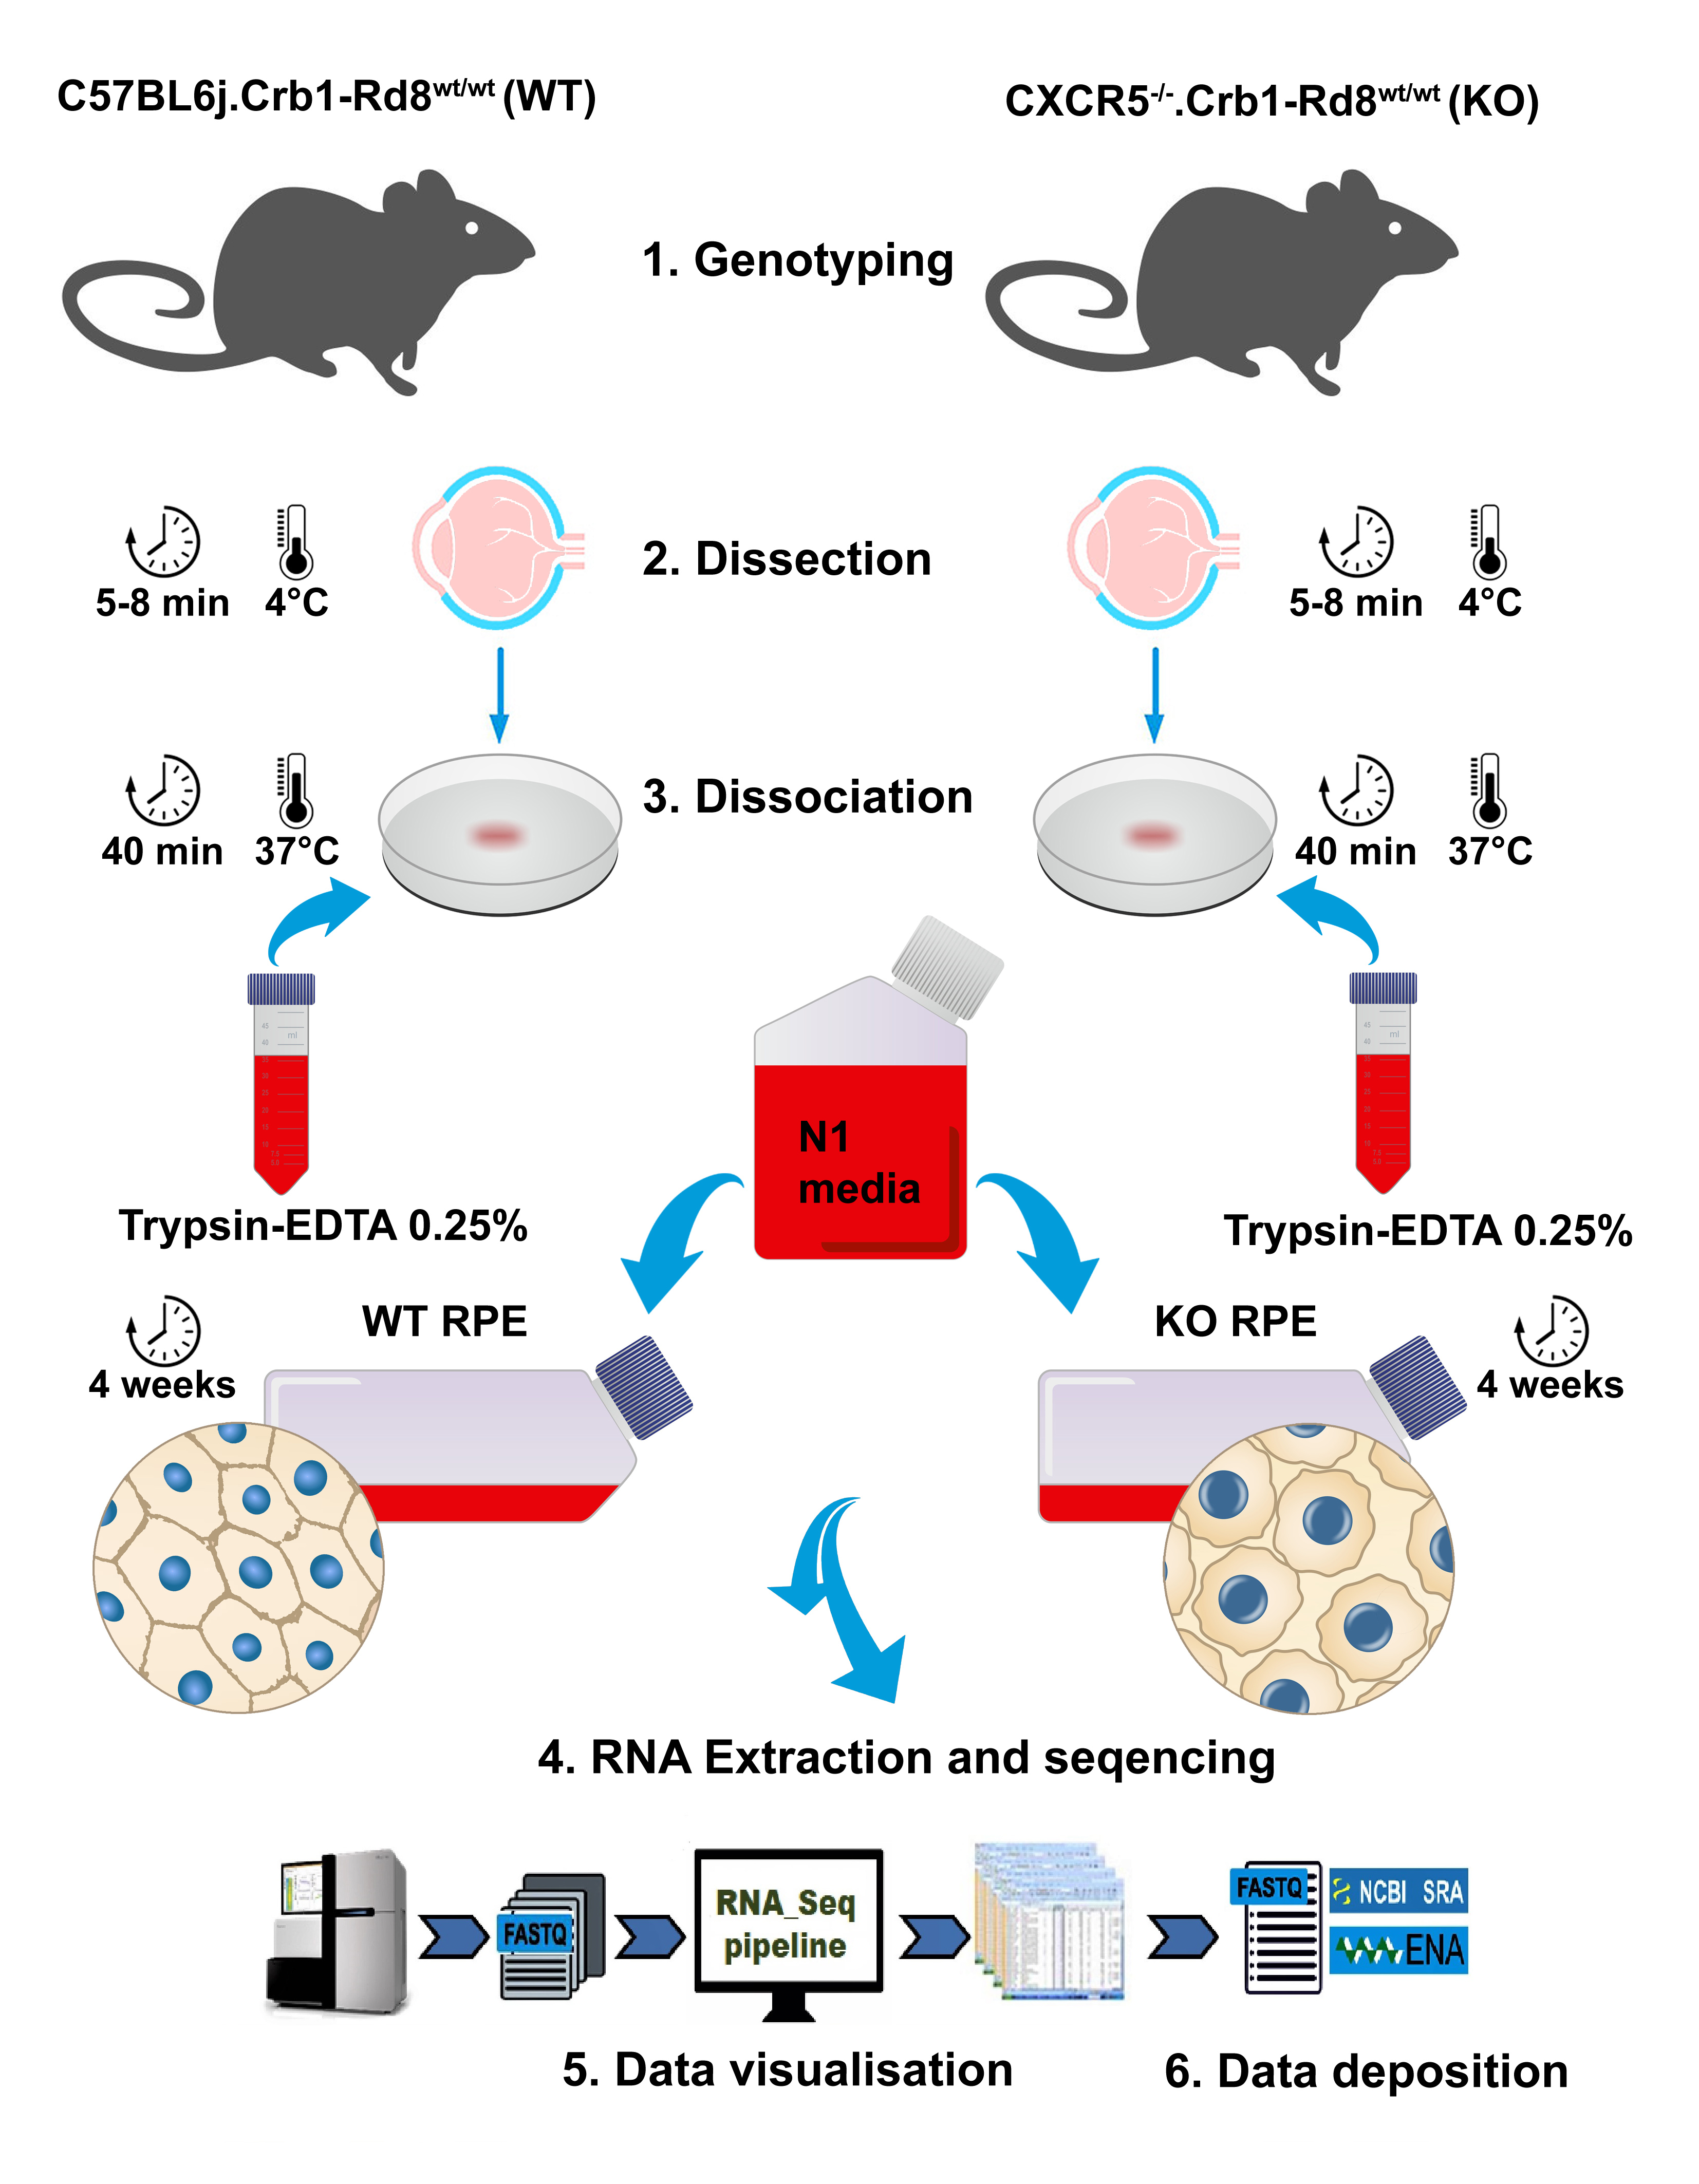
2.1. Abnormalities of the CXCR5-Deficient RPE in Primary Cell Cultures

Previous studies found that deficiency of CXCR5 leads to abnormalities in the RPE and with the presence of AMD-like phenotypes in mice [5,8,9]. The findings suggest that CXCR5 plays a protective role in RPE cells. To test this hypothesis, here we cultured primary RPE cells derived from CXCR5 KO mice and from C57BL6 WT controls. As shown in Figure 1A, WT RPE cells differentiated characterized, by increased expression and organization of RPE65, were of larger cell size, and strongly expressed ZO-1 at cell-to-cell interaction. In addition, the cells formed a monolayer on a supporting cellulose substrate. On the contrary, RPE cells harvested and cultured from CXCR5-/- mice did not produce a competent cell monolayer, they had poor intracellular connections, had an abnormal cell shape, and with disrupted RPE65 organization (Figure 1B). Taken together, these in vitro findings are consistent with the previous in vivo results, and they indicate that CXCR5 is required for RPE survival and/or homeostasis.

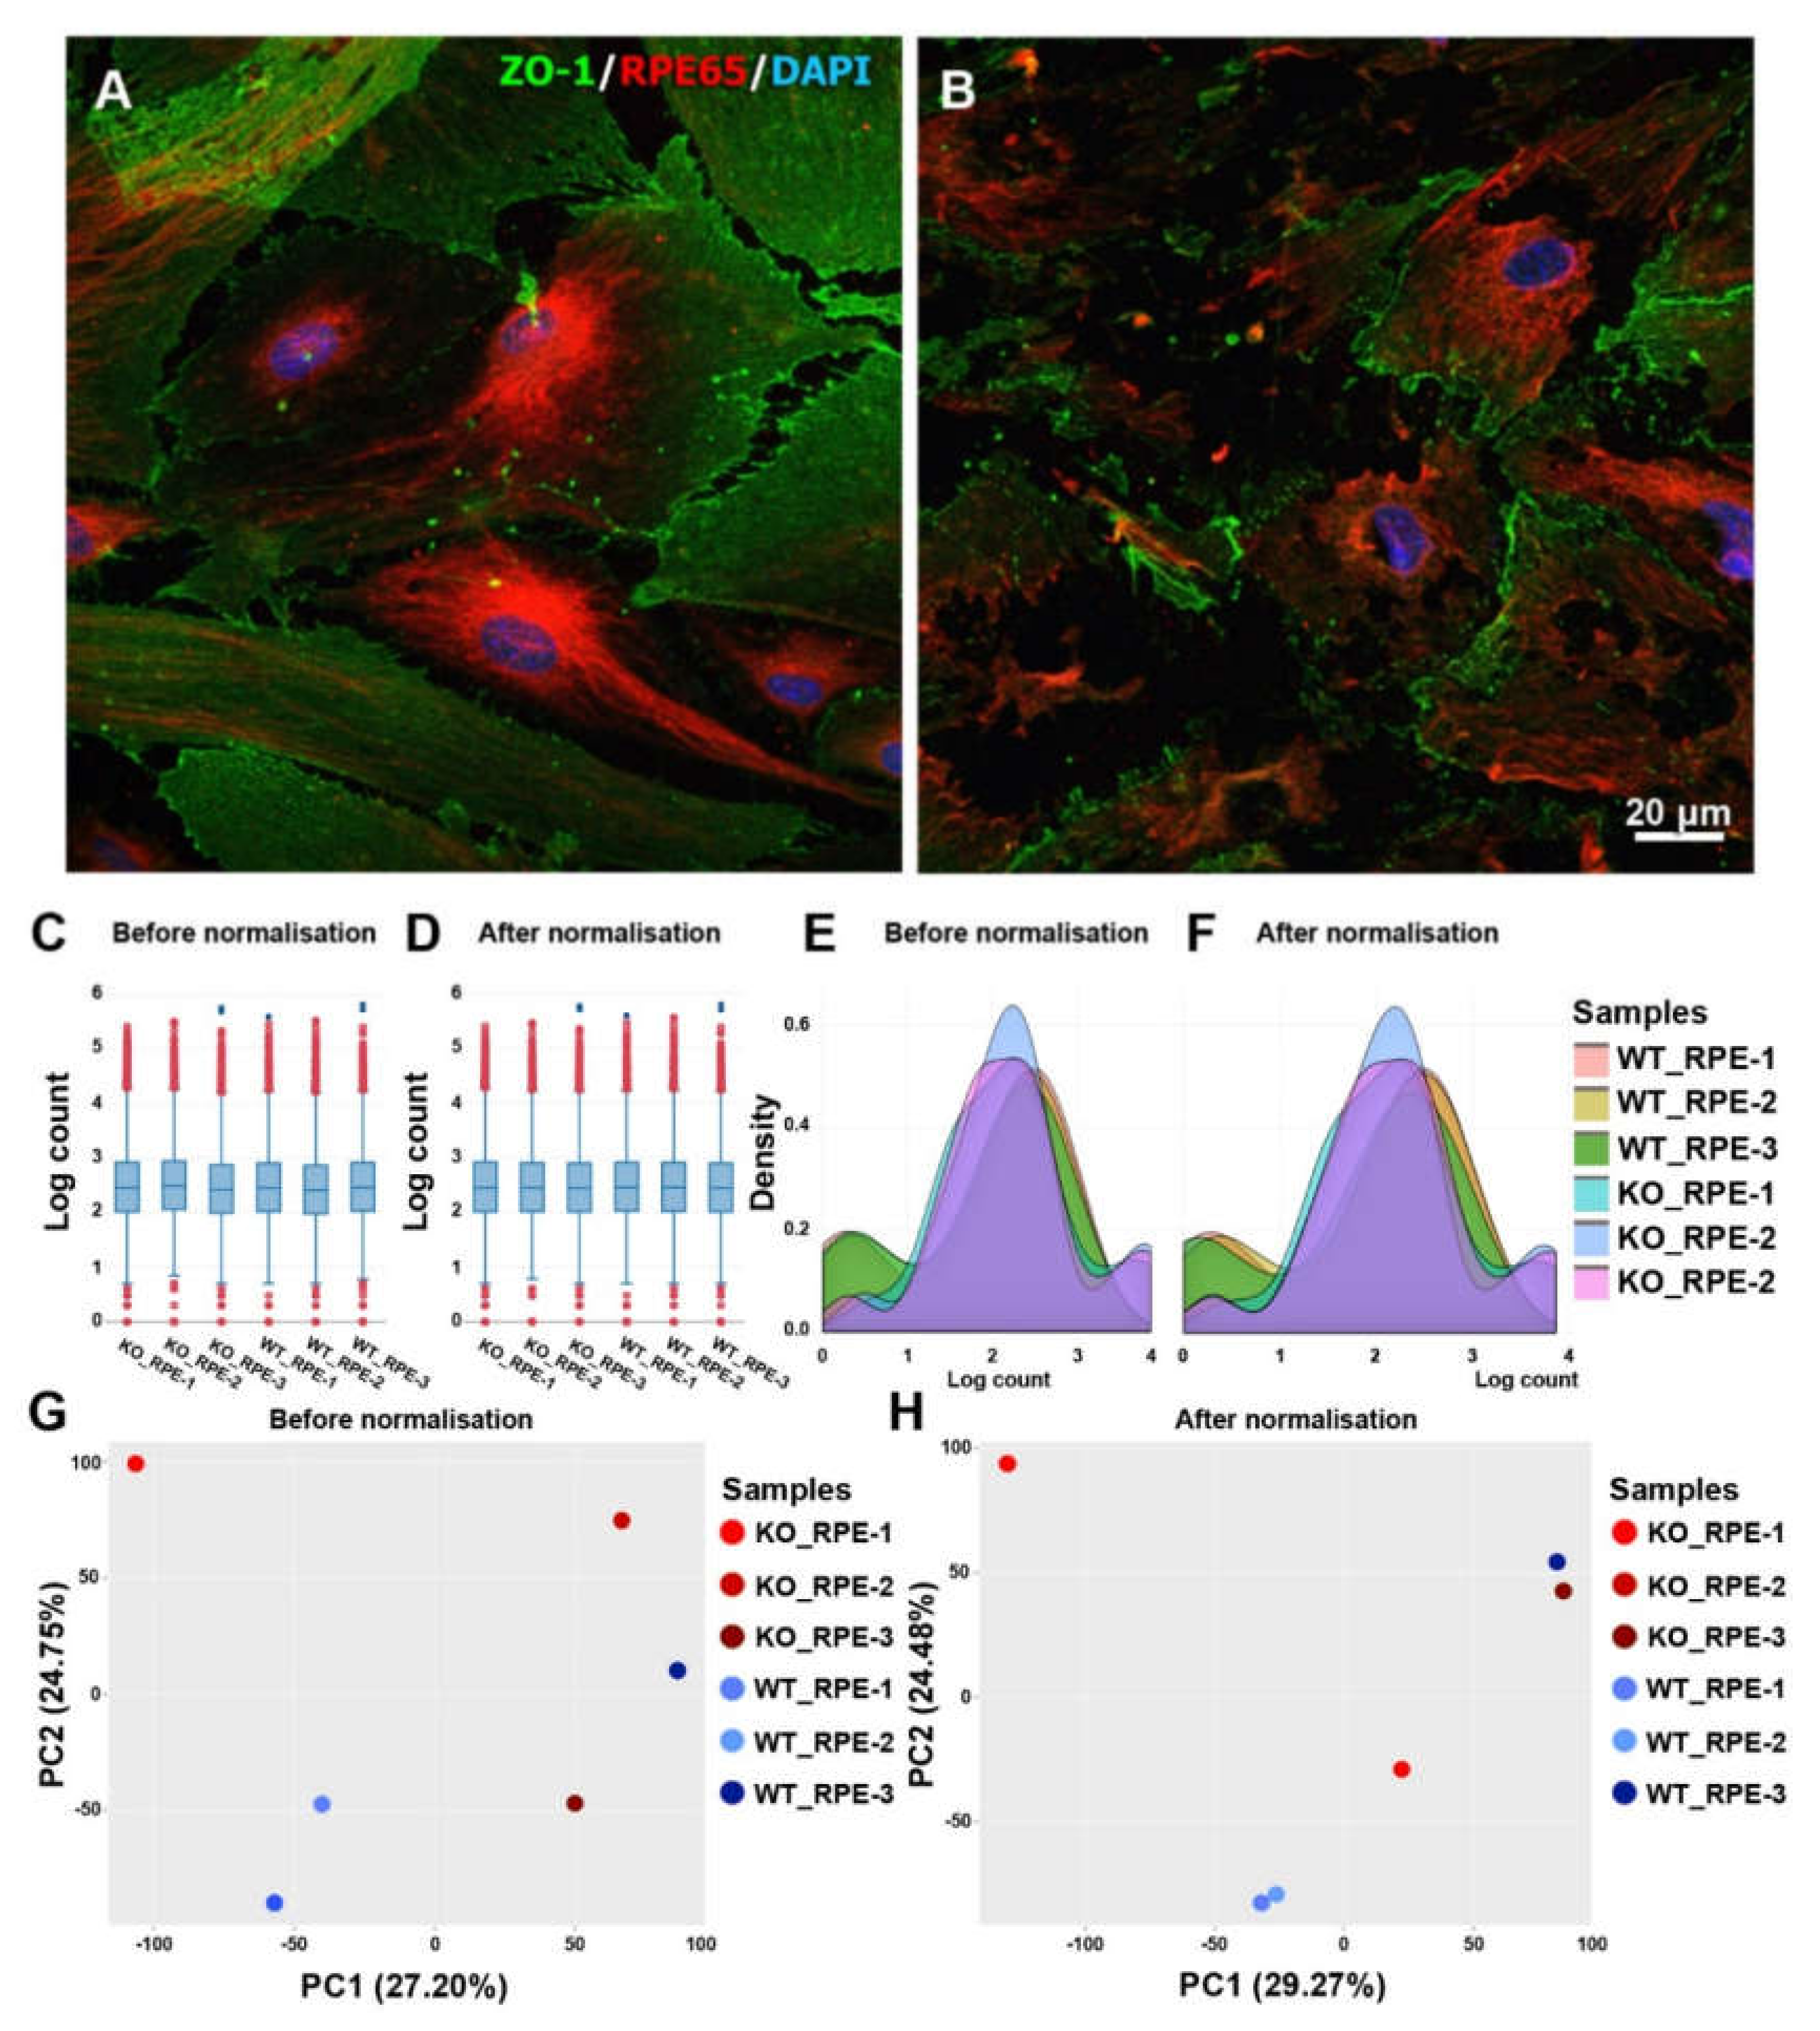
2.2. Differentially Expressed Genes in the CXCR5 KO

To explore the molecular mechanism by which CXCR5 regulates RPE function, we performed whole transcriptome analysis in order to profile the difference between CXCR5 KO RPE cells and WT control cells at the transcriptome level. We used a trimmed mean of M value (TMM) normalization method to count data by using DESeq2 R-package. TMM normalization adjusts the size of libraries based on the assumption that most genes are not differentially expressed. Therefore, it is essential not to make subsets of the count data before doing statistical analysis or visualization, as this can lead to differences being normalized away. Log CPM (Counts per Million) values are calculated for each gene. The CPM calculation uses the effective library size as calculated by the TMM normalization. After this initial normalization, a second normalization is then performed across samples for each gene: the counts for each gene are mean-centered and scaled to unit variance. Genes with zero expression across all samples or invalid values (NaN) are excluded. After normalization, the number of counts, density of each sample, principle component analysis (PCA), and log expression values (all2all scatter) were visualized based on the top N variable genes as defined by the coefficient of variance. Sample similarities and variance were viewed by plotting all pairwise scatter plots (Figure S1). Heatmap was used to visualize count data, and this is ideal for identifying global patterns in the data (Figure S2).
The results of count (Figure 1C,D), density plot (Figure 1E,F), PCA (Figure 1G,H), and log expression plots (Figure S1) revealed that the CXCR5 KO RPE samples varied less compared to WT RPE. Pearson’s correlation coefficient analysis (Figure S1) and heatmap (Figure S2) indicated an overall high level of reproducibility between the three biological replicates for each sample, and within experimental groups. DESeq2 was used to assess the data to identify batch effects, and for filtering data for low count features and for removing batch effects and for performing differential analysis.
A total of 1392 differentially expressed genes (693 upregulated and 699 down-regulated genes) satisfied the criteria of FDR (False Discovery Rate) value < 1.0, fold change greater than 0.2 and less than −0.2 (logFC ± 0.2), and p-value less than 0.05 in CXCR5 KO compared to WT RPE samples. A hierarchical cluster heatmap (Figure S3), MA plot (Figure 2A), and volcano plots (Figure 2B) illustrate the differentially expressed genes (DEGs). The identified DEGs were further used for gene ontology and functional pathway enrichment analysis.

2.3. Gene Ontology of the Differentially Expressed Genes

To further understand the functions of these DEGs, gene ontology (GO) analysis was performed. In addition, pathway enrichment analysis was performed. The identified DEGs were used as input into the DAVID tool (Database for annotation, visualization, and integrated discovery), and using the complete mouse genome as the background. Several molecular functions (MFs), biological processes (BPs), cellular components (CCs), and pathways were identified. All the GO and pathways enriched using the DEGs are presented in supplementary file 2.
GO analysis revealed that the regulation of organelle organization (GO:0033043), regulation of anatomical structure morphogenesis (GO:0022603), positive regulation of cellular component organization (GO:0051130), cellular component morphogenesis (GO:0032989), transcription by RNA polymerase II (GO:0006366), cell morphogenesis (GO:0000902), cellular catabolic process (GO:0044248), regulation of transcription by RNA polymerase II (GO:0006357), protein phosphorylation (GO:0006468), and macromolecule catabolic process (GO:0009057) were the significantly enriched GO term in biological process. The result reveals that the transcription by RNA polymerase II (236 genes), cellular catabolic process (232 genes), regulation of transcription by RNA polymerase II (230 genes), and protein phosphorylation (219 genes) were the most significantly enriched GO term in molecular functions (Figure 2C).
GO analysis for the DEGs found that the neuron part (GO:0097458), bounding membrane of organelle (GO:0098588), organelle subcompartment (GO:0031984), Golgi apparatus (GO:0005794), synapse (GO:0045202), cytosolic ribosome (GO:0022626), catalytic complex (GO:1902494), cytoskeletal part (GO:0044430), endoplasmic reticulum (GO:0005783), and cytoplasmic region (GO:0099568) were the significantly enriched GO term in cellular components. The results revealed that the neuron part (219 genes), endoplasmic reticulum (191 genes), organelle subcompartment (190 genes), bounding membrane of organelle (187 genes), and cytoskeletal part (185 genes) were the most significantly enriched GO term in cellular components (Figure 2D).
GO analysis for the DEGs found that the cytoskeletal protein binding (GO:0008092), transcription regulator activity (GO:0140110), structural constituent of ribosome (GO:0003735), RNA binding (GO:0003723), protein kinase binding (GO:0019901), DNA binding (GO:0003677), structural molecule activity (GO:0005198), kinase binding (GO:0019900), enzyme regulator activity (GO:0030234), and protein domain specific binding (GO:0019904) were significantly enriched GO term in molecular functions (Figure 2E). The result revealed that DNA binding (213 genes), transcription regulator activity (155 genes), and RNA binding (126 genes) were the most significantly enriched GO term in molecular functions (Figure 2E).
The GO results described that transcription by RNA polymerase II, catabolic process, protein phosphorylation, neuron part, endoplasmic reticulum, organelle subcompartment, cytoskeletal part of genes was more affected in the CXCR5-deficient RPE cells.

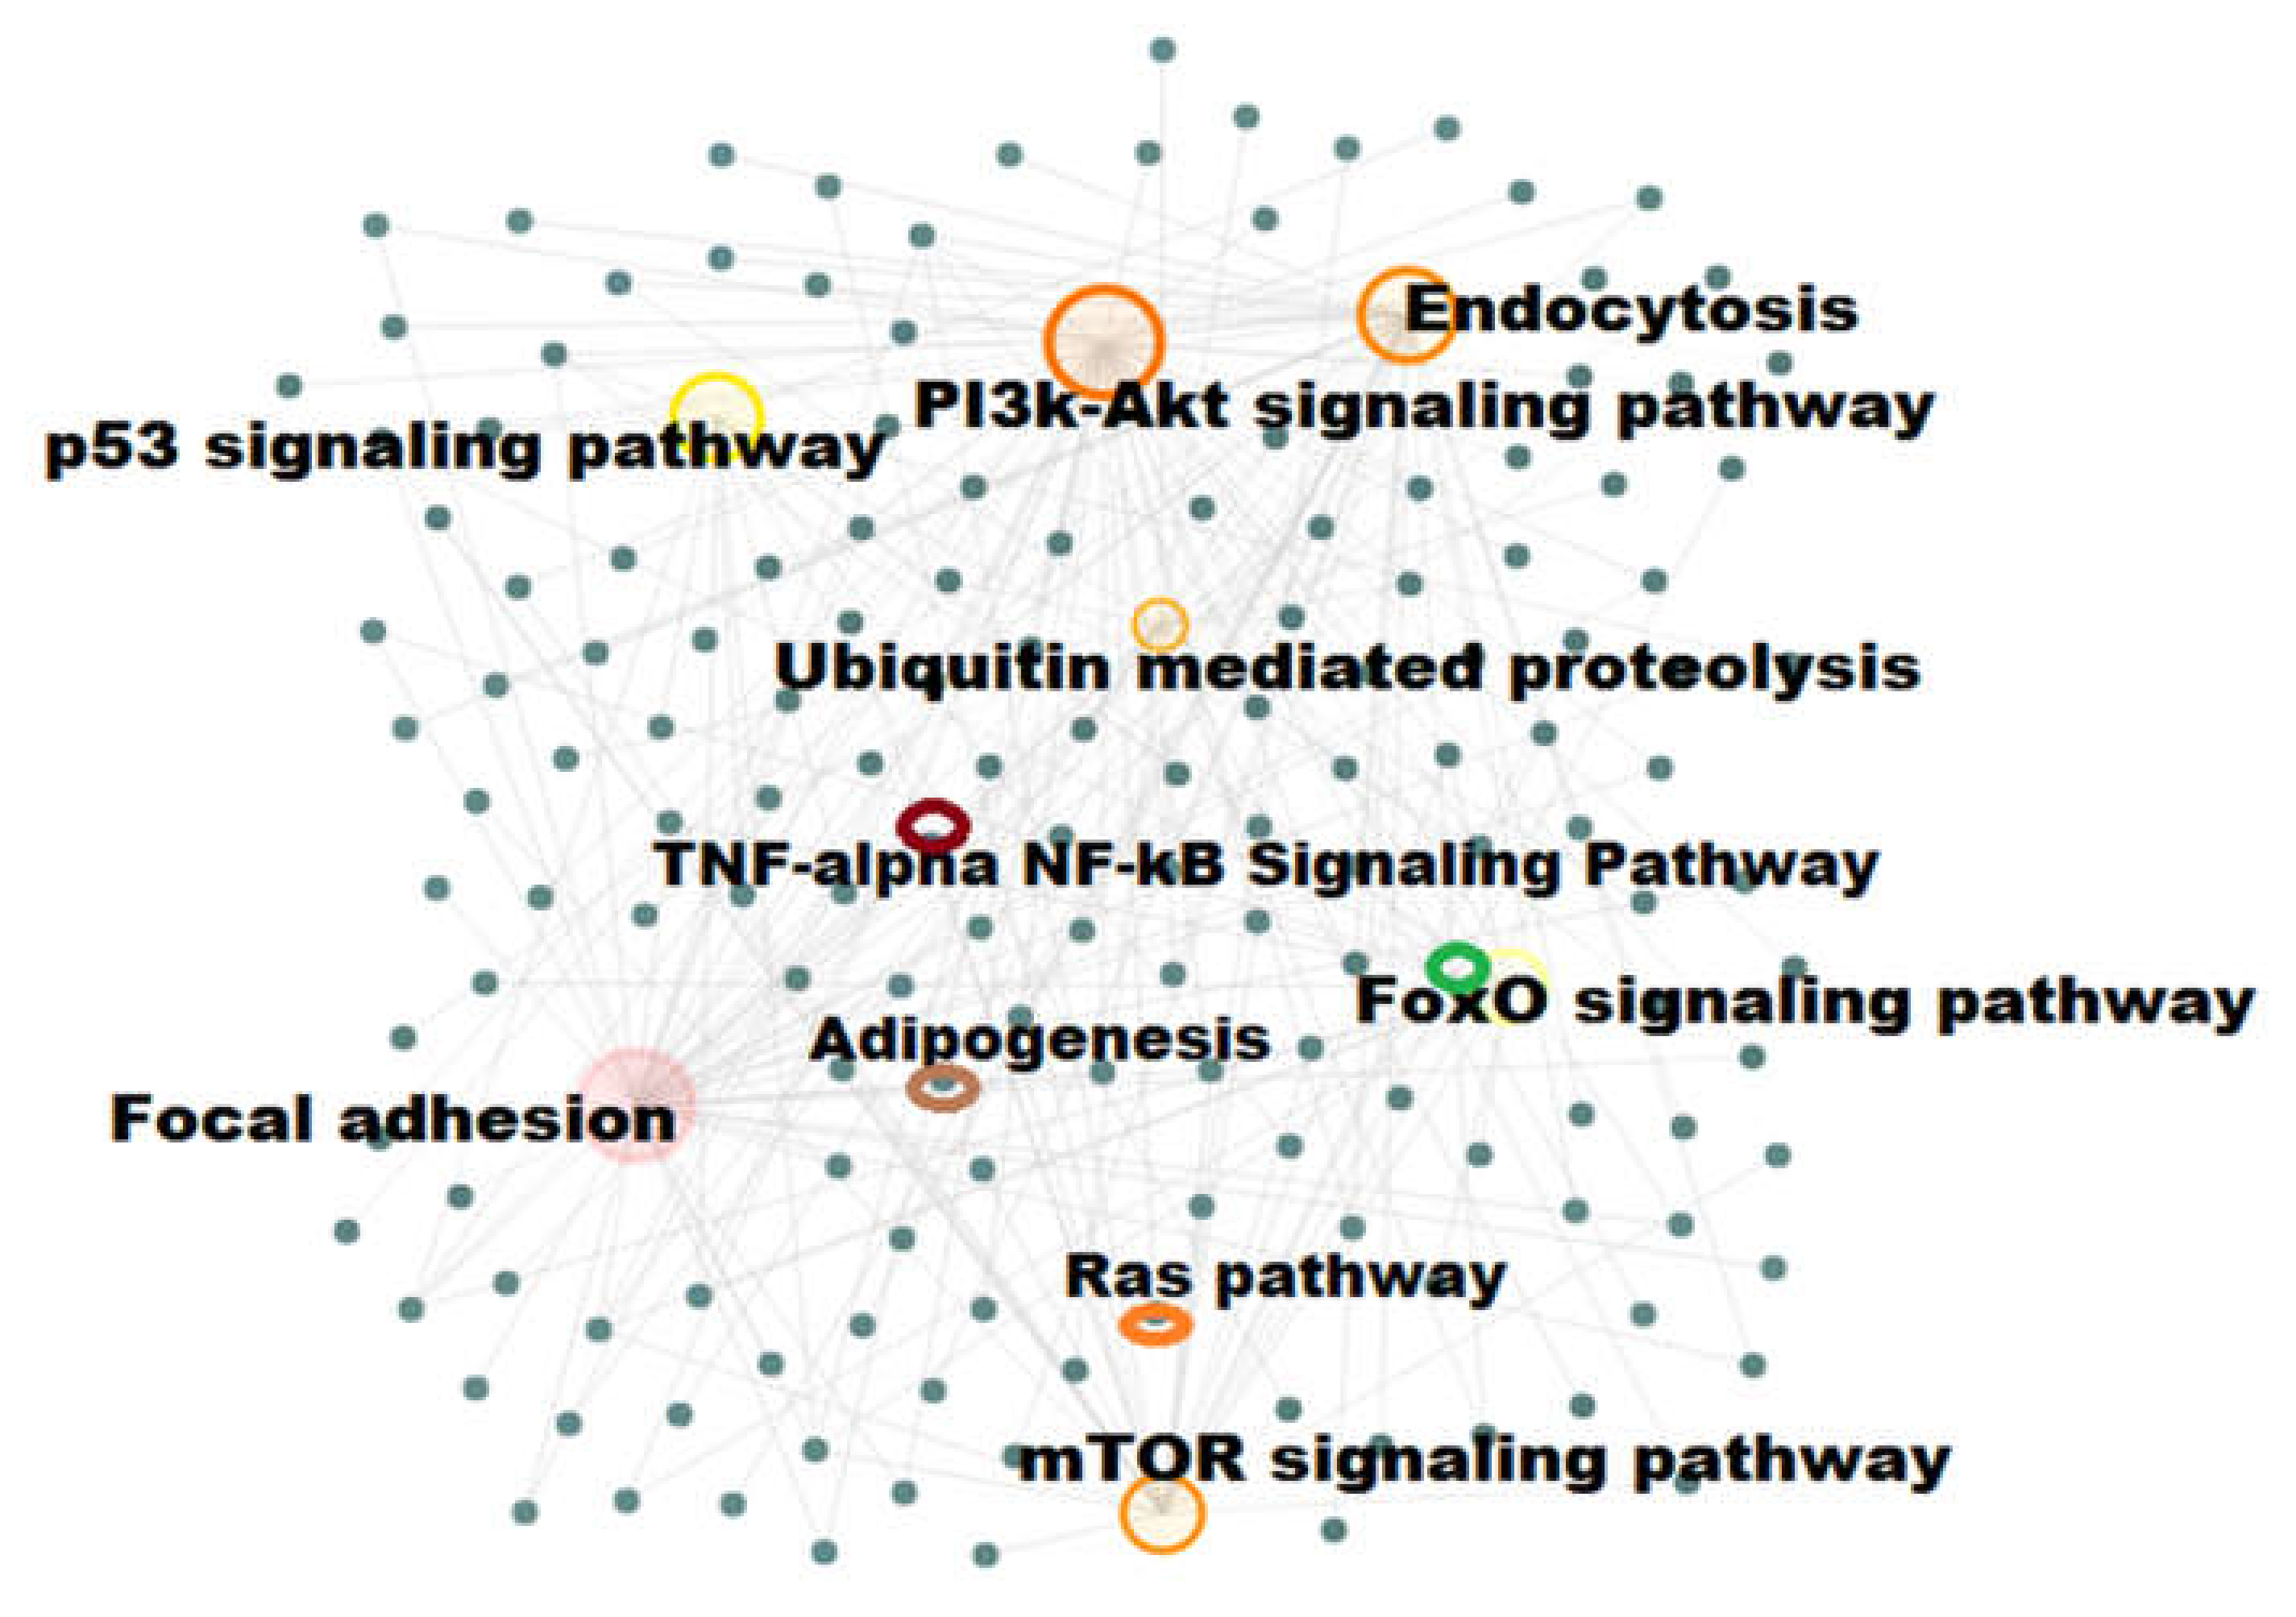
2.4. Pathway Enrichment Analysis

Using the identified DEGs, several pathways were enriched, including PI3K-Akt signaling pathway (54 genes), FoxO signaling pathway (19 genes), mTOR signaling pathway (29 genes), focal adhesion (40 genes), endocytosis (43 genes), ubiquitin-mediated proteolysis (26 genes), TNF-alpha NF-kB signaling pathway (32 genes), adipogenesis genes (23 genes), p53 signaling (14 genes), and Ras Pathway (10 genes) respectively (Figure 3). From the analysis, most of DEGs were found to be involved in PI3K-Akt signaling pathway (Table 1), focal adhesion (Table S2), endocytosis (Table S3), mTOR signaling pathway (Table S4), FoxO signaling pathway (Table S5), TNF-alpha, and NF-kB signaling pathways (Table 2). The PI3K-Akt signaling pathway and TNF-alpha NF-kB signaling pathway genes and their logFC values are shown in Figure 4. In addition, some of the genes were found to be involved in autophagy, epithelial–mesenchymal transition (EMT), and mitochondrial pathways (Figure S4).

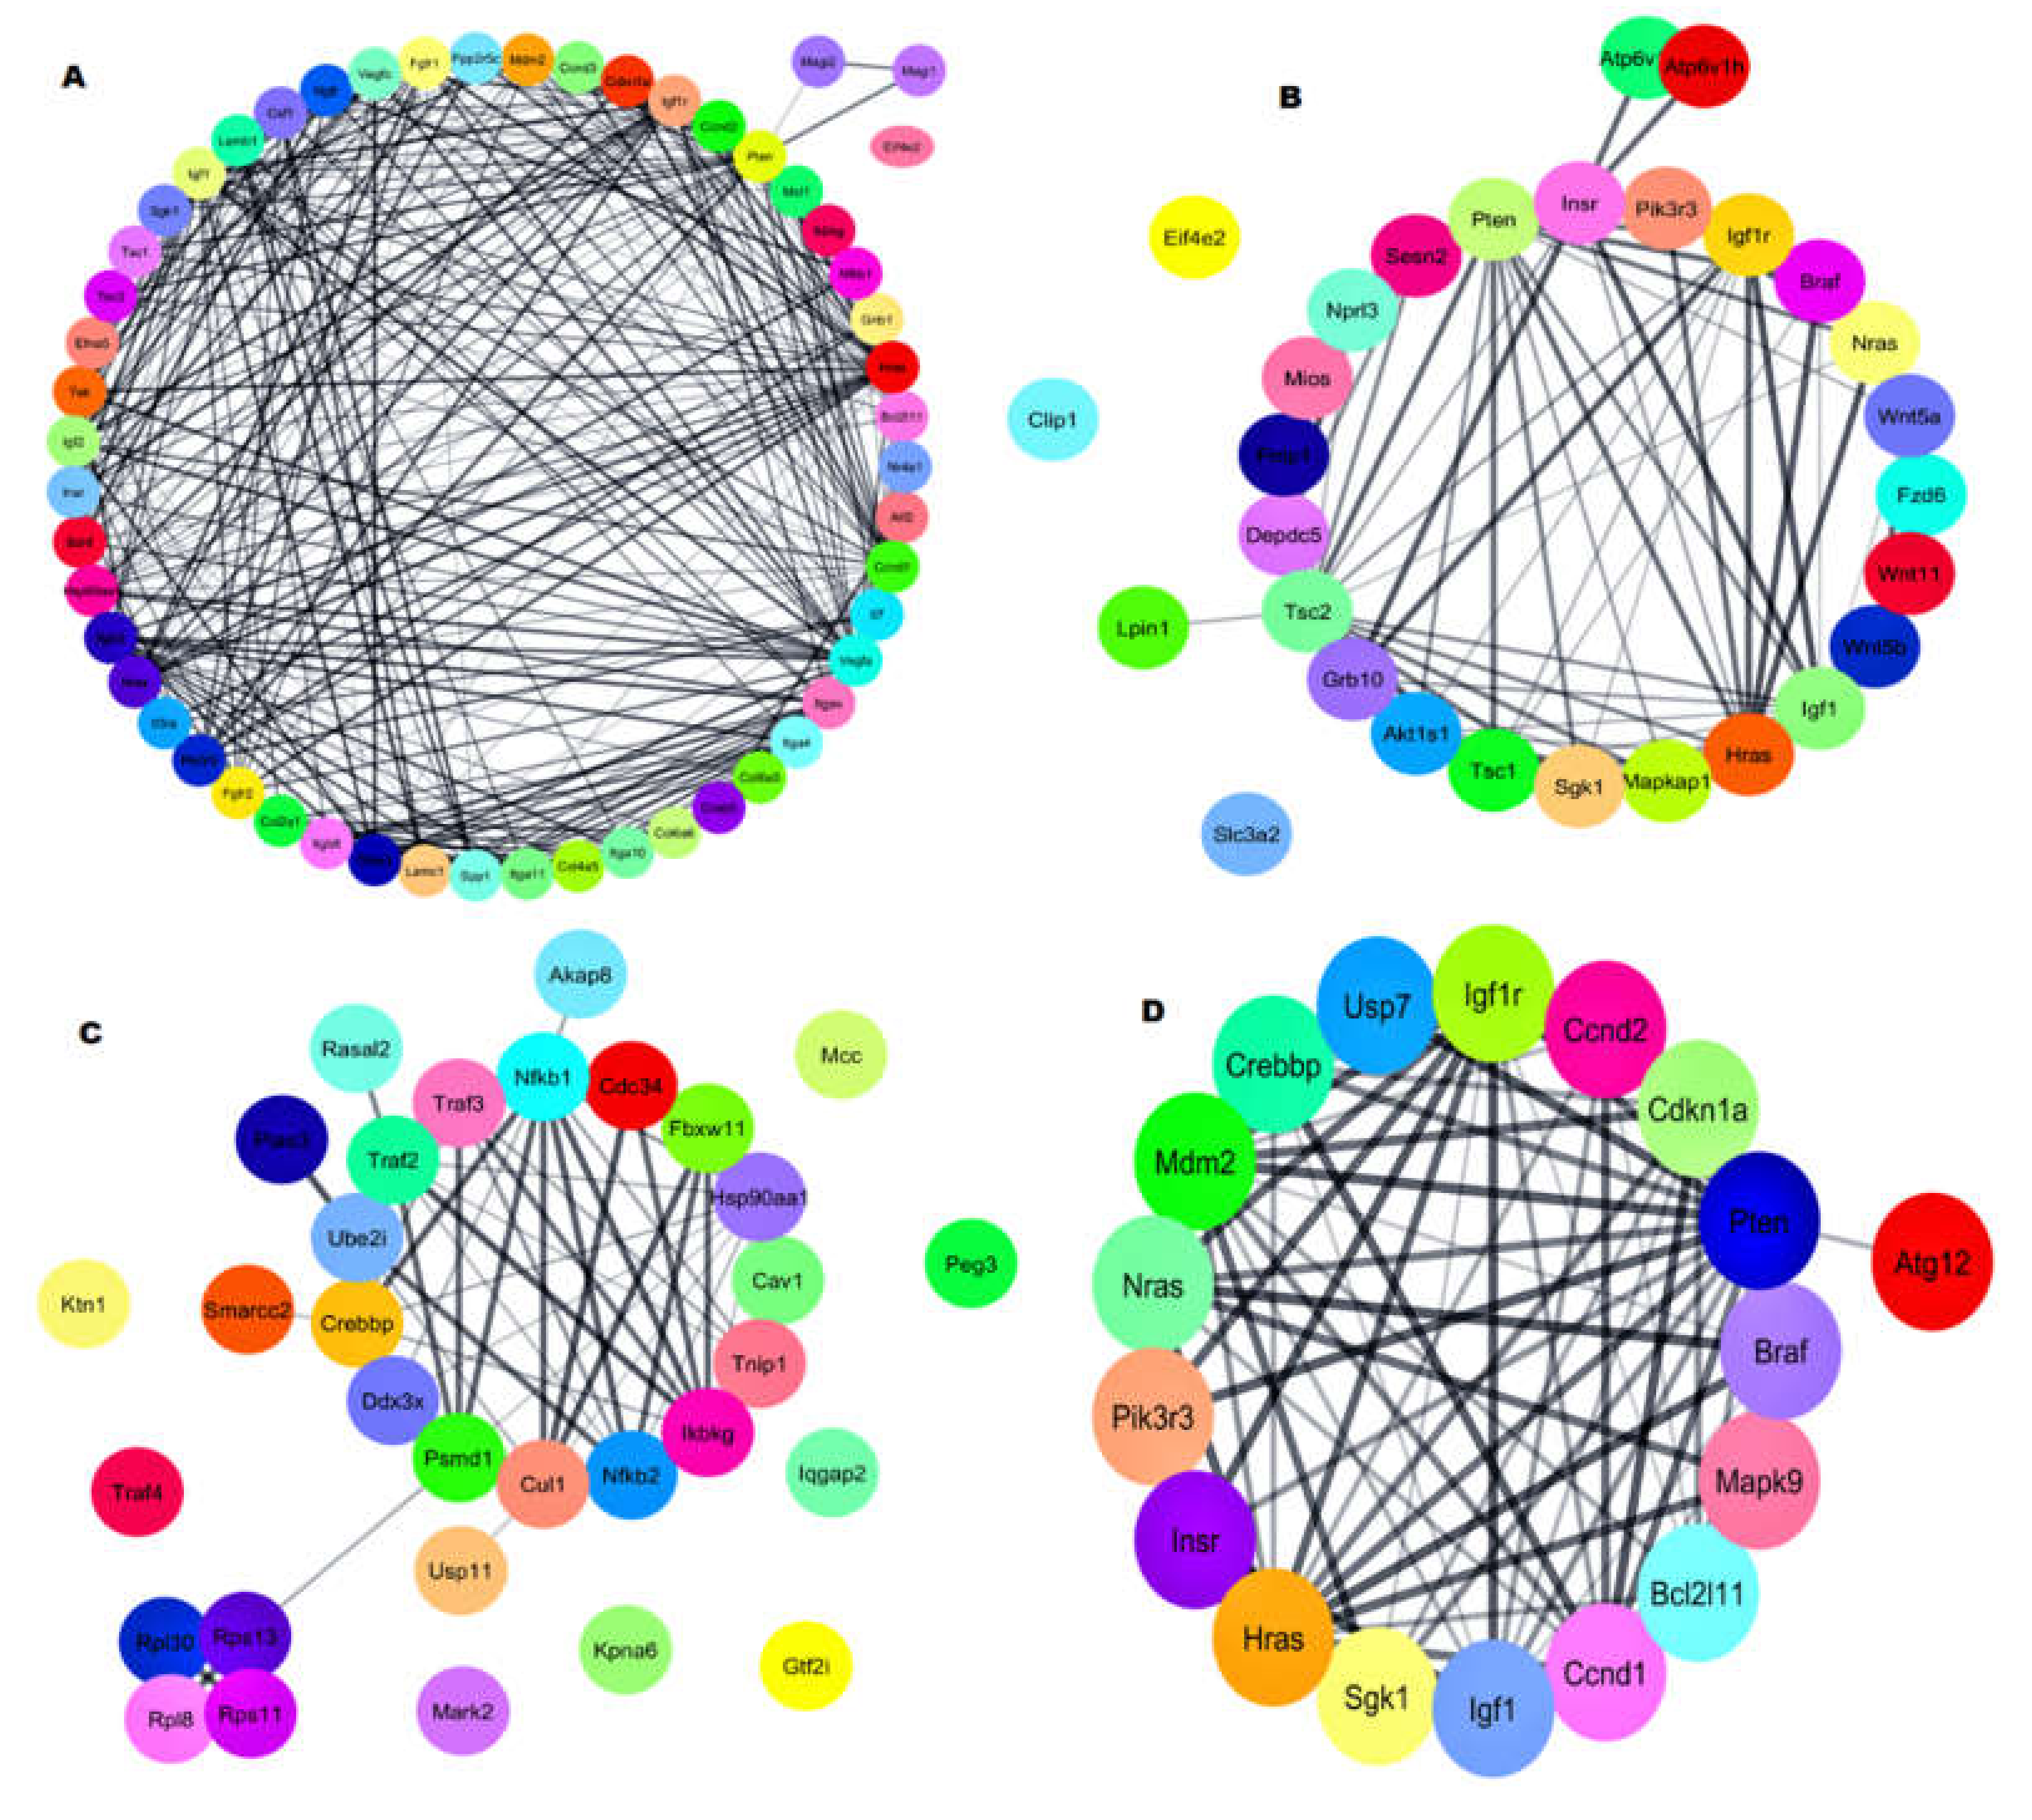
2.5. Gene–Gene Network with Pathway Enrichment Analysis

The DEGs were analyzed for gene–gene interaction networks using the STRING tool https://string-db.org/ (accessed on 31 May 2020) with the Cytoscape v.3.7 tool https://cytoscape.org/ (accessed on 31 May 2020). The gene–gene network for DEGs was generated with their respective minimum required interaction score (0.400). For the genes involved in the PI3K-Akt signaling pathway, the gene–gene network (Figure 5A) showed that 51 genes interacted directly with each other. The results revealed that 53 genes were directly involved, and one gene was indirectly involved in the PI3K-Akt signaling pathway. For genes in the mTOR signaling, pathway 26 genes were connected directly with each other, and three genes were singletons (Figure 5B). These results indicate that 26 genes were involved indirectly, and three genes were indirectly involved in the mTOR signaling pathway. For the genes in the focal adhesion network, 40 genes interacted directly with the main network and were involved in the Focal adhesion pathway (Figure S5A).
For the endocytosis pathway network, 33 genes were connected directly, two genes formed a subnetwork and connected to the main network, and six genes were singletons (Figure S5B). The results revealed that 35 genes were directly involved, and eight genes were involved indirectly in the endocytosis signaling pathway. The ubiquitin-mediated proteolysis network showed 25 genes were connected directly to each other, but one gene was a singleton and connected to the main network (Figure S6A). The result reveals that 26 genes were involved in the ubiquitin-mediated proteolysis pathway. The TNF-alpha NF-kB signaling network showed 20 genes were internally connected, four genes were involved in the subnetwork, and connected to the main network along with eight singletons (Figure 5C). The result reveals that 24 genes were directly involved, and eight genes were indirectly involved in TNF-alpha NF-kB Signaling Pathway. The Adipogenesis network showed one main network and three subnetworks along with six singletons (Figure S6B). The result reveals that fifteen genes were directly involved; eight genes were indirectly involved in the adipogenesis pathway. The p53 signaling network showed 13 genes were interconnected in the main network along with one singleton (Figure S7A). The result reveals that 13 genes were directly involved, and one gene was indirectly involved in the p53 signaling pathway. The Ras Pathway network showed only one main network, interconnected with each other in the main network without singleton (Figure S7B). The result reveals that ten genes were directly involved in the Ras signaling pathway. The FoxO pathway network showed eighteen genes were interconnected with each other in the main network (Figure 5D). It reveals that eighteen genes were directly involved in FoxO signaling pathway.

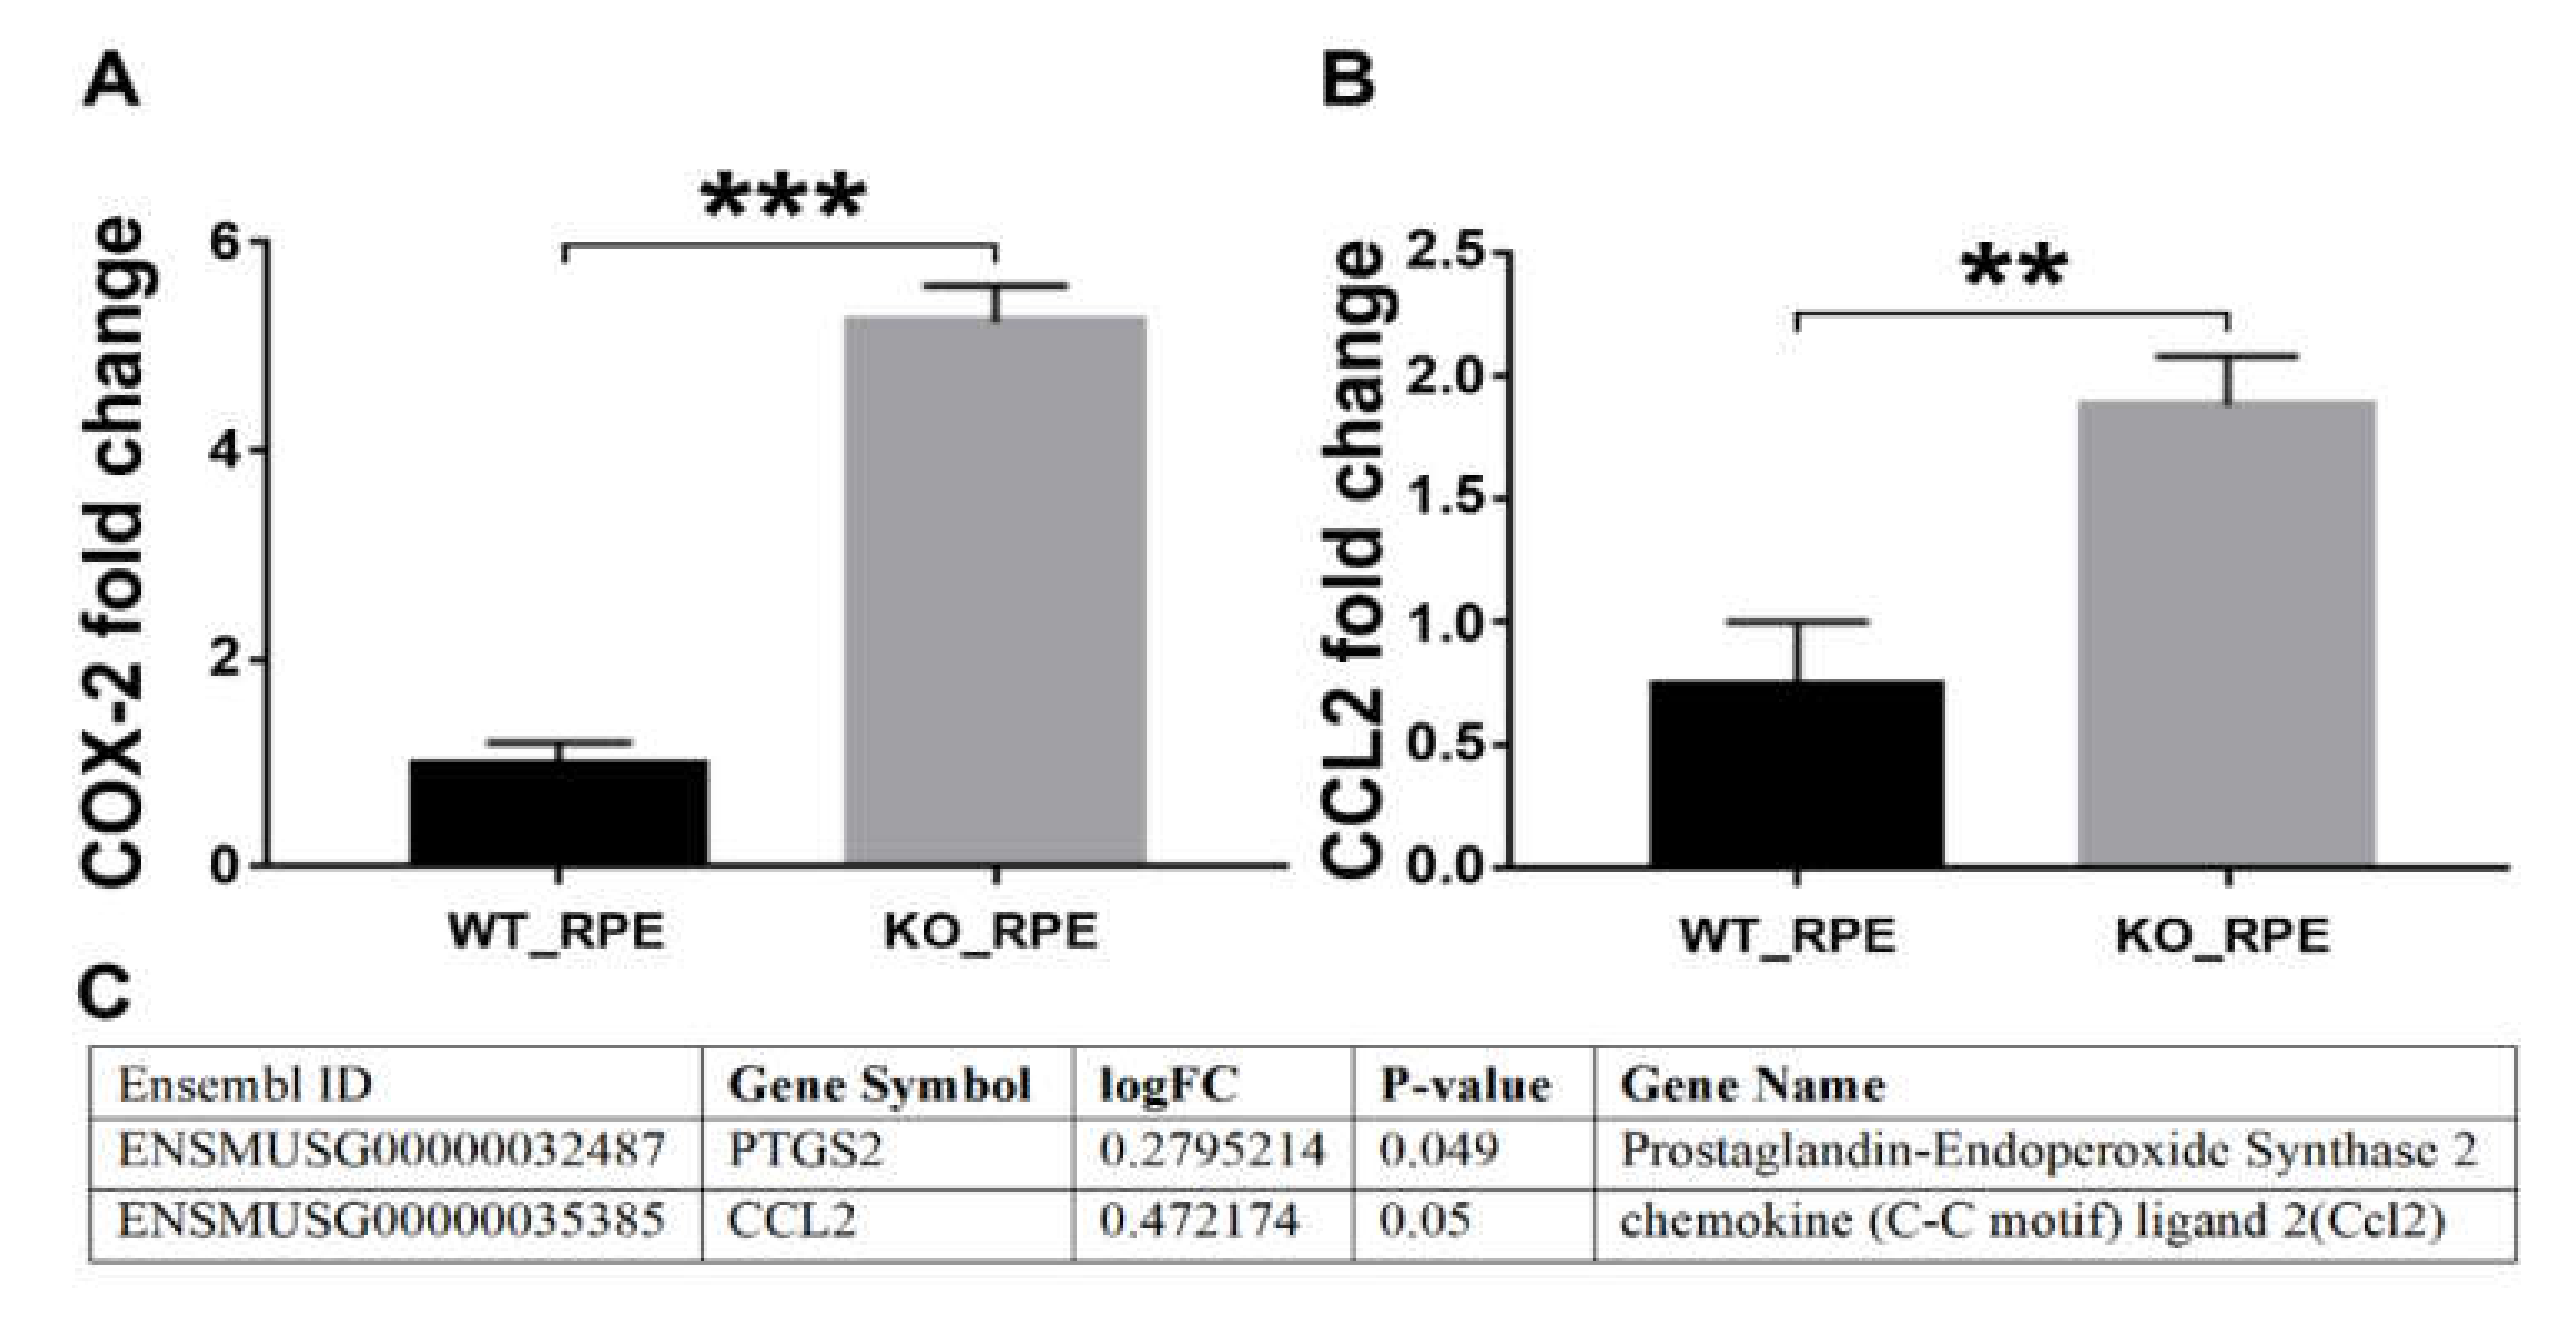
2.6. RT-PCR Validation of the RNA Seq Results

We performed RT-PCR for the Prostaglandin-Endoperoxide Synthase 2 (COX-2; Figure 6A) and chemokine ligand 2 (CCL2; Figure 6B) using the same RNA that was used in sequencing to validate the quality of the RNA-seq results. The data obtained by RT-PCR were consistent with RNA seq logFC change values (Figure 6C), confirming the high quality of the transcriptome data and its analysis.

3. Discussion

The RPE cells play a crucial role in the survival and function of the neural retina by maintaining ionic homeostasis at the subretinal space, prevent access of blood components to the neural retina and autoimmune response, which are in part attributed to the formation of the outer blood–retina barrier (BRB) [12]. Our previous studies suggested that CXCR5 signaling plays a protective role in the integrity of RPE cells to prevent the development of AMD-like pathological phenotypes in mice [5,8,9]. Further evidence supports the notion that CXCR5 is required for the homeostasis of RPE cells (Figure 1A, B, and unpublished data). It is established that chemokines are chemotactic cytokines that control migration and localization of various cell types such as immune cells and leukocytes by binding to the corresponding chemokine receptors [13]. However, the mechanisms through which chemokine receptor CXCR5 and ligand CXCL13 signal to regulate age-related macular degeneration have not been explored. In this study, we performed transcriptome profiling in CXCR5 KO relative to WT RPE cells. Principal component analysis, hierarchic cluster analysis, and Pearson coefficient correlation analysis indicate high sample quality and less variability among replicates and samples within the same experimental group. Using the defined DEGs, the most enriched functional pathways were: PI3K-Akt signaling pathway, FoxO signaling pathway, mTOR signaling pathway, focal adhesion, endocytosis, ubiquitin-mediated proteolysis, TNF-alpha NF-kB signaling pathway, adipogenesis genes, p53 signaling, Ras pathway, autophagy, epithelial–mesenchymal transition (EMT), and mitochondrial pathways. These pathways were highly enriched in CXCR5-KO RPE and may be involved in RPE cell dysfunction.
A closer analysis of the genes involved in the phosphatidylinositol 3-kinase (PI3K)/Akt/mTOR pathway indicated an upregulation of genes such as thrombospondin-1 (Thbs1), G protein-coupled receptor kinase 6 (Grk6), phosphoinositide-3-kinase regulatory subunit 3 (Pik3r3), mitogen-activated protein kinase-associated protein 1 (Mapkap1), folliculin interacting protein 1 (Fnip1), and frizzled class receptor 6 (Fzd6). This finding is in agreement with the study by Parrales et al. [12], which indicated that PI3K/Akt/mTOR signaling pathway mediates RPE cell dysfunctions. Another finding is the abnormal FoxO1 activity in CXCR5 KO RPE cells, as indicated by the upregulation of Tuberous sclerosis 1 (Tsc1) and downregulation of Tsc2 transcripts in KO RPE cells relative to WT control cells. Cao et al. established the interaction of FoxO1 with Tsc2, with the degradation of the latter, leading to decreased phosphorylation of Akt and FoxO1 and insulin resistance through activation of the mTOR pathway [14]. Indirectly, this theory is supported by dramatically reduced Insulin receptor transcripts and increased transcription of Insulin-like growth factor 1 (IGF-1) in CXCR5-deficient RPE cells suggestive of insulin resistance. Zheng and Quirion, 2009 [15] reported that IGF-1, whereas binding to its receptor induces autophosphorylation, then stimulates its intrinsic tyrosine kinase, leading to phosphorylation of numerous intracellular substrates like adaptor protein Shc and insulin receptor substrate-1, followed by the initiation of several signaling pathways, such as the phosphatidylinositol 3-kinase (PI3K)/protein kinase B (Akt) pathway and mitogen-activated protein kinase/extracellular signal-regulated kinase (MAPK/ERK).
The Arf family comprises six members of Arf1–6 and Arf-like proteins. Arfs are involved in the reorganization of the actin cytoskeleton and regulation of vesicle budding. ADP-ribosylation factor 6 (Arf6) is a small-GTPase protein that controls the membrane trafficking between the endosome and plasma membrane [16]. Arf1 is localized in the endosome and the Golgi, and it controls the coat protein used for intra-Golgi transport, membrane association of COPI, and retrograde transport from the cis-Golgi to the endoplasmic reticulum (ER). It also controls the membrane association of adaptor Proteins AP-1 and AP-3, which are adaptors for clathrin. These are used for endosome-to-lysosome transport and trans-Golgi network (TGN)-to-endosome transport, respectively. However, the Arf6 gene localizes to both the recycling endosome and the plasma membrane; then, it controls clathrin-dependent and independent endocytosis [17].
Our results identified many endocytosis genes and Golgi-related genes such as ArfGAP with GTPase domain, ankyrin repeat and PH domain 3 (Agap3), adaptor-related protein complex 2, mu 1 subunit (Ap2m1), ArfGAP with RhoGAP domain, ankyrin repeat and PH domain 2 (Arap2), ADP-ribosylation factor GTPase activating protein 1 (Arfgap1), ADP-ribosylation factor GTPase activating protein 3 (Arfgap3), ADP-ribosylation factor guanine nucleotide-exchange factor 2 (Arfgef2), Golgi-specific brefeldin A-resistance factor 1 (Gbf1), programmed cell death 6 interacting protein (Pdcd6ip), vacuolar protein sorting 37A (Vps37a), vacuolar protein sorting 37C (Vps37c) and BCL2-like 11 (apoptosis facilitator) respectively. This result correlates with Palacios et al., 2002 [18] finding that a lack of CXCR5 gene expression leads to a deficiency in the degradation of photoreceptor outer segments (POS) by RPE cells, as of the failure of POS-containing phagosomes to acidify appropriately as an effect of inhibition of the phagosome-lysosome fusion events. Reduced rates of POS degradation by RPE cells might lead to an accumulation of unprocessed material inside the cells. Wavre-Shapton et al., 2013 [19] reported that the defects in the engulfment of POS or their subsequent degradation are associated with inherited retinal degenerative diseases. Interestingly, a recent study [20] proposes a new role for endosomes, precisely early endosomes (EEs), in controlling complement-mediated inflammation. This is appropriate for the RPE as aberrant complement activity and improved inflammation, are accompanying with age-related macular degeneration and Stargardt inherited macular dystrophy.
TNF-α is a major regulator of RPE activation responses, including cell attachment, spreading, chemotaxis, migration, and proliferation [21]. Jin et al., 2000 [22] described the TNF-α stimulates cells by activating the receptors designated as TNF-α receptor (TNFR) type I (p55) and type II (p75). Activation of the TNFR leads to a cascade of events resulting in the activation of protein kinase A, protein kinase C, mitogen-activated protein kinase (MAPK), and ceramide-dependent protein kinase pathways. We have previously discussed that these MAPKs are critical in the proliferation and migration response of RPE to growth factors such as platelet-derived growth factor (PDGF) [22]. Marchiando et al., 2010 [23] proposed that TNF-α was induced a focal intrajunctional concentration of occludin followed by caveolin-1 (CAV-1)–dependent endocytosis in the intestinal epithelial cells. Caveolae have been involved in transcytosis, calcium signaling, endocytosis, and several other signal transduction events. Nuclear transcription factor (NF)-κB is a crucial regulator of numerous genes, as well as apoptosis-related genes and multiple inflammatory cytokine genes [21]. Xiao et al., 2003 [24] elucidated that TNF-α–induced apoptosis is disallowed by parallel TNF-α–the induced making of anti-apoptotic proteins, such as a cellular Fas-associated death domain (FADD)-like interleukin-1β-converting enzyme-like inhibitory protein (c-FLIP) and cellular inhibitor of apoptosis protein (c-IAP), a process mediated by NF-κB. Shinoura et al., 2010 [25] described that the NF-κB inhibition consequences in apoptosis in a different type of cell types that are formerly resistant to TNF-α–induced apoptosis.
Similarly, our results indicate that inhibitor of kappaB kinase gamma (Ikbkg), nuclear factor of kappa light polypeptide gene enhancer in B cells 2 (Nfkb2), TNF receptor-associated factor 3 (Traf3) and TNF receptor-associated factor 4 (Traf4) were up-regulated in CXCR5 deficient group. TNF superfamily members transcripts (M25, M26, M10B) were also highly up-regulated in KO RPE cells. Takahashi et al. reported [26] TNF-α-mediated EMT in RPE cells through transforming growth factor-β (TGF-β) signaling. Previously, we have also reported increased TNFα signaling in RPE/choroid complexes of the aged CXCR5 ko mice [8].
Among the most abundant transcripts identified in the KO RPE cells’, p63 and p53 family proteins (Trp63, Trp53inp2, Trp53inp1) that are known to be strongly associated with EMT in human keratinocytes [27], through enhanced TGF-β expression [28]. EMT can be suppressed by autophagy activation, thereby promoting RPE homeostasis. [29]. Autophagy is a cellular catabolic process in which damaged organelles and protein aggregates are degraded through several sequential processes: autophagy induction, autophagosome formation, autophagy-lysosome fusion, and autolysosome degradation [30]. Autophagy processes are controlled by approximately 20 transcription factors, 30 autophagy-related (ATG) genes, and 50 lysosomal hydrolases that are evolutionally conserved from yeast to mammal [31,32]. Autophagy processes are modulated by various pathophysiological conditions, such as amino acid starvation, and by intracellular signaling pathways, such as PI3K/AKT/mTOR pathway [33]. Like other cell types, RPE cells need autophagy function to maintain their homeostasis. In the RPE cells, autophagy is necessary for POS phagocytosis and visual cycle [34]. Cumulative evidence supports a protective function of autophagy for RPE cells from various stress conditions, such as oxidative damage [35]. In contrast, autophagy deregulation can cause damage to RPE cells and induce AMD pathologies, such as aberrant sub-RPE deposition and RPE degeneration [36,37].
In addition, many BRB (blood retinal barrier) transcripts were down-regulated in the CXCR5 KO RPE cells, and they include collagen, type II, alpha 1 (Col2a1), collagen, type IV, alpha 5 (Col4a5), collagen, type VI, alpha 5 (Col6a5), collagen, type VI, alpha 6 (Col6a6), integrin alpha 11 (Itga11), integrin beta 3 (Itgb3), laminin B1 (Lamb1) and laminin, gamma 1 (Lamc1) genes (Focal adhesion pathway). In RPE cells, collagens play a crucial role in the formation of the extracellular matrix. Impairment of this matrix leads to complement pathway activation and extracellular deposition [38]. This transcriptomic data may explain the abnormal cellular shape and impaired RPE cell monolayer observed in the current study in vitro (Figure 1B) and the previous reports [9] of impaired blood–retinal barrier and sub-RPE deposition of AMD associated proteins in the aged CXCR5-/- mice.
We have also observed the cytokines, chemokines, and prostaglandins such as IL13RA1, IL7, IL13RA2, CCL28, CCL2, PTGDR, PTGES3, PTGER2, PTGIS and PTGS2 (COX-2) to be up-regulated in CXCR5-deficient RPE which may suggest the involvement of RPE cells in pro-inflammation signaling and immune cells recruitment. Our previous ex-vivo experiments in aged CXCR5-deficient mice have indicated increased microglia migration to RPE cell layer sub-RPE infiltration with CD4+ cells, as well as increased expression of COX-2 in the mouse RPE-choroid complexes [39]. However, the exact cellular source of these genes has remained unclear. Thus, we have selected pro-inflammatory COX-2 and chemoattractant CCL2 genes for the transcriptome data validation. The RT-PCR results correlated with our transcriptome data analysis. In our results, up-regulation of COX-2 in primary CXCR5 KO RPE cultures suggestive of cellular distress, further promoting the notion of CXCR5 to play a homeostatic role in RPE cells and consistent with our findings, such as disrupted cellular monolayer (Figure 1B). COX-2 is a prominent inflammatory mediator and survival factor for RPE cells associated with inflammatory signaling, oxidative stress, and the promotion of autophagy [40]. The RT-PCR results have also revealed RPE cells as a direct source of COX-2 and CCL2 in CXCR5-deficient RPE cells. Studies have shown that several CC chemokines increase significantly after inflammation-associated retinal degeneration. In particular, the chemokine CCL2 is the most well characterized. Feng et al., 2010 [41] disclosed the expression of CCL2 and its receptor in activation and migration of microglia and monocytes induced by photoreceptor apoptosis. These findings indicate that the CCL2 system is required in retinal degeneration associated with CXCR5-deficiency, with RPE cells being a significant source of CCL2.
In summary, our investigation reveals that deficiency of CXCR5 abrogates CXCL13/CXCR5 signaling and this alters the normal PI3K-Akt signaling pathway, FoxO signaling pathway, mTOR signaling pathway, focal adhesion, endocytosis, ubiquitin-mediated proteolysis, TNF-alpha NF-kB signaling pathway, adipogenesis genes, p53 signaling, Ras pathway, autophagy, epithelial–mesenchymal transition (EMT), and mitochondrial pathways, leading to dysregulated RPE functioning, which may result in retinal degeneration that is observed in vivo [5,8,9]. The complex interplay between dysfunctional RPE, microglia, and immune cells, along with impaired blood–retinal barrier, requires further investigations. Still, existing data is strongly suggestive of a positive inflammatory feedback loop. Where lack of CXCR5 induce RPE homeostatic dysregulation, leading to increased pro-inflammatory signaling and photoreceptor apoptosis. These changes promote the recruitment of microglia and immune cells that can gain access to sub-RPE space and retina through an incompetent RPE monolayer. Immune cell activation produces more inflammatory and cell death, thus closing the loop.

4. Materials and Methods
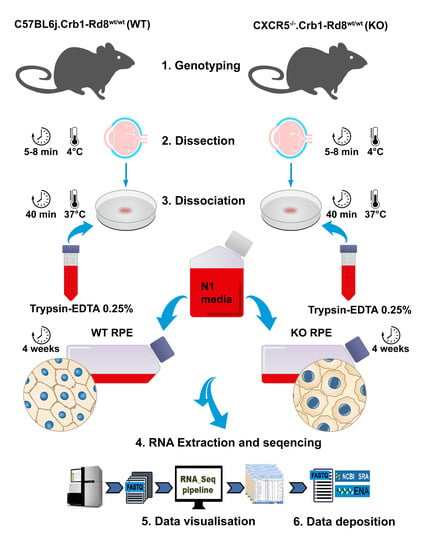
4.1. Animals

All experiments with mice were approved by the Institutional Animal Care and Use Committee (IACUC #9520) of the University of Missouri at 9 April 2019, and all animal experiments were conducted according to the guidelines of the ARVO (Association for Research in Vision and Ophthalmology). The (C57BL/6J) (WT) and (B6.129S2(Cg)-CXCR5tm1Lipp/J) (CXCR5-/-, KO) https://www.jax.org/strain/006659 (accessed on 31 May 2020) mice strains were purchased from Jackson Laboratory. We maintained all mice in specific pathogen-free animal facilities at the Bond Life Sciences Center, University of Missouri, USA, with fed normal chow diets and provided with water ad libitum. Genotyping was outsourced to TransnetYX (Cordova, TN, USA) www.transnetyx.com (accessed on 31 May 2020). Animals were validated for CXCR5 knockout and for the presence of the neomycin resistance gene. All mice were screened for the presence of Rd8-associated nucleotide deletion in the Crumbs homolog 1 (CRB1) gene, as reported previously [9] and found to be Rd8 mutation-negative. The correctness of resulting datasets was also validated by checking for the presence of CXCR5 transcripts in all wild-type control and absence in CXCR5 knockout datasets (Table 3).

4.2. Primary RPE Cell Cultures and Treatment

Following mice sacrifice by CO2 inhalation, RPE cells were isolated from adult (6-mo-old) WT and KO mice. This was done by carefully dissecting the eye globe on ice to remove the anterior chamber and retina. The resulting eyecup was then incubated with trypsin Gibco™ Trypsin-EDTA (0.25%) for 40 min, with the RPE cell layer facing down. Following initial digestion, RPE cells were released by gentle shaking of the eyecup using sterile forceps. The isolated RPE cells were then cultured with an N1 complete medium in a 6-well plate coated with Attachment Factor™ (4Z0-201; Cell Systems). Cells were grown according to the protocol described by Johnson et al., for primary human RPE [42]. Cells were grown until robust pigmented RPE monolayer was formed.

4.3. Immunofluorescence Staining

For immunohistochemistry evaluation, the isolated RPE cells were grown on cellulose matrix with a pore size of 0.45 µm (R9NA09917, Millicell, MilliporeSigma, Burlington, MA, USA) for four weeks in N1 media. The protocol of growing RPE cell culture on the porous substrate was a modification of a previous protocol described by Johnson et al., described for primary human RPE [43]. The substrate is meant to imitate Bruch’s membrane. After four weeks of growth, the cells were fixed with HistoChoice Molecular Biology fixative (VWR Life Science, Missouri, TX, USA) for 10 min, permeabilized with 0.05% Triton X-100 for 10 min, and blocked with 5% normal goat serum (NGA; 50062Z, Thermo Fisher Scientific, Waltham, MA, USA) for 1 hour at RT. The samples were then incubated with the primary antibody, RPE65 (1:50; MA1-16578; Thermo Fisher Scientific, Waltham, MA), and ZO-1 (1:100; 61-7300; Thermo Fisher Scientific, Waltham, MA, USA). The samples were then washed with Phosphate-Buffer-Saline (PBS; 1967729, Thermo Fisher Scientific, Waltham, MA, USA) and 0.05% Tween-20 (PBS-T; 1392C184; Amresco, Solon, OH, USA) and then incubated with secondary antibody: goat anti-rabbit IgG (H + L), Cyanine5 (A10523, 1:1000; Thermo Fisher Scientific, Waltham, MA, USA), goat anti-rabbit IgG (H+L), Alexa Fluor 488 (A-11034, 1:1000, Thermo Fisher Scientific, Waltham, MA, USA) and goat anti-mouse IgG (H + L), Cyanine5 (A10524, 1:1000, Thermo Fisher Scientific, Waltham, MA, USA). The cell nuclei were stained counterstained with 4′,6-diamidino-2-phenylindole (DAPI; 1:5000; D9542 MilliporeSigma, Burlington, MA, USA). ProLong Diamond antifade reagent (Thermo Fisher Scientific, Waltham, MA, USA) was used for mounting.

4.4. Imaging

Fluorescent images were acquired using a LeicaSP8 laser confocal microscope (Leica AG, Wetzlar, Germany). Max intensity projection was used in representative figures.

4.5. RNA Isolation and Sequencing

Confluent RPE cells were harvested for the total RNA isolation using RNA Easy Mini RNA Isolation Kit (Qiagen, Germantown, MD, USA). Isolated RNA was submitted to the Novogene Leading Edge Genomic Services & Solutions, (Sacramento, CA, USA) for library preparation and sequencing. In summary, Agilent 2100 Bioanalyzer was used to verify the quality of the isolated RNA. DNAse treatment was performed to eliminate DNA from the sample. The Illumina HiSeq 2500 was used for RNA sequencing. The sequencing experiment was performed according to the manufacturer’s instructions (Illumina, San Diego, CA, USA). TruSeq library generation kits were used. Library construction was performed using random fragmentation of the poly A+ mRNA, along with cDNA production using random primers. Clusters were produced nearly 725K–825K clusters/mm2. The run after the first base addition parameters were assessed, then cluster density and quality determined. The cDNA sequences were aligned to the reference genome mouse (mm10), and then paired-end sequencing runs were performed. A total of approximately 15 million paired, 50 bp reads per sample were obtained. The raw RNA-Seq datasets are deposited to the NCBI-SRA (Sequence Read Archive (SRA) with accession numbers, SRA No: SRP251872; BioProject: PRJNA610827.

4.6. Bioinformatics Analysis

A total of six RNA-seq datasets was generated, three from CXCR5 knockout (KO RPE_1, KO RPE _2, KO RPE _3), and three from control (WT RPE_1, WT RPE _2, WT RPE _3) RPE cells. The raw fastq reads were trimmed for adapters and pre-processed to remove low-quality reads using Trimmomatic v.0.36 using the default parameter setting for Illumina paired-end reads. Cleaning and trimming of low-quality reads and adaptor removal lead to retention of more than 96% of good quality reads in each stage (Table S1).
The raw data was used for visualization of reads before and after pre-processing by using FastQC software: https://www.bioinformatics.babraham.ac.uk/projects/fastqc/ (accessed on 31 May 2020). The distribution of the raw sequences was quantified. The processed datasets were mapped to the mouse reference genome (mm10) with HISAT2 http://daehwankimlab.github.io/hisat2/ (accessed on 31 May 2020). with default parameters [44]. The alignment results showed that 98.15% reads aligned with the reference genome.

4.7. Gene Expression Analysis

Gene expression was calculated using high-quality reads. Differentially expressed genes were identified using the DESeq2 v 1.20 package in R software v 3.2.2 http://www.R-project.org (accessed on 31 May 2020). Both WT and KO comparison transcript counts (matrix file) were used for differential gene expression analysis using the DESeq2 package of Bioconductor with primary parameters such as FDR (false discovery rate), logFC (log fold-change) and p-value set at default. Unigenes with an FDR (False Discovery Rate) value < 1.0, fold change greater than 0.2 and less than −0.2 (logFC ± 0.2), and the p-value is less than 0.05 were considered as significantly differentially expressed genes (DEGs). These genes were used for further functional gene annotation analysis.

4.8. Functional Annotation

Gene ontology (GO) enrichment analysis was initially performed using the DAVID annotation database (The Database for Annotation, Visualization, and Integrated Discovery, https://david.ncifcrf.gov/ (accessed on 31 May 2020) [45,46]. Functional Annotation Clustering was used for the molecular function (MF), biological process (BP), and cellular component (CC) categorization [47,48]. GO terms that had the lowest p-values in each cluster, as well as low FDR values, were selected for further analysis. The total number of genes included in all of the listed GO terms was considered as significantly enriched within the gene set.
Protein-protein network analysis using the DEGs was performed using the STRING 10.5 database https://string-db.org/ (accessed on 31 May 2020) outputs such as Gene Ontology, KEGG, Pfam, and InterPro were analyzed. STRING software employs a Fisher’s exact test, followed by a correction for multiple testing [49,50].

4.9. Quantitative RT-PCR

The same RNA samples described in 4.5 above were reverse transcribed to cDNA using SuperScript VILO cDNA Synthesis Kit (Invitrogen, Thermo Fisher Scientific, Waltham, MA, USA) in SimpliAmp Thermal Cycler (Thermo Fisher Scientific, Waltham, MA). SYBR green chemistry was used with SYBR Green Master Mix (4344463, Thermo Fisher Scientific, Waltham, MA, USA). The following mouse-specific primers were used to amplify target genes: COX-2 by Sanchez et al., [51] (forward: GCGAGCTAAGAGCTTCAGGA, reverse: CAGACGCCACTGTCGCTTT), CCL2 by Schiller et al., [52] (forward: GAAGGAATGGGTCCAGACAT, reverse: ACGGGTCAACTTCACATTCA), and GAPDH as "housekeeping" gene by Tsujita et al., [53] (forward: CATGGCCTTCCGTGTTCCTA, reverse: TGTCATCATACTTGGCAGGTTTC) in a Quant Studio 3 RT-PCR system (Applied Biosystems, Thermo Fisher Scientific, Waltham, MA, USA). The expression of the target genes was normalized to that of GAPDH. Fold change was calculated using the relative quantification (2−ΔΔCT) method. Three biological replicates per group were used with three technical replicates for each experiment.

4.10. Statistical Analysis

All numeric values were expressed as the mean ± standard deviation (SD) for the respective groups. Statistical analysis was performed using the DESeq2 R-package https://bioconductor.org/packages/release/bioc/html/DESeq2.html (accessed on 31 May 2020). The Students’ test was used when comparing two groups. Benjamin–Hochberg corrections were also used to correct for multiple comparisons. A p-value of less than 0.05 was considered significant.

5. Statement of Limitations

  • The small number of samples in this study limits the depth of the identified DEGs.
  • Significant variability of the obtained samples, as indicated by Fig. 1G, H. The cell culture system is sensitive to various factors such as environmental factors during sample isolation, culture, and extraction. The primary cell culture has also inherited variability from the animals that have become the donors of the cells. This aspect further limits the dept of this study.
  • Freshly isolated cells may be a preferable source of RNA to study the effects of CXCR5 in the RPE. However, fresh isolates of mouse RPE are technically challenging to produce due to the low number of cells available from each eye. The pooling of the significant number of mice is required to achieve levels of RNA suitable for sequencing. Mechanical isolation produces isolates of the poor purity with contamination from choroidal vasculature and other cell types. Trypsin dissociation has an issue of purity in the immediate dissociate (culture in N1 media produce positive proliferative pressure promoting growth and differentiation specifically of RPE cells but no other cell types, i.e., endothelial cells). Trypsin exposure produces its effects on various genes and pathways (i.e., activation of Protease-activated receptor 2 pathway). Primary RPE cultures could exclude indirect or paracrine effects from other retinal tissues (i.e., choriocapillaris, microglia, and photoreceptors) and rule out the systemic effect of global CXCR5 knockout.

6. Conclusions

In conclusion, a transcriptome-wide gene expression signature of mouse RPE cells is described based on extensive bioinformatics analysis of RNA sequencing data. The study reveals a list of candidate genes that may be important for mediating retinal/macular diseases. These genes may represent potential molecular markers for assessing the integrity and function of RPE. These findings give insight into the molecular signaling mechanisms of CXCR5 deficiency in RPE cell dysfunction and in the pathophysiology of AMD disease.

Supplementary Materials

Supplementary materials can be found at https://0-www-mdpi-com.brum.beds.ac.uk/2227-9059/8/6/147/s1.

Author Contributions

The study was conceived and designed by M.S.S., A.L., and H.H., A.L. have isolated and cultured primary RPE cells and conducted immunofluorescent observations in RPE monolayer. A.L. extracted RNA and performed sample quality evaluations and RT-PCR validations. M.S.S. has performed data quality checks, reference genome assembly, gene expression analysis, gene ontology, functional pathway analysis, and gene–gene network analysis. M.S.S., A.L., and A.M. have designed the figures and performed the statistical analysis. The manuscript was written by M.S.S., A.L., A.M., and H.H. and critically revised by M.S.S., A.L., A.M., and H.H. All authors have read and agreed to the published version of the manuscript.

Funding

This work was supported by the University of Missouri start-up funds (Hu Huang) and National Eye Institute (NEI), Bethesda, MD, USA grant EY027824.

Acknowledgments

The authors wish to acknowledge the contribution of the Division of Information Technology, University of Missouri (Columbia, MO, USA) for High-Performance Computing (HPC) facilities. Authors also wish to acknowledge the contribution of Ms. Catherine J. Brooks for RPE culture maintenance and assistance with the RNA extraction process, Ms. Lijuan Fan, for animal resources and general benchwork assistance.

Conflicts of Interest

The authors have no conflict of interest to disclose in relation to this paper. The funders had no role in the design of the study; in the collection, analysis, or interpretation of data; in the writing of the manuscript; in the decision to publish the results.

References

  1. Wong, W.L.; Su, X.; Li, X.; Cheung, C.M.; Klein, R.; Cheng, C.Y.; Wong, T.Y. Global prevalence of age-related macular degeneration and disease burden projection for 2020 and 2040: A systematic review and meta-analysis. Lancet Glob Health 2014, 2, e106–e116. [Google Scholar] [CrossRef] [Green Version]
  2. Jager, R.D.; Mieler, W.F.; Miller, J.W. Age-related macular degeneration. N. Engl. J. Med. 2008, 358, 2606–2617. [Google Scholar] [CrossRef] [PubMed] [Green Version]
  3. Miller, J.W.; Le Couter, J.; Strauss, E.C.; Ferrara, N. Vascular endothelial growth factor a in intraocular vascular disease. Ophthalmology 2013, 120, 106–114. [Google Scholar] [CrossRef] [PubMed]
  4. Wang, K.; Peng, B.; Lin, B. Fractalkine receptor regulates microglial neurotoxicity in an experimental mouse glaucoma model. Glia 2014, 62, 1943–1954. [Google Scholar] [CrossRef]
  5. Cao, X.; Li, W.; Liu, Y.; Huang, H.; Ye, C.H. The Anti-Inflammatory Effects of CXCR5 in the Mice Retina following Ischemia-Reperfusion Injury. Biomed Res. Int. 2019, 2019, 3487607. [Google Scholar] [CrossRef]
  6. Mitkin, N.A.; Hook, C.D.; Schwartz, A.M.; Biswas, S.; Kochetkov, D.V.; Muratova, A.M.; Afanasyeva, M.A.; Kravchenko, J.E.; Bhattacharyya, A.; Kuprash, D.V. p53-dependent expression of CXCR5 chemokine receptor in MCF-7 breast cancer cells. Sci. Rep. 2015, 5, 9330. [Google Scholar] [CrossRef] [Green Version]
  7. Zhang, Q.; Cao, D.L.; Zhang, Z.J.; Jiang, B.C.; Gao, Y.J. Chemokine CXCL13 mediates orofacial neuropathic pain via CXCR5/ERK pathway in the trigeminal ganglion of mice. J. Neuroinflamm. 2016, 13, 183. [Google Scholar] [CrossRef] [Green Version]
  8. Huang, H.; Liu, Y.; Wang, L.; Li, W. Age-related macular degeneration phenotypes are associated with increased tumor necrosis-alpha and subretinal immune cells in aged Cxcr5 knockout mice. PLoS ONE 2017, 12, e0173716. [Google Scholar] [CrossRef]
  9. Lennikov, A.; Saddala, M.S.; Mukwaya, A.; Tang, S.; Huang, H. Autoimmune-Mediated Retinopathy in CXCR5-Deficient Mice as the Result of Age-Related Macular Degeneration Associated Proteins Accumulation. Front. Immunol. 2019, 10, 1903. [Google Scholar] [CrossRef] [Green Version]
  10. Saddala, M.S.; Lennikov, A.; Mukwaya, A.; Fan, L.; Hu, Z.; Huang, H. Transcriptome-wide analysis of differentially expressed chemokine receptors, SNPs, and SSRs in the age-related macular degeneration. Human Genomics 2019, 13, 15. [Google Scholar] [CrossRef] [Green Version]
  11. Ambati, J.; Fowler, B.J. Mechanisms of age-related macular degeneration. Neuron 2012, 75, 26–39. [Google Scholar] [CrossRef] [PubMed] [Green Version]
  12. Parrales, A.; Lopez, E.; Lopez-Colome, A.M. Thrombin activation of PI3K/PDK1/Akt signaling promotes cyclin D1 upregulation and RPE cell proliferation. Biochim. Biophys. Acta 2011, 1813, 1758–1766. [Google Scholar] [CrossRef] [PubMed] [Green Version]
  13. Ambati, J.; Anand, A.; Fernandez, S.; Sakurai, E.; Lynn, B.C.; Kuziel, W.A.; Rollins, B.J.; Ambati, B.K. An animal model of age-related macular degeneration in senescent Ccl-2- or Ccr-2-deficient mice. Nat. Med. 2003, 9, 1390–1397. [Google Scholar] [CrossRef] [PubMed]
  14. Cao, Y.; Kamioka, Y.; Yokoi, N.; Kobayashi, T.; Hino, O.; Onodera, M.; Mochizuki, N.; Nakae, J. Interaction of FoxO1 and TSC2 induces insulin resistance through activation of the mammalian target of rapamycin/p70 S6K pathway. J. Biol. Chem. 2006, 281, 40242–40251. [Google Scholar] [CrossRef] [Green Version]
  15. Zheng, W.H.; Quirion, R. Glutamate acting on N-methyl-D-aspartate receptors attenuates insulin-like growth factor-1 receptor tyrosine phosphorylation and its survival signaling properties in rat hippocampal neurons. J. Biol. Chem. 2009, 284, 855–861. [Google Scholar] [CrossRef] [Green Version]
  16. Tanabe, K.; Torii, T.; Natsume, W.; Braesch-Andersen, S.; Watanabe, T.; Satake, M. A novel GTPase-activating protein for ARF6 directly interacts with clathrin and regulates clathrin-dependent endocytosis. Mol. Biol. Cell 2005, 16, 1617–1628. [Google Scholar] [CrossRef] [Green Version]
  17. Naslavsky, N.; Weigert, R.; Donaldson, J.G. Convergence of non-clathrin- and clathrin-derived endosomes involves Arf6 inactivation and changes in phosphoinositides. Mol. Biol. Cell 2003, 14, 417–431. [Google Scholar] [CrossRef] [Green Version]
  18. Palacios, F.; Schweitzer, J.K.; Boshans, R.L.; D’Souza-Schorey, C. ARF6-GTP recruits Nm23-H1 to facilitate dynamin-mediated endocytosis during adherens junctions disassembly. Nat. Cell Biol. 2002, 4, 929–936. [Google Scholar] [CrossRef]
  19. Wavre-Shapton, S.T.; Tolmachova, T.; Lopes da Silva, M.; Futter, C.E.; Seabra, M.C. Conditional ablation of the choroideremia gene causes age-related changes in mouse retinal pigment epithelium. PLoS ONE 2013, 8, e57769. [Google Scholar] [CrossRef]
  20. Jane-wit, D.; Surovtseva, Y.V.; Qin, L.; Li, G.; Liu, R.; Clark, P.; Manes, T.D.; Wang, C.; Kashgarian, M.; Kirkiles-Smith, N.C.; et al. Complement membrane attack complexes activate noncanonical NF-kappaB by forming an Akt+ NIK+ signalosome on Rab5+ endosomes. Proc. Natl. Acad. Sci. USA 2015, 112, 9686–9691. [Google Scholar] [CrossRef] [Green Version]
  21. Yang, p.; McKay, B.S.; Allen, J.B.; Jaffe, G.J. Effect of NF-kappa B inhibition on TNF-alpha-induced apoptosis in human RPE cells. Investig. Ophthalmol. Vis. Sci. 2004, 45, 2438–2446. [Google Scholar] [CrossRef] [PubMed] [Green Version]
  22. Jin, M.; He, S.; Worpel, V.; Ryan, S.J.; Hinton, D.R. Promotion of adhesion and migration of RPE cells to provisional extracellular matrices by TNF-alpha. Investig. Ophthalmol. Vis. Sci. 2000, 41, 4324–4332. [Google Scholar]
  23. Marchiando, A.M.; Shen, L.; Graham, W.V.; Weber, C.R.; Schwarz, B.T.; Austin, J.R., 2nd; Raleigh, D.R.; Guan, Y.; Watson, A.J.; Montrose, M.H.; et al. Caveolin-1-dependent occludin endocytosis is required for TNF-induced tight junction regulation in vivo. J. Cell Biol. 2010, 189, 111–126. [Google Scholar] [CrossRef] [PubMed] [Green Version]
  24. Xiao, C.W.; Yan, X.; Li, Y.; Reddy, S.A.; Tsang, B.K. Resistance of human ovarian cancer cells to tumor necrosis factor alpha is a consequence of nuclear factor kappaB-mediated induction of Fas-associated death domain-like interleukin-1beta-converting enzyme-like inhibitory protein. Endocrinology 2003, 144, 623–630. [Google Scholar] [CrossRef] [PubMed] [Green Version]
  25. Shinoura, N.; Yamamoto, N.; Yoshida, Y.; Fujita, T.; Saito, N.; Asai, A.; Kirino, T.; Hamada, H. Adenovirus-mediated gene transduction of IkappaB or IkappaB plus Bax gene drastically enhances tumor necrosis factor (TNF)-induced apoptosis in human gliomas. Jpn J. Cancer Res. 2000, 91, 41–51. [Google Scholar] [CrossRef]
  26. Takahashi, E.; Nagano, O.; Ishimoto, T.; Yae, T.; Suzuki, Y.; Shinoda, T.; Nakamura, S.; Niwa, S.; Ikeda, S.; Koga, H.; et al. Tumor necrosis factor-alpha regulates transforming growth factor-beta-dependent epithelial-mesenchymal transition by promoting hyaluronan-CD44-moesin interaction. J. Biol. Chem. 2010, 285, 4060–4073. [Google Scholar] [CrossRef] [Green Version]
  27. Oh, J.E.; Kim, R.H.; Shin, K.H.; Park, N.H.; Kang, M.K. DeltaNp63alpha protein triggers epithelial-mesenchymal transition and confers stem cell properties in normal human keratinocytes. J. Biol. Chem. 2011, 286, 38757–38767. [Google Scholar] [CrossRef] [Green Version]
  28. Lindsay, J.; McDade, S.S.; Pickard, A.; McCloskey, K.D.; McCance, D.J. Role of DeltaNp63gamma in epithelial to mesenchymal transition. J. Biol. Chem. 2011, 286, 3915–3924. [Google Scholar] [CrossRef] [Green Version]
  29. Feng, H.; Zhao, X.; Guo, Q.; Feng, Y.; Ma, M.; Guo, W.; Dong, X.; Deng, C.; Li, C.; Song, X.; et al. Autophagy resists EMT process to maintain retinal pigment epithelium homeostasis. Inter. J. Biol. Sci. 2019, 15, 507–521. [Google Scholar] [CrossRef] [Green Version]
  30. Mizushima, N. Autophagy: Process and function. Genes Dev. 2007, 21, 2861–2873. [Google Scholar] [CrossRef] [Green Version]
  31. Lee, J.; Giordano, S.; Zhang, J. Autophagy, mitochondria and oxidative stress: Cross-talk and redox signalling. Biochem. J. 2012, 441, 523–540. [Google Scholar] [CrossRef] [PubMed] [Green Version]
  32. Fullgrabe, J.; Ghislat, G.; Cho, D.H.; Rubinsztein, D.C. Transcriptional regulation of mammalian autophagy at a glance. J. Cell Sci. 2016, 129, 3059–3066. [Google Scholar] [CrossRef] [PubMed] [Green Version]
  33. Heras-Sandoval, D.; Perez-Rojas, J.M.; Hernandez-Damian, J.; Pedraza-Chaverri, J. The role of PI3K/AKT/mTOR pathway in the modulation of autophagy and the clearance of protein aggregates in neurodegeneration. Cell Signal 2014, 26, 2694–2701. [Google Scholar] [CrossRef] [PubMed]
  34. Kim, J.Y.; Zhao, H.; Martinez, J.; Doggett, T.A.; Kolesnikov, A.V.; Tang, P.H.; Ablonczy, Z.; Chan, C.C.; Zhou, Z.; Green, D.R.; et al. Noncanonical autophagy promotes the visual cycle. Cell 2013, 154, 365–376. [Google Scholar] [CrossRef] [Green Version]
  35. Mitter, S.K.; Song, C.; Qi, X.; Mao, H.; Rao, H.; Akin, D.; Lewin, A.; Grant, M.; Dunn, W., Jr. Dysregulated autophagy in the RPE is associated with increased susceptibility to oxidative stress and AMD. Autophagy 2014, 10, 1989–2005. [Google Scholar] [CrossRef] [PubMed] [Green Version]
  36. Golestaneh, N.; Chu, Y.; Xiao, Y.Y.; Stoleru, G.L.; Theos, A.C. Dysfunctional autophagy in RPE, a contributing factor in age-related macular degeneration. Cell Death Dis. 2017, 8, e2537. [Google Scholar] [CrossRef]
  37. Valapala, M.; Wilson, C.; Hose, S.; Bhutto, I.A.; Grebe, R.; Dong, A.; Greenbaum, S.; Gu, L.; Sengupta, S.; Cano, M.; et al. Lysosomal-mediated waste clearance in retinal pigment epithelial cells is regulated by CRYBA1/betaA3/A1-crystallin via V-ATPase-MTORC1 signaling. Autophagy 2014, 10, 480–496. [Google Scholar] [CrossRef] [Green Version]
  38. Fernandez-Godino, R.; Bujakowska, K.M.; Pierce, E.A. Changes in extracellular matrix cause RPE cells to make basal deposits and activate the alternative complement pathway. Human Mol. Genet. 2017, 27, 147–159. [Google Scholar] [CrossRef] [Green Version]
  39. Bermudez, V.; Tenconi, P.E.; Giusto, N.M.; Mateos, M.V. Lipopolysaccharide-Induced Autophagy Mediates Retinal Pigment Epithelium Cells Survival. Modulation by the Phospholipase D Pathway. Front. Cell Neurosci. 2019, 13, 154. [Google Scholar] [CrossRef]
  40. Richter, M.; Weiss, M.; Weinberger, I.; Furstenberger, G.; Marian, B. Growth inhibition and induction of apoptosis in colorectal tumor cells by cyclooxygenase inhibitors. Carcinogenesis 2001, 22, 17–25. [Google Scholar] [CrossRef] [Green Version]
  41. Feng, C.; Wang, X.; Liu, T.; Zhang, M.; Xu, G.; Ni, Y. Expression of CCL2 and its receptor in activation and migration of microglia and monocytes induced by photoreceptor apoptosis. Mol. Vis. 2017, 23, 765–777. [Google Scholar]
  42. Fronk, A.H.; Vargis, E. Methods for culturing retinal pigment epithelial cells: A review of current protocols and future recommendations. J. Tissue Eng. 2016, 7, 2041731416650838. [Google Scholar] [CrossRef] [Green Version]
  43. Johnson, L.V.; Forest, D.L.; Banna, C.D.; Radeke, C.M.; Maloney, M.A.; Hu, J.; Spencer, C.N.; Walker, A.M.; Tsie, M.S.; Bok, D.; et al. Cell culture model that mimics drusen formation and triggers complement activation associated with age-related macular degeneration. Proc. Natl. Acad. Sci. USA 2011, 108, 18277–18282. [Google Scholar] [CrossRef] [PubMed] [Green Version]
  44. Kim, D.; Paggi, J.M.; Park, C.; Bennett, C.; Salzberg, S.L. Graph-based genome alignment and genotyping with HISAT2 and HISAT-genotype. Nat. Biotech. 2019, 37, 907–915. [Google Scholar] [CrossRef] [PubMed]
  45. Saddala, M.S.; Lennikov, A.; Bouras, A.; Huang, H. RNA-Seq reveals differential expression profiles and functional annotation of genes involved in retinal degeneration in Pde6c mutant Danio rerio. BMC Genom. 2020, 21, 132. [Google Scholar] [CrossRef] [PubMed] [Green Version]
  46. Saddala, M.S.; Lennikov, A.; Huang, H. Placental growth factor regulates the pentose phosphate pathway and antioxidant defense systems in human retinal endothelial cells. J. Proteom. 2020, 217, 103682. [Google Scholar] [CrossRef] [PubMed]
  47. Huang, D.W.; Sherman, B.T.; Tan, Q.; Kir, J.; Liu, D.; Bryant, D.; Guo, Y.; Stephens, R.; Baseler, M.W.; Lane, H.C.; et al. DAVID Bioinformatics Resources: Expanded annotation database and novel algorithms to better extract biology from large gene lists. Nucleic Acids Res. 2007, 35, W169–W175. [Google Scholar] [CrossRef]
  48. Saddala, M.S.; Lennikov, A.; Grab, D.J.; Liu, G.S.; Tang, S.; Huang, H. Proteomics reveals ablation of PlGF increases antioxidant and neuroprotective proteins in the diabetic mouse retina. Sci. Rep. 2018, 8, 16728. [Google Scholar] [CrossRef] [Green Version]
  49. Wang, Z.; Gerstein, M.; Snyder, M. RNA-Seq: A revolutionary tool for transcriptomics. Nat. Rev. Genet. 2009, 10, 57–63. [Google Scholar] [CrossRef]
  50. Rivals, I.; Personnaz, L.; Taing, L.; Potier, M.C. Enrichment or depletion of a GO category within a class of genes: Which test? Bioinformatics 2007, 23, 401–407. [Google Scholar] [CrossRef]
  51. Sanchez Miranda, E.; Perez Ramos, J.; Fresan Orozco, C.; Zavala Sanchez, M.A.; Perez Gutierrez, S. Anti-Inflammatory Effects of Hyptis albida Chloroform Extract on Lipopolysaccharide-Stimulated Peritoneal Macrophages. ISRN Pharmacol. 2013, 2013, 713060. [Google Scholar] [CrossRef] [PubMed]
  52. Schiller, K.R.; Zillhardt, M.R.; Alley, J.; Borjesson, D.L.; Beitz, A.J.; Mauro, L.J. Secretion of MCP-1 and other paracrine factors in a novel tumor-bone coculture model. BMC Cancer 2009, 9, 45. [Google Scholar] [CrossRef] [PubMed] [Green Version]
  53. Tsujita, Y.; Muraski, J.; Shiraishi, I.; Kato, T.; Kajstura, J.; Anversa, P.; Sussman, M.A. Nuclear targeting of Akt antagonizes aspects of cardiomyocyte hypertrophy. Proc. Natl. Acad. Sci. USA 2006, 103, 11946–11951. [Google Scholar] [CrossRef] [PubMed] [Green Version]
Figure 1. Representative double immunofluorescent staining images of ZO-1 and RPE65 in wild-type (WT) (A) and CXCR5-deficient (B) retinal pigment epithelium (RPE) cells cultured on supporting cellulose substrate. Identification and correction of batch effects: (C) Box plot before and (D) after normalization; (E) Density plot before and (F) after normalization; PCA plot before (G) and (H) after normalization.
Biomedicines 08 00147 g001
Figure 2. Differentially expressed genes (DEGs) visualization and gene ontology. All detected genes are plotted as an (A) MA plot and (B) volcano plot. Genes that pass a threshold of p-value <  0.05, padj <  0.05, and log2foldChange  >  0.2 in differential expression analysis were designated by red (up-regulated) and blue (down-regulated) in KO relative to WT control RPE cells. DEGs involved in various gene ontology enrichment (C) biological process, (D), cellular component, and (E) molecular functions, respectively. The FDR < 0.05, p-value < 0.05 are considered as statistical significances.
Biomedicines 08 00147 g002
Figure 3. Functional pathway enrichment network analysis. The differentially expressed genes (DEGs) involved various pathways like PI3K-Akt signaling pathway, focal adhesion, Ras pathway, endocytosis, p53 signaling, Adipogenesis pathway, mTOR signaling pathway, FoxO signaling pathway, ubiquitin-mediated proteolysis, TNF-alpha NF-kB signaling pathway respectively. The FDR < 0.05, p-value < 0.05 are considered as statistical significances.
Biomedicines 08 00147 g003
Figure 4. The DEGs are involved pathways like (A) PI3K-Akt signaling pathway, (B) TNF-α NF-κB signaling pathway respectively. The up-regulated and down-regulated genes extend edge to the center point were based on the logFC values. The negative values indicate the down-regulated genes, and positive values indicate the up-regulated genes in KO RPE versus WT RPE.0.
Biomedicines 08 00147 g004
Figure 5. Gene–gene interaction network analysis. (A) PI3K-Akt signaling pathway genes network, (B) mTOR signaling pathway genes network, (C) TNF-alpha NF-κB Signaling Pathway genes network, and (D) FoxO signaling pathway genes network.
Biomedicines 08 00147 g005
Figure 6. Quantitative RT-PCR analysis of (A) Prostaglandin-Endoperoxide Synthase 2 (COX-2) and (B) chemokine ligand 2 (CCL2) in WT and CXCR5-deficient RPE (n = 3). The Student’s t-test was used to determine statistical significance between the two groups. ** p < 0.05; *** p < 0.01. (C) RNA-seq values of logFC and p-value for COX-2 and CCL2. The positive logFC values indicate up-regulated genes, and negative values indicate down-regulated genes in CXCR5-deficient RPE cells relative to WT controls.
Biomedicines 08 00147 g006
Table 1. List of PI3K-Akt signaling pathway genes with logFC, p-value, and FDR value.
Gene SymbolGene NamelogFC 1p-valueFDR
Atf2Activating transcription factor 2−0.766760.0001480.041635
Bcl2l11BCL2-like 11 (apoptosis facilitator)−0.766760.0001480.041635
BdnfBrain derived neurotrophic factor0.5791280.0029260.27166
Ccnd1Cyclin D10.6195930.0162610.72475
Ccnd2Cyclin D20.3817980.0337780.986212
Ccnd3Cyclin D3−0.705710.0142370.672932
Cdkn1aCyclin-dependent kinase inhibitor 1A (P21)0.6004350.0007990.129915
Col2a1Collagen, type II, alpha 1−0.603530.0123550.627982
Col4a5Collagen, type IV, alpha 5−0.855190.0014710.187435
Col6a5Collagen, type VI, alpha 5−0.585540.0221810.835681
Col6a6Collagen, type VI, alpha 6−1.034270.0006110.108132
Creb5cAMP responsive element binding protein 5−0.649070.0304660.947107
Csf1Colony-stimulating factor 1 (macrophage)0.5159290.0241120.860187
Efna5Ephrin A50.4027450.0155850.709264
Eif4e2Eukaryotic translation initiation factor 4E member 20.3393310.0179230.756945
Fgfr1Fibroblast growth factor receptor 1−0.90580.00000180.001257
Fgfr2Fibroblast growth factor receptor 20.6414560.0338970.986212
Gnb1Guanine nucleotide binding protein (G protein), beta 10.4244880.0066470.453973
HrasHarvey rat sarcoma virus oncogene0.3191130.0410550.999738
Hsp90aa1Heat shock protein 90, alpha (cytosolic), class A member 10.2569920.0426410.999738
Igf1Insulin-like growth factor 10.5826640.0119640.618509
Igf1rInsulin-like growth factor I receptor0.8396590.0016640.199427
Igf2Insulin-like growth factor 2−0.61810.0352990.999738
IkbkgInhibitor of kappaB kinase gamma0.6241920.008670.521805
Il3raInterleukin 3 receptor, alpha chain−0.705960.0164360.727482
Il7Interleukin 70.658120.0301480.946044
InsrInsulin receptor−0.501780.02760.914738
Itga10Integrin, alpha 100.7225450.0059890.424382
Itga11Integrin alpha 11−0.523760.0402590.999738
Itga4Integrin alpha 40.6691870.0217090.828055
ItgavIntegrin alpha V0.173170.022950.84715
Itgb3Integrin beta 3−0.420990.0328280.976771
Itgb8Integrin beta 80.7585880.0016980.200273
Lamb1Laminin B1−0.430770.0000410.015966
Lamc1Laminin, gamma 1−0.191290.0315320.958818
Magi1Membrane-associated guanylate kinase, WW and PDZ domain containing 10.5341980.0304750.947107
Magi2Membrane-associated guanylate kinase, WW and PDZ domain containing 20.8521490.0043370.355457
Mcl1Myeloid cell leukemia sequence 10.2395220.0007430.123992
Mdm2Transformed mouse 3T3 cell double minute 20.7078680.0022890.234591
Nfkb1Nuclear factor of kappa light polypeptide gene enhancer in B cells 1, p105−0.62220.0005120.096041
NgfrNerve growth factor receptor (TNFR superfamily, member 16)−1.149370.000000130.000158
Nr4a1Nuclear receptor subfamily 4, group A, member 10.5335770.0340390.988161
NrasNeuroblastoma ras oncogene-0.985990.0002810.064468
Pik3r3Phosphoinositide-3-kinase regulatory subunit 30.6557020.0052410.393197
Ppp2r5cProtein phosphatase 2, regulatory subunit B’, gamma−0.47410.0130590.642713
PtenPhosphatase and tensin homolog0.2074880.0293980.933135
Sgk1Serum/glucocorticoid regulated kinase 10.3317033.24 × 1050.012944
Spp1Secreted phosphoprotein 10.6402720.0034070.3029
TekTEK receptor tyrosine kinase−0.590190.0306250.949013
Thbs1Thrombospondin 10.622930.0004410.086938
Tsc1Tuberous sclerosis 10.7270530.0035320.307612
Tsc2Tuberous sclerosis 2−0.658960.0297030.937812
VegfaVascular endothelial growth factor A−0.501338.23 × 1050.027091
VegfcVascular endothelial growth factor C0.2511230.0005990.106649
1 The positive values indicate up-regulated genes, and negative values indicate down-regulated genes in CXCR5-deficient RPE cells relative to WT controls.
Table 2. List of TNF-alpha NF-kB Signaling Pathway genes with logFC, p-value, and FDR values.
Gene SymbolGene NamelogFC 1p-valueFDR
Akap8A kinase (PRKA) anchor protein 81.1750460.0000300.012441
Cav1Caveolin 1, caveolae protein0.791220.0097210.554537
Cdc34Cell division cycle 341.358940.000000510.000446
CrebbpCREB binding protein0.2895250.0150870.698369
Cul1Cullin 10.8154390.0077160.49339
Ddx3xDEAD/H (Asp-Glu-Ala-Asp/His) box Polypeptide 3, X-linked0.545560.0054420.401934
Fbxw11F-box and WD-40 domain protein 110.8246360.000000840.000016
Gtf2iGeneral transcription factor II I0.7525960.0028180.265882
Hsp90aa1Heat shock protein 90, alpha (cytosolic), class A member 10.2569920.0426410.999738
IkbkgInhibitor of kappaB kinase gamma0.6241920.008670.521805
Iqgap2IQ motif containing GTPase activating protein 2−0.47610.0073420.478612
Kpna6Karyopherin (importin) alpha 60.1604610.047080.999738
Ktn1kinectin 10.7930050.0016880.199531
Mark2MAP/microtubule affinity regulating kinase 2−0.824360.0014530.186526
MccMutated in colorectal cancers-0.456680.0039740.334461
Nfkb1Nuclear factor of kappa light polypeptide gene enhancer in B cells 1, p105−0.62220.0005120.096041
Nfkb2Nuclear factor of kappa light polypeptide gene enhancer in B cells 2, p49/p1000.3059210.0154270.708003
Peg3Paternally expressed 3−0.768580.0017850.206978
Pias3Protein inhibitor of activated STAT 3−0.630290.0353610.999738
Psmd1Proteasome (prosome, macropain) 26S subunit, non-ATPase, 10.2138480.0026950.258467
Rasal2RAS protein activator like 20.890880.0000710.024327
Rpl30Ribosomal protein L30−0.341080.0001050.032262
Rpl8Ribosomal protein L8−0.250820.0275230.912855
Rps11Ribosomal protein S11−0.27830.0236770.856335
Rps13Ribosomal protein S13−0.317150.0002490.059475
Smarcc2SWI/SNF-related, matrix associated, actin-dependent regulator of chromatin, subfamily c, member 2−0.394880.0088760.52407
Tnip1TNFAIP3 interacting protein 1−0.717590.0182530.762899
Traf2TNF receptor-associated factor 2−0.318580.0271540.906937
Traf3TNF receptor-associated factor 30.3025410.0256580.886335
Traf4TNF receptor associated factor 40.6636430.022930.84715
Ube2iUbiquitin-conjugating enzyme E2I0.1610770.0212860.815485
Usp11Ubiquitin specific peptidase 11−0.820710.0005820.105223
1 The positive values indicate upregulated genes, and negative values indicate down-regulated genes in CXCR5-deficient RPE cells relative to WT controls.
Table 3. Number of CXCR5 transcripts in WT and CXCR5 KO datasets.
DatasetWT_RPE-1RPE_WT-1RPE_WT-1KO_RPE-1KO_RPE-2KO_RPE-3
ENSMUSG00000047880 (CXCR5)
Number of transcripts per 106 reads
109341316000

