Exploring the Role of Gut Microbiota in Major Depressive Disorder and in Treatment Resistance to Antidepressants


 , ,
, ,  and
and
Abstract
:
1. Introduction
2. Subjects and Methods
2.1. Participants
2.2. Sample Collection and DNA Extraction
2.3. Next-Generation Sequencing of Bacterial 16S rRNA Gene
2.4. Bioinformatic Analysis
2.5. Statistical Analysis
3. Results
3.1. Sample Characteristics
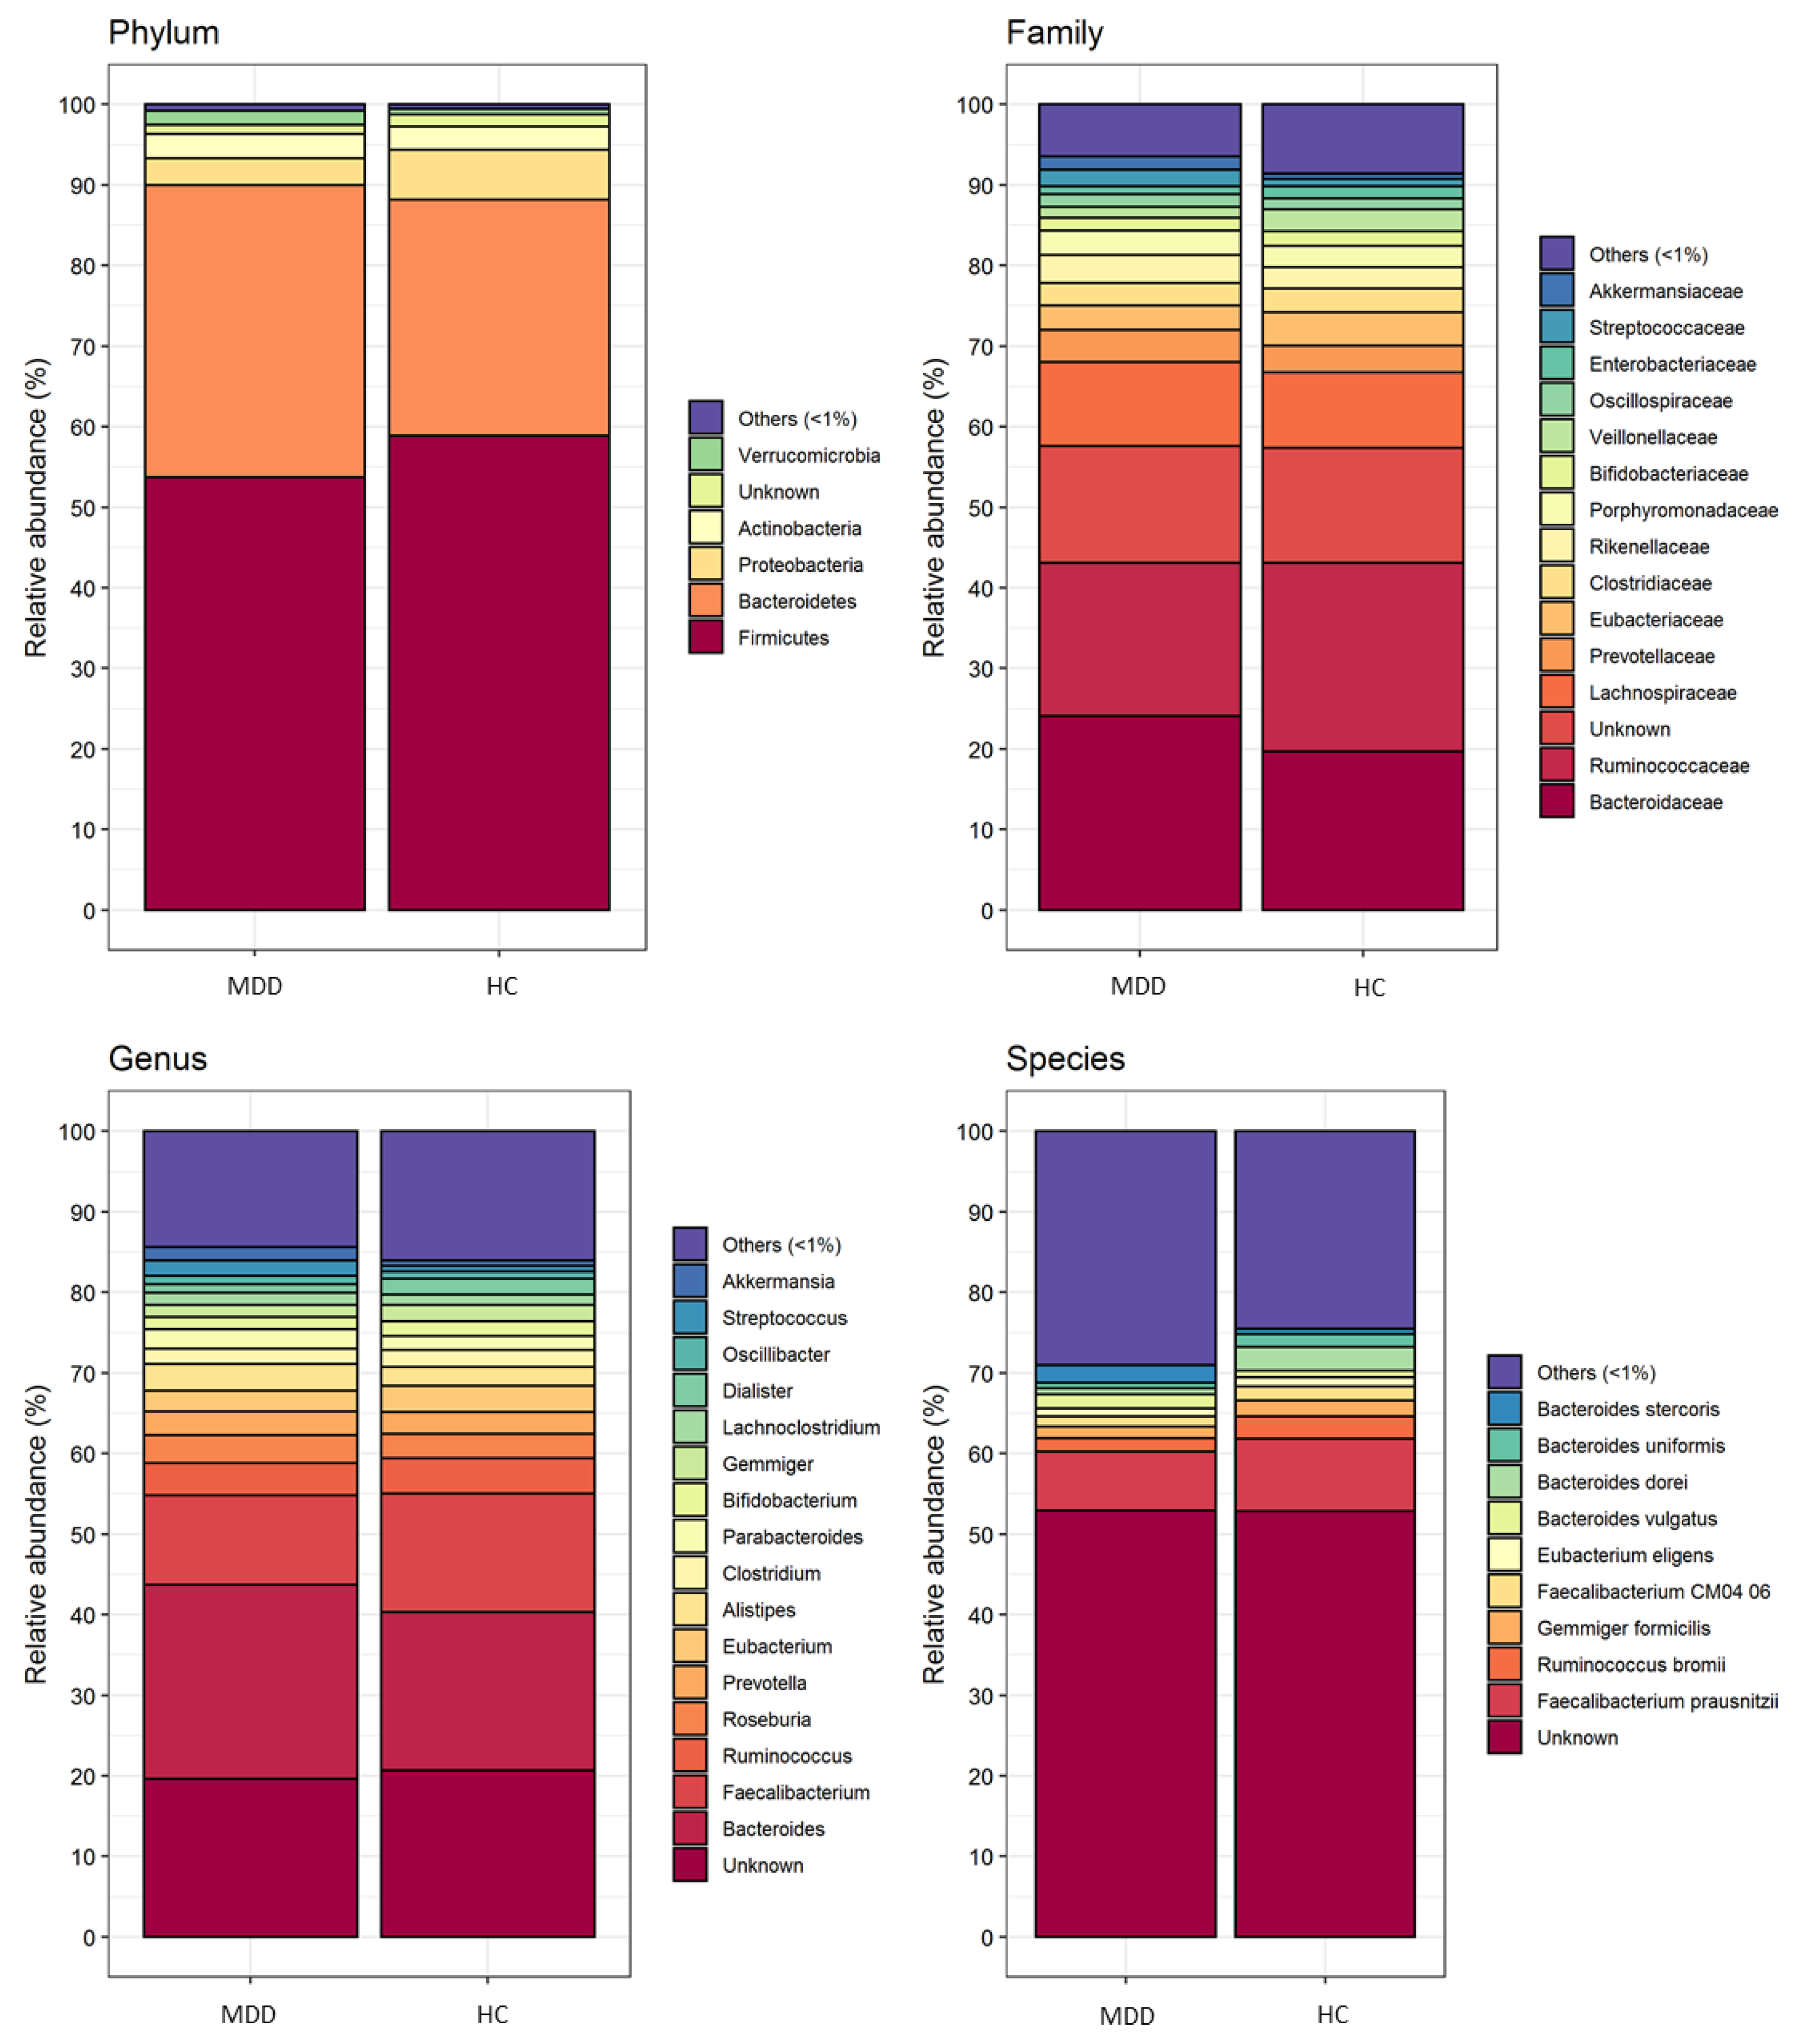
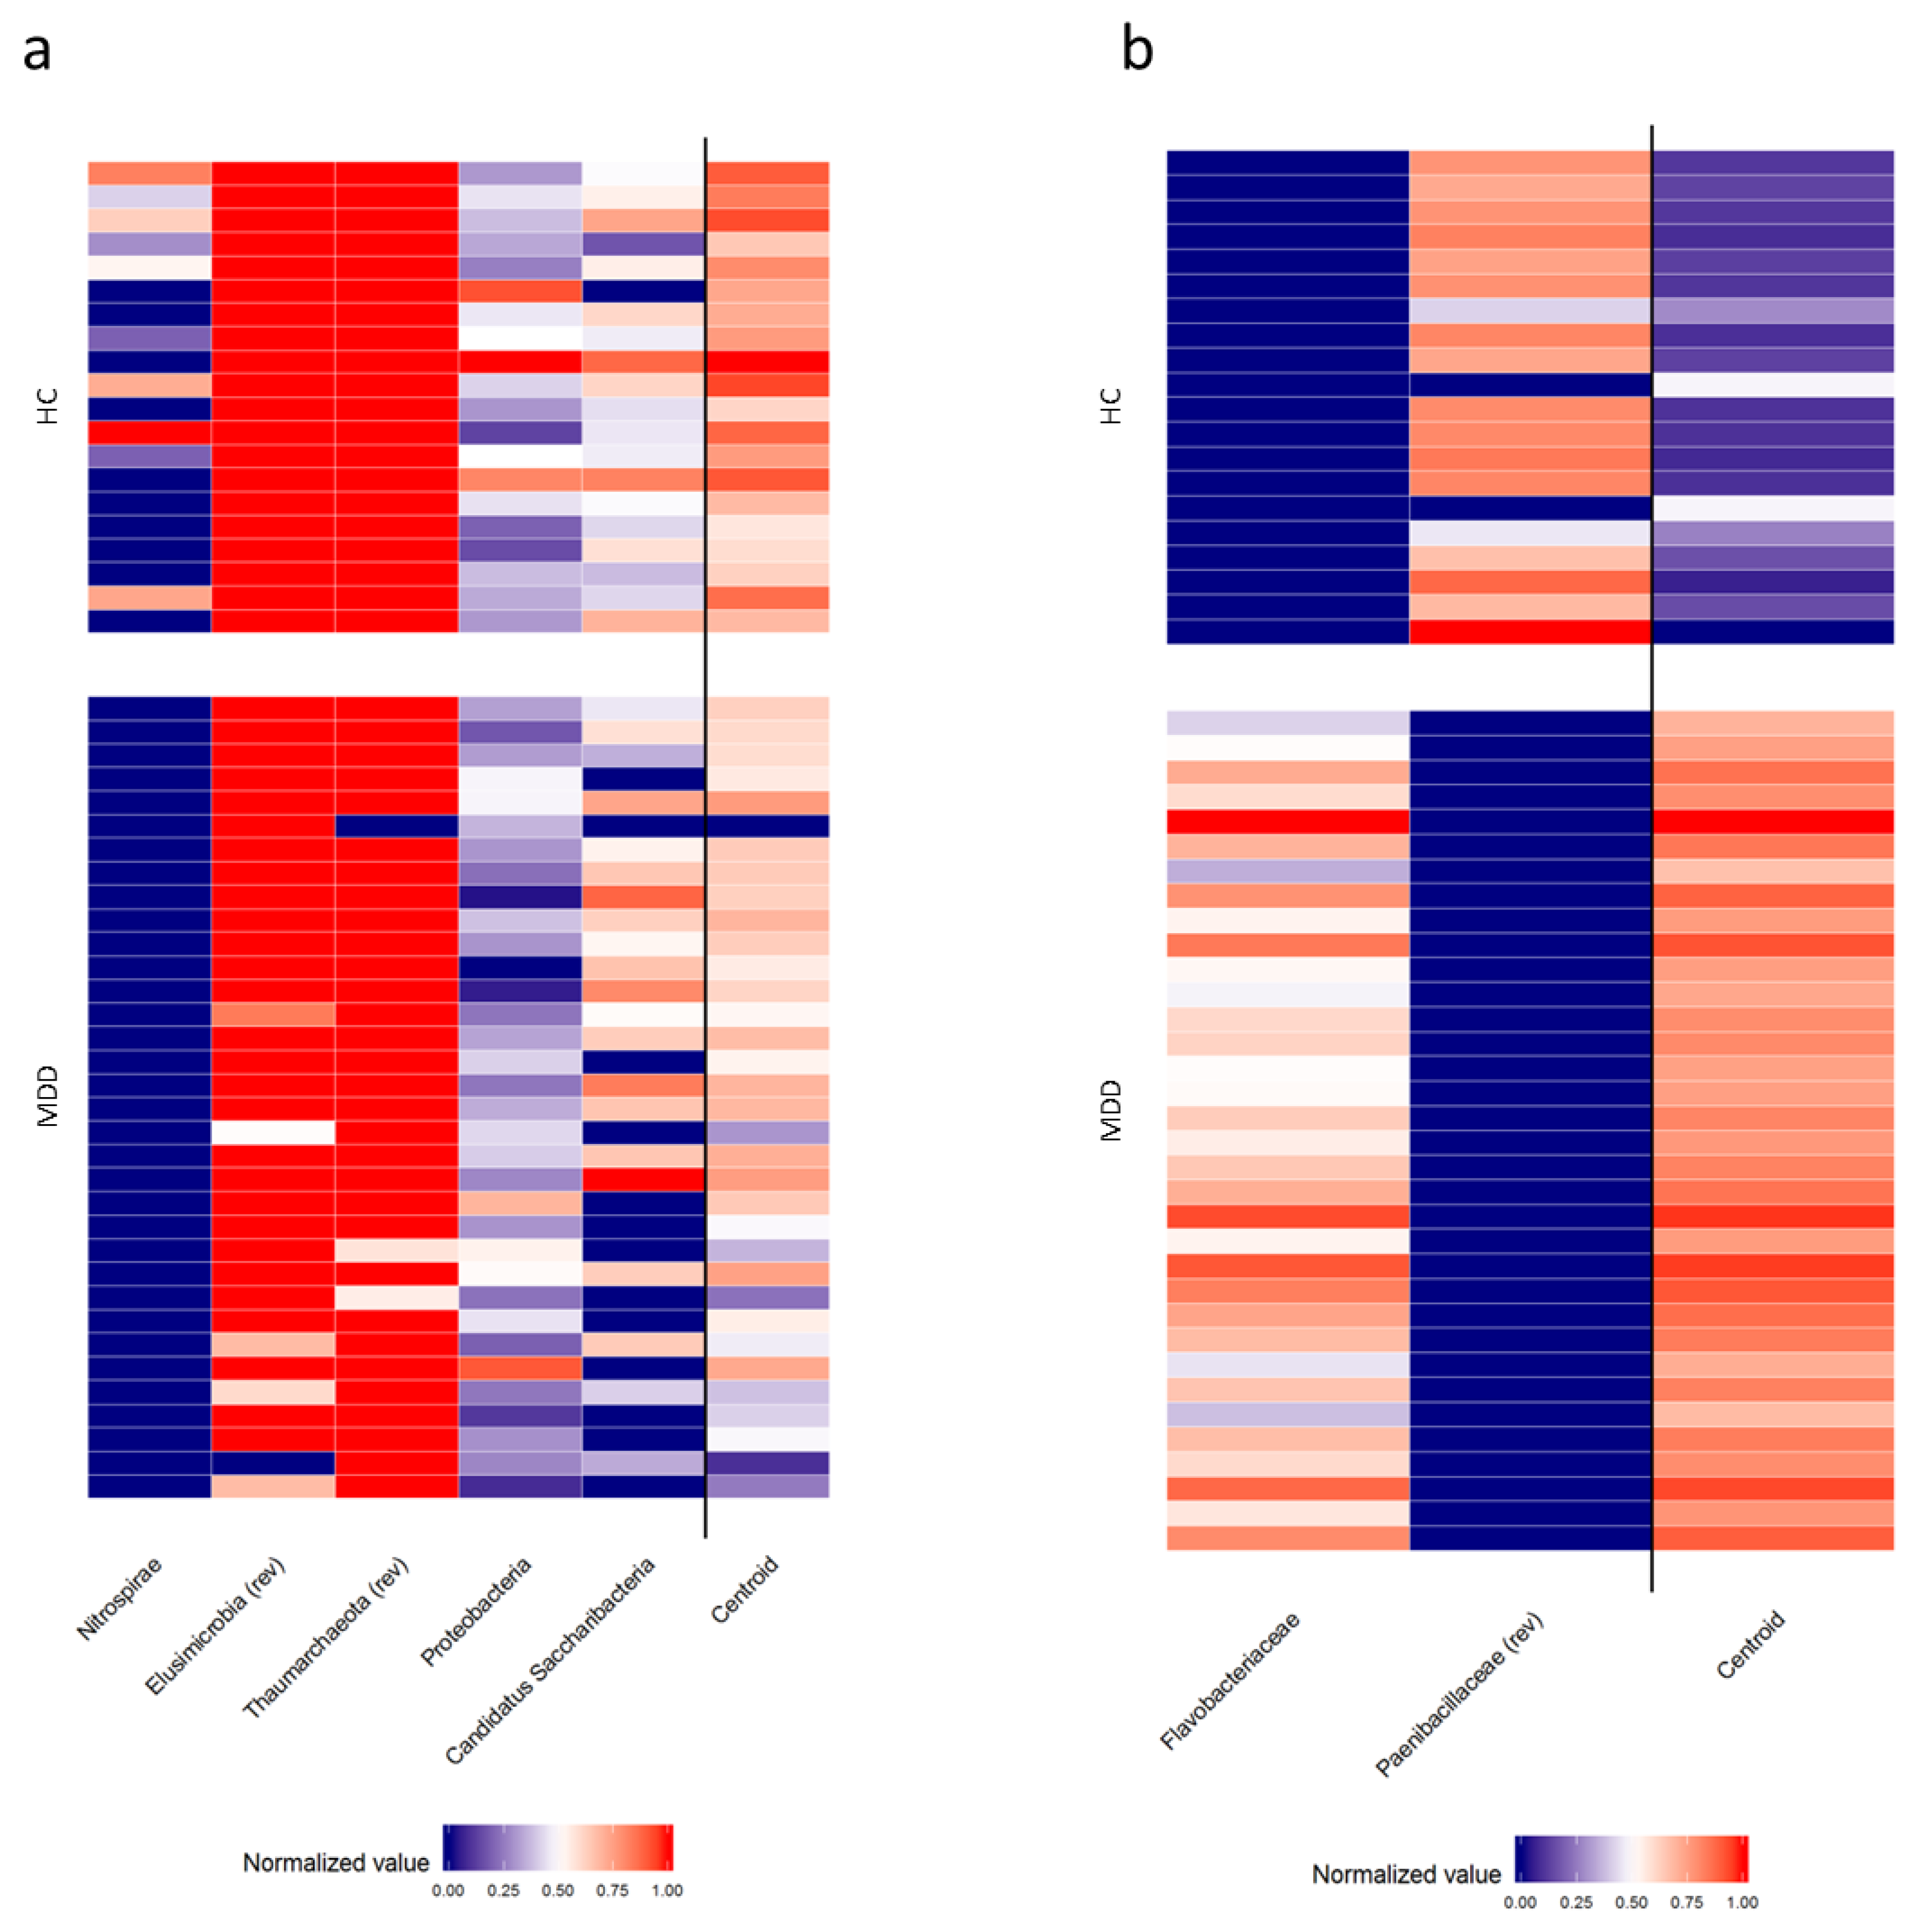
3.2. Comparison of Gut Microbiota Composition between Patients with MDD and HC
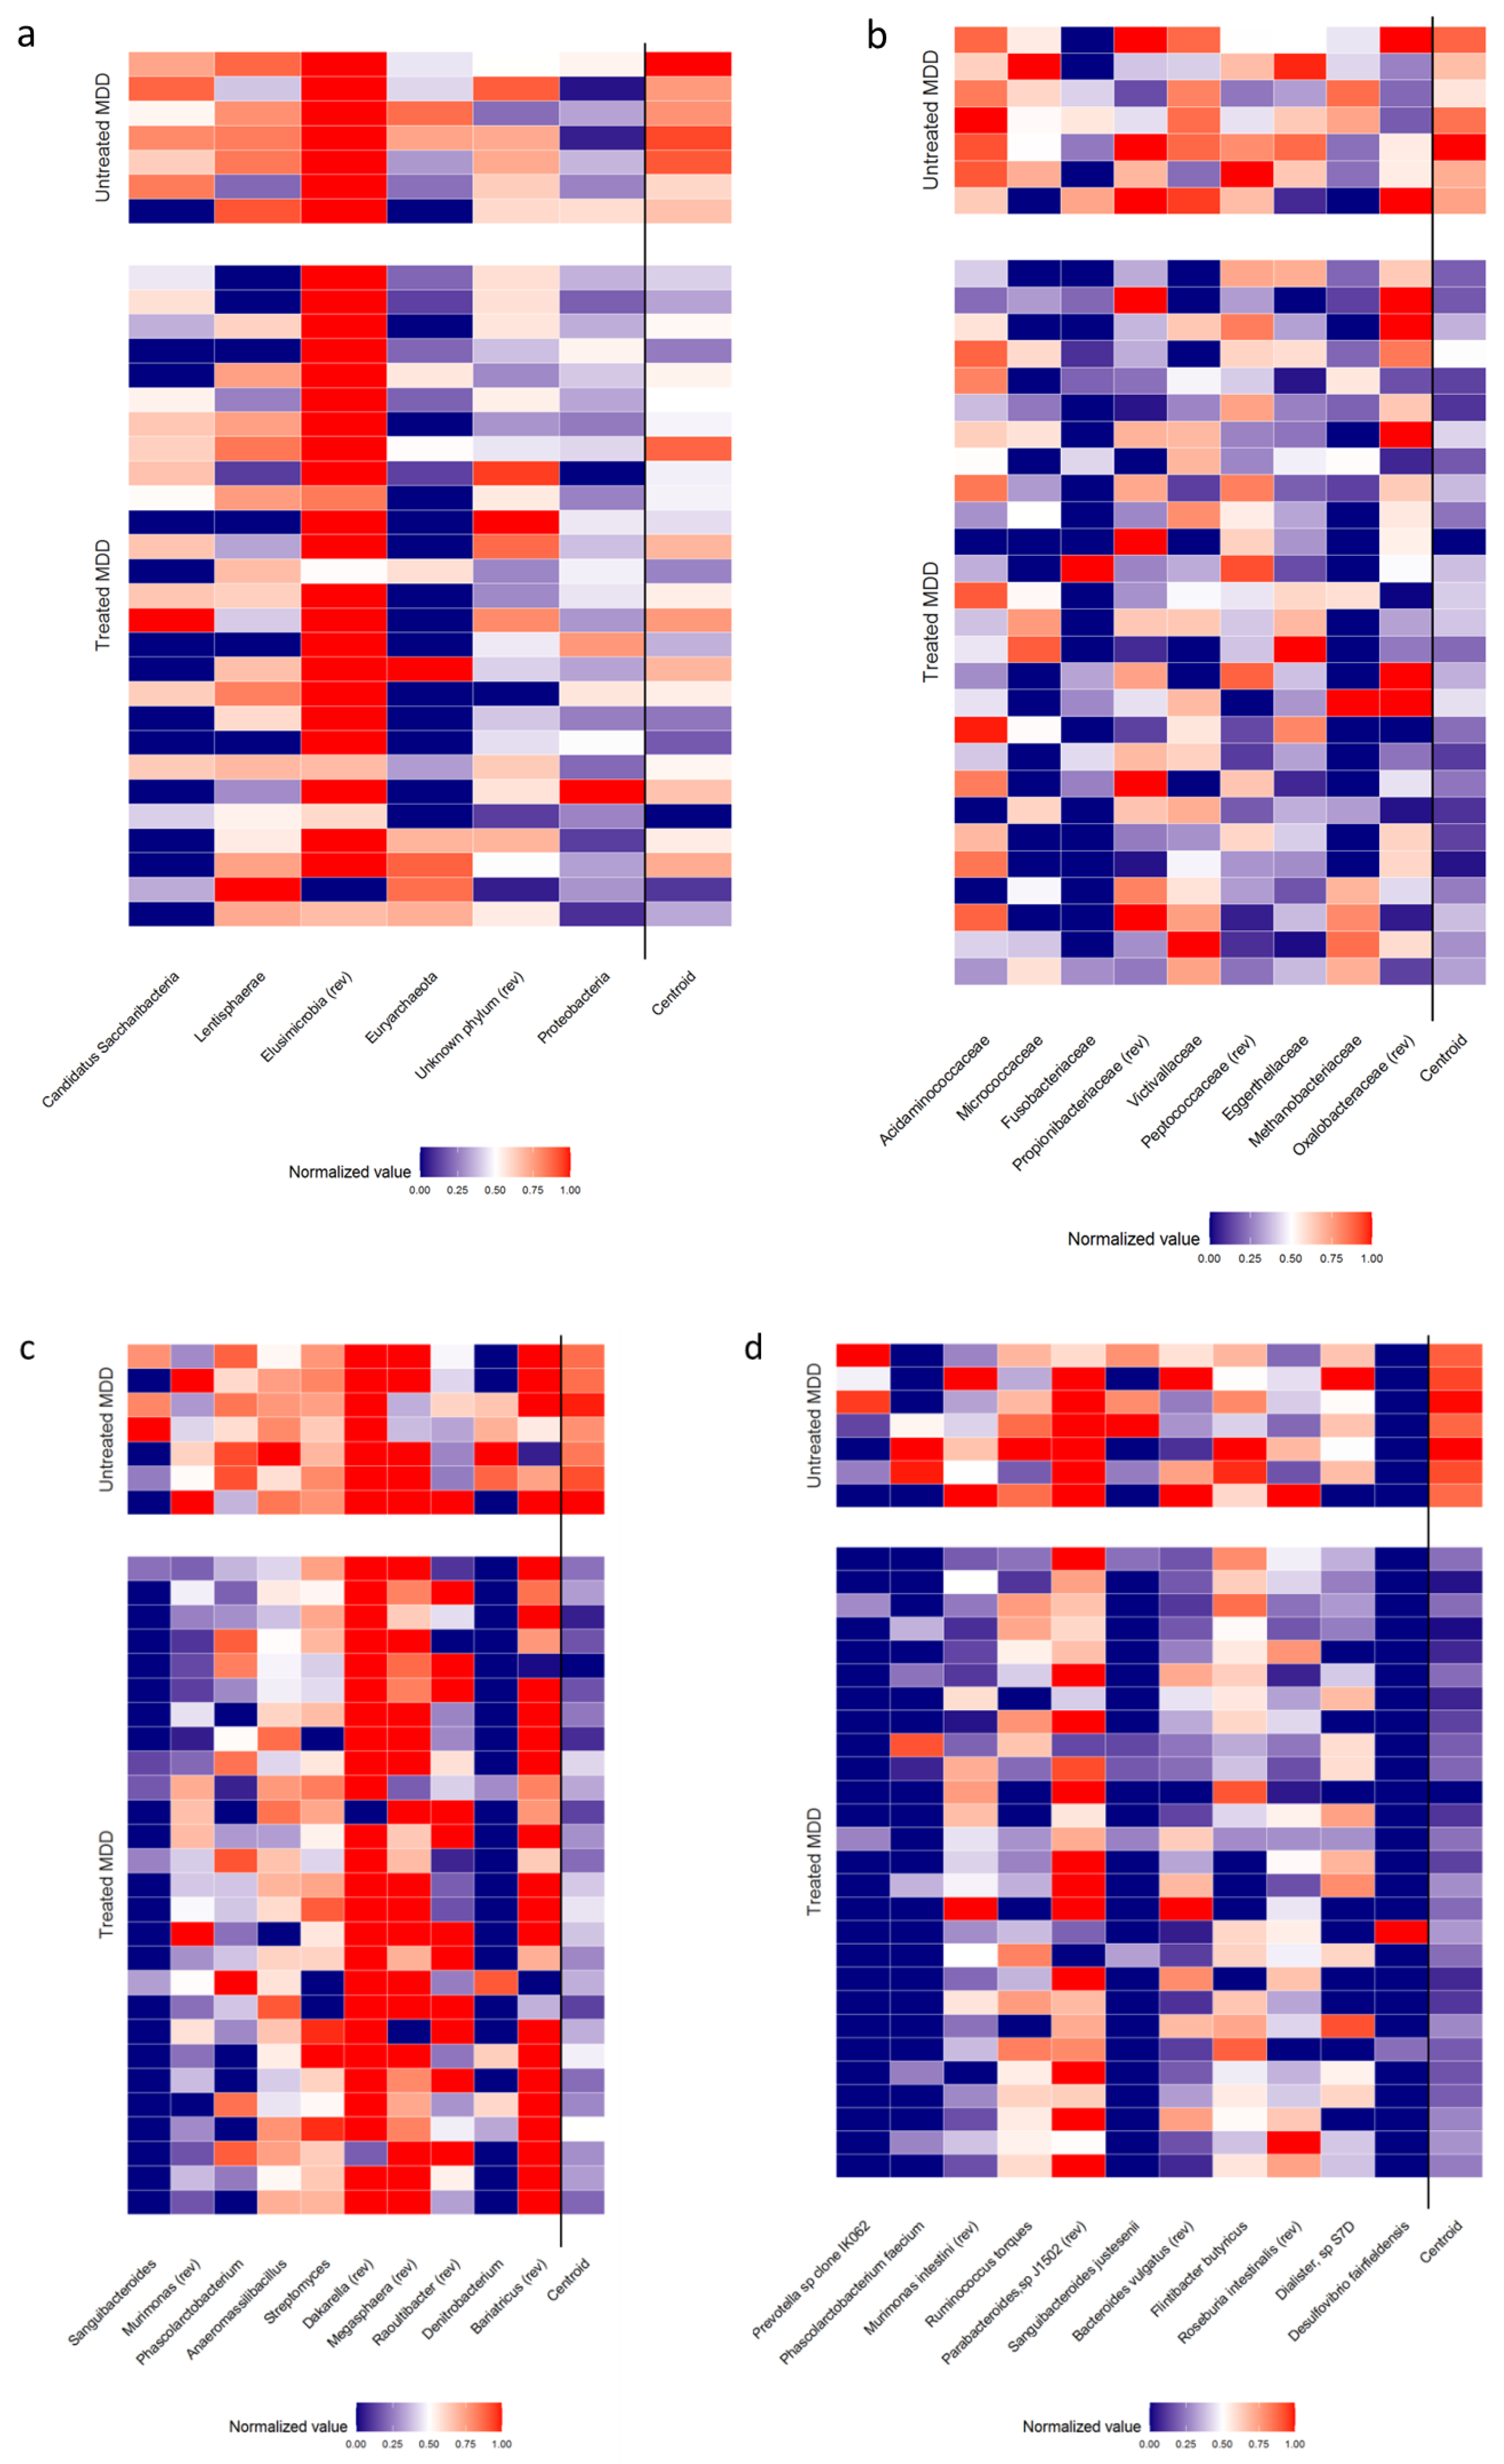
3.3. Comparison of Gut Microbiota Composition between Treated and Untreated Patients with MDD
3.4. Comparison of Gut Microbiota Composition between MDD Patients with and Without TR
3.5. Comparison of Gut Microbiota Composition between MDD Patients with and without TR and HC
4. Discussion
Author Contributions
Funding
Conflicts of Interest
References
- Otte, C.; Gold, S.M.; Penninx, B.W.; Pariante, C.M.; Etkin, A.; Fava, M.; Mohr, D.C.; Schatzberg, A.F. Major depressive disorder. Nat. Rev. Dis. Primers 2016, 15, 16065. [Google Scholar] [CrossRef] [Green Version]
- Kessler, R.C.; Bromet, E.J. The epidemiology of depression across cultures. Ann. Rev. Public Health 2013, 34, 119–138. [Google Scholar] [CrossRef] [PubMed] [Green Version]
- GBD 2017 Risk Factor Collaborators. Global, regional, and national disability-adjusted life-years (DALYs) for 359 diseases and injuries and healthy life expectancy (HALE) for 195 countries and territories, 1990–2017: A systematic analysis for the Global Burden of Disease Study 2017. Lancet 2018, 392, 1859–1922. [Google Scholar] [CrossRef] [Green Version]
- Sobocki, P.; Jönsson, B.; Angst, J.; Rehnberg, C. Cost of depression in Europe. J. Ment. Health Policy Econ. 2006, 9, 87–98. [Google Scholar]
- Bhak, Y.; Jeong, H.O.; Cho, Y.S.; Jeon, S.; Cho, J.; Gim, J.A.; Jeon, Y.; Blazyte, A.; Park, S.G.; Kim, H.M.; et al. Depression and suicide risk prediction models using blood-derived multi-omics data. Transl. Psychiatry 2019, 9, 262. [Google Scholar] [CrossRef] [PubMed] [Green Version]
- De Berardis, D.; Fornaro, M.; Orsolini, L.; Valchera, A.; Carano, A.; Vellante, F.; Perna, G.; Serafini, G.; Gonda, X.; Pompili, M.; et al. Alexithymia and suicide risk in psychiatric disorders: A mini-review. Front. Psychiatry 2017, 8, 148. [Google Scholar] [CrossRef] [PubMed] [Green Version]
- Manchia, M.; Pisanu, C.; Squassina, A.; Carpiniello, B. Challenges and future prospects of precision medicine in psychiatry. Pharmgenom. Pers. Med. 2020, 13, 127–140. [Google Scholar] [CrossRef] [Green Version]
- Wang, J.; Sareen, J.; Patten, S.; Bolton, J.; Schmitz, N.; Birney, A. A prediction algorithm for first onset of major depression in the general population: Development and validation. J. Epidemiol. Commun. Health. 2014, 68, 418–424. [Google Scholar] [CrossRef]
- Gillett, G.; Tomlinson, A.; Efthimiou, O.; Cipriani, A. Predicting treatment effects in unipolar depression: A meta-review. Pharmacol. Ther. 2020, 212, 107557. [Google Scholar] [CrossRef]
- Perlis, R.H. A clinical risk stratification tool for predicting treatment resistance in major depressive disorder. Biol. Psychiatry 2013, 74, 7–14. [Google Scholar] [CrossRef] [Green Version]
- Nie, Z.; Vairavan, S.; Narayan, V.A.; Ye, J.; Li, Q.S. Predictive modeling of treatment resistant depression using data from STAR*D and an independent clinical study. PLoS ONE 2018, 13, e0197268. [Google Scholar] [CrossRef] [PubMed]
- Athreya, A.; Iyer, R.; Neavin, D.; Wang, L.; Weinshilboum, R.; Kaddurah-Daouk, R.; Rush, J.; Frye, M.; Bobo, W. Augmentation of physician assessments with multi-omics enhances predictability of drug response: A case study of major depressive disorder. IEEE Comput. Intell. Mag. 2018, 13, 20–31. [Google Scholar] [CrossRef] [PubMed]
- Chang, B.; Choi, Y.; Jeon, M.; Lee, J.; Han, K.M.; Kim, A.; Ham, B.J.; Kang, J. ARPNet: Antidepressant response prediction network for major depressive disorder. Genes (Basel) 2019, 10, 907. [Google Scholar] [CrossRef] [PubMed] [Green Version]
- Pisanu, C.; Squassina, A. We are not alone in our body: Insights into the involvement of microbiota in the etiopathogenesis and pharmacology of mental illness. Curr. Drug Metab. 2017, 19, 688–694. [Google Scholar] [CrossRef] [PubMed]
- Collins, S.M.; Surette, M.; Bercik, P. The interplay between the intestinal microbiota and the brain. Nat. Rev. Microbiol. 2012, 10, 735–742. [Google Scholar] [CrossRef] [PubMed]
- Dinan, T.G.; Cryan, J.F. Melancholic microbes: A link between gut microbiota and depression? Neurogastroenterol. Motil. 2013, 25, 713–719. [Google Scholar] [CrossRef] [PubMed]
- Capuco, A.; Urits, I.; Hasoon, J.; Chun, R.; Gerald, B.; Wang, J.K.; Ngo, A.L.; Simopoulos, T.; Kaye, A.D.; Colontonio, M.M.; et al. Gut microbiome dysbiosis and depression: A comprehensive review. Curr. Pain Headache Rep. 2020, 24, 1–14. [Google Scholar] [CrossRef]
- Naseribafrouei, A.; Hestad, K.; Avershina, E.; Sekelja, M.; Linlokken, A.; Wilson, R.; Rudi, K. Correlation between the human fecal microbiota and depression. Neurogastroenterol. Motil. 2014, 26, 1155–1162. [Google Scholar] [CrossRef]
- Ziang, H.; Ling, Z.; Zhang, Y.; Mao, H.; Ma, Z.; Yin, Y.; Wang, W.; Tang, W.; Tan, Z.; Shi, J.; et al. Altered fecal microbiota composition in patients with major depressive disorder. Brain Behav. Immun. 2015, 48, 186–194. [Google Scholar]
- Valles-Colomer, M.; Falony, G.; Darzi, Y.; Tigchelaar, E.F.; Wang, J.; Tito, R.Y.; Schiweck, C.; Kurilshikov, A.; Joossens, M.; Wijmenga, C.; et al. The neuroactive potential of the human gut microbiota in quality of life and depression. Nat. Microbiol. 2019, 4, 623–632. [Google Scholar] [CrossRef]
- Manchia, M.; Paribello, P.; Arzedi, C.; Bocchetta, A.; Caria, P.; Cocco, C.; Congiu, D.; Cossu, E.; Dettori, T.; Frau, D.V.; et al. A multidisciplinary approach to mental illness: Do inflammation, telomere length and microbiota form a loop? A protocol for a cross-sectional study on the complex relationship between inflammation, telomere length, gut microbiota and psychiatric disorders. BMJ Open 2020, 10, e032513. [Google Scholar] [CrossRef] [PubMed] [Green Version]
- American Psychiatric Association. Diagnostic and Statistical Manual of Mental Disorders DSM-IV-TR, 4th ed.; American Psychiatric Association: Washington, DC, USA, 2000. [Google Scholar]
- Souery, D.; Papakostas, G.I.; Trivedi, M.H. Treatment-resistant depression. J. Clin. Psychiatry 2006, 67, 16–22. [Google Scholar] [PubMed]
- Klindworth, A.; Pruesse, E.; Schweer, T.; Peplies, J.; Quast, C.; Horn, M.; Glöckner, F.O. Evaluation of general 16S ribosomal RNA gene PCR primers for classical and next-generation sequencing-based diversity studies. Nucleic Acids Res. 2013, 41, e1. [Google Scholar] [CrossRef] [PubMed]
- Picchianti-Diamanti, A.; Panebianco, C.; Salemi, S.; Sorgi, M.L.; Di Rosa, R.; Tropea, A.; Sgrulletti, M.; Salerno, G.; Terracciano, F.; D’Amelio, R.; et al. Analysis of gut microbiota in rheumatoid arthritis patients: Disease-related dysbiosis and modifications induced by etanercept. Int. J. Mol. Sci. 2018, 19, 2938. [Google Scholar] [CrossRef] [Green Version]
- Dettling, M.; Bühlmann, P. Finding predictive gene groups from microarray data. J. Multivar. Anal. 2004, 90, 106–131. [Google Scholar] [CrossRef]
- R Core Team. R: A Language and Environment for Statistical Computing; R Foundation for Statistical Computing: Vienna, Austria, 2019. [Google Scholar]
- Hamilton, M. A rating scale for depression. J. Neurol Neurosurg. Psychiatry 1960, 23, 56–62. [Google Scholar] [CrossRef] [Green Version]
- Shi, L.; Cao, J.; Xiong, N.; Zhao, X.; Jiang, J.; Zhu, L.; Wang, Z.; Sun, X.; Fang, X.; Wei, J. A comorbidity study of functional gastrointestinal disorders in patients with major depressive disorder. J. Depress Anxiety 2015, 4, 1044–2167. [Google Scholar] [CrossRef]
- Cryan, J.F.; Holmes, A. The ascent of mouse: Advances in modelling human depression and anxiety. Nat. Rev. Drug Discov. 2005, 4, 775–790. [Google Scholar] [CrossRef]
- Dunbar, J.A.; Reddy, P.; Davis-Lameloise, N.; Philpot, B.; Laatikainen, T.; Kilkkinen, A.; Bunker, S.J.; Best, J.D.; Vartiainen, E.; Kai Lo, S.; et al. Depression: An important comorbidity with metabolic syndrome in a general population. Diabetes Care 2008, 31, 2368–2373. [Google Scholar] [CrossRef] [Green Version]
- Macedo, D.; Filho, A.J.M.C.; Soares de Sousa, C.N.; Quevedo, J.; Barichello, T.; Júnior, H.V.N.; Freitas de Lucena, D. Antidepressants, antimicrobials or both? Gut microbiota dysbiosis in depression and possible implications of the antimicrobial effects of antidepressant drugs for antidepressant effectiveness. J. Affect. Dis. 2017, 208, 22–32. [Google Scholar] [CrossRef]
- Delgado, P.L. Depression: The case for a monoamine deficiency. J. Clin. Psychiatry 2000, 61 (Suppl. S6), 7–11. [Google Scholar] [PubMed]
- Hasler, G. Pathophysiology of depression: Do we have any solid evidence of interest to clinicians? World Psychiatry 2010, 9, 155. [Google Scholar] [CrossRef] [Green Version]
- Agus, A.; Planchais, J.; Sokol, H. Gut microbiota regulation of tryptophan metabolism in health and disease. Cell Host Microb. 2018, 23, 716–724. [Google Scholar] [CrossRef] [PubMed] [Green Version]
- Waclawiková, B.; El Aidy, S. Role of microbiota and tryptophan metabolites in the remote effect of intestinal inflammation on brain and depression. Pharmaceuticals 2018, 11, 63. [Google Scholar] [CrossRef] [PubMed] [Green Version]
- Dehhaghi, M.; Kazemi Shariat Panahi, H.; Guillemin, G.J. Microorganisms, tryptophan metabolism, and kynurenine pathway: A complex interconnected loop influencing human health status. Int. J. Tryptophan Res. 2019, 12, 1178646919852996. [Google Scholar] [CrossRef] [PubMed] [Green Version]
- Clarke, G.; Grenham, S.; Scully, P.; Fitzgerald, P.; Moloney, R.D.; Shanahan, F.; Dinan, T.G.; Cryan, J.F. The microbiome-gut-brain axis during early life regulates the hippocampal serotonergic system in a sex-dependent manner. Mol. Psychiatry 2013, 18, 666–673. [Google Scholar] [CrossRef] [Green Version]
- Huang, Y.; Shi, X.; Li, Z.; Shen, Y.; Shi, X.; Wang, L.; Li, G.; Yuan, Y.; Wang, J.; Zhang, Y.; et al. Possible association of Firmicutes in the gut microbiota of patients with major depressive disorder. Neuropsychiatr. Dis. Treat. 2018, 14, 3329. [Google Scholar] [CrossRef] [Green Version]
- Lin, P.; Ding, B.; Feng, C.; Yin, S.; Zhang, T.; Qi, X.; Lv, H.; Guo, X.; Dong, K.; Zhu, Y.; et al. Prevotella and Klebsiella proportions in fecal microbial communities are potential characteristic parameters for patients with major depressive disorder. J. Affect. Disord. 2017, 207, 300–304. [Google Scholar] [CrossRef]
- Chen, Z.; Li, J.; Gui, S.; Zhou, C.; Chen, J.; Yang, C.; Hu, Z.; Wang, H.; Zhong, X.; Zeng, L.; et al. Comparative metaproteomics analysis shows altered fecal microbiota signatures in patients with major depressive disorder. Neuroreport 2018, 29, 417–425. [Google Scholar] [CrossRef]
- Chen, J.J.; Zheng, P.; Liu, Y.Y.; Zhong, X.G.; Wang, H.Y.; Guo, Y.J.; Xie, P. Sex differences in gut microbiota in patients with major depressive disorder. Neuropsychiatr. Dis. Treat. 2018, 14, 647. [Google Scholar] [CrossRef] [Green Version]
- Lai, W.T.; Deng, W.F.; Xu, S.X.; Zhao, J.; Xu, D.; Liu, Y.H.; Guo, Y.Y.; Wang, M.B.; He, F.S.; Ye, S.W.; et al. Shotgun metagenomics reveals both taxonomic and tryptophan pathway differences of gut microbiota in major depressive disorder patients. Psychol. Med. 2019, 40, 1–12. [Google Scholar] [CrossRef] [PubMed]
- Gao, J.; Xu, K.; Liu, H.; Liu, G.; Bai, M.; Peng, C.; Li, T.; Yin, Y. Impact of the gut microbiota on intestinal immunity mediated by tryptophan metabolism. Front. Cell. Infect. Microbiol. 2018, 8, 13. [Google Scholar] [CrossRef] [Green Version]
- Munoz-Bellido, J.L.; Munoz-Criado, S.; Garcıa-Rodrıguez, J.A. Antimicrobial activity of psychotropic drugs: Selective serotonin reuptake inhibitors. Int. J. Antimicrob. Agents 2000, 14, 177–180. [Google Scholar] [CrossRef]
- Li, L.; Su, Q.; Xie, B.; Duan, L.; Zhao, W.; Hu, D.; Wu, R.; Liu, H. Gut microbes in correlation with mood: Case study in a closed experimental human life support system. Neurogastroenterol. Motil. 2016, 28, 1233–1240. [Google Scholar] [CrossRef] [PubMed]
- Siopi, E.; Chevalier, G.; Katsimpardi, L.; Saha, S.; Bigot, M.; Moigneu, C.; Eberl, G.; Lledo, P.M. Changes in gut microbiota by chronic stress impair the efficacy of fluoxetine. Cell Rep. 2020, 30, 3682–3690. [Google Scholar] [CrossRef] [PubMed]
- Bharwani, A.; Bala, A.; Surette, M.; Bienenstock, J.; Vigod, S.N.; Taylor, V.H. Gut microbiome patterns associated with treatment response in patients with major depressive disorder. Can. J. Psychiatry 2020, 65, 278–280. [Google Scholar] [CrossRef] [PubMed]
- Lyte, M.; Li, W.; Opitz, N.; Gaykema, R.P.A.; Goehler, L.E. Induction of anxiety-like behavior in mice during the initial stages of infection with the agent of murine colonic hyperplasia Citrobacter rodentium. Physiol. Behav. 2006, 89, 350–357. [Google Scholar] [CrossRef] [PubMed]
- Goehler, L.E.; Lyte, M.; Gaykema, R.P.A. Infection-induced viscerosensory signals from the gut enhance anxiety: Implications for psychoneuroimmunology. Brain. Behav. Immun. 2007, 21, 721–726. [Google Scholar] [CrossRef] [PubMed] [Green Version]
- Goehler, L.E.; Park, S.M.; Opitz, N.; Lyte, M.; Gaykema, R.P.A. Campylobacter jejuni infection increases anxiety-like behavior in the holeboard: Possible anatomical substrates for viscerosensory modulation of exploratory behavior. Brain. Behav. Immun. 2008, 22, 354–366. [Google Scholar] [CrossRef] [PubMed] [Green Version]
- Cryan, J.F.; Dinan, T.G. Mind-altering microorganisms: The impact of the gut microbiota on brain and behaviour. Nat. Rev. Neurosci. 2012, 13, 701–712. [Google Scholar] [CrossRef] [PubMed]


| Variable | Level | TR MDD (n = 8) | R MDD (n = 19) | Untreated MDD (n = 7) | HC (n = 20) | p-Value |
|---|---|---|---|---|---|---|
| Age (years) | Median [IQR] | 58.8 [43.7–61.6] | 53.7 [43.3–59.6] | 57.0 [49.1–60.9] | 37.7 [30.6–58.0] | 0.189 * |
| Gender—n (%) | Males | 4 (50.0) | 5 (26.3) | 1 (14.3) | 13 (65.0) | 0.036 # |
| Females | 4 (50.0) | 14 (73.7) | 6 (85.7) | 7 (35.0) | ||
| BMI (Kg/m2) | Median [IQR] | 23.0 [21.9–27.8] | 24.6 [21.0–28.8] | 23.3 [23.1–25.2] | 22.7 [21.2–23.8] | 0.484 * |
| Family history for mental disorders—n (%) | No | 1 (14.3) | 8 (47.1) | 3 (42.9) | 11 (68.8) | 0.117 # |
| Yes | 6 (85.7) | 9 (52.9) | 4 (57.1) | 5 (31.2) | ||
| Diet—n (%) | Mediterranean only | 5 (62.5) | 10 (52.6) | 4 (57.1) | 18 (90.0) | 0.254 # |
| Carbohydrates only | 0 (0.0) | 1 (5.3) | 0 (0.0) | 0 (0.0) | ||
| Vegetarian only | 0 (0.0) | 2 (10.5) | 1 (14.3) | 0 (0.0) | ||
| Mediterranean + hyperproteic | 1 (12.5) | 2 (10.5) | 1 (14.3) | 0 (0.0) | ||
| Mediterranean + hypercaloric | 0 (0.0) | 0 (0.0) | 0 (0.0) | 1 (5.0) | ||
| Mediterranean + carbohydrates | 1 (12.5) | 1 (5.3) | 0 (0.0) | 1 (5.0) | ||
| Mediterranean + hyperproteic + carbohydrates | 0 (0.0) | 1 (5.3) | 1 (14.3) | 0 (0.0) | ||
| Mediterranean + hypercaloric + carbohydrates | 0 (0.0) | 1 (5.3) | 0 (0.0) | 0 (0.0) | ||
| Hyperproteic + carbohydrates | 1 (12.5) | 0 (0.0) | 0 (0.0) | 0 (0.0) | ||
| Hypercaloric + carbohydrates + vegetarian | 0 (0.0) | 1 (5.3) | 0 (0.0) | 0 (0.0) | ||
| Smoking habits—n (%) | Non-smoker | 3 (37.5) | 12 (63.2) | 3 (42.9) | 13 (65.0) | 0.591 # |
| Smoker | 4 (50.0) | 3 (15.8) | 2 (28.6) | 4 (20.0) | ||
| Ex-smoker | 1 (12.5) | 4 (21.1) | 2 (28.6) | 3 (15.0) | ||
| Drink habits—n (%) | None | 4 (50.0) | 10 (52.6) | 4 (57.1) | 3 (15.8) | 0.086 # |
| One occasional drink | 3 (37.5) | 8 (42.1) | 2 (28.6) | 12 (63.2) | ||
| 1–2 drinks per day | 0 (0.0) | 1 (5.3) | 1 (14.3) | 4 (21.1) | ||
| more than 1/2 L per day | 1 (12.5) | 0 (0.0) | 0 (0.0) | 0 (0.0) | ||
| Physical activity—n (%) | No | 6 (75.0) | 11 (57.9) | 5 (71.4) | 5 (25.0) | 0.032# |
| Yes | 2 (25.0) | 8 (42.1) | 2 (28.6) | 15 (75.0) | ||
| Cardiometabolic comorbidities—n (%) | No | 6 (75.0) | 14 (73.7) | 6 (85.7) | 16 (80.0) | 0.966 # |
| Yes | 2 (25.0) | 5 (26.3) | 1 (14.3) | 4 (20.0) | ||
| Age at onset (years) | Median [IQR] | 25.5 [20.2–30.8] | 33.0 [23.5–45.5] | 40.0 [26.5–43.5] | NA | 0.293 * |
| Disease duration (years) | Median [IQR] | 26.4 [12.8–30.9] | 12.7 [2.2–23.6] | 17.0 [11.5–27.0] | NA | 0.122 * |
| History of suicide attempt—n (%) | No | 5 (62.5) | 17 (94.4) | 5 (71.4) | NA | 0.085 # |
| Yes | 3 (37.5) | 1 (5.6) | 2 (28.6) | NA | ||
| Length of treatment with antidepressant (months) | Median [IQR] | 44.0 [12.0–78.0] | 24.0 [10.5–38.5] | NA | NA | 0.250 * |
| Treatment at sample collection—n (%) | SSRI | 4 (50.0) | 8 (42.1) | NA | NA | 1.000 # |
| SNRI/TCA/ Serotonin modulator | 4 (50.0) | 11 (57.9) | NA | NA | ||
| Mood stabilizers—n (%) | No | 5 (62.5) | 17 (89.5) | 5 (71.4) | NA | 0.203 # |
| Yes | 3 (37.5) | 2 (10.5) | 2 (28.6) | NA | ||
| Antipsychotics—n (%) | No | 4 (50.0) | 18 (94.7) | 5 (71.4) | NA | 0.014 # |
| Yes | 4 (50.0) | 1 (5.3) | 2 (28.6) | NA | ||
| Any concomitant drugs—n (%) | No | 2 (25.0) | 16 (84.2) | 5 (71.4) | NA | 0.011 # |
| Yes | 6 (75.0) | 3 (15.8) | 2 (28.6) | NA |
| Taxa Level | Bacteria Selected by PELORA | Quantity | Statistics | All MDD (n = 34) | HC (n = 20) | p-Value |
|---|---|---|---|---|---|---|
| Phylum | Proteobacteria | Relative abundance (%) | Median [IQR] | 2.135 [1.591–3.461] | 2.971 [2.189–4.384] | 0.065 # |
| Z-score ° | Mean ± SD | −0.192 ± 0.882 | 0.327 ± 1.123 | |||
| Candidatus Saccharibacteria | Relative abundance (%) | Median [IQR] | 0.005 [0.000–0.019] | 0.006 [0.004–0.014] | 0.132 # | |
| Z-score ° | Mean ± SD | −0.158 ± 1.128 | 0.268 ± 0.677 | |||
| Nitrospirae | Relative abundance (%) | Median [IQR] | Absent | 0.000 [0.000–0.006] | <0.001 § | |
| Z-score ° | Mean ± SD | 0.711 ± 1.395 | ||||
| Elusimicrobia * | Relative abundance (%) | Median [IQR] | 0.000 [0.000–0.000] | Absent | 0.049 § | |
| Z-score ° | Mean ± SD | 0.175 ± 1.233 | ||||
| Thaumarchaeota * | Relative abundance (%) | Median [IQR] | 0.000 [0.000–0.000] | Absent | 0.176 § | |
| Z-score ° | Mean ± SD | 0.130 ± 1.249 | ||||
| Cluster centroid | Z-score (means) | Mean ± SD | −0.215 ± 0.463 | 0.365 ± 0.324 | <0.001 # | |
| Family | Flavobacteriaceae | Relative abundance (%) | Median [IQR] | 0.007 [0.004–0.015] | Absent | <0.001 § |
| Z-score ° | Mean ± SD | 0.704 ± 0.478 | ||||
| Paenibacillaceae * | Relative abundance (%) | Median [IQR] | Absent | 0.011 [0.006–0.014] | <0.001 § | |
| Z-score ° | Mean ± SD | 1.164 ± 0.724 | ||||
| Cluster centroid | Z-score (means) | Mean ± SD | 0.694 ± 0.239 | −1.180 ± 0.362 | <0.001 # | |
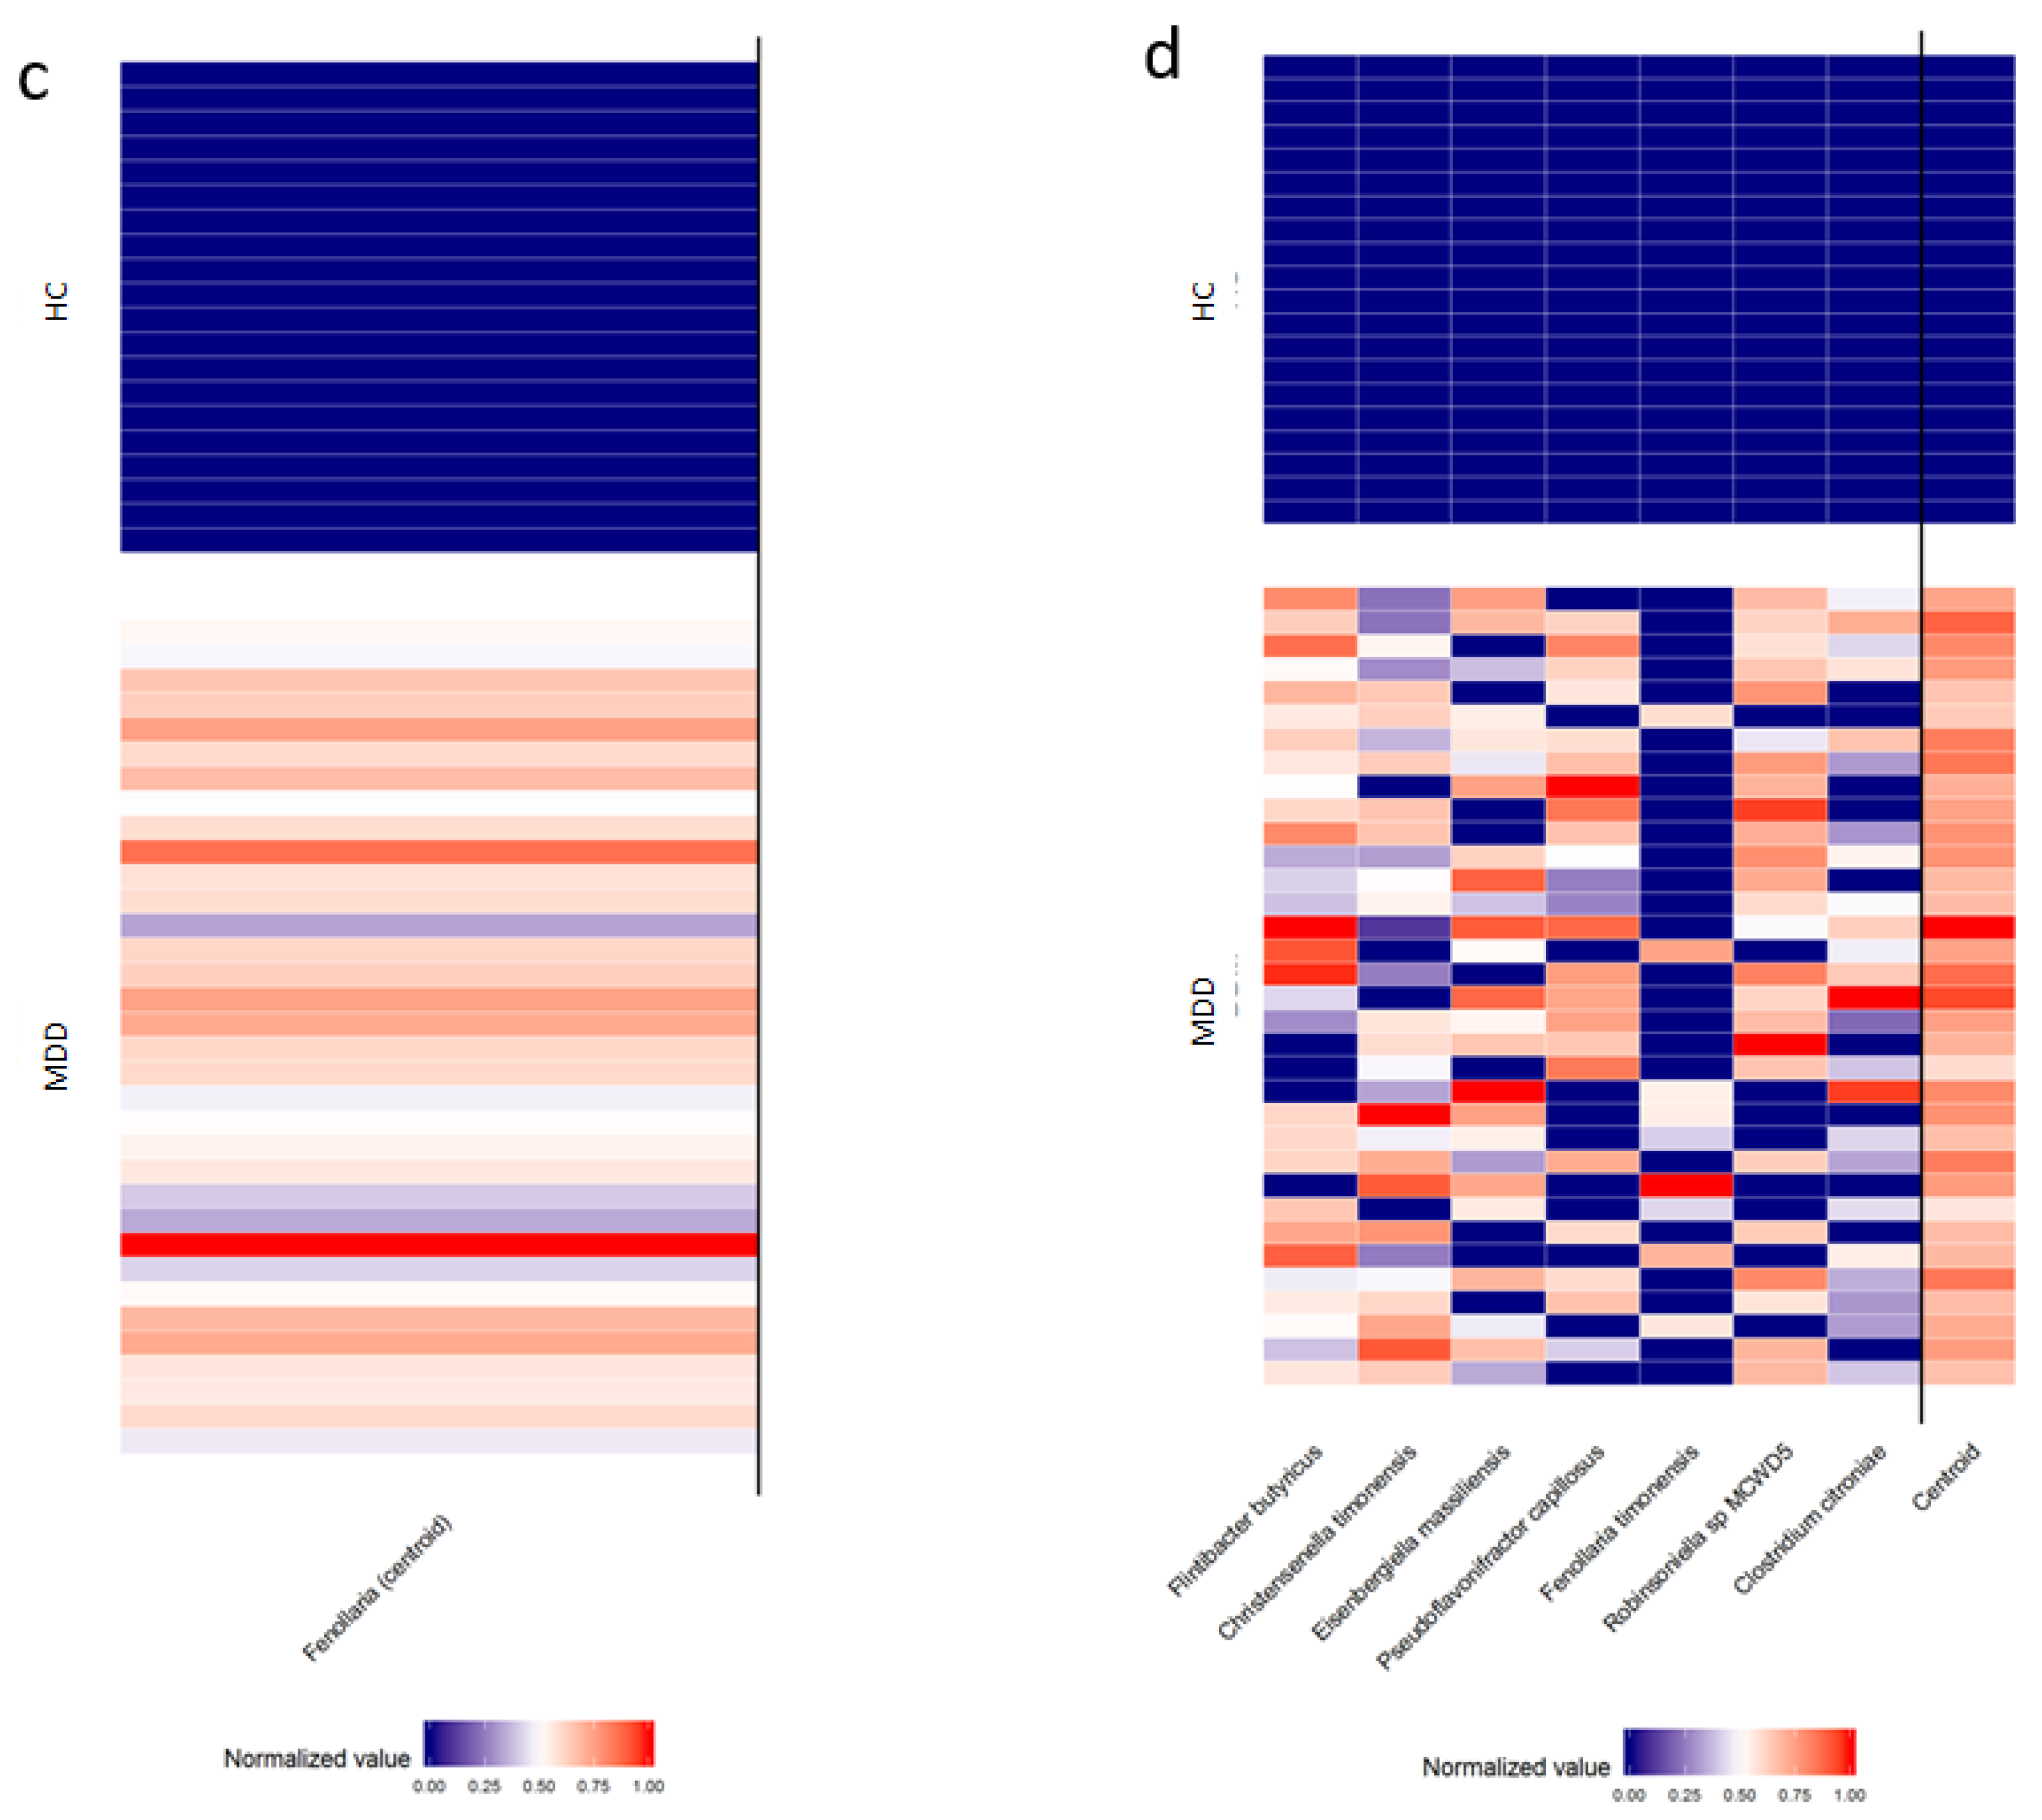
| Genus | Fenollaria (Cluster centroid) | Relative abundance (%) | Median [IQR] | 0.008 [0.004–0.012] | Absent | <0.001 § |
| Z-score ° | Mean ± SD | 0.711 ± 0.445 | −1.209 ± 0.000 | |||
| Species | Flintibacter butyricus | Relative abundance (%) | Median [IQR] | 0.006 [0.002–0.014] | Absent | <0.001 § |
| Z-score ° | Mean ± SD | 0.594 ± 0.790 | ||||
| Christensenella timonensis | Relative abundance (%) | Median [IQR] | 0.006 [0.001–0.014] | Absent | <0.001 § | |
| Z-score ° | Mean ± SD | 0.556 ± 0.864 | ||||
| Eisenbergiella massiliensis | Relative abundance (%) | Median [IQR] | 0.007 [0.000–0.026] | Absent | <0.001 § | |
| Z-score ° | Mean ± SD | 0.503 ± 0.949 | ||||
| Pseudoflavonifractor capillosus | Relative abundance (%) | Median [IQR] | 0.006 [0.000–0.012] | Absent | <0.001 § | |
| Z-score ° | Mean ± SD | 0.473 ± 0.992 | ||||
| Fenollaria timonensis | Relative abundance (%) | Median [IQR] | 0.000 [0.000–0.001] | Absent | 0.013 § | |
| Z-score ° | Mean ± SD | 0.249 ± 1.197 | ||||
| Robinsoniella sp, MCWD5 | Relative abundance (%) | Median [IQR] | 0.007 [0.001–0.012] | Absent | <0.001 § | |
| Z-score ° | Mean ± SD | 0.526 ± 0.914 | ||||
| Clostridium citroniae | Relative abundance (%) | Median [IQR] | 0.004 [0.000–0.016] | Absent | <0.001 § | |
| Z-score ° | Mean ± SD | 0.462 ± 1.007 | ||||
| Cluster centroid | Z-score (means) | Mean ± SD | 0.481 ± 0.162 | −0.817 ± 0.000 | <0.001 § |
| Taxa Level | Bacteria Selected by PELORA | Quantity | Statistics | All Treated MDD (n = 27) | Untreated MDD (n = 7) | p-Value |
|---|---|---|---|---|---|---|
| Phylum | Candidatus Saccharibacteria | Relative abundance (%) | Median [IQR] | 0.002 [0.000–0.016] | 0.039 [0.012–0.078] | 0.028 # |
| Z-score ° | Mean ± SD | −0.189 ± 0.948 | 0.731 ± 0.908 | |||
| Lentisphaerae | Relative abundance (%) | Median [IQR] | 0.026 [0.001–0.090] | 0.223 [0.074–0.300] | 0.104 # | |
| Z-score ° | Mean ± SD | −0.142 ± 0.999 | 0.548 ± 0.857 | |||
| Elusimicrobia * | Relative abundance (%) | Median [IQR] | 0.000 [0.000–0.000] | Absent | 0.178 § | |
| Z-score ° | Mean ± SD | 0.099 ± 1.104 | ||||
| Euryarchaeota | Relative abundance (%) | Median [IQR] | 0.000 [0.000–0.010] | 0.004 [0.001–0.031] | 0.224 # | |
| Z-score ° | Mean ± SD | −0.107 ± 1.012 | 0.414 ± 0.898 | |||
| Unknown phylum * | Relative abundance (%) | Median [IQR] | 1.098 [0.927–1.496] | 0.842 [0.705–0.992] | 0.239 # | |
| Z-score ° | Mean ± SD | 0.104 ± 1.018 | −0.402 ± 0.876 | |||
| Proteobacteria | Relative abundance (%) | Median [IQR] | 2.153 [1.601–3.434] | 2.118 [1.181–3.516] | 0.518 # | |
| Z-score ° | Mean ± SD | 0.058 ± 0.998 | −0.222 ± 1.054 | |||
| Cluster centroid | Z-score (means) | Mean ± SD | −0.097 ± 0.283 | 0.376 ± 0.200 | <0.001 # | |
| Family | Acidaminococcaceae | Relative abundance (%) | Median [IQR] | 0.016 [0.004–1.165] | 2.183 [0.747–3.229] | 0.009 # |
| Z-score ° | Mean ± SD | −0.222 ± 0.983 | 0.856 ± 0.484 | |||
| Micrococcaceae | Relative abundance (%) | Median [IQR] | 0.001 [0.000–0.004] | 0.005 [0.004–0.011] | 0.029 # | |
| Z-score ° | Mean ± SD | −0.188 ± 0.938 | 0.723 ± 0.958 | |||
| Fusobacteriaceae | Relative abundance (%) | Median [IQR] | 0.000 [0.000–0.002] | 0.002 [0.000–0.049] | 0.154 # | |
| Z-score ° | Mean ± SD | −0.125 ± 0.921 | 0.483 ± 1.218 | |||
| Propionibacteriaceae * | Relative abundance (%) | Median [IQR] | 0.059 [0.002–0.160] | 0.002 [0.000–0.031] | 0.159 # | |
| Z-score ° | Mean ± SD | 0.124 ± 0.971 | −0.478 ± 1.037 | |||
| Victivallaceae | Relative abundance (%) | Median [IQR] | 0.008 [0.000–0.044] | 0.223 [0.074–0.243] | 0.035 # | |
| Z-score ° | Mean ± SD | −0.182 ± 0.963 | 0.701 ± 0.869 | |||
| Peptococcaceae * | Relative abundance (%) | Median [IQR] | 0.017 [0.005–0.036] | 0.004 [0.003–0.011] | 0.130 # | |
| Z-score ° | Mean ± SD | 0.133 ± 0.995 | −0.513 ± 0.908 | |||
| Eggerthellaceae | Relative abundance (%) | Median [IQR] | 0.082 [0.052–0.134] | 0.310 [0.125–0.565] | 0.059 # | |
| Z-score ° | Mean ± SD | −0.164 ± 0.908 | 0.634 ± 1.156 | |||
| Methanobacteriaceae | Relative abundance (%) | Median [IQR] | 0.000 [0.000–0.010] | 0.004 [0.001–0.031] | 0.242 # | |
| Z-score ° | Mean ± SD | −0.103 ± 1.007 | 0.399 ± 0.932 | |||
| Oxalobacteraceae * | Relative abundance (%) | Median [IQR] | 0.002 [0.001–0.025] | 0.002 [0.001–0.019] | 0.760 # | |
| Z-score ° | Mean ± SD | 0.027 ± 1.007 | −0.105 ± 1.042 | |||
| Cluster centroid | Z-score (means) | Mean ± SD | −0.141 ± 0.176 | 0.544 ± 0.191 | <0.001 # | |
| Genus | Sanguibacteroides | Relative abundance (%) | Median [IQR] | 0.000 [0.000–0.000] | 0.001 [0.000–0.049] | <0.001 # |
| Z-score ° | Mean ± SD | −0.294 ± 0.367 | 1.136 ± 1.738 | |||
| Murimonas * | Relative abundance (%) | Median [IQR] | 0.018 [0.005–0.040] | 0.004 [0.001–0.012] | 0.031 # | |
| Z-score ° | Mean ± SD | 0.186 ± 0.888 | −0.718 ± 1.153 | |||
| Phascolarctobacterium | Relative abundance (%) | Median [IQR] | 0.003 [0.001–0.551] | 1.341 [0.080–2.583] | 0.016 # | |
| Z-score ° | Mean ± SD | −0.205 ± 0.981 | 0.792 ± 0.638 | |||
| Anaeromassilibacillus | Relative abundance (%) | Median [IQR] | 0.007 [0.003–0.019] | 0.031 [0.017–0.047] | 0.033 # | |
| Z-score ° | Mean ± SD | −0.184 ± 0.974 | 0.708 ± 0.806 | |||
| Streptomyces | Relative abundance (%) | Median [IQR] | 0.006 [0.003–0.011] | 0.015 [0.011–0.017] | 0.158 # | |
| Z-score ° | Mean ± SD | −0.124 ± 1.085 | 0.479 ± 0.254 | |||
| Dakarella * | Relative abundance (%) | Median [IQR] | 0.000 [0.000–0.000] | Absent | 0.465 § | |
| Z-score ° | Mean ± SD | 0.063 ± 1.118 | ||||
| Megasphaera * | Relative abundance (%) | Median [IQR] | 0.000 [0.000–0.001] | 0.000 [0.000–0.022] | 0.839 # | |
| Z-score ° | Mean ± SD | −0.018 ± 0.969 | 0.070 ± 1.195 | |||
| Raoultibacter * | Relative abundance (%) | Median [IQR] | 0.005 [0.000–0.027] | 0.008 [0.003–0.020] | 0.534 # | |
| Z-score ° | Mean ± SD | −0.055 ± 1.062 | 0.214 ± 0.736 | |||
| Denitrobacterium | Relative abundance (%) | Median [IQR] | 0.000 [0.000–0.000] | 0.013 [0.000–0.044] | 0.006 # | |
| Z-score ° | Mean ± SD | −0.231 ± 0.744 | 0.891 ± 1.392 | |||
| Bariatricus * | Relative abundance (%) | Median [IQR] | 0.000 [0.000–0.000] | 0.000 [0.000–0.002] | 0.513 # | |
| Z-score ° | Mean ± SD | −0.058 ± 0.960 | 0.225 ± 1.196 | |||
| Cluster centroid | Z-score (means) | Mean ± SD | −0.116 ± 0.116 | 0.446 ± 0.072 | <0.001 # | |
| Species | Prevotella sporal clone IK062 | Relative abundance (%) | Median [IQR] | 0.000 [0.000–0.000] | 0.001 [0.000–0.081] | <0.001 # |
| Z-score ° | Mean ± SD | −0.317 ± 0.292 | 1.224 ± 1.712 | |||
| Phascolarctobacterium faecium | Relative abundance (%) | Median [IQR] | 0.000 [0.000–0.000] | 0.000 [0.000–1.514] | 0.028 # | |
| Z-score ° | Mean ± SD | −0.189 ± 0.693 | 0.730 ± 1.624 | |||
| Murimonas intestine * | Relative abundance (%) | Median [IQR] | 0.017 [0.004–0.039] | 0.004 [0.001–0.010] | 0.038 # | |
| Z-score ° | Mean ± SD | 0.179 ± 0.905 | −0.691 ± 1.117 | |||
| Ruminococcus torques | Relative abundance (%) | Median [IQR] | 0.008 [0.001–0.090] | 0.157 [0.077–1.008] | 0.053 # | |
| Z-score ° | Mean ± SD | −0.168 ± 0.947 | 0.648 ± 0.998 | |||
| Parabacteroides, sp J1502 * | Relative abundance (%) | Median [IQR] | 0.001 [0.000–0.004] | 0.000 [0.000–0.000] | 0.088 # | |
| Z-score ° | Mean ± SD | 0.149 ± 1.043 | −0.575 ± 0.546 | |||
| Sanguibacteroides justesenii | Relative abundance (%) | Median [IQR] | 0.000 [0.000–0.000] | 0.001 [0.000–0.046] | <0.001 # | |
| Z-score ° | Mean ± SD | −0.294 ± 0.369 | 1.134 ± 1.738 | |||
| Bacteroides vulgatus * | Relative abundance (%) | Median [IQR] | 1.039 [0.039–3.004] | 0.015 [0.001–0.559] | 0.070 # | |
| Z-score ° | Mean ± SD | 0.158 ± 0.901 | −0.608 ± 1.198 | |||
| Flintibacter butyricus | Relative abundance (%) | Median [IQR] | 0.006 [0.002–0.010] | 0.015 [0.006–0.074] | 0.059 # | |
| Z-score ° | Mean ± SD | −0.164 ± 0.985 | 0.632 ± 0.841 | |||
| Roseburia intestinalis * | Relative abundance (%) | Median [IQR] | 0.043 [0.015–0.302] | 0.051 [0.019–0.383] | 0.684 # | |
| Z-score ° | Mean ± SD | 0.036 ± 0.957 | −0.140 ± 1.226 | |||
| Dialister, sp S7D | Relative abundance (%) | Median [IQR] | 0.001 [0.000–0.007] | 0.010 [0.003–0.011] | 0.090 # | |
| Z-score ° | Mean ± SD | −0.148 ± 0.968 | 0.572 ± 0.977 | |||
| Desulfovibrio fairfieldensis | Relative abundance (%) | Median [IQR] | 0.000 [0.000–0.000] | Absent | 0.465 § | |
| Z-score ° | Mean ± SD | 0.053 ± 1.120 | ||||
| Cluster centroid | Z-score (means) | Mean ± SD | −0.159 ± 0.090 | 0.613 ± 0.055 | <0.001 # |
| Taxa Level | Bacteria Selected by PELORA | Quantity | Statistics | TR MDD (n = 19) | R MDD (n = 8) | p-Value # |
|---|---|---|---|---|---|---|
| Phylum | Candidatus Saccharibacteria | Relative abundance (%) | Median [IQR] | 0.008 [0.002–0.019] | Absent | 0.001 § |
| Z-score ° | Mean ± SD | 0.428 ± 0.889 | ||||
| Thaumarchaeota * | Relative abundance (%) | Median [IQR] | Absent | 0.000 [0.000–0.001] | 0.026 § | |
| Z-score ° | Mean ± SD | 0.614 ± 1.761 | ||||
| Proteobacteria * | Relative abundance (%) | Median [IQR] | 1.906 [1.442–2.850] | 3.135 [2.102–5.772] | 0.019 | |
| Z-score ° | Mean ± SD | −0.285 ± 0.732 | 0.677 ±1.261 | |||
| Planctomycetes | Relative abundance (%) | Median [IQR] | 0.000 [0.000–0.003] | Absent | 0.023 § | |
| Z-score ° | Mean ± SD | 0.247 ± 1.108 | ||||
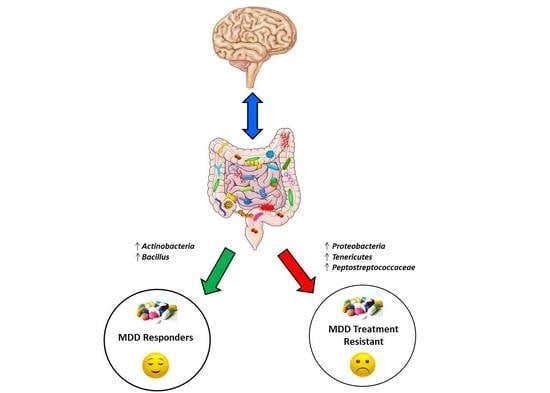
| Actinobacteria | Relative abundance (%) | Median [IQR] | 2.612 [1.441–3.709] | 1.105 [0.699–1.342] | 0.142 | |
| Z-score ° | Mean ± SD | 0.185 ± 1.048 | −0.439 ± 0.759 | |||
| Tenericutes * | Relative abundance (%) | Median [IQR] | 0.003 [0.001–0.039] | 0.005 [0.001–0.128] | 0.639 | |
| Z-score ° | Mean ± SD | −0.060 ± 0.980 | 0.143 ± 1.101 | |||
| Cluster centroid | Z-score (means) | Mean ± SD | 0.244 ± 0.230 | −0.580 ± 0.314 | <0.001 | |
| Family | Peptostreptococcaceae (Cluster centroid) | Relative abundance (%) | Median [IQR] | 0.000 [0.000–0.000] | 0.008 [0.006–0.013] | <0.001 |
| Z-score ° | Mean ± SD | −0.581 ± 0.000 | 1.613 ± 0.377 | |||
| Genus | Bacillus | Relative abundance (%) | Median [IQR] | 0.005 [0.003–0.008] | Absent | <0.001 § |
| Z-score ° | Mean ± SD | 0.587 ± 0.464 | ||||
| Candidatus Soleaferrea | Relative abundance (%) | Median [IQR] | 0.006 [0.005–0.010] | Absent | <0.001 § | |
| Z-score ° | Mean ± SD | 0.598 ± 0.411 | ||||
| Intestinibacillus | Relative abundance (%) | Median [IQR] | 0.003 [0.001–0.019] | Absent | 0.001 § | |
| Z-score ° | Mean ± SD | 0.414 ± 0.913 | ||||
| Porphyromonas | Relative abundance (%) | Median [IQR] | 0.005 [0.002–0.011] | Absent | <0.001 § | |
| Z-score ° | Mean ± SD | 0.505 ± 0.731 | ||||
| Yersinia * | Relative abundance (%) | Median [IQR] | Absent | 0.003 [0.001–0.020] | <0.001 § | |
| Z-score ° | Mean ± SD | 1.142 ± 1.263 | ||||
| Peptococcus * | Relative abundance (%) | Median [IQR] | Absent | 0.004 [0.000–0.036] | <0.001 § | |
| Z-score ° | Mean ± SD | 1.078 ± 1.352 | ||||
| Cluster centroid | Z-score (means) | Mean ± SD | 0.507 ± 0.136 | −1.203 ± 0.132 | <0.001 | |
| Species | Fenollaria timonensis | Relative abundance (%) | Median [IQR] | Absent | 0.007 [0.005–0.017] | <0.001 § |
| Z-score ° | Mean ± SD | 1.446 ± 0.564 | ||||
| Robinsoniella sp, MCWD5 * | Relative abundance (%) | Median [IQR] | 0.009 [0.007–0.014] | Absent | <0.001 § | |
| Z-score ° | Mean ± SD | 0.603 ± 0.384 | ||||
| Massilioclostridium coli * | Relative abundance (%) | Median [IQR] | 0.007 [0.006–0.013] | Absent | <0.001 § | |
| Z-score ° | Mean ± SD | 0.569 ± 0.541 | ||||
| Blautia sp, canine oral taxon 337 | Relative abundance (%) | Median [IQR] | Absent | 0.008 [0.005–0.014] | <0.001 § | |
| Z-score ° | Mean ± SD | 1.464 ± 0.485 | ||||
| Papillibacter cinnamivorans | Relative abundance (%) | Median [IQR] | Absent | 0.004 [0.001–0.024] | <0.001 § | |
| Z-score ° | Mean ± SD | 1.247 ± 1.090 | ||||
| Yersinia pseudotuberculosis | Relative abundance (%) | Median [IQR] | Absent | 0.002 [0.001–0.020] | <0.001 § | |
| Z-score ° | Mean ± SD | 1.134 ± 1.275 | ||||
| Cluster centroid | Z-score (means) | Mean ± SD | −0.567 ± 0.088 | 1.346 ± 0.183 | <0.001 |
| Taxa Level | Bacteria Selected by PELORA | Quantity | Statistics | R MDD (n = 19) | HC (n = 20) | p-Value # |
|---|---|---|---|---|---|---|
| Phylum | Nitrospirae | (Relative abundance (%) | Median [IQR] | Absent | 0.000 [0.000–0.006] | 0.001 § |
| Z-score ° | Mean ± SD | 0.483 ± 1.223 | ||||
| Proteobacteria | Relative abundance (%) | Median [IQR] | 1.906 [1.442–2.850] | 2.971 [2.189–4.384] | 0.020 | |
| Z-score ° | Mean ± SD | −0.377 ± 0.658 | 0.358 ± 1.146 | |||
| Elusimicrobia * | Relative abundance (%) | Median [IQR] | 0.000 [0.000–0.001] | Absent | 0.007 § | |
| Z-score ° | Mean ± SD | 0.374 ± 1.350 | ||||
| Cluster centroid | Z-score (means) | Mean ± SD | −0.420 ± 0.516 | 0.399 ± 0.438 | <0.001 | |
| Family | Peptostreptococcaceae | Relative abundance (%) | Median [IQR] | Absent | 0.008 [0.004–0.011] | <0.001 § |
| Z-score ° | Mean ± SD | 0.916 ± 0.435 | ||||
| Flavobacteriaceae * | Relative abundance (%) | Median [IQR] | 0.008 [0.005–0.015] | Absent | <0.001 § | |
| Z-score ° | Mean ± SD | 0.967 ± 0.431 | ||||
| Cluster centroid | Z-score (means) | Mean ± SD | −0.965 ± 0.216 | 0.917 ± 0.217 | <0.001 | |
| Genus | Fenollaria (Cluster centroid) | Relative abundance (%) | Median [IQR] | 0.008 [0.004–0.010] | Absent | <0.001 § |
| Z-score ° | Mean ± SD | 0.979 ± 0.373 | −0.930 ± 0.000 | |||
| Species | Robinsoniella sp, MCWD5 (Cluster centroid) | Relative abundance (%) | Median [IQR] | 0.009 [0.007–0.014] | Absent | <0.001 § |
| Z-score ° | Mean ± SD | 0.981 ± 0.361 | −0.932 ± 0.000 |
| Taxa Level | Bacteria Selected by PELORA | Quantity | Statistics | TR MDD (n = 8) | HC (n = 20) | p-Value # |
|---|---|---|---|---|---|---|
| Phylum | Candidatus Saccharibacteria (Cluster centroid) | Relative abundance (%) | Median [IQR] | Absent | 0.006 [0.004–0.014] | <0.001 § |
| Z-score ° | Mean ± SD | 0.505 ± 0.693 | ||||
| Family | Flavobacteriaceae (Cluster centroid) | Relative abundance (%) | Median [IQR] | 0.007 [0.003–0.019] | Absent | <0.001 § |
| Z-score ° | Mean ± SD | 1.470 ± 0.633 | −0.588 ± 0.000 | |||
| Genus | Fenollaria | (Relative abundance (%) | Median [IQR] | 0.007 [0.006–0.018] | Absent | <0.001 § |
| Z-score ° | Mean ± SD | 1.484 ± 0.576 | ||||
| Hungatella | (Relative abundance (%) | Median [IQR] | 0.003 [0.001–0.094] | Absent | <0.001 § | |
| Z-score ° | Mean ± SD | 1.260 ± 1.148 | ||||
| Yersinia | Relative abundance (%) | Median [IQR] | 0.003 [0.001–0.020] | Absent | <0.001 § | |
| Z-score ° | Mean ± SD | 1.177 ± 1.281 | ||||
| Citrobacter * | Relative abundance (%) | Median [IQR] | 0.000 [0.000–0.002] | Absent | 0.001 § | |
| Z-score ° | Mean ± SD | 0.859 ± 1.636 | ||||
| Cluster centroid | Z-score (means) | Mean ± SD | 0.765 ± 0.169 | −0.306 ± 0.000 | <0.001 | |
| Species | Massilioclostridium coli | Relative abundance (%) | Median [IQR] | Absent | 0.009 [0.008–0.013] | <0.001 § |
| Z-score ° | Mean ± SD | 0.595 ± 0.342 | ||||
| Fenollaria timonensis * | Relative abundance (%) | Median [IQR] | 0.007 [0.005–0.017] | Absent | <0.001 § | |
| Z-score ° | Mean ± SD | 1.486 ± 0.571 | ||||
| Cluster centroid | Z-score (means) | Mean ± SD | −1.486 ± 0.286 | 0.595 ± 0.171 | <0.001 |
© 2020 by the authors. Licensee MDPI, Basel, Switzerland. This article is an open access article distributed under the terms and conditions of the Creative Commons Attribution (CC BY) license (http://creativecommons.org/licenses/by/4.0/).
Share and Cite
Fontana, A.; Manchia, M.; Panebianco, C.; Paribello, P.; Arzedi, C.; Cossu, E.; Garzilli, M.; Montis, M.A.; Mura, A.; Pisanu, C.; et al. Exploring the Role of Gut Microbiota in Major Depressive Disorder and in Treatment Resistance to Antidepressants. Biomedicines 2020, 8, 311. https://0-doi-org.brum.beds.ac.uk/10.3390/biomedicines8090311
Fontana A, Manchia M, Panebianco C, Paribello P, Arzedi C, Cossu E, Garzilli M, Montis MA, Mura A, Pisanu C, et al. Exploring the Role of Gut Microbiota in Major Depressive Disorder and in Treatment Resistance to Antidepressants. Biomedicines. 2020; 8(9):311. https://0-doi-org.brum.beds.ac.uk/10.3390/biomedicines8090311
Chicago/Turabian StyleFontana, Andrea, Mirko Manchia, Concetta Panebianco, Pasquale Paribello, Carlo Arzedi, Eleonora Cossu, Mario Garzilli, Maria Antonietta Montis, Andrea Mura, Claudia Pisanu, and et al. 2020. "Exploring the Role of Gut Microbiota in Major Depressive Disorder and in Treatment Resistance to Antidepressants" Biomedicines 8, no. 9: 311. https://0-doi-org.brum.beds.ac.uk/10.3390/biomedicines8090311