
Reno-Protective Effect of GLP-1 Receptor Agonists in Type1 Diabetes: Dual Action on TRPC6 and NADPH Oxidases

 and
and 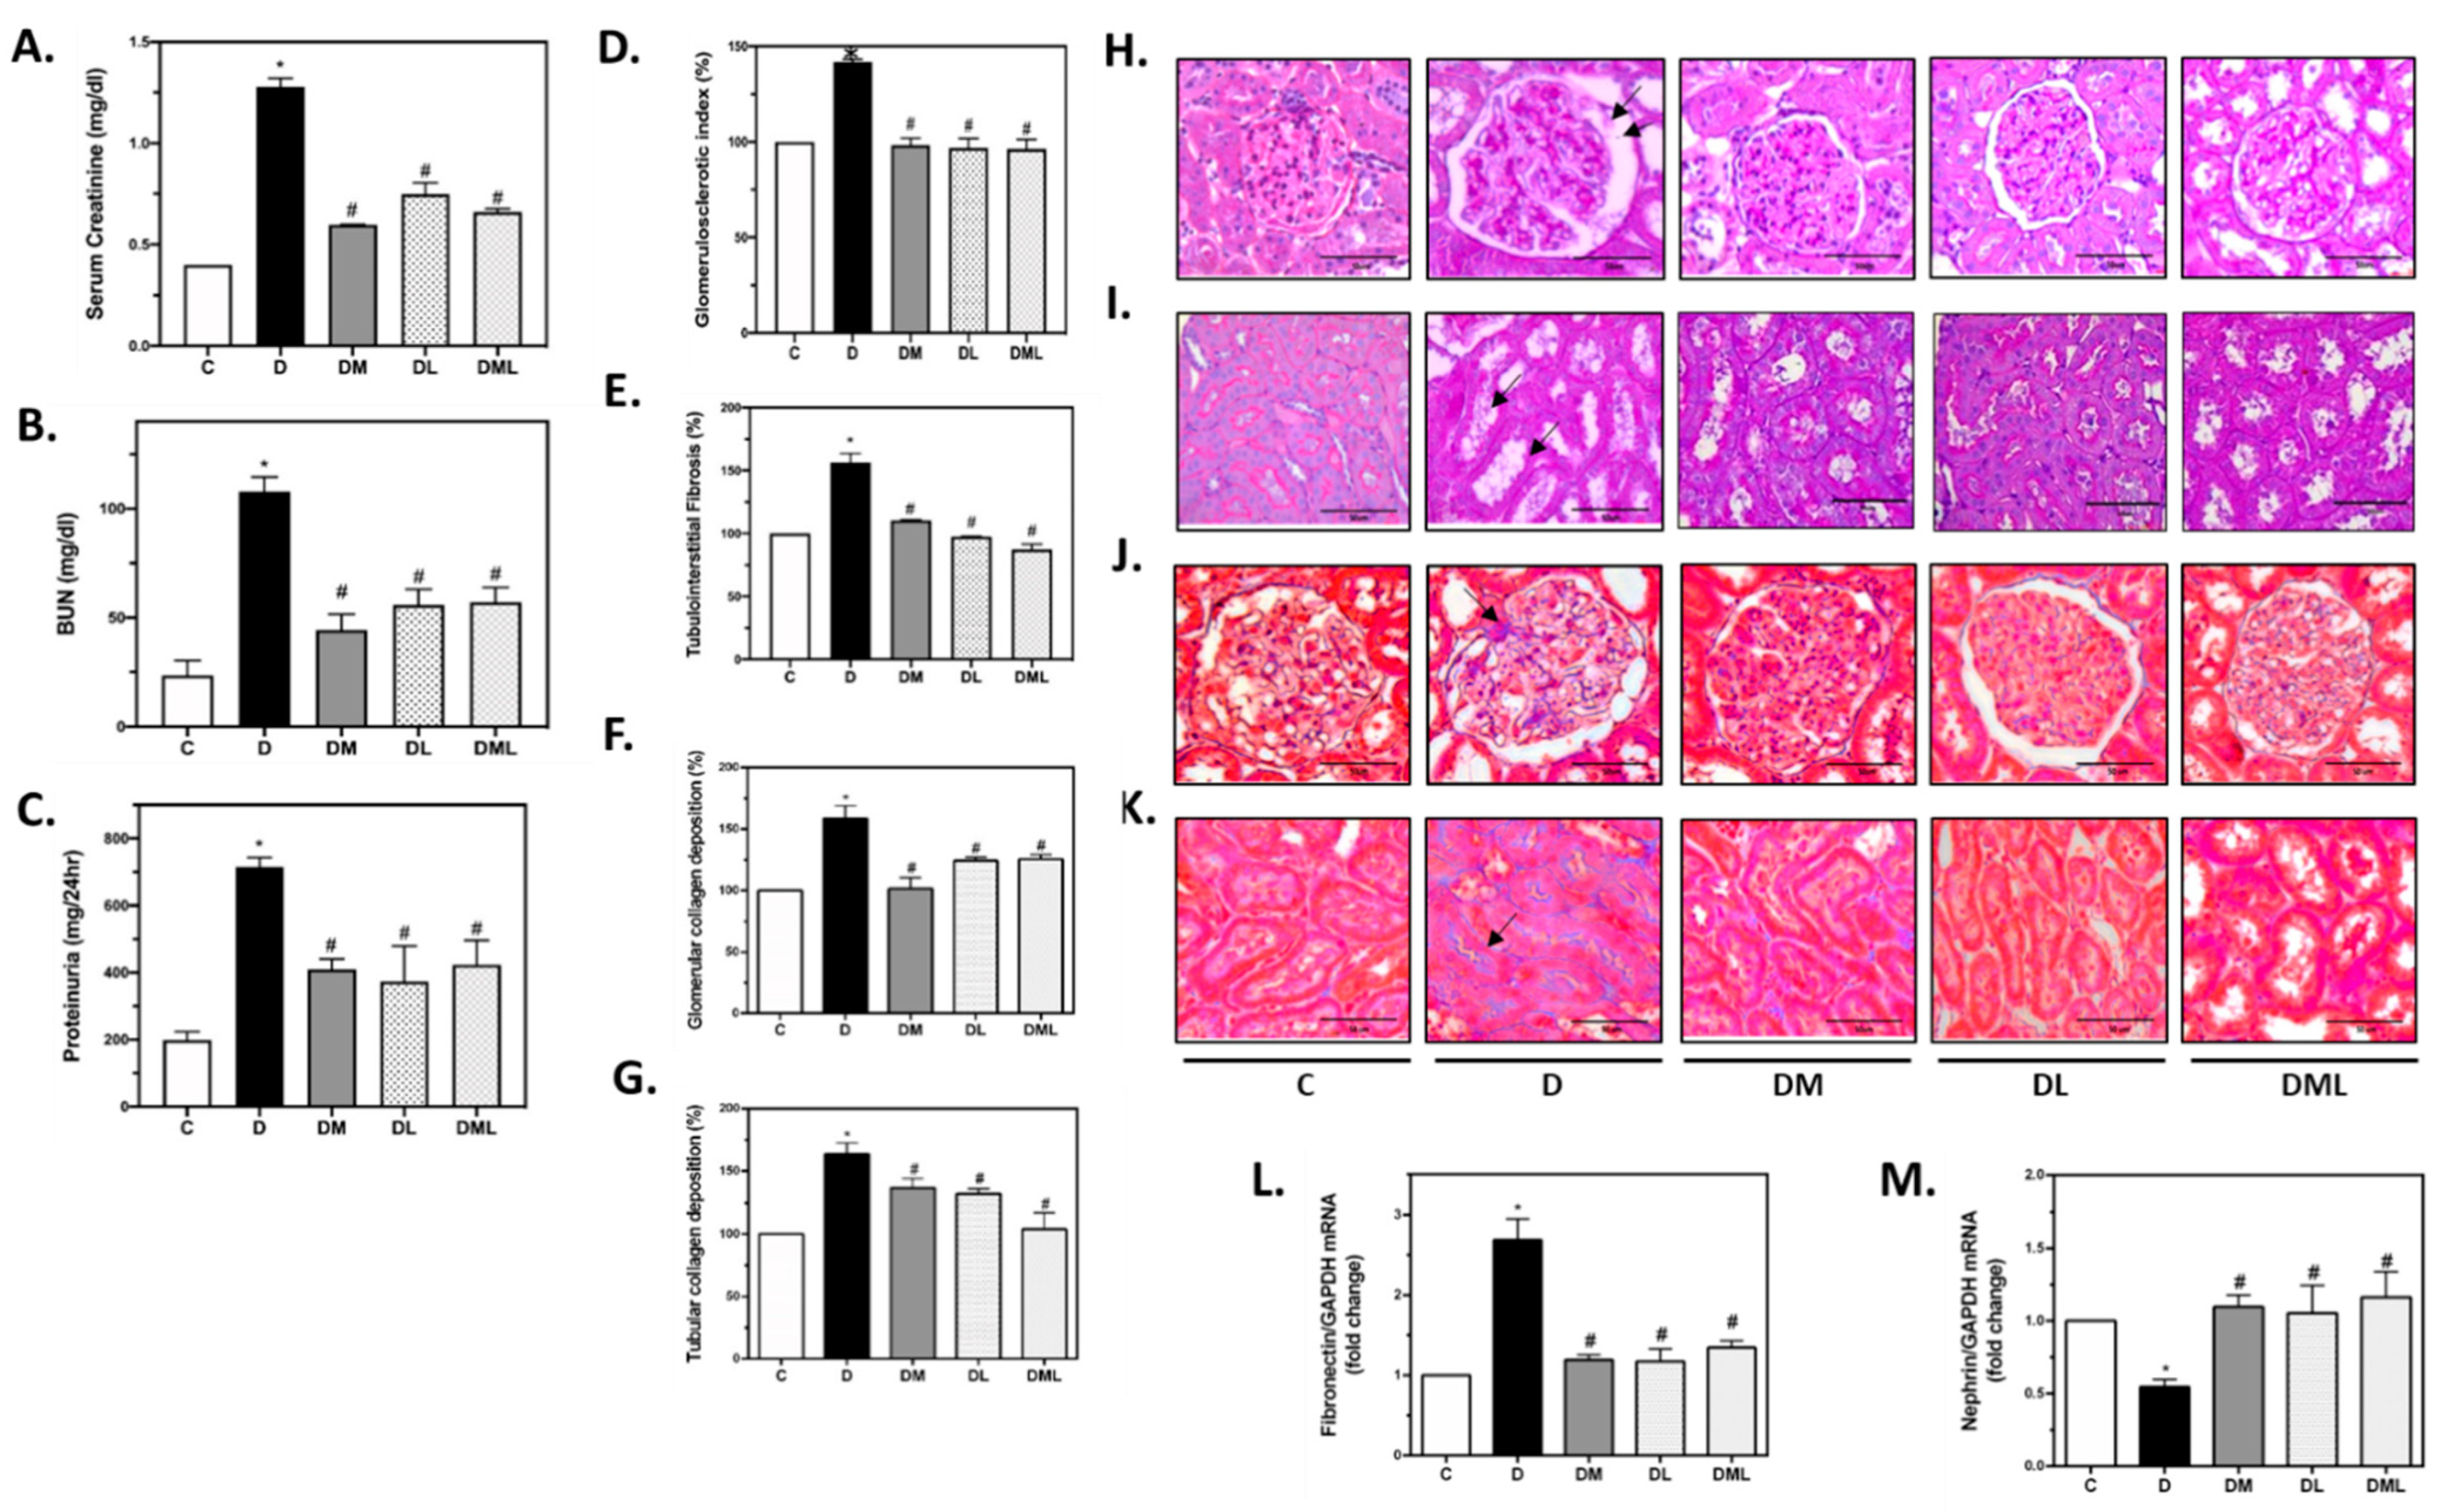
Abstract
:1. Introduction
2. Materials and Methods
2.1. Animal Studies
2.2. Sacrifice and Organ Harvesting
2.3. Blood–Urine Biochemical Analysis
2.4. mRNA Extraction and cDNA Synthesis
2.5. Real-Time PCR
2.6. Periodic Acid-Schiff (PAS) and Masson’s Trichrome (MT) Staining
2.7. AMPK Activity Assay
2.8. Immunohistochemistry for TRPC6
2.9. Western Blot
2.10. Detection of Intracellular Superoxide in Kidney Cortex Using HPLC
2.11. NADPH Oxidase Activity Analysis
2.12. Protein Interactions and Pathway Analysis
2.13. Statistical Analysis
3. Results
3.1. Metabolic Parameters
3.2. Liraglutide, Metformin or Their Combination Reverse Renal Dysfunction Observed in T1DM Rats
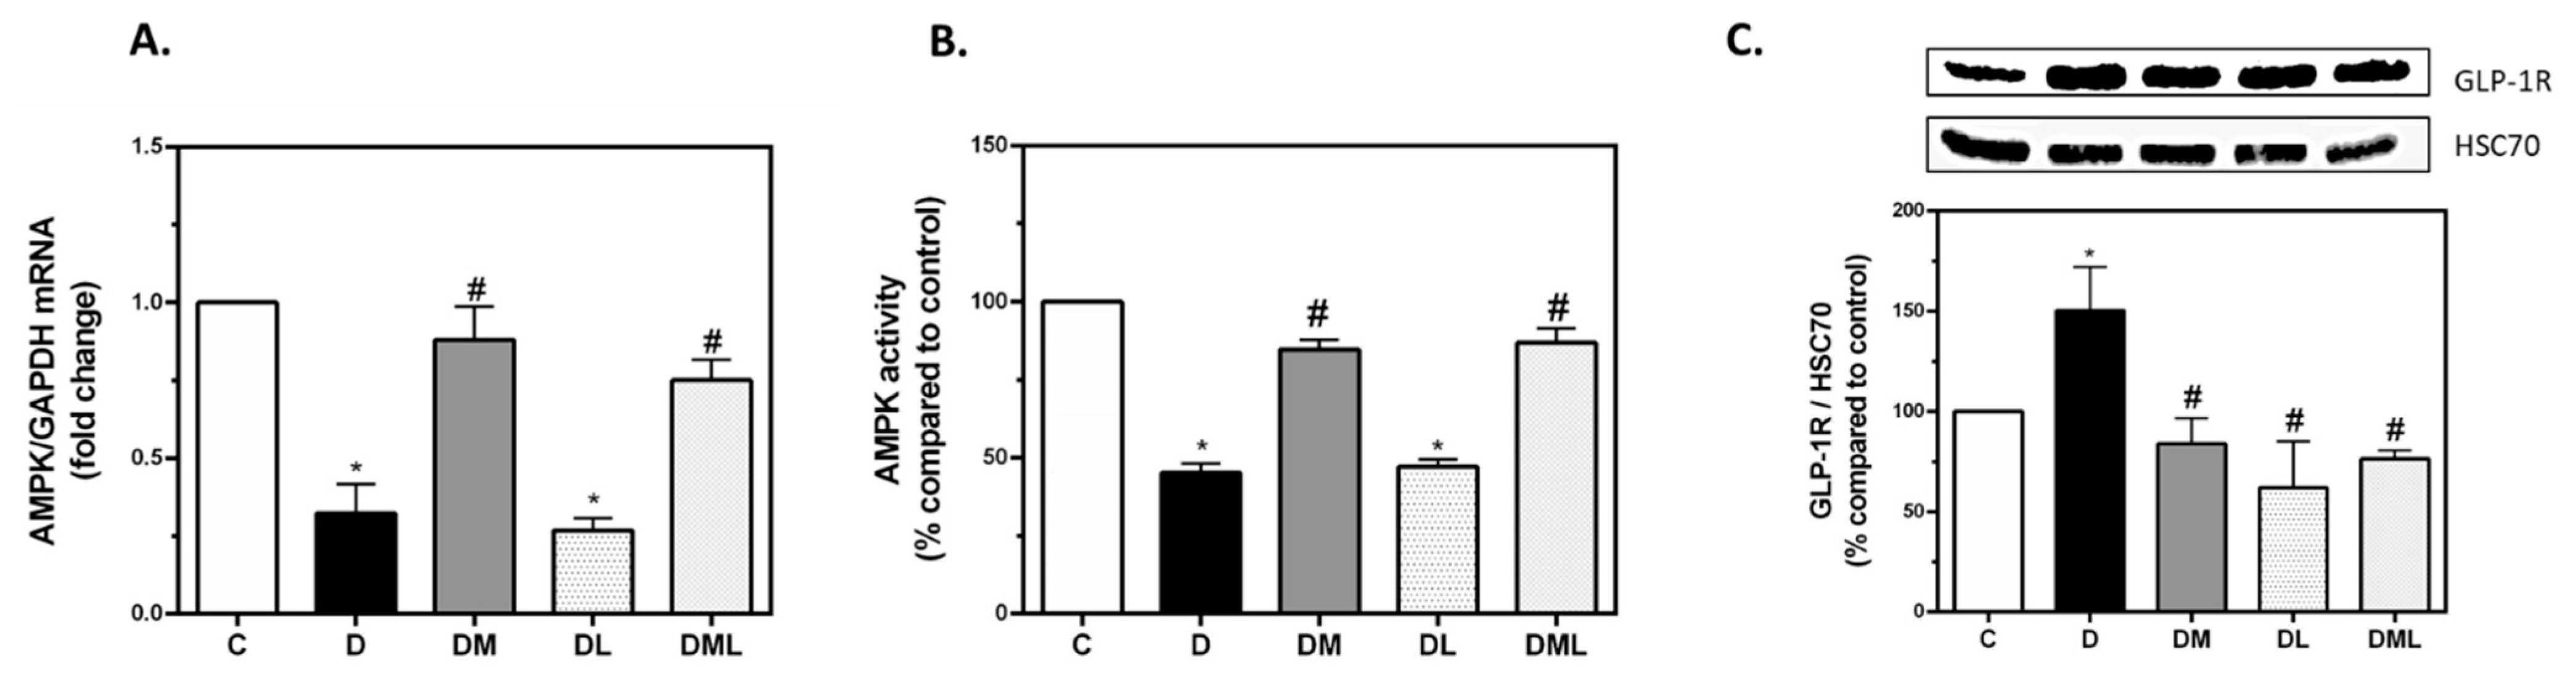
3.3. Treatment with Pharmacological Doses of Liraglutide, Metformin or Their Combination Reversed T1DM-Induced Alteration in Their Respective Signaling Targets
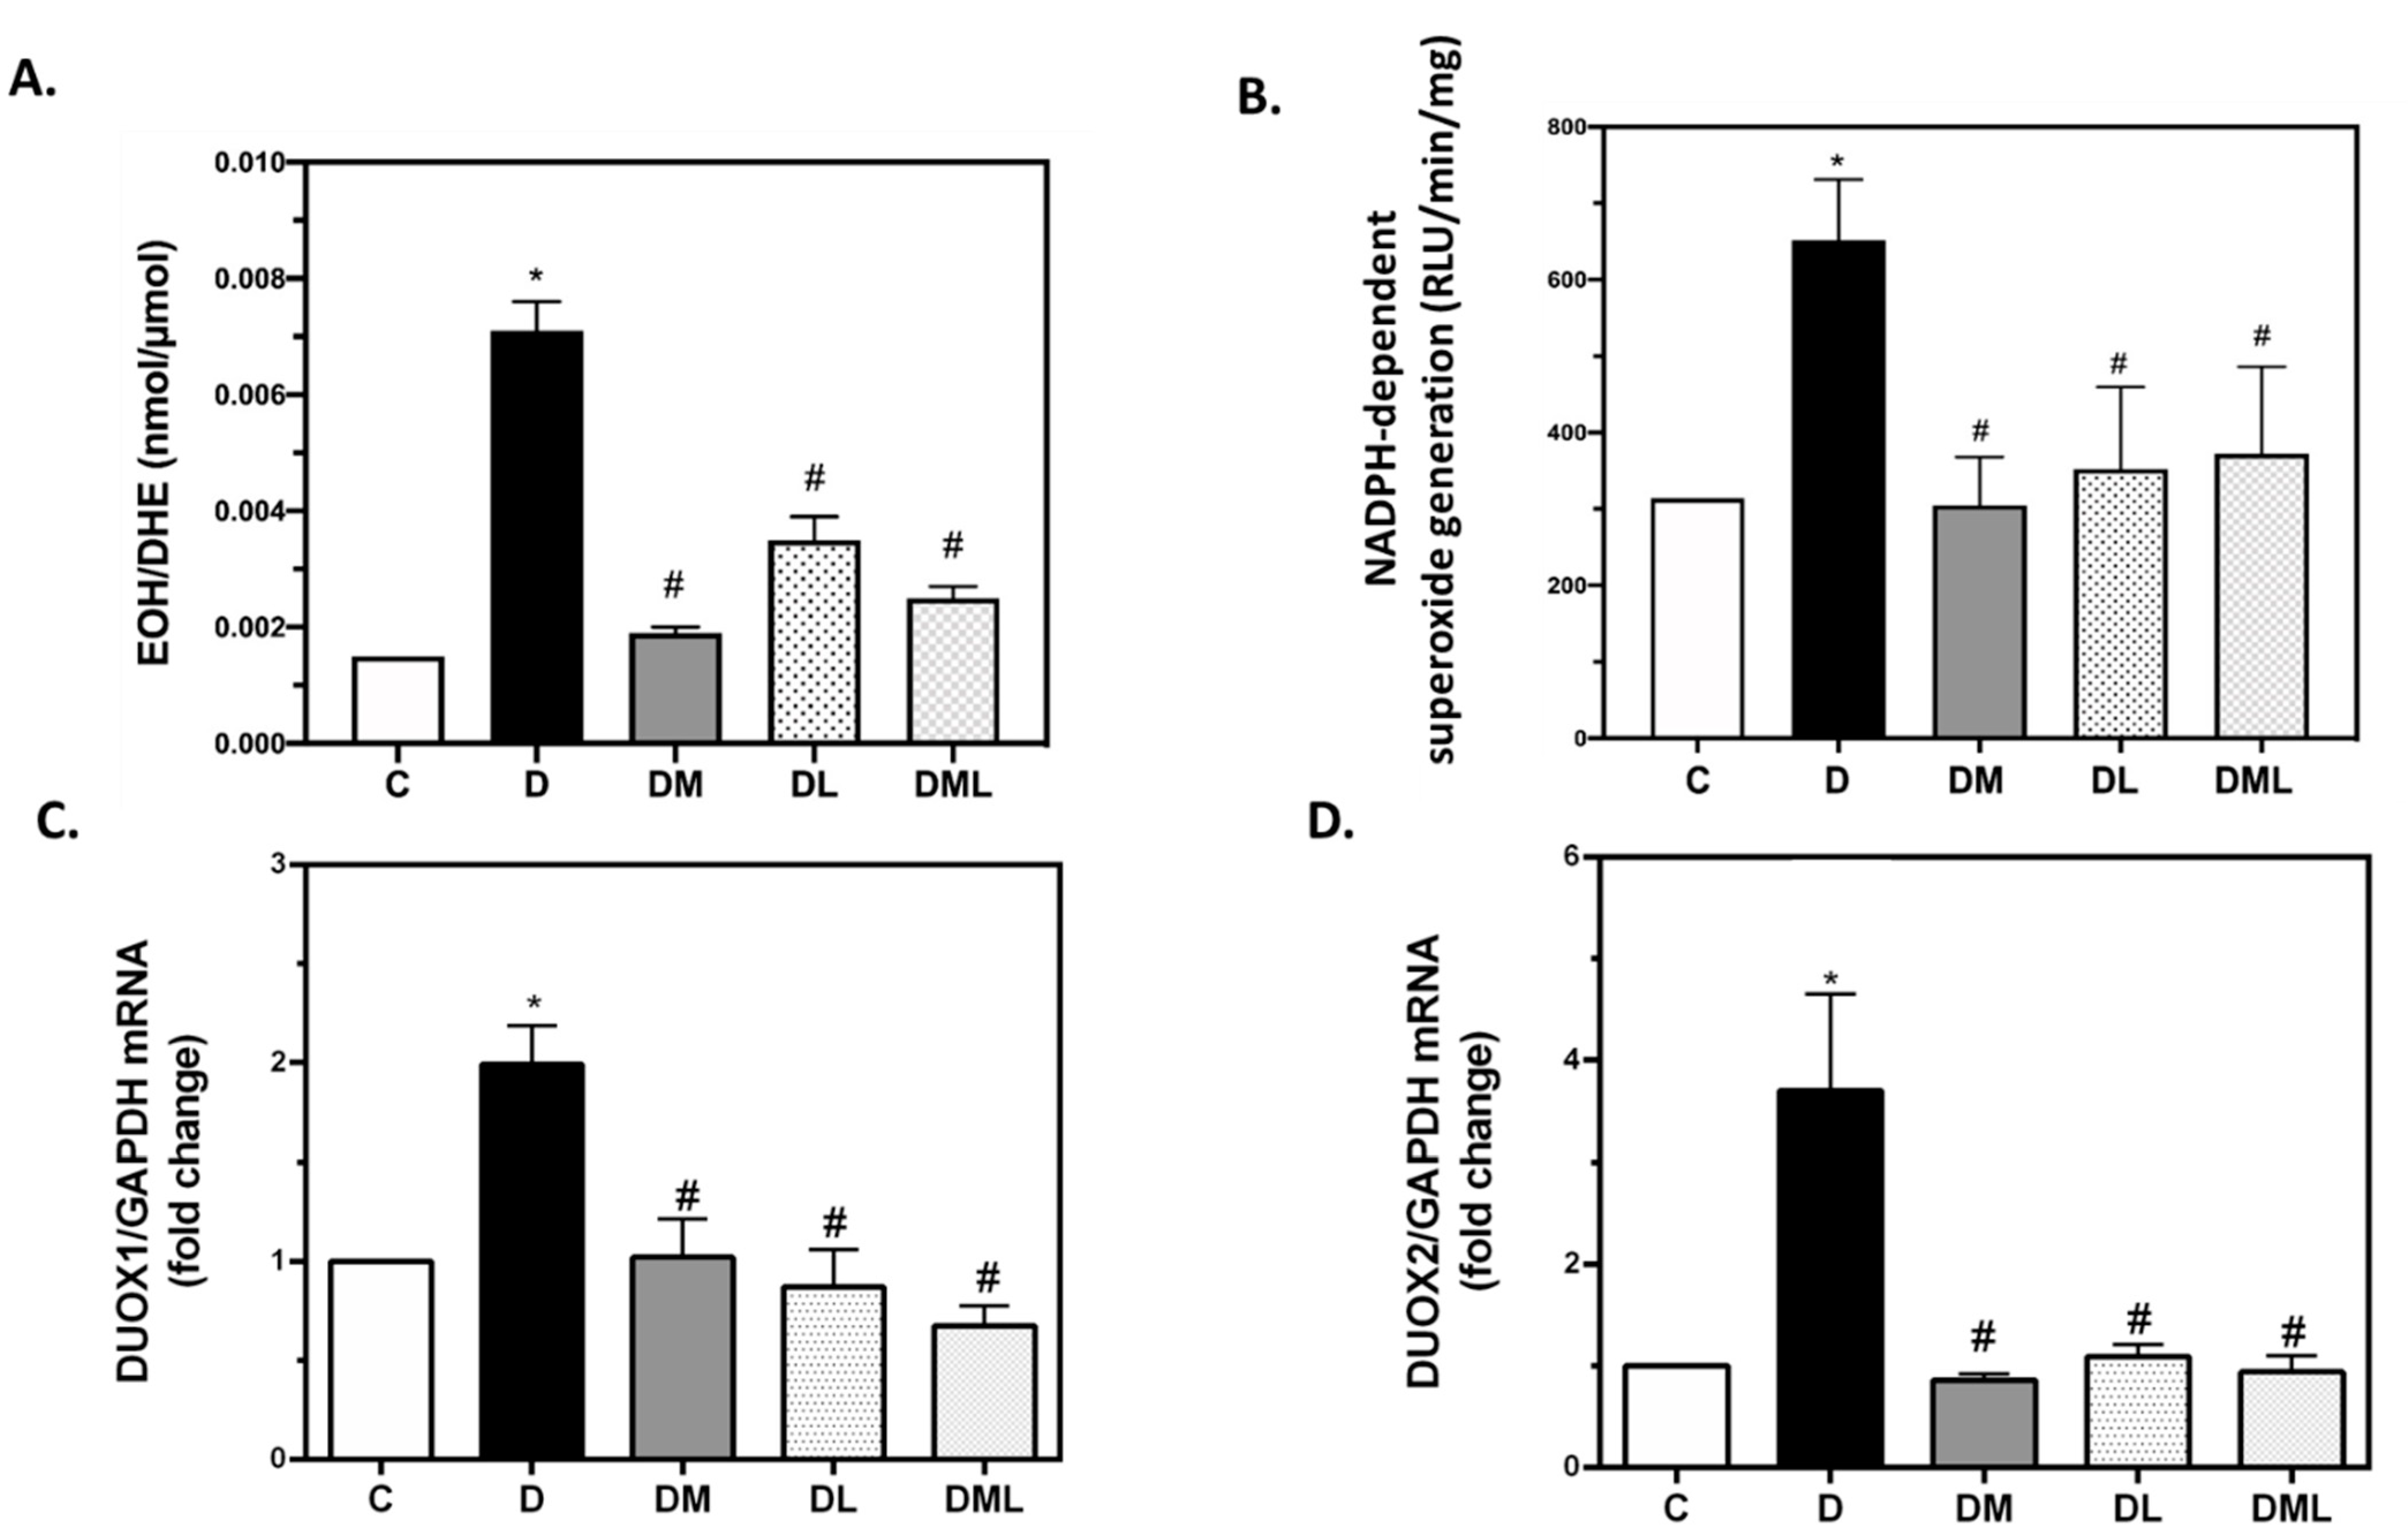
3.4. DUOX1 and DUOX2 of the NADPH Family of Enzymes Play a Role in T1DM-Induced ROS Production
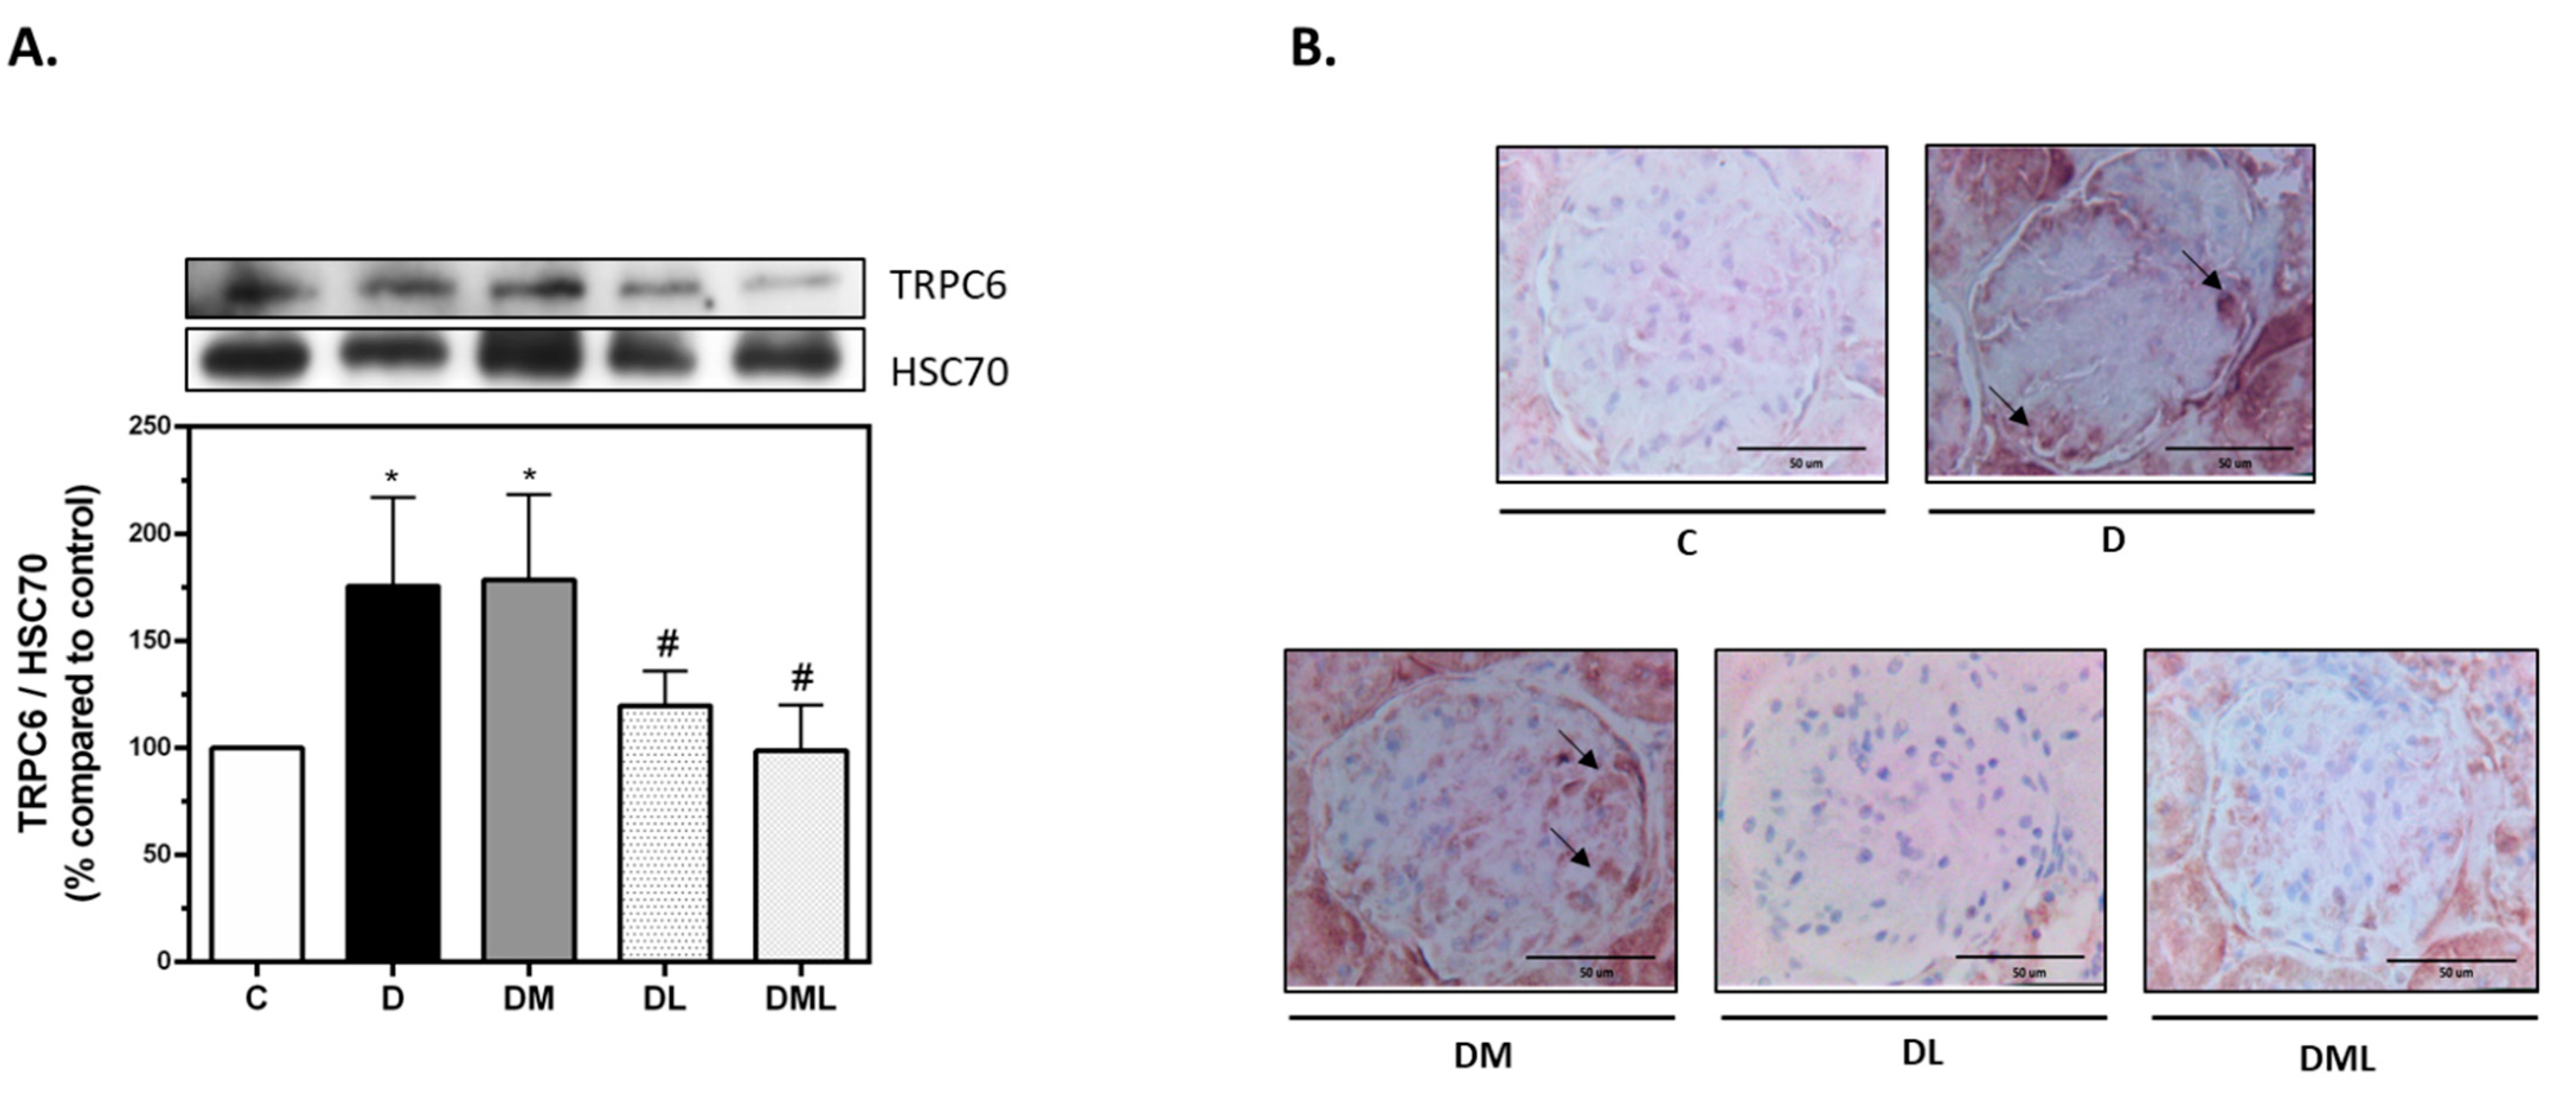
3.5. GLP-1R but Not AMPK Regulate TRPC6 Expression in T1DM Rats
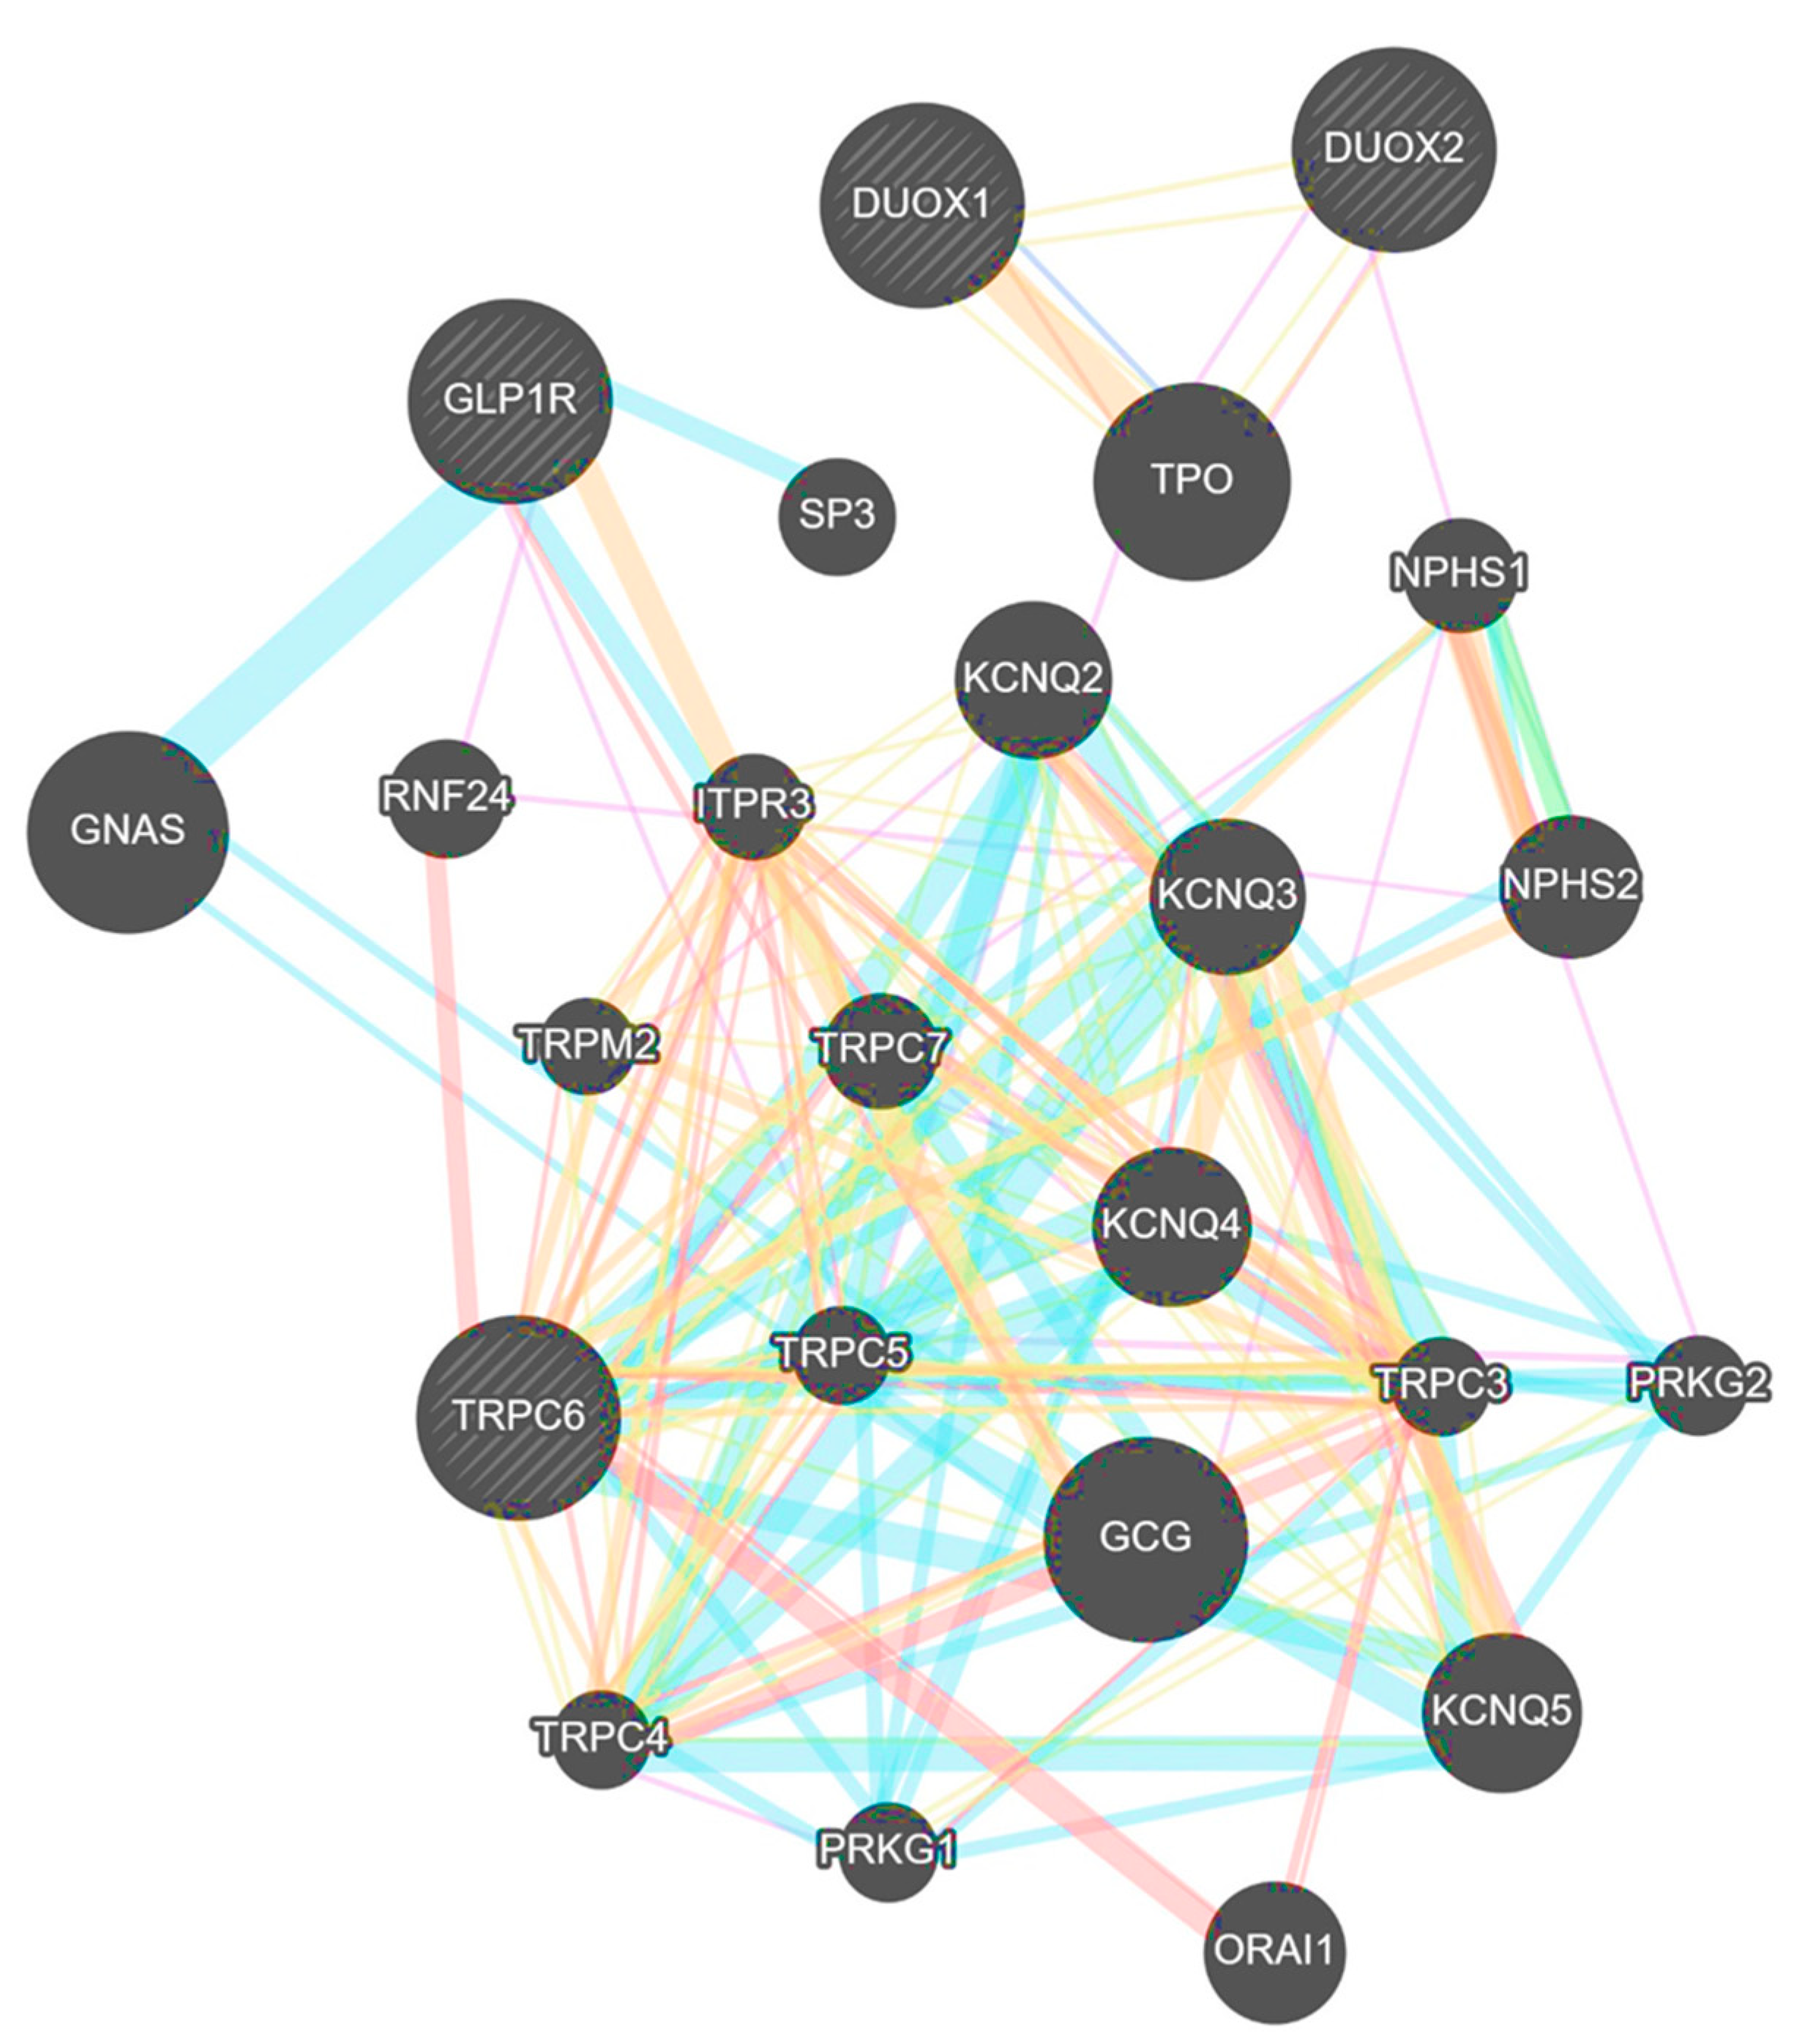
3.6. TRPC6 Interacts with DUOX1, DUOX2 and GLP-1R in Humans
4. Discussion
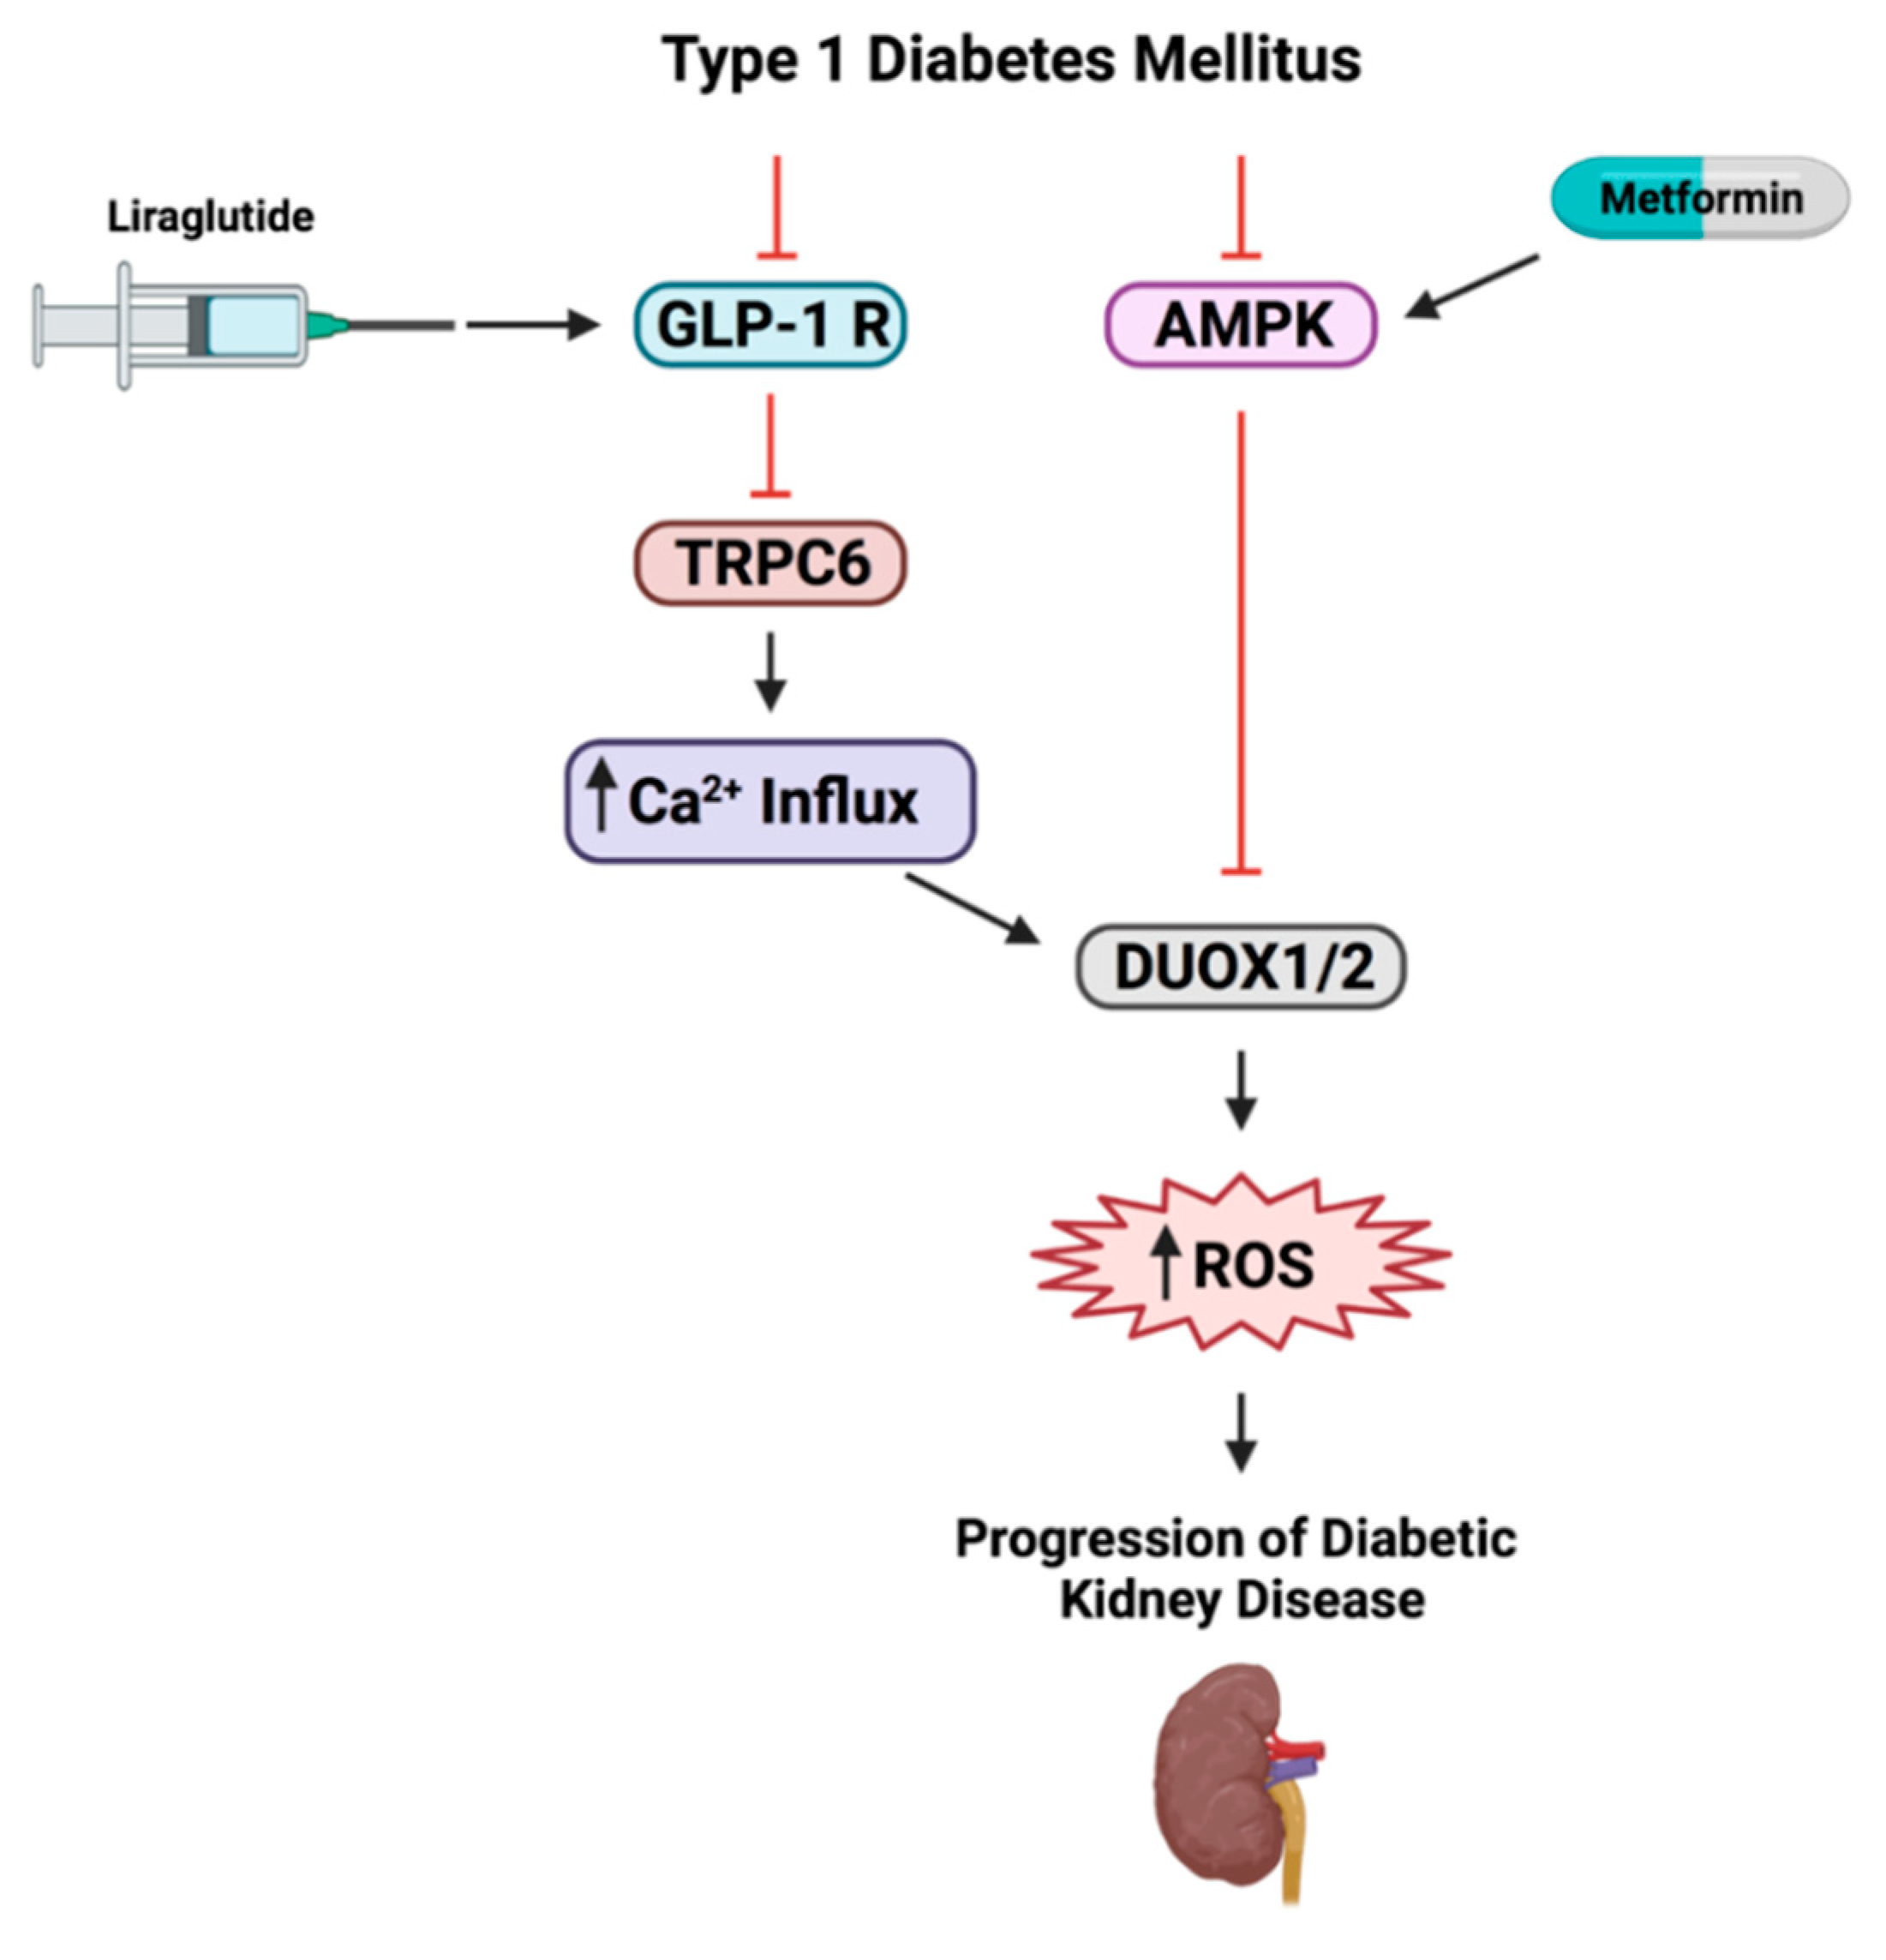
5. Conclusions
Supplementary Materials
Author Contributions
Funding
Institutional Review Board Statement
Informed Consent Statement
Data Availability Statement
Acknowledgments
Conflicts of Interest
References
- Association, A.D. Diagnosis and classification of diabetes mellitus. Diabetes Care 2010, 33, S62–S69. [Google Scholar] [CrossRef] [PubMed]
- Thallas-Bonke, V.; Cooper, M.E. Tandem inhibition of PKC in diαβetic nephropathy: It takes two to tango? Diabetes 2013, 62, 1010–1011. [Google Scholar] [CrossRef] [PubMed]
- Pavenstadt, H.; Kriz, W.; Kretzler, M. Cell biology of the glomerular podocyte. Physiol. Rev. 2003, 83, 253–307. [Google Scholar] [CrossRef] [PubMed]
- Blattner, S.M.; Hodgin, J.B.; Nishio, M.; Wylie, S.A.; Saha, J.; Soofi, A.A.; Vining, C.; Randolph, A.; Herbach, N.; Wanke, R. Divergent functions of the Rho GTPases Rac1 and Cdc42 in podocyte injury. Kidney Int. 2013, 84, 920–930. [Google Scholar] [CrossRef] [PubMed]
- Melmed, S.; Polonsky, K.S.; Larsen, P.R.; Kronenberg, H.M. Williams Textbook of Endocrinology, 13th ed.; Elsevier Health Sciences: Amsterdam, The Netherlands, 2015. [Google Scholar]
- Chen, S.; Meng, X.F.; Zhang, C. Role of NADPH oxidase-mediated reactive oxygen species in podocyte injury. Biomed Res. Int. 2013, 2013, 839761. [Google Scholar] [CrossRef]
- Bedard, K.; Krause, K.-H. The NOX family of ROS-generating NADPH oxidases: Physiology and pathophysiology. Physiol. Rev. 2007, 87, 245–313. [Google Scholar] [CrossRef]
- Dryer, S.E.; Reiser, J. TRPC6 channels and their binding partners in podocytes: Role in glomerular filtration and pathophysiology. Am. J. Physiol. Physiol. 2010, 299, F689–F701. [Google Scholar] [CrossRef]
- Woudenberg-Vrenken, T.E.; Bindels, R.J.M.; Hoenderop, J.G.J. The role of transient receptor potential channels in kidney disease. Nat. Rev. Nephrol. 2009, 5, 441. [Google Scholar] [CrossRef]
- Goel, M.; Sinkins, W.G.; Zuo, C.-D.; Estacion, M.; Schilling, W.P. Identification and localization of TRPC channels in the rat kidney. Am. J. Physiol. Physiol. 2006, 290, F1241–F1252. [Google Scholar] [CrossRef]
- Greka, A.; Mundel, P. Balancing calcium signals through TRPC5 and TRPC6 in podocytes. J. Am. Soc. Nephrol. 2011, 22, 1969–1980. [Google Scholar] [CrossRef]
- Kim, E.Y.; Anderson, M.; Dryer, S.E. Insulin increases surface expression of TRPC6 channels in podocytes: Role of NADPH oxidases and reactive oxygen species. Am. J. Physiol. Physiol. 2011, 302, F298–F307. [Google Scholar] [CrossRef] [PubMed]
- Roshanravan, H.; Dryer, S.E. ATP acting through P2Y receptors causes activation of podocyte TRPC6 channels: Role of podocin and reactive oxygen species. Am. J. Physiol. Physiol. 2014, 306, F1088–F1097. [Google Scholar] [CrossRef] [PubMed]
- Zhao, B.; Yang, H.; Zhang, R.; Sun, H.; Liao, C.; Xu, J.; Meng, K.; Jiao, J. The role of TRPC6 in oxidative stress-induced podocyte ischemic injury. Biochem. Biophys. Res. Commun. 2015, 461, 413–420. [Google Scholar] [CrossRef] [PubMed]
- Thomas, M.C. The potential and pitfalls of GLP-1 receptor agonists for renal protection in type 2 diabetes. Diabetes Metab. 2017, 43, 2S20–2S27. [Google Scholar] [CrossRef]
- Petrie, J.R.; Rossing, P.R.; Campbell, I.W. Metformin and cardiorenal outcomes in diabetes: A reappraisal. Diabetes Obes. Metab. 2020, 22, 904–915. [Google Scholar] [CrossRef] [PubMed]
- Petrie, J.R.; Chaturvedi, N.; Ford, I.; Brouwers, M.C.G.J.; Greenlaw, N.; Tillin, T.; Hramiak, I.; Hughes, A.D.; Jenkins, A.J.; Klein, B.E.K. Cardiovascular and metabolic effects of metformin in patients with type 1 diabetes (REMOVAL): A double-blind, randomised, placebo-controlled trial. Lancet Diabetes Endocrinol. 2017, 5, 597–609. [Google Scholar] [CrossRef]
- Geagea, A.G.; Rizzo, M.; Jurjus, A.; Cappello, F.; Leone, A.; Tomasello, G.; Gracia, C.; Al Kattar, S.; Massaad-Massade, L.; Eid, A. A novel therapeutic approach to colorectal cancer in diabetes: Role of metformin and rapamycin. Oncotarget 2019, 10, 1284. [Google Scholar] [CrossRef]
- Chen, Y.; Qiu, F.; Yu, B.; Chen, Y.; Zuo, F.; Zhu, X.; Nandakumar, K.S.; Xiao, C. Metformin, an AMPK Activator, Inhibits Activation of FLSs but Promotes HAPLN1 Secretion. Mol. Ther. Clin. Dev. 2020, 17, 1202–1214. [Google Scholar] [CrossRef]
- Bailey, C.J. Metformin-An update. Gen. Pharmacol. 1993, 24, 1299–1309. [Google Scholar] [CrossRef]
- Graham, G.G.; Punt, J.; Arora, M.; Day, R.O.; Doogue, M.P.; Duong, J.; Furlong, T.J.; Greenfield, J.R.; Greenup, L.C.; Kirkpatrick, C.M. Clinical pharmacokinetics of metformin. Clin. Pharmacokinet. 2011, 50, 81–98. [Google Scholar] [CrossRef]
- Jacobsen, L.V.; Flint, A.; Olsen, A.K.; Ingwersen, S.H. Liraglutide in type 2 diabetes mellitus: Clinical pharmacokinetics and pharmacodynamics. Clin. Pharmacokinet. 2016, 55, 657–672. [Google Scholar] [CrossRef]
- Mroueh, F.M.; Noureldein, M.; Zeidan, Y.H.; Boutary, S.; Irani, S.A.M.; Eid, S.; Haddad, M.; Barakat, R.; Harb, F.; Costantine, J. Unmasking the interplay between mTOR and Nox4: Novel insights into the mechanism connecting diabetes and cancer. FASEB J. 2019, 33, 14051–14066. [Google Scholar] [CrossRef]
- Zhou, S.J.; Bai, L.; Lv, L.; Chen, R.; Li, C.J.; Liu, X.Y.; Yu, D.M.; Yu, P. Liraglutide ameliorates renal injury in streptozotocin-induced diabetic rats by activating endothelial nitric oxide synthase activity via the downregulation of the nuclear factor-κB pathway. Mol. Med. Rep. 2014, 10, 2587–2594. [Google Scholar] [CrossRef]
- Palanza, K.M.; Nesta, A.V.; Tumu, R.; Walton, C.M.; Davis, M.A.; King, T.R. Auxotrophy-based detection of hyperornithinemia in mouse blood and urine. J. Inborn Errors Metab. Screen. 2019, 4. [Google Scholar] [CrossRef]
- Eid, S.; Maalouf, R.; Jaffa, A.A.; Nassif, J.; Hamdy, A.; Rashid, A.; Ziyadeh, F.N.; Eid, A.A. 20-HETE and EETs in diabetic nephropathy: A novel mechanistic pathway. PLoS ONE 2013, 8, e70029. [Google Scholar] [CrossRef] [PubMed]
- Abràmoff, M.D.; Magalhães, P.J.; Ram, S.J. Image processing with ImageJ. Biophotonics Int. 2004, 11, 36–42. [Google Scholar]
- Eid, A.A.; Ford, B.M.; Block, K.; Kasinath, B.S.; Gorin, Y.; Ghosh-Choudhury, G.; Barnes, J.L.; Abboud, H.E. AMP-activated protein kinase (AMPK) negatively regulates Nox4-dependent activation of p53 and epithelial cell apoptosis in diabetes. J. Biol. Chem. 2010, 285, 37503–37512. [Google Scholar] [CrossRef] [PubMed]
- Peterson, G.L. A simplification of the protein assay method of Lowry et al. which is more generally applicable. Anal. Biochem. 1977, 83, 346–356. [Google Scholar] [CrossRef]
- Schneider, C.A.; Rasband, W.S.; Eliceiri, K.W. NIH Image to ImageJ: 25 years of image analysis. Nat. Methods 2012, 9, 671. [Google Scholar] [CrossRef] [PubMed]
- Eid, S.; Boutary, S.; Braych, K.; Sabra, R.; Massaad, C.; Hamdy, A.; Rashid, A.; Moodad, S.; Block, K.; Gorin, Y. mTORC2 signaling regulates Nox4-induced podocyte depletion in diabetes. Antioxid. Redox Signal. 2016, 25, 703–719. [Google Scholar] [CrossRef]
- Franz, M.; Rodriguez, H.; Lopes, C.; Zuberi, K.; Montojo, J.; Bader, G.D.; Morris, Q. GeneMANIA update 2018. Nucleic Acids Res. 2018, 46, W60–W64. [Google Scholar] [CrossRef] [PubMed]
- Mann, J.F.E.; Ørsted, D.D.; Brown-Frandsen, K.; Marso, S.P.; Poulter, N.R.; Rasmussen, S.; Tornøe, K.; Zinman, B.; Buse, J.B. Liraglutide and Renal Outcomes in Type 2 Diabetes. N. Engl. J. Med. 2017, 2, 839–848. [Google Scholar] [CrossRef] [PubMed]
- Cooper, M.E.; Mundel, P.; Boner, G. Role of nephrin in renal disease including diabetic nephropathy. Semin. Nephrol. 2002, 22, 393–398. [Google Scholar] [CrossRef] [PubMed]
- Ravindran, S.; Kuruvilla, V.; Wilbur, K.; Munusamy, S. Nephroprotective Effects of Metformin in Diabetic Nephropathy. J. Cell. Physiol. 2017, 232, 731–742. [Google Scholar] [CrossRef]
- Ahmed, F.W.; Rider, R.; Glanville, M.; Narayanan, K.; Razvi, S.; Weaver, J.U. Metformin improves circulating endothelial cells and endothelial progenitor cells in type 1 diabetes: MERIT study. Cardiovasc. Diabetol. 2016, 15, 116. [Google Scholar] [CrossRef]
- Vanderheiden, A.; Harrison, L.B.; Warshauer, J.T.; Adams-Huet, B.; Li, X.; Yuan, Q.; Hulsey, K.; Dimitrov, I.; Yokoo, T.; Jaster, A.W. Mechanisms of action of liraglutide in patients with type 2 diabetes treated with high-dose insulin. J. Clin. Endocrinol. Metab. 2016, 101, 1798–1806. [Google Scholar] [CrossRef] [PubMed]
- Christensen, M.; Schiffer, T.A.; Gustafsson, H.; Krag, S.P.; Nørregaard, R.; Palm, F. Metformin attenuates renal medullary hypoxia in diabetic nephropathy through inhibition uncoupling protein-2. Diabetes. Metab. Res. Rev. 2019, 35, e3091. [Google Scholar] [CrossRef]
- Apostolova, N.; Iannantuoni, F.; Gruevska, A.; Muntane, J.; Rocha, M.; Victor, V.M. Mechanisms of action of metformin in type 2 diabetes: Effects on mitochondria and leukocyte-endothelium interactions. Redox Biol. 2020, 34, 101517. [Google Scholar] [CrossRef]
- Bailey, C.J.; Turner, R.C. Metformin. N. Engl. J. Med. 1996, 334, 574–579. [Google Scholar] [CrossRef]
- Eid, A.A.; Gorin, Y.; Fagg, B.M.; Maalouf, R.; Barnes, J.L.; Block, K.; Abboud, H.E. Mechanisms of podocyte injury in diabetes role of cytochrome P450 and NADPH oxidases. Diabetes 2009, 58, 1201–1211. [Google Scholar] [CrossRef]
- Muñoz, M.; López-Oliva, M.E.; Rodríguez, C.; Martínez, M.P.; Sáenz-Medina, J.; Sánchez, A.; Climent, B.; Benedito, S.; García-Sacristán, A.; Rivera, L. Differential contribution of Nox1, Nox2 and Nox4 to kidney vascular oxidative stress and endothelial dysfunction in obesity. Redox Biol. 2020, 28, 101330. [Google Scholar] [CrossRef] [PubMed]
- Lacroix, L.; Nocera, M.; Mian, C.; Caillou, B.; Virion, A.; Dupuy, C.; Filetti, S.; Bidart, J.-M.; Schlumberger, M. Expression of nicotinamide adenine dinucleotide phosphate oxidase flavoprotein DUOX genes and proteins in human papillary and follicular thyroid carcinomas. Thyroid 2001, 11, 1017–1023. [Google Scholar] [CrossRef] [PubMed]
- Ekkelund Petersen, K.; Rakipovski, G.; Raun, K.; Lykkesfeldt, J. Does Glucagon-like Peptide-1 Ameliorate Oxidative Stress in Diabetes? Evidence Based on Experimental and Clinical Studies. Curr. Diabetes Rev. 2016, 12, 331–358. [Google Scholar] [CrossRef] [PubMed]
- Eid, A.A.; Ford, B.M.; Bhandary, B.; Cavagliery, R.; Block, K.; Barnes, J.L.; Gorin, Y.; Choudhury, G.G.; Abboud, H.E. mTOR regulates Nox4-mediated podocyte depletion in diabetic renal injury. Diabetes 2013, 62, 2935–2947. [Google Scholar] [CrossRef]
- Ilatovskaya, D.V.; Blass, G.; Palygin, O.; Levchenko, V.; Pavlov, T.S.; Grzybowski, M.N.; Winsor, K.; Shuyskiy, L.S.; Geurts, A.M.; Cowley, A.W. A NOX4/TRPC6 pathway in podocyte calcium regulation and renal damage in diabetic kidney disease. J. Am. Soc. Nephrol. 2018, 29, 1917–1927. [Google Scholar] [CrossRef]
- Anderson, M.; Roshanravan, H.; Khine, J.; Dryer, S.E. Angiotensin II Activation of TRPC6 Channels in rat podocytes requires generation of reactive oxygen species. J. Cell. Physiol. 2014, 229, 434–442. [Google Scholar] [CrossRef]
- Togashi, K.; Hara, Y.; Tominaga, T.; Higashi, T.; Konishi, Y.; Mori, Y.; Tominaga, M. TRPM2 activation by cyclic ADP-ribose at body temperature is involved in insulin secretion. EMBO J. 2006, 25, 1804–1815. [Google Scholar] [CrossRef]


Publisher’s Note: MDPI stays neutral with regard to jurisdictional claims in published maps and institutional affiliations. |
© 2021 by the authors. Licensee MDPI, Basel, Switzerland. This article is an open access article distributed under the terms and conditions of the Creative Commons Attribution (CC BY) license (https://creativecommons.org/licenses/by/4.0/).
Share and Cite
Youssef, N.; Noureldein, M.; Njeim, R.; Ghadieh, H.E.; Harb, F.; Azar, S.T.; Fares, N.; Eid, A.A. Reno-Protective Effect of GLP-1 Receptor Agonists in Type1 Diabetes: Dual Action on TRPC6 and NADPH Oxidases. Biomedicines 2021, 9, 1360. https://0-doi-org.brum.beds.ac.uk/10.3390/biomedicines9101360
Youssef N, Noureldein M, Njeim R, Ghadieh HE, Harb F, Azar ST, Fares N, Eid AA. Reno-Protective Effect of GLP-1 Receptor Agonists in Type1 Diabetes: Dual Action on TRPC6 and NADPH Oxidases. Biomedicines. 2021; 9(10):1360. https://0-doi-org.brum.beds.ac.uk/10.3390/biomedicines9101360
Chicago/Turabian StyleYoussef, Natalie, Mohamed Noureldein, Rachel Njeim, Hilda E. Ghadieh, Frederic Harb, Sami T. Azar, Nassim Fares, and Assaad A. Eid. 2021. "Reno-Protective Effect of GLP-1 Receptor Agonists in Type1 Diabetes: Dual Action on TRPC6 and NADPH Oxidases" Biomedicines 9, no. 10: 1360. https://0-doi-org.brum.beds.ac.uk/10.3390/biomedicines9101360