
Mechanistic Insights into Alzheimer’s Disease Unveiled through the Investigation of Disturbances in Central Metabolites and Metabolic Pathways

 , , , , and
Abstract
:1. Alzheimer’s Disease and Metabolomics: The Challenge of Hydrophilic Metabolites
2. Alzheimer’s Disease and DMS-Based Metabolomics
3. Alzheimer’s Disease and GC-MS Based Metabolomics
4. Alzheimer’s Disease and HILIC-MS-Based Metabolomics
5. Alzheimer’s Disease and CE-MS Based Metabolomics
6. Alzheimer’s Disease and Other RPLC-MS Based Platforms to Explore Central Metabolites
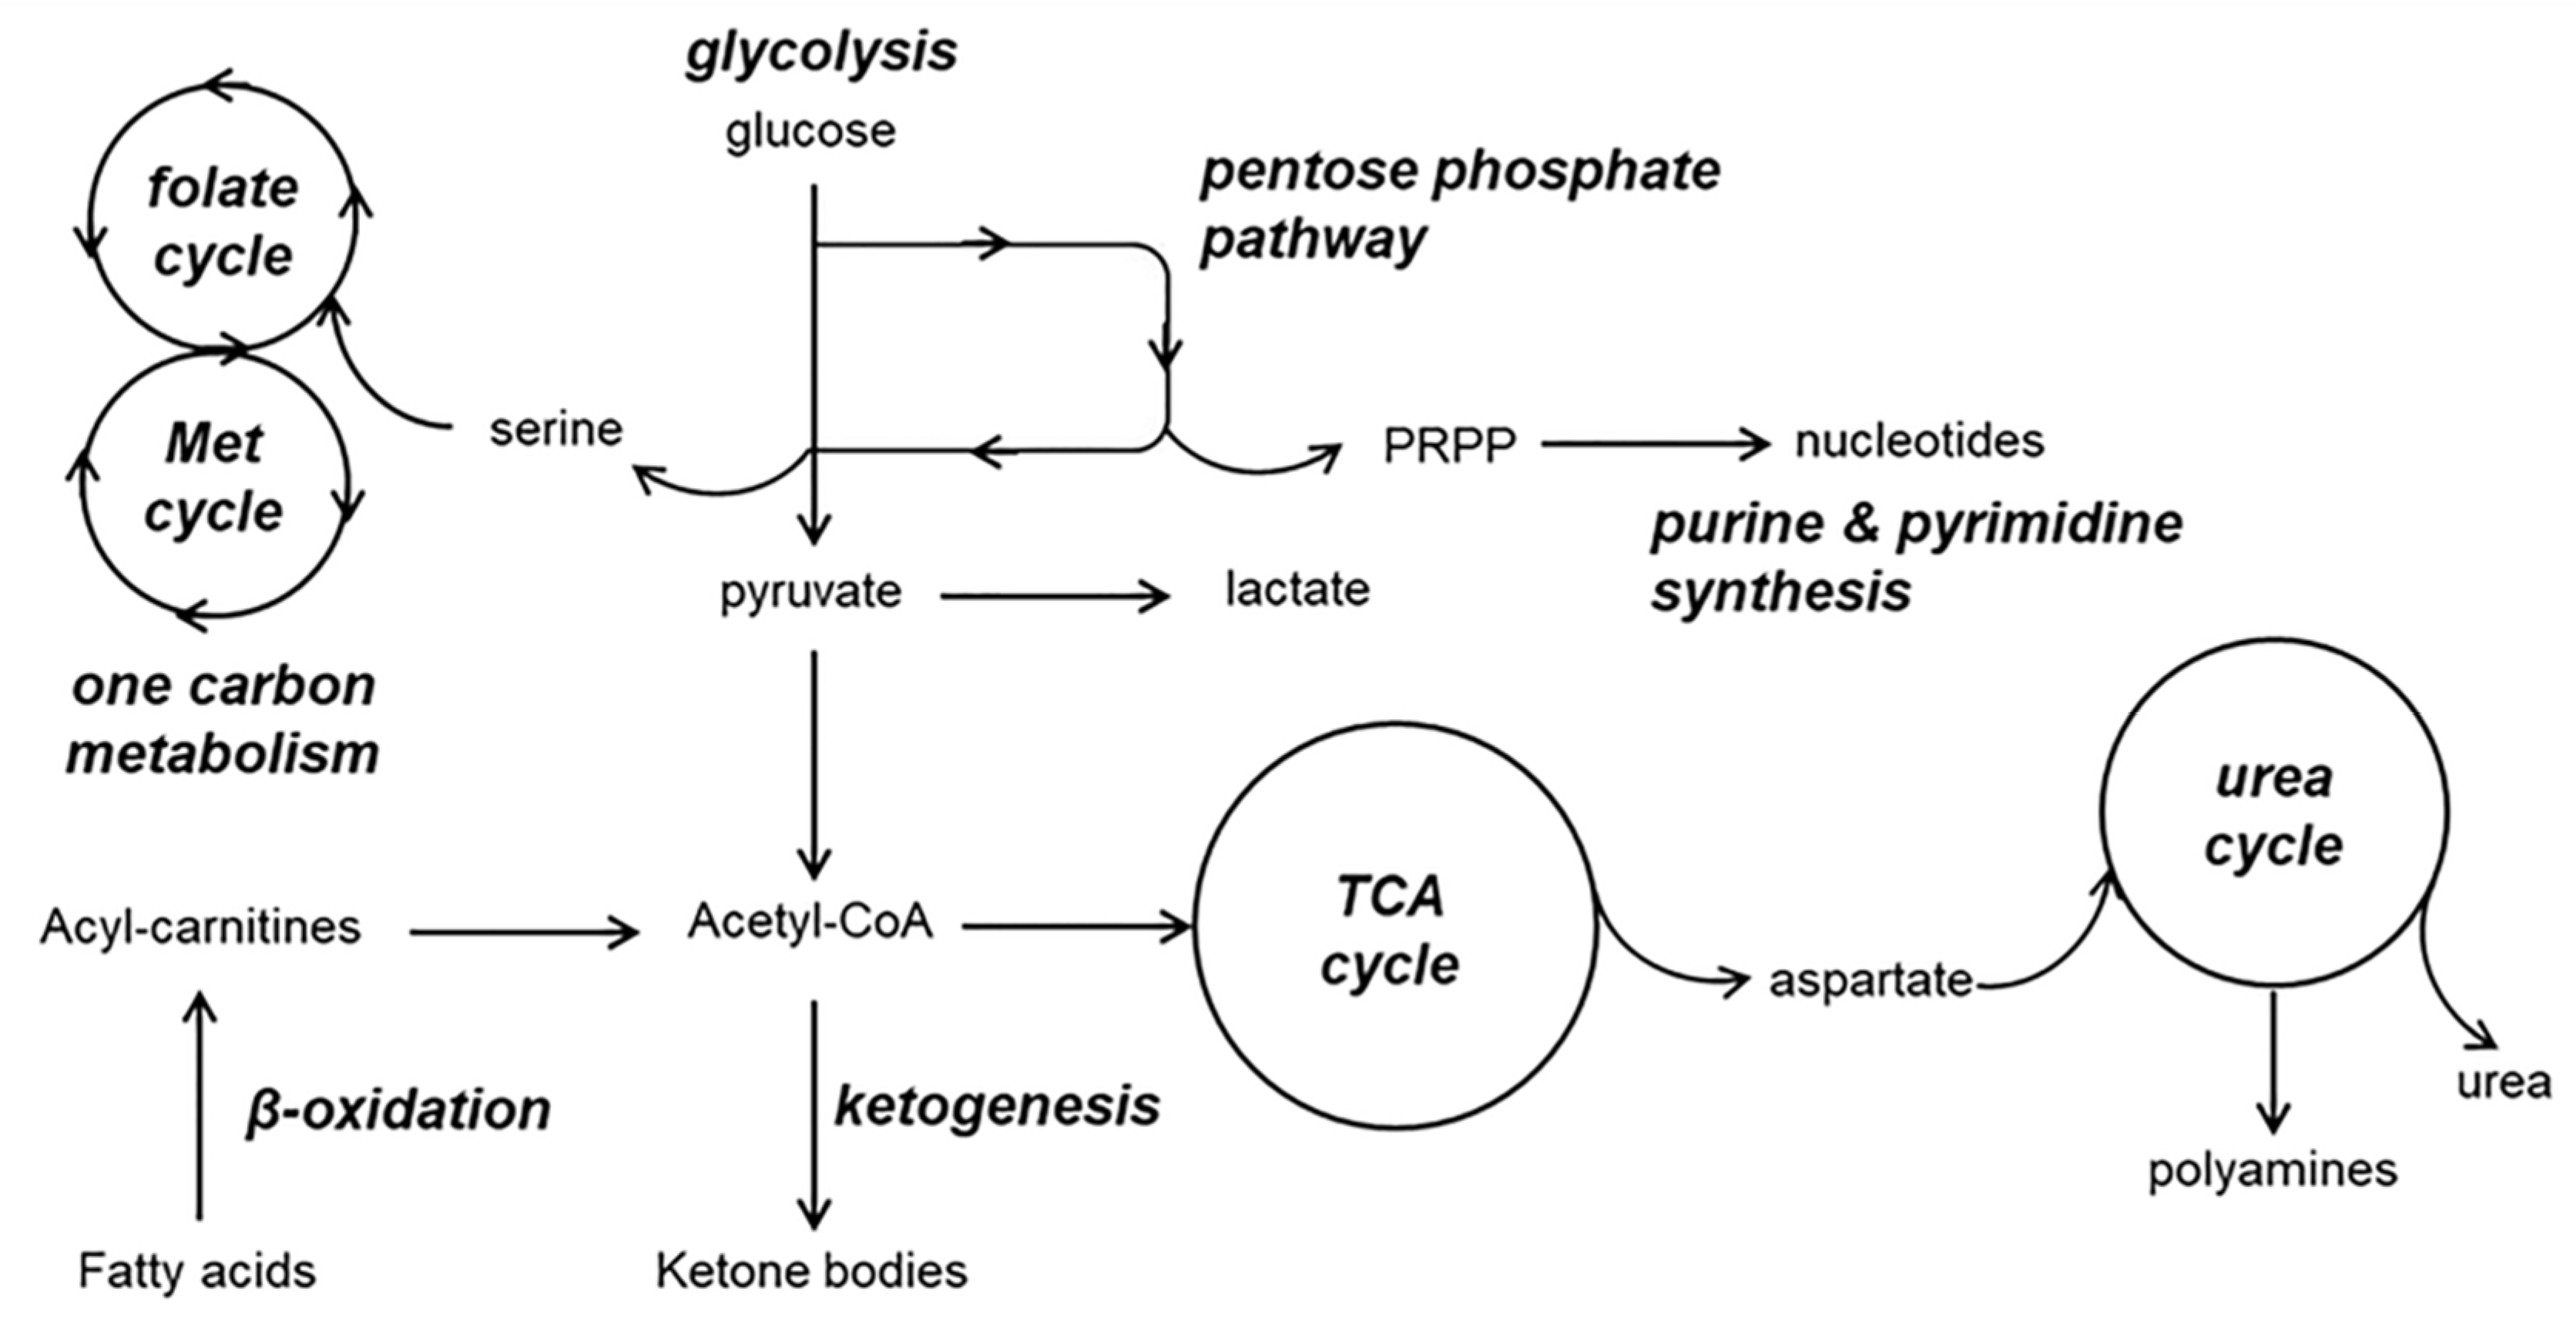
7. Overview on the Involvement of Central Metabolic Pathways in Alzheimer’s Disease
8. Conclusions
Author Contributions
Funding
Institutional Review Board Statement
Informed Consent Statement
Conflicts of Interest
References
- Blennow, K.; de Leon, M.J.; Zetterberg, H. Alzheimer’s disease. Lancet 2006, 368, 387–403. [Google Scholar] [CrossRef]
- Maccioni, R.B.; Muñoz, J.P.; Barbeito, L. The molecular bases of Alzheimer’s disease and other neurodegenerative disorders. Arch. Med. Res. 2001, 32, 367–381. [Google Scholar] [CrossRef]
- González-Domínguez, R.; García-Barrera, T.; Gómez-Ariza, J.L. Characterization of metal profiles in serum during the progression of Alzheimer’s disease. Metallomics 2014, 6, 292–300. [Google Scholar] [CrossRef] [PubMed]
- González-Domínguez, R.; Sayago, A.; Fernández-Recamales, Á. Metabolomics in Alzheimer’s disease: The need of complementary analytical platforms for the identification of biomarkers to unravel the underlying pathology. J. Chromatogr. B 2017, 1071, 75–92. [Google Scholar] [CrossRef]
- Wilkins, J.M.; Trushina, E. Application of metabolomics in Alzheimer’s disease. Front. Neurol. 2017, 8, 719. [Google Scholar] [CrossRef] [PubMed] [Green Version]
- Emwas, A.H.M.; Salek, R.M.; Griffin, J.L.; Merzaban, J. NMR-based metabolomics in human disease diagnosis: Applications, limitations, and recommendations. Metabolomics 2013, 9, 1048–1072. [Google Scholar] [CrossRef]
- González-Domínguez, R.; Jáuregui, O.; Queipo-Ortuño, M.I.; Andrés-Lacueva, C. Characterization of the human exposome by a comprehensive and quantitative large-scale multianalyte metabolomics platform. Anal. Chem. 2020, 92, 13767–13775. [Google Scholar] [CrossRef]
- Wei, F.; Lamichhane, S.; Orešič, M.; Hyötyläinen, T. Lipidomes in health and disease: Analytical strategies and considerations. Trends Anal. Chem. 2019, 120, 115664. [Google Scholar] [CrossRef]
- Zeng, Y.; Luo, L.; Hou, W.; Lu, B.; Gong, J.; Chen, J.; Zhang, X.; Han, B.; Xie, Z.; Liao, Q. Targeted metabolomics analysis of aromatic amino acids and their gut microbiota-host cometabolites in rat serum and urine by liquid chromatography coupled with tandem mass spectrometry. J. Sep. Sci. 2017, 40, 3221–3230. [Google Scholar] [CrossRef]
- González-Domínguez, R.; Urpi-Sarda, M.; Jáuregui, O.; Needs, P.W.; Kroon, P.A.; Andrés-Lacueva, C. Quantitative Dietary Fingerprinting (QDF)-A novel tool for comprehensive dietary assessment based on urinary nutrimetabolomics. J. Agric. Food Chem. 2020, 68, 1851–1861. [Google Scholar] [CrossRef]
- González-Domínguez, R.; Jáuregui, O.; Mena, P.; Hanhineva, K.; Tinahones, F.J.; Angelino, D.; Andrés-Lacueva, C. Quantifying the human diet in the crosstalk between nutrition and health by multi-targeted metabolomics of food and microbiota-derived metabolites. Int. J. Obes. 2020, 44, 2372–2381. [Google Scholar] [CrossRef]
- González-Domínguez, R.; Sayago, A.; Fernández-Recamales, Á. Direct infusion mass spectrometry for metabolomic phenotyping of diseases. Bioanalysis 2017, 9, 131–148. [Google Scholar] [CrossRef]
- Beale, D.J.; Pinu, F.R.; Kouremenos, K.A.; Poojary, M.M.; Narayana, V.K.; Boughton, B.A.; Kanojia, K.; Dayalan, S.; Jones, O.A.H.; Dias, D.A. Review of recent developments in GC-MS approaches to metabolomics-based research. Metabolomics 2018, 14, 152. [Google Scholar] [CrossRef] [PubMed]
- Tang, D.Q.; Zou, L.; Yin, X.X.; Ong, C.N. HILIC-MS for metabolomics: An attractive and complementary approach to RPLC-MS. Mass Spectrom. Rev. 2016, 35, 574–600. [Google Scholar] [CrossRef]
- Barbas, C.; Moraes, E.P.; Villaseñor, A. Capillary electrophoresis as a metabolomics tool for non-targeted fingerprinting of biological samples. J. Pharm. Biomed. Anal. 2011, 55, 823–831. [Google Scholar] [CrossRef]
- Chen, K.; Baluya, D.; Tosun, M.; Li, F.; Maletic-Savatic, M. Imaging Mass Spectrometry: A New Tool to Assess Molecular Underpinnings of Neurodegeneration. Metabolites 2019, 9, 135. [Google Scholar] [CrossRef] [PubMed] [Green Version]
- Gonzalez-Dominguez, A.; Duran-Guerrero, E.; Fernandez-Recamales, A.; Lechuga-Sancho, A.M.; Sayago, A.; Schwarz, M.; Segundo, C.; Gonzalez-Dominguez, R. An overview on the importance of combining complementary analytical platforms in metabolomic research. Curr. Top. Med. Chem. 2017, 17, 3289–3295. [Google Scholar] [CrossRef]
- González-Domínguez, R.; García-Barrera, T.; Gómez-Ariza, J.L. Using direct infusion mass spectrometry for serum metabolomics in Alzheimer’s disease. Anal. Bioanal. Chem. 2014, 406, 7137–7148. [Google Scholar] [CrossRef] [PubMed]
- González-Domínguez, R.; García-Barrera, T.; Gómez-Ariza, J.L. Metabolomic approach to Alzheimer’s disease diagnosis based on mass spectrometry. Chem. Pap. 2012, 66, 829–835. [Google Scholar] [CrossRef]
- González-Domínguez, R.; García-Barrera, T.; Gómez-Ariza, J.L. Metabolomic study of lipids in serum for biomarker discovery in Alzheimer’s disease using direct infusion mass spectrometry. J. Pharm. Biomed. Anal. 2014, 98, 321–326. [Google Scholar] [CrossRef] [PubMed]
- González-Domínguez, R.; García-Barrera, T.; Gómez-Ariza, J.L. Combination of metabolomic and phospholipid-profiling approaches for the study of Alzheimer’s disease. J. Proteom. 2014, 104, 37–47. [Google Scholar] [CrossRef]
- González-Domínguez, R.; García-Barrera, T.; Gómez-Ariza, J.L. Application of a novel metabolomic approach based on atmospheric pressure photoionization mass spectrometry using flow injection analysis for the study of Alzheimer’s disease. Talanta 2015, 131, 480–489. [Google Scholar] [CrossRef] [Green Version]
- González-Domínguez, R.; García-Barrera, T.; Vitorica, J.; Gómez-Ariza, J.L. Application of metabolomics based on direct mass spectrometry analysis for the elucidation of altered metabolic pathways in serum from the APP/PS1 transgenic model of Alzheimer’s disease. J. Pharm. Biomed. Anal. 2015, 107, 378–385. [Google Scholar] [CrossRef] [PubMed]
- González-Domínguez, R.; Castilla-Quintero, R.; García-Barrera, T.; Gómez-Ariza, J.L. Development of a metabolomic approach based on urine samples and direct infusion mass spectrometry. Anal. Biochem. 2014, 465, 20–27. [Google Scholar] [CrossRef] [PubMed]
- González-Domínguez, R.; García-Barrera, T.; Vitorica, J.; Gómez-Ariza, J.L. Metabolomic screening of regional brain alterations in the APP/PS1 transgenic model of Alzheimer’s disease by direct infusion mass spectrometry. J. Pharm. Biomed. Anal. 2015, 102, 425–435. [Google Scholar] [CrossRef]
- González-Domínguez, R.; García-Barrera, T.; Vitorica, J.; Gómez-Ariza, J.L. High throughput multiorgan metabolomics in the APP/PS1 mouse model of Alzheimer’s disease. Electrophoresis 2015, 36, 2237–2249. [Google Scholar] [CrossRef] [PubMed]
- González-Domínguez, R.; García-Barrera, T.; Vitorica, J.; Gómez-Ariza, J.L. Metabolomic research on the role of interleukin-4 in Alzheimer’s disease. Metabolomics 2015, 11, 1175–1183. [Google Scholar] [CrossRef]
- Lin, S.; Liu, H.; Kanawati, B.; Liu, L.; Dong, J.; Li, M.; Huang, J.; Schmitt-Kopplin, P.; Cai, Z. Hippocampal metabolomics using ultrahigh-resolution mass spectrometry reveals neuroinflammation from Alzheimer’s disease in CRND8 mice. Anal. Bioanal. Chem. 2013, 405, 5105–5117. [Google Scholar] [CrossRef] [PubMed]
- Lin, S.; Kanawati, B.; Liu, L.; Witting, M.; Li, M.; Huang, J.; Schmitt-Kopplin, P.; Cai, Z. Ultrahigh resolution mass spectrometry-based metabolic characterization reveals cerebellum as a disturbed region in two animal models. Talanta 2014, 118, 45–53. [Google Scholar] [CrossRef]
- Xu, J.; Begley, P.; Church, S.J.; Patassini, S.; Hollywood, K.A.; Jüllig, M.; Curtis, M.A.; Waldvogel, H.J.; Faull, R.L.; Unwin, R.D.; et al. Graded perturbations of metabolism in multiple regions of human brain in Alzheimer’s disease: Snapshot of a pervasive metabolic disorder. Biochim. Biophys. Acta 2016, 1862, 1084–1092. [Google Scholar] [CrossRef] [PubMed]
- Wang, H.; Lian, K.; Han, B.; Wang, Y.; Kuo, S.H.; Geng, Y.; Qiang, J.; Sun, M.; Wang, M. Age-related alterations in the metabolic profile in the hippocampus of the senescence-accelerated mouse prone 8: A spontaneous Alzheimer’s disease mouse model. J. Alzheimers Dis. 2014, 39, 841–848. [Google Scholar] [CrossRef] [Green Version]
- Han, B.; Wang, J.H.; Geng, Y.; Shen, L.; Wang, H.L.; Wang, Y.Y.; Wang, M.W. Chronic stress contributes to cognitive dysfunction and hippocampal metabolic abnormalities in APP/PS1 mice. Cell Physiol. Biochem. 2017, 41, 1766–1776. [Google Scholar] [CrossRef] [PubMed]
- Hu, Z.P.; Browne, E.R.; Liu, T.; Angel, T.E.; Ho, P.C.; Chan, E.C.Y. Metabonomic profiling of TASTPM transgenic Alzheimer’s disease mouse model. J. Proteome Res. 2012, 11, 5903–5913. [Google Scholar] [CrossRef]
- González-Domínguez, R.; García-Barrera, T.; Gómez-Ariza, J.L. Metabolite profiling for the identification of altered metabolic pathways in Alzheimer’s disease. J. Pharm. Biomed. Anal. 2015, 107, 75–81. [Google Scholar] [CrossRef]
- Ko, P.W.; Kang, K.; Yu, J.B.; Huh, J.S.; Lee, H.W.; Lim, J.O. Breath gas analysis for a potential diagnostic method of neurodegenerative diseases. Sens. Lett. 2014, 12, 1198–1202. [Google Scholar] [CrossRef]
- Kimball, B.A.; Wilson, D.A.; Wesson, D.W. Alterations of the volatile metabolome in mouse models of Alzheimer’s disease. Sci. Rep. 2016, 6, 19495. [Google Scholar] [CrossRef] [PubMed]
- Orešič, M.; Hyötyläinen, T.; Herukka, S.K.; Sysi-Aho, M.; Mattila, I.; Seppänan-Laakso, T.; Julkunen, V.; Gopalacharyulu, P.V.; Hallikainen, M.; Koikkalainen, J.; et al. Metabolome in progression to Alzheimer’s disease. Transl. Psychiatry 2011, 1, e57. [Google Scholar] [CrossRef]
- Wang, G.; Zhou, Y.; Huang, F.J.; Tang, H.D.; Xu, X.H.; Liu, J.J.; Wang, Y.; Deng, Y.L.; Ren, R.J.; Xu, W.; et al. Plasma metabolite profiles of Alzheimer’s disease and mild cognitive impairment. J. Proteome Res. 2014, 13, 2649–2658. [Google Scholar] [CrossRef]
- Gross, T.J.; Doran, E.; Cheema, A.K.; Head, E.; Lott, I.T.; Mapstone, M. Plasma metabolites related to cellular energy metabolism are altered in adults with Down syndrome and Alzheimer’s disease. Dev. Neurobiol. 2019, 79, 622–638. [Google Scholar] [CrossRef] [PubMed]
- Trushina, E.; Nemutlu, E.; Zhang, S.; Christensen, T.; Camp, J.; Mesa, J.; Siddiqui, A.; Tamura, Y.; Sesaki, H.; Wengenack, T.M.; et al. Defects in mitochondrial dynamics and metabolomic signatures of evolving energetic stress in mouse models of familial Alzheimer’s disease. PLoS ONE 2012, 7, e32737. [Google Scholar] [CrossRef] [Green Version]
- Czech, C.; Berndt, P.; Busch, K.; Schmitz, O.; Wiemer, J.; Most, V.; Hampel, H.; Kastler, J.; Senn, H. Metabolite profiling of Alzheimer’s disease cerebrospinal fluid. PLoS ONE 2012, 7, e31501. [Google Scholar] [CrossRef]
- Motsinger-Reif, A.A.; Zhu, H.; Kling, M.A.; Matson, W.; Sharma, S.; Fiehn, O.; Reif, D.M.; Appleby, D.H.; Doraiswamy, P.M.; Trojanowski, J.Q.; et al. Comparing metabolomic and pathologic biomarkers alone and in combination for discriminating Alzheimer’s disease from normal cognitive aging. Acta Neuropathol. Commun. 2013, 1, 28. [Google Scholar] [CrossRef] [Green Version]
- González-Domínguez, R.; García-Barrera, T.; Vitorica, J.; Gómez-Ariza, J.L. Deciphering metabolic abnormalities associated with Alzheimer’s disease in the APP/PS1 mouse model using integrated metabolomic approaches. Biochimie 2015, 110, 119–128. [Google Scholar] [CrossRef] [PubMed] [Green Version]
- González-Domínguez, R.; García-Barrera, T.; Vitorica, J.; Gómez-Ariza, J.L. Region-specific metabolic alterations in the brain of the APP/PS1 transgenic mice of Alzheimer’s disease. Biochim. Biophys. Acta 2014, 1842, 2395–2402. [Google Scholar] [CrossRef] [Green Version]
- González-Domínguez, R.; García-Barrera, T.; Vitorica, J.; Gómez-Ariza, J.L. Metabolomic investigation of systemic manifestations associated with Alzheimer’s disease in the APP/PS1 transgenic mouse model. Mol. BioSyst. 2015, 11, 2429–2440. [Google Scholar] [CrossRef] [Green Version]
- González-Domínguez, R.; García-Barrera, T.; Vitorica, J.; Gómez-Ariza, J.L. Metabolomics reveals significant impairments in the immune system of the APP/PS1 transgenic mice of Alzheimer’s disease. Electrophoresis 2015, 36, 577–587. [Google Scholar] [CrossRef] [PubMed]
- Graham, S.F.; Chevallier, O.P.; Roberts, D.; Holscher, C.; Elliot, C.T.; Green, B.D. Investigation of the human brain metabolome to identify potential markers for early diagnosis and therapeutic targets of Alzheimer’s disease. Anal. Chem. 2013, 85, 1803–1811. [Google Scholar] [CrossRef]
- Inoue, K.; Tsuchiya, H.; Takayama, T.; Akatsu, H.; Hashizume, Y.; Yamamoto, T.; Matsukawa, N.; Toyo’oka, T. Blood-based diagnosis of Alzheimer’s disease using fingerprinting metabolomics based on hydrophilic interaction liquid chromatography with mass spectrometry and multivariate statistical analysis. J. Chromatogr. B 2015, 974, 24–34. [Google Scholar] [CrossRef] [PubMed]
- Graham, S.F.; Chevallier, O.P.; Elliot, C.T.; Hölscher, C.; Johnston, J.; McGuinness, B.; Kehoe, P.G.; Passmore, A.P.; Green, B.D. Untargeted metabolomic analysis of human plasma indicates differentially affected polyamine and L-arginine metabolism in mild cognitive impairment subjects converting to Alzheimer’s disease. PLoS ONE 2015, 10, e0119452. [Google Scholar] [CrossRef] [PubMed]
- Tang, Z.; Liu, L.; Li, Y.; Dong, J.; Li, M.; Huang, J.; Lin, S.; Cai, Z. Urinary metabolomics reveals alterations of aromatic amino acid metabolism of Alzheimer’s disease in the transgenic CRND8 mice. Curr. Alzheimer Res. 2016, 13, 764–776. [Google Scholar] [CrossRef]
- Trushina, E.; Dutta, T.; Persson, X.M.; Mielke, M.M.; Petersen, R.C. Identification of altered metabolic pathways in plasma and CSF in mild cognitive impairment and Alzheimer’s disease using metabolomics. PLoS ONE 2013, 8, e63644. [Google Scholar] [CrossRef] [PubMed] [Green Version]
- Ibañez, C.; Simo, C.; Barupal, D.K.; Fiehn, O.; Kivipelto, M.; Cedazo-Mínguez, A.; Cifuentes, A. A new metabolomic workflow for early detection of Alzheimer’s disease. J. Chromatogr. A 2013, 1302, 65–71. [Google Scholar] [CrossRef]
- Kim, Y.H.; Shim, H.S.; Kim, K.H.; Lee, J.; Chung, B.C.; Kowall, N.W.; Ryu, H.; Lee, J. Metabolomic analysis identifies alterations of amino acid metabolome signatures in the postmortem brain of Alzheimer’s disease. Exp. Neurobiol. 2019, 28, 376–389. [Google Scholar] [CrossRef] [PubMed]
- Paglia, G.; Stocchero, M.; Cacciatore, S.; Lai, S.; Angel, P.; Alam, M.T.; Keller, M.; Ralser, M.; Astarita, G. Unbiased metabolomic investigation of Alzheimer’s disease brain points to dysregulation of mitochondrial aspartate metabolism. J. Proteome Res. 2016, 15, 608–618. [Google Scholar] [CrossRef] [Green Version]
- Armirotti, A.; Basit, A.; Realini, N.; Caltagirone, C.; Bossù, P.; Spalletta, G.; Piomelli, D. Sample preparation and orthogonal chromatography for broad polarity range plasma metabolomics: Application to human subjects with neurodegenerative dementia. Anal. Biochem. 2014, 455, 48–54. [Google Scholar] [CrossRef] [PubMed]
- Ibáñez, C.; Simó, C.; Martín-Álvarez, P.J.; Kivipelto, M.; Winblad, B.; Cedazo-Mínguez, A.; Cifuentes, A. Toward a predictive model of Alzheimer’s disease progression using capillary electrophoresis–mass spectrometry metabolomics. Anal. Chem. 2012, 84, 8532–8540. [Google Scholar] [CrossRef]
- González-Domínguez, R.; García, A.; García-Barrera, T.; Barbas, C.; Gómez-Ariza, J.L. Metabolomic profiling of serum in the progression of Alzheimer’s disease by capillary electrophoresis-mass spectrometry. Electrophoresis 2014, 35, 3321–3330. [Google Scholar] [CrossRef]
- Mahajan, U.V.; Varma, V.R.; Griswold, M.E.; Blackshear, C.T.; An, Y.; Oommen, A.M.; Varma, S.; Troncoso, J.C.; Pletnikova, O.; O’Brien, R.; et al. Dysregulation of multiple metabolic networks related to brain transmethylation and polyamine pathways in Alzheimer disease: A targeted metabolomic and transcriptomic study. PLoS Med. 2020, 17, e1003012. [Google Scholar] [CrossRef]
- Tsuruoka, M.; Hara, J.; Hirayama, A.; Sugimoto, M.; Soga, T.; Shankle, W.R.; Tomita, M. Capillary electrophoresis-mass spectrometry-based metabolome analysis of serum and saliva from neurodegenerative dementia patients. Electrophoresis 2013, 34, 2865–2872. [Google Scholar] [CrossRef]
- Nagata, Y.; Hirayama, A.; Ikeda, S.; Shirahata, A.; Shoji, F.; Maruyama, M.; Kayano, M.; Bundo, M.; Hattori, K.; Yoshida, S.; et al. Comparative analysis of cerebrospinal fluid metabolites in Alzheimer’s disease and idiopathic normal pressure hydrocephalus in a Japanese cohort. Biomark. Res. 2018, 6, 5. [Google Scholar] [CrossRef] [Green Version]
- Kaddurah-Daouk, R.; Rozen, S.; Matson, W.; Han, X.; Hulette, C.M.; Burke, J.R.; Doraiswamy, P.M.; Welsh-Bohmer, K.A. Metabolomic changes in autopsy-confirmed Alzheimer’s disease. Alzheimers Dement. 2011, 7, 309–317. [Google Scholar] [CrossRef] [Green Version]
- Kaddurah-Daouk, R.; Zhu, H.; Sharma, S.; Bogdanov, M.; Rozen, S.G.; Matson, W.; Oki, N.O.; Motsinger-Reif, A.A.; Churchill, E.; Lei, Z.; et al. Alterations in metabolic pathways and networks in Alzheimer’s disease. Transl. Psychiatry 2013, 3, e244. [Google Scholar] [CrossRef] [Green Version]
- Zheng, J.; Dixon, R.A.; Li, L. Development of isotope labeling LC-MS for human salivary metabolomics and application to profiling metabolome changes associated with mild cognitive impairment. Anal. Chem. 2012, 84, 10802–10811. [Google Scholar] [CrossRef] [Green Version]
- Peng, J.; Guo, K.; Xia, J.; Zhou, J.; Yang, J.; Westaway, D.; Wishart, D.S.; Li, L. Development of isotope labeling liquid chromatography mass spectrometry for mouse urine metabolomics: Quantitative metabolomic study of transgenic mice related to Alzheimer’s disease. J. Proteome Res. 2014, 13, 4457–4469. [Google Scholar] [CrossRef] [PubMed]
- Takayama, T.; Mochizuki, T.; Todoroki, K.; Min, J.Z.; Mizuno, H.; Inoue, K.; Akatsu, H.; Noge, I.; Toyo’oka, T. A novel approach for LC-MS/MS-based chiral metabolomics fingerprinting and chiral metabolomics extraction using a pair of enantiomers of chiral derivatization reagents. Anal. Chim. Acta 2015, 898, 73–84. [Google Scholar] [CrossRef]
- Myint, K.T.; Aoshima, K.; Tanaka, S.; Nakamura, T.; Oda, Y. Quantitative profiling of polar cationic metabolites in human cerebrospinal fluid by reversed-phase nanoliquid chromatography/mass spectrometry. Anal. Chem. 2009, 81, 1121–1129. [Google Scholar] [CrossRef] [PubMed]
- Ansoleaga, B.; Jové, M.; Schlüter, A.; Garcia-Esparcia, P.; Moreno, J.; Pujol, A.; Pamplona, R.; Portero-Otín, M.; Ferrer, I. Deregulation of purine metabolism in Alzheimer’s disease. Neurobiol. Aging 2015, 36, 68–80. [Google Scholar] [CrossRef] [PubMed]
- González-Domínguez, R.; Sayago, A.; Fernández-Recamales, Á. High-throughput direct mass spectrometry-based metabolomics to characterize metabolite fingerprints associated with Alzheimer’s disease pathogenesis. Metabolites 2018, 8, 52. [Google Scholar] [CrossRef] [PubMed] [Green Version]
- Low, D.Y.; Lefèvre-Arbogast, S.; González-Domínguez, R.; Urpi-Sarda, M.; Micheau, P.; Petera, M.; Centeno, D.; Durand, S.; Pujos-Guillot, E.; Korosi, A.; et al. Diet-related metabolites associated with cognitive decline revealed by untargeted metabolomics in a prospective cohort. Mol. Nutr. Food Res. 2019, 63, e1900177. [Google Scholar] [CrossRef] [PubMed] [Green Version]
- Casanova, R.; Varma, S.; Simpson, B.; Min, K.; An, Y.; Saldana, S.; Riveros, C.; Moscato, P.; Griswold, M.; Sonntag, D.; et al. Blood metabolite markers of preclinical Alzheimer’s disease in two longitudinally followed cohorts of older individuals. Alzheimers Dement. 2016, 12, 815–822. [Google Scholar] [CrossRef] [PubMed] [Green Version]
- Li, D.; Misialek, J.R.; Boerwinkle, E.; Gottesman, R.F.; Sharrett, A.R.; Mosley, T.H.; Coresh, J.; Wruck, L.M.; Knopman, D.S.; Alonso, A. Prospective associations of plasma phospholipids and mild cognitive impairment/dementia among African Americans in the ARIC Neurocognitive Study. Alzheimers Dement. 2017, 6, 1–10. [Google Scholar] [CrossRef] [PubMed] [Green Version]
- Costa, A.C.; Joaquim, H.P.G.; Forlenza, O.; Talib, L.L.; Gattaz, W.F. Plasma lipids metabolism in mild cognitive impairment and Alzheimer’s disease. World J. Biol. Psychiatry 2019, 20, 190–196. [Google Scholar] [CrossRef] [PubMed]
- Johnson, C.H.; Ivanisevic, J.; Siuzdak, G. Metabolomics: Beyond biomarkers and towards mechanisms. Nat. Rev. Mol. Cell Biol. 2016, 17, 451–459. [Google Scholar] [CrossRef] [PubMed] [Green Version]


| Study Population | Analytical Platform | Biological Sample | Key Results (Altered Pathways) | Ref. |
|---|---|---|---|---|
| AD (N = 22)/healthy controls (N = 18) | DMS | serum | Energy metabolism (glucose, carnitine, creatine), fatty acid metabolism (free fatty acids, eicosanoids), neurotransmission (dopamine), phospholipid homeostasis | [18] |
| AD (N = 22)/healthy controls (N = 18) | DMS | serum | Phospholipid homeostasis | [19] |
| AD (N = 22)/healthy controls (N = 18) | DMS | serum | Nitrogen metabolism (guanidine, arginine, putrescine), fatty acid metabolism (eicosanoids), neurotransmission (kynurenine), phospholipid homeostasis | [20] |
| AD (N = 19)/healthy controls (N = 17) | DMS + RPLC-MS | serum | Phospholipid homeostasis | [21] |
| AD (N = 30)/healthy controls (N = 30) | DMS (APPI) | serum | Energy metabolism (creatine, malic acid), fatty acid metabolism (free fatty acids, fatty acid amides), neurotransmission (dopamine, serotonin, picolinic acid), phospholipid and sphingolipid homeostasis | [22] |
| APP × PS1 (N = 30)/WT (N = 30) | DMS (ESI+APPI) | serum | Energy metabolism (glucose, carnitine, creatine), fatty acid metabolism (free fatty acids, eicosanoids), nitrogen metabolism (urea), amino acid metabolism, lipid homeostasis | [23] |
| APP × PS1 (N = 10)/WT (N = 10) | DMS | urine | Unidentified discriminant signals | [24] |
| APP × PS1 (N = 30)/WT (N =30) | DMS | hippocampus, cortex, cerebellum, olfactory bulb | Energy metabolism (pyruvic acid), fatty acid metabolism (free fatty acids, acyl-carnitines, eicosanoids), nucleotide metabolism, nitrogen metabolism (urea, N-acetylspermidine), amino acid metabolism, neurotransmission (dopamine), phospholipid homeostasis | [25] |
| APP × PS1 (N = 30)/WT (N = 30) | DMS | liver, kidney, spleen, thymus | Energy metabolism (glycolysis, TCA, creatine), fatty acid metabolism (free fatty acids, acyl-carnitines, eicosanoids), nucleotide metabolism, nitrogen metabolism (urea, polyamines), amino acid metabolism, lipid homeostasis | [26] |
| APP × PS1 × IL4-KO (N = 7)/APP × PS1 (N = 7)/WT (N = 7) | DMS | serum | Fatty acid metabolism (eicosanoids), nitrogen metabolism (urea, citrulline), amino acid metabolism, neurotransmission (dopamine, histamine) | [27] |
| CRND8 (N = 6)/WT (N = 6) | DMS | hippocampus | Energy metabolism (glucose), fatty acid metabolism (eicosanoids, β-oxidation) | [28] |
| CRND8 (N = 6)/WT (N = 6) | DMS | cerebellum | Fatty acid metabolism (eicosanoids), amino acid metabolism, nucleotide metabolism (purines) | [29] |
| AD (N = 9)/healthy controls (N = 9) | GC-MS | hippocampus, entorhinal cortex, middle-temporal gyrus, sensory cortex, motor cortex, cingulate gyrus, cerebellum | Energy metabolism (glycolysis, pentose phosphate, TCA), nucleotide metabolism, nitrogen metabolism (urea), amino acid metabolism | [30] |
| SAMP8 (N = 5, 2 months; N = 6, 7 months; N = 7, 12 months) | GC-MS | hippocampus | Energy metabolism (TCA, lactic acid), nitrogen metabolism (urea), amino acid metabolism, lipid homeostasis | [31] |
| APP × PS1 (N = 12)/WT (N = 11) | GC-MS | hippocampus | Energy metabolism (ketone bodies), amino acid metabolism, sphingolipid homeostasis | [32] |
| TASTPM (N = 16)/WT (N = 5) | GC-MS | whole brain, plasma | Energy metabolism (glycolysis, pentose phosphate), amino acid metabolism, steroid homeostasis | [33] |
| AD (N = 23)/healthy controls (N = 21) | GC-MS | serum | Energy metabolism (glucose, TCA, lactic acid), fatty acid metabolism (free fatty acids), nucleotide metabolism, nitrogen metabolism (urea, ornithine), amino acid metabolism | [34] |
| AD (N = 24)/MCI (N = 16)/PD (N = 22)/healthy controls (N = 8) | GC-MS | exhaled breath | Phenol (PD) | [35] |
| APPTg2576 (N = 15)/CRND8 (N = 9)/ APPV717I (N = 10)/WT (N = 17 + 9 + 12) | GC-MS | urine | Urinary odorants | [36] |
| AD (N = 47)/MCI (N = 143)/healthy controls (N = 46) | GC-MS + RPLC-MS | serum | Baseline: lipid homeostasis (phospholipids, sphingolipids, sterols) Progression: energy metabolism (2,4-dihydroxybutanoic acid) | [37] |
| AD (N = 57)/MCI (N = 58)/healthy controls (N = 57) | GC-MS + RPLC-MS | plasma | Fatty acid metabolism (free fatty acids), energy metabolism (glycolysis, TCA), one-carbon metabolism, amino acid metabolism, nucleotide metabolism | [38] |
| DS-AD (N = 78)/DS-control (N = 68) | GC-MS + RPLC-MS | plasma | Energy metabolism (anaerobic respiration) | [39] |
| APPTg2576 (N = 3)/PS1 (N = 3)/APP × PS1 (N = 6)/WT (N = 6) | GC-MS + RPLC-MS | hippocampus | Energy metabolism (glycolysis, TCA), nucleotide metabolism, amino acid metabolism, neurotransmission | [40] |
| AD (N = 79)/healthy controls (N = 51) | GC-MS + RPLC-MS | CSF | Neurotransmission (dopamine, noradrenaline, MHPG), cortisol, uridine | [41] |
| AD (N = 40)/healthy controls (N = 38) | GC-MS + RPLC-MS | CSF | Two unidentified discriminant signals | [42] |
| APP × PS1 (N = 30)/WT (N = 30) | GC-MS + RPLC-MS | serum | Energy metabolism (glycolysis, TCA), fatty acid metabolism (free fatty acids, fatty acid amides, acyl-carnitines, eicosanoids), nitrogen metabolism (urea, citrulline), nucleotide metabolism, amino acid metabolism, neurotransmission (serotonin), homeostasis of cholesterol, phospholipids and sphingolipids | [43] |
| APP × PS1 (N = 30)/WT (N = 30) | GC-MS + RPLC-MS | hippocampus, cortex, striatum, cerebellum, olfactory bulb | Energy metabolism (glycolysis, TCA), nitrogen metabolism (urea), amino acid metabolism, neurotransmission (dopamine), phospholipid and sphingolipid homeostasis | [44] |
| APP × PS1 (N = 30)/WT (N = 30) | GC-MS + RPLC-MS | liver, kidney | Energy metabolism (glycolysis, TCA), fatty acid metabolism (free fatty acids, acyl-carnitines), nitrogen metabolism (urea, spermidine), amino acid metabolism, homeostasis of cholesterol, phospholipids and sphingolipids | [45] |
| APP × PS1 (N = 30)/WT (N = 30) | GC-MS + RPLC-MS | spleen, thymus | Energy metabolism (glycolysis, TCA), fatty acid metabolism (free fatty acids, acyl-carnitines), nitrogen metabolism (urea, putrescine), nucleotide metabolism, amino acid metabolism, homeostasis of cholesterol, phospholipids and sphingolipids | [46] |
| AD (N = 15)/healthy controls (N = 15) | HILIC-MS | neocortex | 76 unidentified discriminant signals | [47] |
| AD (N =20)/healthy controls (N = 20) | HILIC-MS | plasma | 54 unidentified discriminant signals | [48] |
| MCI_AD (N = 19)/MCI (N = 16)/healthy controls (N = 37) | HILIC-MS | plasma | Polyamine metabolism, L-arginine metabolism | [49] |
| CRND8 (N = 18/12, 12/18 weeks)/WT (N = 12/12, 12/18 weeks) | HILIC-MS | urine | Aromatic amino acid metabolism, nucleotide metabolism, ascorbate metabolism | [50] |
| AD (N = 15)/MCI (N = 15)/healthy controls (N = 15) | HILIC-MS + RPLC-MS | plasma, CSF | Energy metabolism (glycolysis, TCA), fatty acid metabolism, amino acid metabolism, neurotransmission, lipid homeostasis | [51] |
| AD (N = 21)/MCI_AD (N = 12)/MCI_stable (N = 21)/healthy controls (N = 21) | HILIC-MS + RPLC-MS | CSF | Nucleotide metabolism, amino acid metabolism, neurotransmission | [52] |
| AD (N = 9)/healthy controls (N = 9) | HILIC-MS + RPLC-MS | superior temporal cortex | Amino acid metabolism, neurotransmission | [53] |
| AD (N = 21)/healthy controls (N = 19) | HILIC-MS + RPLC-MS | frontal cortex | Amino acid metabolism, purine metabolism, pantothenate and CoA biosynthesis, phospholipid homeostasis | [54] |
| AD (N = 30)/MCI (N = 30)/healthy controls (N = 30) | HILIC-MS + RPLC-MS | plasma | Sphingolipid metabolism | [55] |
| AD (N = 23)/MCI_AD (N = 9)/MCI_stable (N = 22)/SCI (N = 19) | CE-MS | CSF | Amino acid metabolism, fatty acid metabolism, one-carbon metabolism | [56] |
| AD (N = 42)/MCI (N = 14)/healthy controls (N = 37) | CE-MS | serum | Amino acid metabolism, fatty acid metabolism, one-carbon metabolism | [57] |
| AD (N = 17)/asymptomatic AD (N = 13)/healthy controls (N = 13) | CE-MS | inferior temporal gyrus, middle frontal gyrus, cerebellum | Nitrogen metabolism (urea, polyamines), one-carbon metabolism, neurotransmission | [58] |
| AD (N = 3)/FTLD (N = 4)/LBD (N = 3)/healthy controls (N = 9) | CE-MS | serum, saliva | Energy metabolism, amino acid metabolism | [59] |
| AD (N = 81)/iNPH (N = 57) | CE-MS | CSF | Energy metabolism, amino acid metabolism | [60] |
| AD (N = 15)/healthy controls (N = 15) | RPLC-MS (ion pairing) | CSF | Neurotransmission, nucleotide metabolism, antioxidant defense | [61] |
| AD (N= 40)/MCI (N = 36)/healthy controls (N = 38) | RPLC-MS (ion pairing) | CSF | Neurotransmission, nucleotide metabolism, antioxidant defense | [62] |
| MCI (N = 20)/healthy controls (N = 20) | RPLC-MS (derivatization) | saliva | Taurine | [63] |
| CRND8 (N = 12)/WT (N = 12) | RPLC-MS (derivatization) | urine | Taurine, amino acid metabolism | [64] |
| AD_younger (N = 4)/AD_older (N = 4)/healthy controls (N = 3) | RPLC-MS (derivatization) | frontal lobe | L-phenylalanine, L-lactate | [65] |
| AD (N = 17)/healthy controls (N = 17) | RPLC-MS (improved retention for polar metabolites) | CSF | 53 unidentified discriminant signals | [66] |
| AD I-II (N = 7)/AD III-IV (N = 4)/AD V-VI (N = 5)/healthy controls (N = 4) | RPLC-MS (improved retention for polar metabolites) | entorhinal cortex | Nucleotide metabolism | [67] |
Publisher’s Note: MDPI stays neutral with regard to jurisdictional claims in published maps and institutional affiliations. |
© 2021 by the authors. Licensee MDPI, Basel, Switzerland. This article is an open access article distributed under the terms and conditions of the Creative Commons Attribution (CC BY) license (http://creativecommons.org/licenses/by/4.0/).
Share and Cite
González-Domínguez, R.; González-Domínguez, Á.; Sayago, A.; González-Sanz, J.D.; Lechuga-Sancho, A.M.; Fernández-Recamales, Á. Mechanistic Insights into Alzheimer’s Disease Unveiled through the Investigation of Disturbances in Central Metabolites and Metabolic Pathways. Biomedicines 2021, 9, 298. https://0-doi-org.brum.beds.ac.uk/10.3390/biomedicines9030298
González-Domínguez R, González-Domínguez Á, Sayago A, González-Sanz JD, Lechuga-Sancho AM, Fernández-Recamales Á. Mechanistic Insights into Alzheimer’s Disease Unveiled through the Investigation of Disturbances in Central Metabolites and Metabolic Pathways. Biomedicines. 2021; 9(3):298. https://0-doi-org.brum.beds.ac.uk/10.3390/biomedicines9030298
Chicago/Turabian StyleGonzález-Domínguez, Raúl, Álvaro González-Domínguez, Ana Sayago, Juan Diego González-Sanz, Alfonso María Lechuga-Sancho, and Ángeles Fernández-Recamales. 2021. "Mechanistic Insights into Alzheimer’s Disease Unveiled through the Investigation of Disturbances in Central Metabolites and Metabolic Pathways" Biomedicines 9, no. 3: 298. https://0-doi-org.brum.beds.ac.uk/10.3390/biomedicines9030298