
Determinants of Schizophrenia Endophenotypes Based on Neuroimaging and Biochemical Parameters

 , and
, and
Abstract
:1. Introduction
2. Materials and Methods
2.1. Study Participants
2.2. Routinely Performed Laboratory Tests
2.3. Parameters of the Oxidant-Antioxidant Balance
2.3.1. Rationale for the Assessment of the Efficiency of the Antioxidant System Expressed as FRAP in Schizophrenia
2.3.2. The Total Antioxidant Power Expressed as FRAP
2.3.3. Rationale for the Assessment the Activity of Paraoxonase-1 (PON-1)
2.3.4. Rationale for the Assessment of the Lipid Peroxidation Product—MDA (Malondialdehyde)
2.4. Clinical Evaluation
2.5. Neuroimaging
2.6. Statistical Analysis
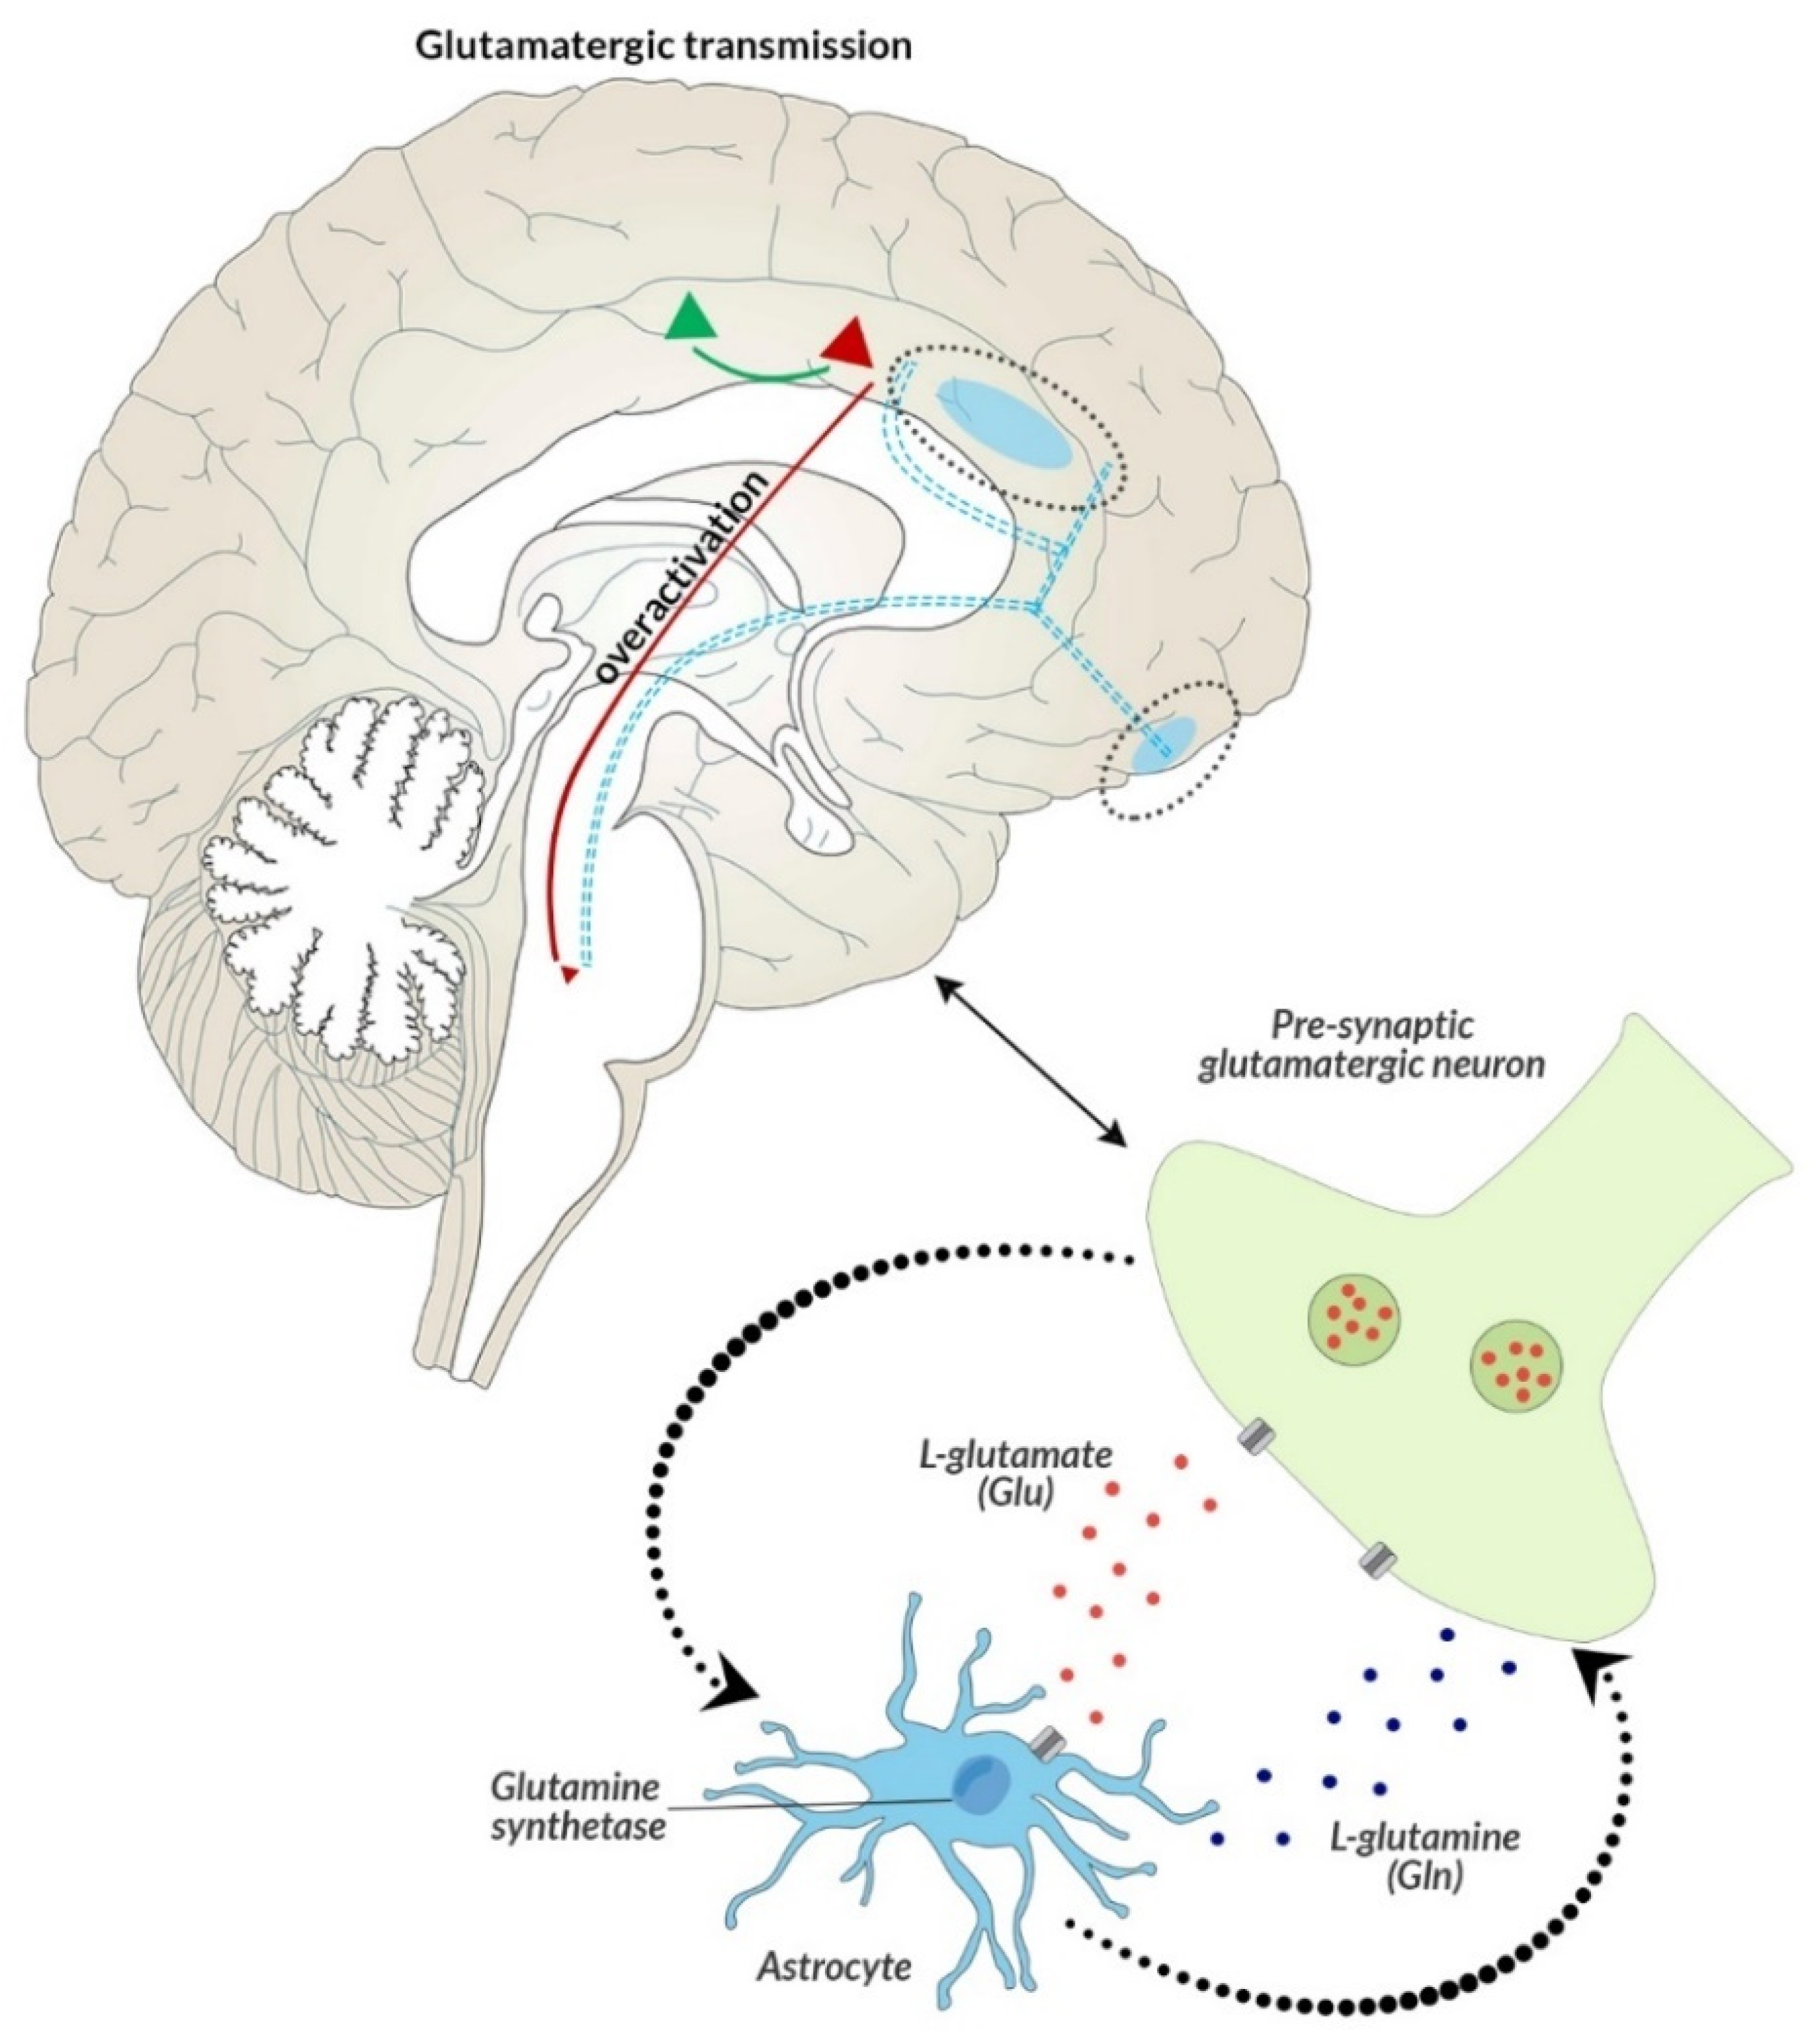
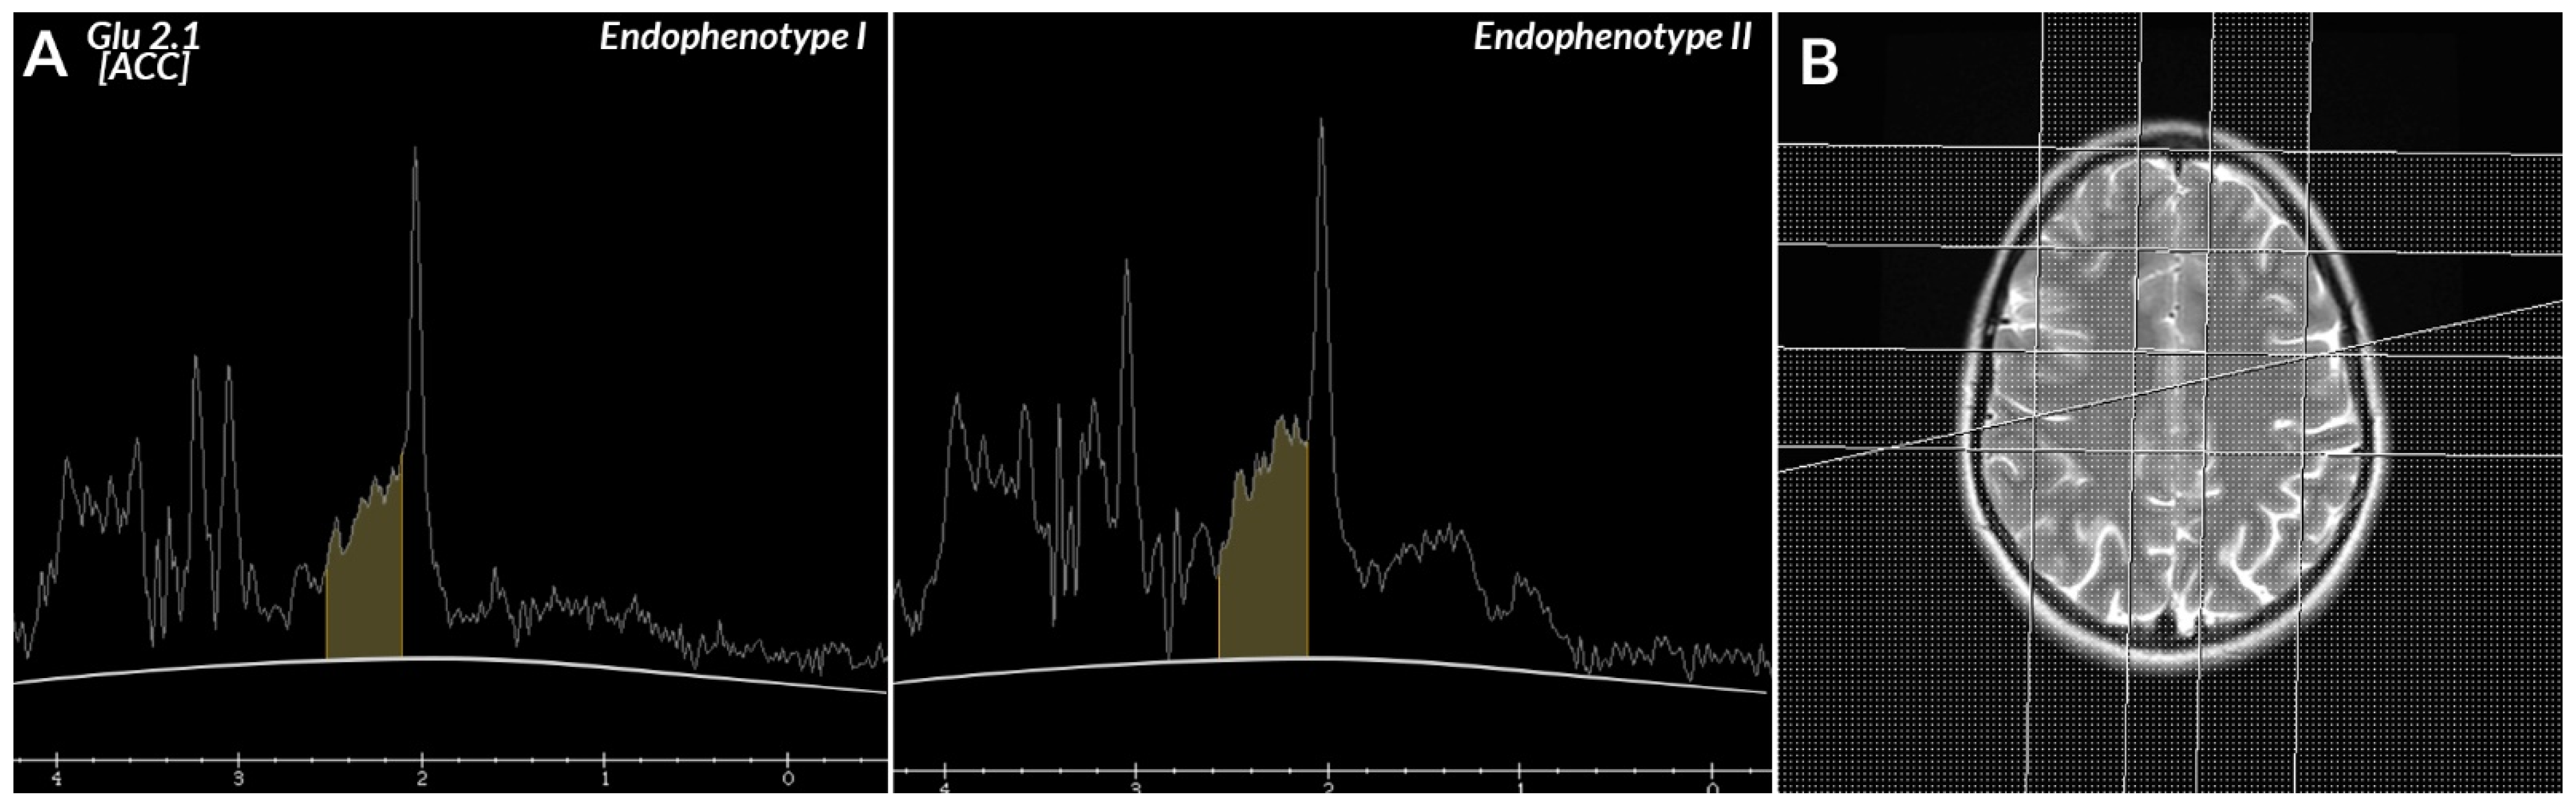
- Brain metabolites, i.e.,—lipids (lip 0.9–1.0 ppm), lactates (lac 1.33 ppm), alanine (ala 1.48 mm), N-acetyl-aspartate (NAA 2.02 ppm), glutamate (glu 2.1 and 3.7 ppm), γ-aminobutyric acid (GABA 2.3 ppm), glutamine (gln 2.45 and 3.7 ppm), creatine (Cr 3.02 and 3.9 ppm), choline (Cho 3.22 ppm), glucose (glc 3.43 and 3.8 ppm), myo-inositol (mI 3.56 ppm), and glutathione (GSH 3.7 ppm), as well as the ratios of these metabolites in the frontal lobes—right, left, and ACC.
- Biochemical parameters routinely determined as part of outpatient diagnostics, i.e.,: complete blood count (5-diff) and a manual smear, biochemical markers (ionogram—sodium [mmol/L], potassium [mmol/L], and chlorides [mmol/L]; metabolic markers—glucose [mmol/L], lipidogram—cholesterol [mmol/L], HDL [mmol/L], LDL [mmol/L], triglycerides [mmol/L]; renal markers—creatinine [µmol/L], eGFR according to MORD [mL/min/1.73 m2]: inflammatory markers—CRP [mg/L], cortisol [µg/dL], complement C3 [mg/dL], complement C4 [mg/dL]; thyroid markers—T4, T3, TSH);
- Biochemical parameters reflecting the formation and action of reactive oxygen species and the related excess of oxidative stress, which is a response to the breakdown of the elements of antioxidant defense, i.e., MDA, FRAP, and PON-1. Their selection was dictated by the redox balance and inflammation of the nervous system in altered glutamatergic transmission, associated with disease symptoms [54]. Changes in the peripheral redox microcircuits presented in the study, due to the increased permeability of BBB, might lead to increased infiltration of peripheral material into the brain, and consequently might be a potential pathogenetic factor of the disease [51]. The brain’s susceptibility to stress, which leads to the overproduction of reactive forms of oxide, nitrogen, and sulfur, in conditions of impaired antioxidant defense, consequently causes damage to macromolecules, including extensive peroxidation of proteins, lipids, or nucleic acids, increased permeability of the blood–brain barrier and causes inflammation of the nervous system. Only when taken together, this can provide a reliable assessment of the centrally occurring changes in brain metabolism and morphology observed in mental disorders of a multifactorial nature [78].
3. Results
3.1. Endophenotypes
3.2. Relationship of the Endophenotypes with the Clinical State of Patients with Schizophrenia
3.3. Relationship of the Endophenotypes with Routinely Determined Parameters
3.4. Relationship of the Endophenotypes with Biochemical Parameters and Diffusion in the Anterior Cingulate Area
4. Discussion
4.1. Endophenotypes
4.2. Limitations
5. Conclusions
Author Contributions
Funding
Institutional Review Board Statement
Informed Consent Statement
Data Availability Statement
Conflicts of Interest
References
- World Health Organization. International Statistical Classification of Diseases and Related Health Problems; World Health Organization: Geneva, Switzerland, 2010. [Google Scholar]
- Group, B.D.W. Biomarkers and surrogate endpoints: Preferred definitions and conceptual framework. Clin. Pharmacol. Ther. 2001, 69, 89–95. [Google Scholar]
- Ritsner, M. Neuropsychiatric Biomarkers, Endophenotypes and Genes: Promises, Advances and Challenges; Springer: Berlin, Germany, 2009. [Google Scholar]
- Schmitt, A.; Rujescu, D.; Gawlik, M.; Hasan, A.; Hashimoto, K.; Iceta, S.; Jarema, M.; Kambeitz, J.; Kasper, S.; Keeser, D.; et al. Consensus paper of the WFSBP Task Force on Biological Markers: Criteria for biomarkers and endophenotypes of schizophrenia part II: Cognition, neuroimaging and genetics. World J. Biol. Psychiatry 2016, 17, 406–428. [Google Scholar] [CrossRef] [PubMed]
- Meehl, P.E. Toward an Integrated Theory of Schizotaxia, Schizotypy, and Schizophrenia. J. Pers. Disord. 1990, 4, 1–99. [Google Scholar] [CrossRef] [Green Version]
- Lenzenweger, M. Schizotypy and Schizophrenia: The View from Experimental Psychopathology; Guilford Press: New York, NY, USA, 2010. [Google Scholar]
- World Health Organization. The ICD-10 Classification of Mental and Behavioural Disorders: Diagnostic Criteria for Research; World Health Organization: Geneva, Switzerland, 1993; Volume 2. [Google Scholar]
- Clark, L.A.; Cuthbert, B.; Lewis-Fernández, R.; Narrow, W.E.; Reed, G.M. Three Approaches to Understanding and Classifying Mental Disorder: ICD-11, DSM-5, and the National Institute of Mental Health’s Research Domain Criteria (RDoC). Psychol. Sci. Public Interest 2017, 18, 72–145. [Google Scholar] [CrossRef] [PubMed] [Green Version]
- Grover, S.; Dua, D.; Chakrabarti, S.; Avasthi, A. Factor analysis of symptom dimensions (psychotic, affective and obsessive compulsive symptoms) in schizophrenia. Asian J. Psychiatry 2018, 38, 72–77. [Google Scholar] [CrossRef] [PubMed]
- Lenzenweger, M.F. Schizotypy, Schizotypic Psychopathology, and Schizophrenia: Hearing Echoes, Leveraging Prior Advances, and Probing New Angles. Schizophr. Bull. 2018, 44, S564–S569. [Google Scholar] [CrossRef]
- Paksarian, D.; Merikangas, K.R.; Calkins, M.E.; Gur, R.E. Racial-ethnic disparities in empirically-derived subtypes of subclinical psychosis among a U.S. sample of youths. Schizophr. Res. 2016, 170, 205–210. [Google Scholar] [CrossRef] [Green Version]
- Gross, G. Therapy of subclinical (subdiagnostic) syndromes of schizophrenia spectrum. Fortschr. Neurol. Psychiatr. 2001, 69 (Suppl. 2), S95–S100. [Google Scholar] [CrossRef]
- Rasmussen, A.R.; Nordgaard, J.; Parnas, J. Schizophrenia-spectrum psychopathology in obsessive-compulsive disorder: An empirical study. Eur. Arch. Psychiatry Clin. Neurosci. 2020, 270, 993–1002. [Google Scholar] [CrossRef] [Green Version]
- Blokland, G.A.M.; Del Re, E.C.; Mesholam-Gately, R.I.; Jovicich, J.; Trampush, J.W.; Keshavan, M.S.; DeLisi, L.E.; Walters, J.T.R.; Turner, J.A.; Malhotra, A.K.; et al. The Genetics of Endophenotypes of Neurofunction to Understand Schizophrenia (GENUS) consortium: A collaborative cognitive and neuroimaging genetics project. Schizophr. Res. 2018, 195, 306–317. [Google Scholar] [CrossRef] [Green Version]
- Gottesman, I.I.; Gould, T.D. The endophenotype concept in psychiatry: Etymology and strategic intentions. Am. J. Psychiatry 2003, 160, 636–645. [Google Scholar] [CrossRef]
- National Institute of Mental Health. Available online: https://www-1nimh-1nih-1gov-1nb5yei5r0029.hanproxy.cm-uj.krakow.pl/research/research-funded-by-nimh/rdoc/index.shtml (accessed on 2 February 2021).
- Smucny, J.; Iosif, A.-M.; Eaton, N.R.; Lesh, T.A.; Ragland, J.D.; Barch, D.M.; Gold, J.M.; Strauss, M.E.; MacDonald, A.W.; Silverstein, S.M.; et al. Latent Profiles of Cognitive Control, Episodic Memory, and Visual Perception Across Psychiatric Disorders Reveal a Dimensional Structure. Schizophr. Bull. 2020, 46, 154–162. [Google Scholar] [CrossRef] [PubMed]
- Lenzenweger, M.F. Thinking clearly about schizotypy: Hewing to the schizophrenia liability core, considering interesting tangents, and avoiding conceptual quicksand. Schizophr. Bull. 2015, 41 (Suppl. 2), S483–S491. [Google Scholar] [CrossRef] [PubMed]
- Lenzenweger, M.F. Schizotaxia, schizotypy, and schizophrenia: Paul, E. Meehl’s blueprint for the experimental psychopathology and genetics of schizophrenia. J. Abnorm. Psychol. 2006, 115, 195–200. [Google Scholar] [CrossRef] [PubMed]
- Sukumar, N.; Sabesan, P.; Anazodo, U.; Palaniyappan, L. Neurovascular Uncoupling in Schizophrenia: A Bimodal Meta-Analysis of Brain Perfusion and Glucose Metabolism. Front. Psychiatry 2020, 11, 754. [Google Scholar] [CrossRef] [PubMed]
- Bryll, A.; Krzyściak, W.; Karcz, P.; Śmierciak, N.; Kozicz, T.; Skrzypek, J.; Szwajca, M.; Pilecki, M.; Popiela, T.J. The Relationship between the Level of Anterior Cingulate Cortex Metabolites, Brain-Periphery Redox Imbalance, and the Clinical State of Patients with Schizophrenia and Personality Disorders. Biomolecules 2020, 10, 1272. [Google Scholar] [CrossRef]
- Adams, R.; David, A.S. Patterns of anterior cingulate activation in schizophrenia: A selective review. Neuropsychiatr. Dis. Treat. 2007, 3, 87–101. [Google Scholar] [CrossRef] [Green Version]
- Varea, O.; Martin-de-Saavedra, M.D.; Kopeikina, K.J.; Schürmann, B.; Fleming, H.J.; Fawcett-Patel, J.M.; Bach, A.; Jang, S.; Peles, E.; Kim, E.; et al. Synaptic abnormalities and cytoplasmic glutamate receptor aggregates in contactin associated protein-like 2/Caspr2 knockout neurons. Proc. Natl. Acad. Sci. USA 2015, 112, 6176–6181. [Google Scholar] [CrossRef] [Green Version]
- Shukla, D.K.; Wijtenburg, S.A.; Chen, H.; Chiappelli, J.J.; Kochunov, P.; Hong, L.E.; Rowland, L.M. Anterior Cingulate Glutamate and GABA Associations on Functional Connectivity in Schizophrenia. Schizophr. Bull. 2019, 45, 647–658. [Google Scholar] [CrossRef]
- Demro, C.; Rowland, L.; Wijtenburg, S.A.; Waltz, J.; Gold, J.; Kline, E.; Thompson, E.; Reeves, G.; Hong, L.E.; Schiffman, J. Glutamatergic metabolites among adolescents at risk for psychosis. Psychiatry Res. 2017, 257, 179–185. [Google Scholar] [CrossRef]
- Vargas, T.; Damme, K.S.F.; Ered, A.; Capizzi, R.; Frosch, I.; Ellman, L.M.; Mittal, V.A. Neuroimaging Markers of Resiliency in Youth at Clinical High Risk for Psychosis: A Qualitative Review. Biol. Psychiatry. Cogn. Neurosci. Neuroimaging 2021, 6, 166–177. [Google Scholar] [CrossRef]
- Tandon, N.; Bolo, N.R.; Sanghavi, K.; Mathew, I.T.; Francis, A.N.; Stanley, J.A.; Keshavan, M.S. Brain metabolite alterations in young adults at familial high risk for schizophrenia using proton magnetic resonance spectroscopy. Schizophr. Res. 2013, 148, 59–66. [Google Scholar] [CrossRef] [PubMed]
- Chen, X.; Tamang, S.M.; Du, F.; Ongur, D. Glutamate diffusion in the rat brain in vivo under light and deep anesthesia conditions. Magn. Reson. Med. 2019, 82, 84–94. [Google Scholar] [CrossRef] [PubMed]
- Bruno, V.; Scapagnini, U.; Canonico, P.L. Excitatory amino acids and neurotoxicity. Funct. Neurol. 1993, 8, 279–292. [Google Scholar] [PubMed]
- Smith, Q.R. Transport of glutamate and other amino acids at the blood-brain barrier. J. Nutr. 2000, 130, 1016S–1022S. [Google Scholar] [CrossRef]
- Limongi, R.; Jeon, P.; Mackinley, M.; Das, T.; Dempster, K.; Théberge, J.; Bartha, R.; Wong, D.; Palaniyappan, L. Glutamate and Dysconnection in the Salience Network: Neurochemical, Effective Connectivity, and Computational Evidence in Schizophrenia. Biol. Psychiatry 2020, 88, 273–281. [Google Scholar] [CrossRef] [PubMed]
- Wenneberg, C.; Glenthøj, B.Y.; Hjorthøj, C.; Buchardt Zingenberg, F.J.; Glenthøj, L.B.; Rostrup, E.; Broberg, B.V.; Nordentoft, M. Cerebral glutamate and GABA levels in high-risk of psychosis states: A focused review and meta-analysis of (1)H-MRS studies. Schizophr. Res. 2020, 215, 38–48. [Google Scholar] [CrossRef] [PubMed]
- Borgan, F.R.; Jauhar, S.; McCutcheon, R.A.; Pepper, F.S.; Rogdaki, M.; Lythgoe, D.J.; Howes, O.D. Glutamate levels in the anterior cingulate cortex in un-medicated first episode psychosis: A proton magnetic resonance spectroscopy study. Sci. Rep. 2019, 9, 8685. [Google Scholar] [CrossRef]
- Moghaddam, B.; Adams, B.; Verma, A.; Daly, D. Activation of glutamatergic neurotransmission by ketamine: A novel step in the pathway from NMDA receptor blockade to dopaminergic and cognitive disruptions associated with the prefrontal cortex. J. Neurosci. 1997, 17, 2921–2927. [Google Scholar] [CrossRef]
- Thompson, S.L.; Welch, A.C.; Iourinets, J.; Dulawa, S.C. Ketamine induces immediate and delayed alterations of OCD-like behavior. Psychopharmacology 2020, 237, 627–638. [Google Scholar] [CrossRef]
- Howes, O.D.; Kambeitz, J.; Kim, E.; Stahl, D.; Slifstein, M.; Abi-Dargham, A.; Kapur, S. The nature of dopamine dysfunction in schizophrenia and what this means for treatment. Arch. Gen. Psychiatry 2012, 69, 776–786. [Google Scholar] [CrossRef] [PubMed] [Green Version]
- Moghaddam, B.; Krystal, J.H. Capturing the angel in “angel dust”: Twenty years of translational neuroscience studies of NMDA receptor antagonists in animals and humans. Schizophr. Bull. 2012, 38, 942–949. [Google Scholar] [CrossRef] [PubMed] [Green Version]
- Michael, N.; Erfurth, A.; Ohrmann, P.; Gössling, M.; Arolt, V.; Heindel, W.; Pfleiderer, B. Acute mania is accompanied by elevated glutamate/glutamine levels within the left dorsolateral prefrontal cortex. Psychopharmacology 2003, 168, 344–346. [Google Scholar] [CrossRef]
- Shevelkin, A.V.; Terrillion, C.E.; Hasegawa, Y.; Mychko, O.A.; Jouroukhin, Y.; Sawa, A.; Kamiya, A.; Pletnikov, M.V. Astrocyte DISC1 contributes to cognitive function in a brain region-dependent manner. Hum. Mol. Genet. 2020, 29, 2936–2950. [Google Scholar] [CrossRef]
- Blumberg, H.P.; Krystal, J.H.; Bansal, R.; Martin, A.; Dziura, J.; Durkin, K.; Martin, L.; Gerard, E.; Charney, D.S.; Peterson, B.S. Age, rapid-cycling, and pharmacotherapy effects on ventral prefrontal cortex in bipolar disorder: A cross-sectional study. Biol. Psychiatry 2006, 59, 611–618. [Google Scholar] [CrossRef] [PubMed]
- Ongür, D.; Jensen, J.E.; Prescot, A.P.; Stork, C.; Lundy, M.; Cohen, B.M.; Renshaw, P.F. Abnormal glutamatergic neurotransmission and neuronal-glial interactions in acute mania. Biol. Psychiatry 2008, 64, 718–726. [Google Scholar] [CrossRef] [PubMed] [Green Version]
- Cadinu, D.; Grayson, B.; Podda, G.; Harte, M.K.; Doostdar, N.; Neill, J.C. NMDA receptor antagonist rodent models for cognition in schizophrenia and identification of novel drug treatments, an update. Neuropharmacology 2018, 142, 41–62. [Google Scholar] [CrossRef] [PubMed] [Green Version]
- Del Arco, A.; Ronzoni, G.; Mora, F. Hypofunction of prefrontal cortex NMDA receptors does not change stress-induced release of dopamine and noradrenaline in amygdala but disrupts aversive memory. Psychopharmacology 2015, 232, 2577–2586. [Google Scholar] [CrossRef]
- Govindaraju, V.; Young, K.; Maudsley, A.A. Proton NMR chemical shifts and coupling constants for brain metabolites. NMR Biomed. 2000, 13, 129–153. [Google Scholar] [CrossRef]
- Kolomeets, N.S. Disturbance of oligodendrocyte differentiation in schizophrenia in relation to main hypothesis of the disease. Zhurnal Nevrol. i Psikhiatrii Im. S. S. Korsakova 2017, 117, 108–117. [Google Scholar] [CrossRef] [PubMed]
- Marshall, C.R.; Howrigan, D.P.; Merico, D.; Thiruvahindrapuram, B.; Wu, W.; Greer, D.S.; Antaki, D.; Shetty, A.; Holmans, P.A.; Pinto, D.; et al. Contribution of copy number variants to schizophrenia from a genome-wide study of 41,321 subjects. Nat. Genet. 2017, 49, 27–35. [Google Scholar] [CrossRef] [Green Version]
- Szczeklik, K.; Krzyściak, W. Od uszkodzeń miejscowych do narządowych-konsekwencje zaburzeń równowagi pomiędzy produkcją reaktywnych form tlenu a sprawnością układów antyoksydacyjnych w chorobie Leśniowskiego-Crohna. Przegl. Lek. 2019, 76, 36–42. [Google Scholar]
- Lee, E.E.; Sears, D.D.; Liu, J.; Jin, H.; Tu, X.M.; Eyler, L.T.; Jeste, D.V. A novel biomarker of cardiometabolic pathology in schizophrenia? J. Psychiatr. Res. 2019, 117, 31–37. [Google Scholar] [CrossRef] [Green Version]
- Devanarayanan, S.; Nandeesha, H.; Kattimani, S.; Sarkar, S.; Jose, J. Elevated copper, hs C-reactive protein and dyslipidemia in drug free schizophrenia: Relation with psychopathology score. Asian J. Psychiatry 2016, 24, 99–102. [Google Scholar] [CrossRef] [PubMed]
- Rose, C.R.; Ziemens, D.; Untiet, V.; Fahlke, C. Molecular and cellular physiology of sodium-dependent glutamate transporters. Brain Res. Bull. 2018, 136, 3–16. [Google Scholar] [CrossRef]
- Morris, G.; Walker, A.J.; Walder, K.; Berk, M.; Marx, W.; Carvalho, A.F.; Maes, M.; Puri, B.K. Increasing Nrf2 Activity as a Treatment Approach in Neuropsychiatry. Mol. Neurobiol. 2021. [Google Scholar] [CrossRef] [PubMed]
- KÖŞger, F.; YİĞİtaslan, S.; EŞsİzoĞlu, A.; GÜleÇ, G.; KarataŞ, R.D.; DeĞİrmencİ, S.S. Inflammation and Oxidative Stress in Deficit Schizophrenia. Noro Psikiyatr. Ars. 2020, 57, 303–307. [Google Scholar]
- Coughlin, J.M.; Yang, K.; Marsman, A.; Pradhan, S.; Wang, M.; Ward, R.E.; Bonekamp, S.; Ambinder, E.B.; Higgs, C.P.; Kim, P.K.; et al. A multimodal approach to studying the relationship between peripheral glutathione, brain glutamate, and cognition in health and in schizophrenia. Mol. Psychiatry 2020, 1–10. [Google Scholar] [CrossRef]
- Kealy, J.; Greene, C.; Campbell, M. Blood-brain barrier regulation in psychiatric disorders. Neurosci. Lett. 2020, 726, 133664. [Google Scholar] [CrossRef] [Green Version]
- Son, S.; Arai, M.; Miyata, J.; Toriumi, K.; Mizuta, H.; Hayashi, T.; Aso, T.; Itokawa, M.; Murai, T. Enhanced carbonyl stress and disrupted white matter integrity in schizophrenia. Schizophr. Res. 2020, 223, 242–248. [Google Scholar] [CrossRef] [PubMed]
- Bauer, M.E.; Teixeira, A.L. Inflammation in psychiatric disorders: What comes first? Ann. N. Y. Acad. Sci. 2019, 1437, 57–67. [Google Scholar] [CrossRef] [PubMed]
- Kay, S.R.; Fiszbein, A.; Opler, L.A. The positive and negative syndrome scale (PANSS) for schizophrenia. Schizophr. Bull. 1987, 13, 261–276. [Google Scholar] [CrossRef] [PubMed]
- Szczeklik, K.; Krzysciak, W.; Domagala-Rodacka, R.; Mach, P.; Darczuk, D.; Cibor, D.; Pytko-Polonczyk, J.; Rodacki, T.; Owczarek, D. Alterations in glutathione peroxidase and superoxide dismutase activities in plasma and saliva in relation to disease activity in patients with Crohn’s disease. J. Physiol. Pharmacol. 2016, 67, 709–715. [Google Scholar]
- Albayrak, Y.; Ünsal, C.; Beyazyüz, M.; Ünal, A.; Kuloğlu, M. Reduced total antioxidant level and increased oxidative stress in patients with deficit schizophrenia: A preliminary study. Prog. Neuropsychopharmacol. Biol. Psychiatry 2013, 45, 144–149. [Google Scholar] [CrossRef]
- Sarandol, A.; Sarandol, E.; Acikgoz, H.E.; Eker, S.S.; Akkaya, C.; Dirican, M. First-episode psychosis is associated with oxidative stress: Effects of short-term antipsychotic treatment. Psychiatry Clin. Neurosci. 2015, 69, 699–707. [Google Scholar] [CrossRef]
- Yao, J.K.; Keshavan, M.S. Antioxidants, redox signaling, and pathophysiology in schizophrenia: An integrative view. Antioxid. Redox Signal. 2011, 15, 2011–2035. [Google Scholar] [CrossRef] [PubMed]
- Benzie, I.F.; Strain, J.J. The ferric reducing ability of plasma (FRAP) as a measure of “antioxidant power”: The FRAP assay. Anal. Biochem. 1996, 239, 70–76. [Google Scholar] [CrossRef] [Green Version]
- Güneş, M.; Camkurt, M.A.; Bulut, M.; Demir, S.; İbiloğlu, A.O.; Kaya, M.C.; Atlı, A.; Kaplan, İ.; Sir, A. Evaluation of Paraoxonase, Arylesterase and Malondialdehyde Levels in Schizophrenia Patients Taking Typical, Atypical and Combined Antipsychotic Treatment. Clin. Psychopharmacol. Neurosci. 2016, 14, 345–350. [Google Scholar] [CrossRef] [PubMed] [Green Version]
- Moreira, E.G.; Boll, K.M.; Correia, D.G.; Soares, J.F.; Rigobello, C.; Maes, M. Why Should Psychiatrists and Neuroscientists Worry about Paraoxonase 1? Curr. Neuropharmacol. 2019, 17, 1004–1020. [Google Scholar] [CrossRef]
- Eckerson, H.W.; Wyte, C.M.; La Du, B.N. The human serum paraoxonase/arylesterase polymorphism. Am. J. Hum. Genet. 1983, 35, 1126–1138. [Google Scholar] [PubMed]
- Bai, Z.-L.; Li, X.-S.; Chen, G.-Y.; Du, Y.; Wei, Z.-X.; Chen, X.; Zheng, G.-E.; Deng, W.; Cheng, Y. Serum Oxidative Stress Marker Levels in Unmedicated and Medicated Patients with Schizophrenia. J. Mol. Neurosci. 2018, 66, 428–436. [Google Scholar] [CrossRef] [PubMed]
- Guidara, W.; Messedi, M.; Naifar, M.; Maalej, M.; Grayaa, S.; Omri, S.; Ben Thabet, J.; Maalej, M.; Charfi, N.; Ayadi, F. Predictive value of oxidative stress biomarkers in drug-free patients with schizophrenia and schizo-affective disorder. Psychiatry Res. 2020, 293, 113467. [Google Scholar] [CrossRef] [PubMed]
- Aust, S. Thiobarbituric acid assay reactants. In Methods in Toxicology. In Vitro Toxicity Indicators; Tyson, C., Frazier, J., Eds.; Academic Press: San Diego, CA, USA, 1994; pp. 367–376. [Google Scholar]
- Reilly, C.; Aust, S. Measurement of malondialdehyde. In Current Methods in Toxicology. Assessment of Cell Toxicity; John Wiley & Sons: Hoboken, NJ, USA, 2005. [Google Scholar]
- Gutteridge, J.M. Aspects to consider when detecting and measuring lipid peroxidation. Free Radic. Res. Commun. 1986, 1, 173–184. [Google Scholar] [CrossRef] [PubMed]
- Pedraz-Petrozzi, B.; Elyamany, O.; Rummel, C.; Mulert, C. Effects of inflammation on the kynurenine pathway in schizophrenia—A systematic review. J. Neuroinflamm. 2020, 17, 56. [Google Scholar] [CrossRef] [PubMed]
- Roomruangwong, C.; Noto, C.; Kanchanatawan, B.; Anderson, G.; Kubera, M.; Carvalho, A.F.; Maes, M. The Role of Aberrations in the Immune-Inflammatory Response System (IRS) and the Compensatory Immune-Regulatory Reflex System (CIRS) in Different Phenotypes of Schizophrenia: The IRS-CIRS Theory of Schizophrenia. Mol. Neurobiol. 2020, 57, 778–797. [Google Scholar] [CrossRef] [PubMed]
- Severance, E.G.; Dickerson, F.B.; Yolken, R.H. Autoimmune phenotypes in schizophrenia reveal novel treatment targets. Pharmacol. Ther. 2018, 189, 184–198. [Google Scholar] [CrossRef]
- García-Bueno, B.; Pérez-Nievas, B.G.; Leza, J.C. Is there a role for the nuclear receptor PPARγ in neuropsychiatric diseases? Int. J. Neuropsychopharmacol. 2010, 13, 1411–1429. [Google Scholar] [CrossRef] [Green Version]
- Mackness, M.I.; Mackness, B.; Durrington, P.N. Paraoxonase and coronary heart disease. Atheroscler. Suppl. 2002, 3, 49–55. [Google Scholar] [CrossRef]
- Bryll, A.; Krzyściak, W.; Jurczak, A.; Chrzan, R.; Lizoń, A.; Urbanik, A. Changes in the Selected Antioxidant Defense Parameters in the Blood of Patients after High Resolution Computed Tomography. Int. J. Environ. Res. Public Health 2019, 16, 1476. [Google Scholar] [CrossRef] [Green Version]
- Frijhoff, J.; Winyard, P.G.; Zarkovic, N.; Davies, S.S.; Stocker, R.; Cheng, D.; Knight, A.R.; Taylor, E.L.; Oettrich, J.; Ruskovska, T.; et al. Clinical Relevance of Biomarkers of Oxidative Stress. Antioxid. Redox Signal. 2015, 23, 1144–1170. [Google Scholar] [CrossRef] [Green Version]
- Rossetti, A.C.; Paladini, M.S.; Riva, M.A.; Molteni, R. Oxidation-reduction mechanisms in psychiatric disorders: A novel target for pharmacological intervention. Pharmacol. Ther. 2020, 210, 107520. [Google Scholar] [CrossRef] [PubMed]
- Beckmann, H. Classification of Endogenous Psychoses and Their Differentiated Etiology, 2nd ed.; Leonhard, K., Ed.; Springer: New York, NY, USA, 1999. [Google Scholar]
- Egerton, A.; Murphy, A.; Donocik, J.; Anton, A.; Barker, G.J.; Collier, T.; Deakin, B.; Drake, R.; Eliasson, E.; Emsley, R.; et al. Dopamine and Glutamate in Antipsychotic-Responsive Compared with Antipsychotic-Nonresponsive Psychosis: A Multicenter Positron Emission Tomography and Magnetic Resonance Spectroscopy Study (STRATA). Schizophr. Bull. 2021, 47, 505–516. [Google Scholar] [CrossRef] [PubMed]
- Veldman, E.R.; Svedberg, M.M.; Svenningsson, P.; Lundberg, J. Distribution and levels of 5-HT(1B) receptors in anterior cingulate cortex of patients with bipolar disorder, major depressive disorder and schizophrenia—An autoradiography study. Eur. Neuropsychopharmacol. 2017, 27, 504–514. [Google Scholar] [CrossRef] [PubMed]
- Umino, M.; Umino, A.; Nishikawa, T. Effects of selective calcium-permeable AMPA receptor blockade by IEM 1460 on psychotomimetic-induced hyperactivity in the mouse. J. Neural Transm. 2018, 125, 705–711. [Google Scholar] [CrossRef] [PubMed]
- Cumming, P.; Abi-Dargham, A.; Gründer, G. Molecular imaging of schizophrenia: Neurochemical findings in a heterogeneous and evolving disorder. Behav. Brain Res. 2021, 398, 113004. [Google Scholar] [CrossRef]
- Shin, E.-J.; Dang, D.-K.; Tran, T.-V.; Tran, H.-Q.; Jeong, J.H.; Nah, S.-Y.; Jang, C.-G.; Yamada, K.; Nabeshima, T.; Kim, H.-C. Current understanding of methamphetamine-associated dopaminergic neurodegeneration and psychotoxic behaviors. Arch. Pharm. Res. 2017, 40, 403–428. [Google Scholar] [CrossRef]
- Théberge, J.; Bartha, R.; Drost, D.J.; Menon, R.S.; Malla, A.; Takhar, J.; Neufeld, R.W.; Rogers, J.; Pavlosky, W.; Schaefer, B.; et al. Glutamate and glutamine measured with 4.0 T proton MRS in never-treated patients with schizophrenia and healthy volunteers. Am. J. Psychiatry 2002, 159, 1944–1946. [Google Scholar] [CrossRef]
- Théberge, J.; Al-Semaan, Y.; Williamson, P.C.; Menon, R.S.; Neufeld, R.W.J.; Rajakumar, N.; Schaefer, B.; Densmore, M.; Drost, D.J. Glutamate and glutamine in the anterior cingulate and thalamus of medicated patients with chronic schizophrenia and healthy comparison subjects measured with 4.0-T proton MRS. Am. J. Psychiatry 2003, 160, 2231–2233. [Google Scholar] [CrossRef] [Green Version]
- Phensy, A.; Driskill, C.; Lindquist, K.; Guo, L.; Jeevakumar, V.; Fowler, B.; Du, H.; Kroener, S. Antioxidant Treatment in Male Mice Prevents Mitochondrial and Synaptic Changes in an NMDA Receptor Dysfunction Model of Schizophrenia. eNeuro 2017, 4. [Google Scholar] [CrossRef] [Green Version]
- Blanco-Ayala, T.; Sathyasaikumar, K.V.; Uys, J.D.; Pérez-de-la-Cruz, V.; Pidugu, L.S.; Schwarcz, R. N-Acetylcysteine Inhibits Kynurenine Aminotransferase II. Neuroscience 2020, 444, 160–169. [Google Scholar] [CrossRef]
- Phensy, A.; Duzdabanian, H.E.; Brewer, S.; Panjabi, A.; Driskill, C.; Berz, A.; Peng, G.; Kroener, S. Antioxidant Treatment with N-acetyl Cysteine Prevents the Development of Cognitive and Social Behavioral Deficits that Result from Perinatal Ketamine Treatment. Front. Behav. Neurosci. 2017, 11, 106. [Google Scholar] [CrossRef] [Green Version]
- Nakao, K.; Jeevakumar, V.; Jiang, S.Z.; Fujita, Y.; Diaz, N.B.; Pretell Annan, C.A.; Eskow Jaunarajs, K.L.; Hashimoto, K.; Belforte, J.E.; Nakazawa, K. Schizophrenia-Like Dopamine Release Abnormalities in a Mouse Model of NMDA Receptor Hypofunction. Schizophr. Bull. 2019, 45, 138–147. [Google Scholar] [CrossRef] [Green Version]
- Kim, Y.; Vadodaria, K.C.; Lenkei, Z.; Kato, T.; Gage, F.H.; Marchetto, M.C.; Santos, R. Mitochondria, Metabolism, and Redox Mechanisms in Psychiatric Disorders. Antioxid. Redox Signal. 2019, 31, 275–317. [Google Scholar] [CrossRef]
- Morris, G.; Walder, K.R.; Berk, M.; Marx, W.; Walker, A.J.; Maes, M.; Puri, B.K. The interplay between oxidative stress and bioenergetic failure in neuropsychiatric illnesses: Can we explain it and can we treat it? Mol. Biol. Rep. 2020, 47, 5587–5620. [Google Scholar] [CrossRef]
- Demjaha, A.; Egerton, A.; Murray, R.M.; Kapur, S.; Howes, O.D.; Stone, J.M.; McGuire, P.K. Antipsychotic treatment resistance in schizophrenia associated with elevated glutamate levels but normal dopamine function. Biol. Psychiatry 2014, 75, e11–e13. [Google Scholar] [CrossRef] [PubMed]
- Mouchlianitis, E.; Bloomfield, M.A.P.; Law, V.; Beck, K.; Selvaraj, S.; Rasquinha, N.; Waldman, A.; Turkheimer, F.E.; Egerton, A.; Stone, J.; et al. Treatment-Resistant Schizophrenia Patients Show Elevated Anterior Cingulate Cortex Glutamate Compared to Treatment-Responsive. Schizophr. Bull. 2016, 42, 744–752. [Google Scholar] [CrossRef] [PubMed]
- Iwata, Y.; Nakajima, S.; Plitman, E.; Caravaggio, F.; Kim, J.; Shah, P.; Mar, W.; Chavez, S.; De Luca, V.; Mimura, M.; et al. Glutamatergic Neurometabolite Levels in Patients With Ultra-Treatment-Resistant Schizophrenia: A Cross-Sectional 3T Proton Magnetic Resonance Spectroscopy Study. Biol. Psychiatry 2019, 85, 596–605. [Google Scholar] [CrossRef] [PubMed]
- Dempster, K.; Jeon, P.; MacKinley, M.; Williamson, P.; Théberge, J.; Palaniyappan, L. Early treatment response in first episode psychosis: A 7-T magnetic resonance spectroscopic study of glutathione and glutamate. Mol. Psychiatry 2020, 25, 1640–1650. [Google Scholar] [CrossRef] [PubMed] [Green Version]
- Chen, T.; Wang, Y.; Zhang, J.; Wang, Z.; Xu, J.; Li, Y.; Yang, Z.; Liu, D. Abnormal Concentration of GABA and Glutamate in The Prefrontal Cortex in Schizophrenia.-An in Vivo 1H-MRS Study. Shanghai Arch. Psychiatry 2017, 29, 277–286. [Google Scholar] [PubMed]
- Romeo, B.; Petillion, A.; Martelli, C.; Benyamina, A. Magnetic resonance spectroscopy studies in subjects with high risk for psychosis: A meta-analysis and review. J. Psychiatr. Res. 2020, 125, 52–65. [Google Scholar] [CrossRef] [PubMed]
- Lutkenhoff, E.S.; van Erp, T.G.; Thomas, M.A.; Therman, S.; Manninen, M.; Huttunen, M.O.; Kaprio, J.; Lönnqvist, J.; O’Neill, J.; Cannon, T.D. Proton MRS in twin pairs discordant for schizophrenia. Mol. Psychiatry 2010, 15, 308–318. [Google Scholar] [CrossRef] [PubMed]
- Özdin, S.; Böke, Ö. Neutrophil/lymphocyte, platelet/lymphocyte and monocyte/lymphocyte ratios in different stages of schizophrenia. Psychiatry Res. 2019, 271, 131–135. [Google Scholar] [CrossRef]
- Yüksel, R.N.; Ertek, I.E.; Dikmen, A.U.; Göka, E. High neutrophil-lymphocyte ratio in schizophrenia independent of infectious and metabolic parameters. Nord. J. Psychiatry 2018, 72, 336–340. [Google Scholar] [CrossRef]
- Simon, L.; Cazard, F. Clozapine rechallenge after neutropenia in resistant schizophrenia: A review. L’encephale 2016, 42, 346–353. [Google Scholar] [CrossRef] [PubMed]
- Pisciotta, A.V.; Konings, S.A.; Ciesemier, L.L.; Cronkite, C.E.; Lieberman, J.A. On the possible mechanisms and predictability of clozapine-induced agranulocytosis. Drug Saf. 1992, 7 (Suppl. 1), 33–44. [Google Scholar] [CrossRef] [PubMed]
- Yang, A.C.; Tsai, S.-J. New Targets for Schizophrenia Treatment beyond the Dopamine Hypothesis. Int. J. Mol. Sci. 2017, 18, 1689. [Google Scholar] [CrossRef] [PubMed]
- Kraguljac, N.V.; Morgan, C.J.; Reid, M.A.; White, D.M.; Jindal, R.D.; Sivaraman, S.; Martinak, B.K.; Lahti, A.C. A longitudinal magnetic resonance spectroscopy study investigating effects of risperidone in the anterior cingulate cortex and hippocampus in schizophrenia. Schizophr. Res. 2019, 210, 239–244. [Google Scholar] [CrossRef] [PubMed]
- Fang, J.; Han, D.; Hong, J.; Tan, Q.; Tian, Y. The chemokine, macrophage inflammatory protein-2γ, reduces the expression of glutamate transporter-1 on astrocytes and increases neuronal sensitivity to glutamate excitotoxicity. J. Neuroinflamm. 2012, 9, 267. [Google Scholar] [CrossRef] [Green Version]
- Stanley, J.A.; Burgess, A.; Khatib, D.; Ramaseshan, K.; Arshad, M.; Wu, H.; Diwadkar, V.A. Functional dynamics of hippocampal glutamate during associative learning assessed with in vivo (1)H functional magnetic resonance spectroscopy. Neuroimage 2017, 153, 189–197. [Google Scholar] [CrossRef] [PubMed]
- Goryawala, M.Z.; Sheriff, S.; Maudsley, A.A. Regional distributions of brain glutamate and glutamine in normal subjects. NMR Biomed. 2016, 29, 1108–1116. [Google Scholar] [CrossRef] [PubMed] [Green Version]
- Dlabac-de Lange, J.J.; Liemburg, E.J.; Bais, L.; van de Poel-Mustafayeva, A.T.; de Lange-de Klerk, E.S.M.; Knegtering, H.; Aleman, A. Effect of Bilateral Prefrontal rTMS on Left Prefrontal NAA and Glx Levels in Schizophrenia Patients with Predominant Negative Symptoms: An Exploratory Study. Brain Stimul. 2017, 10, 59–64. [Google Scholar] [CrossRef]


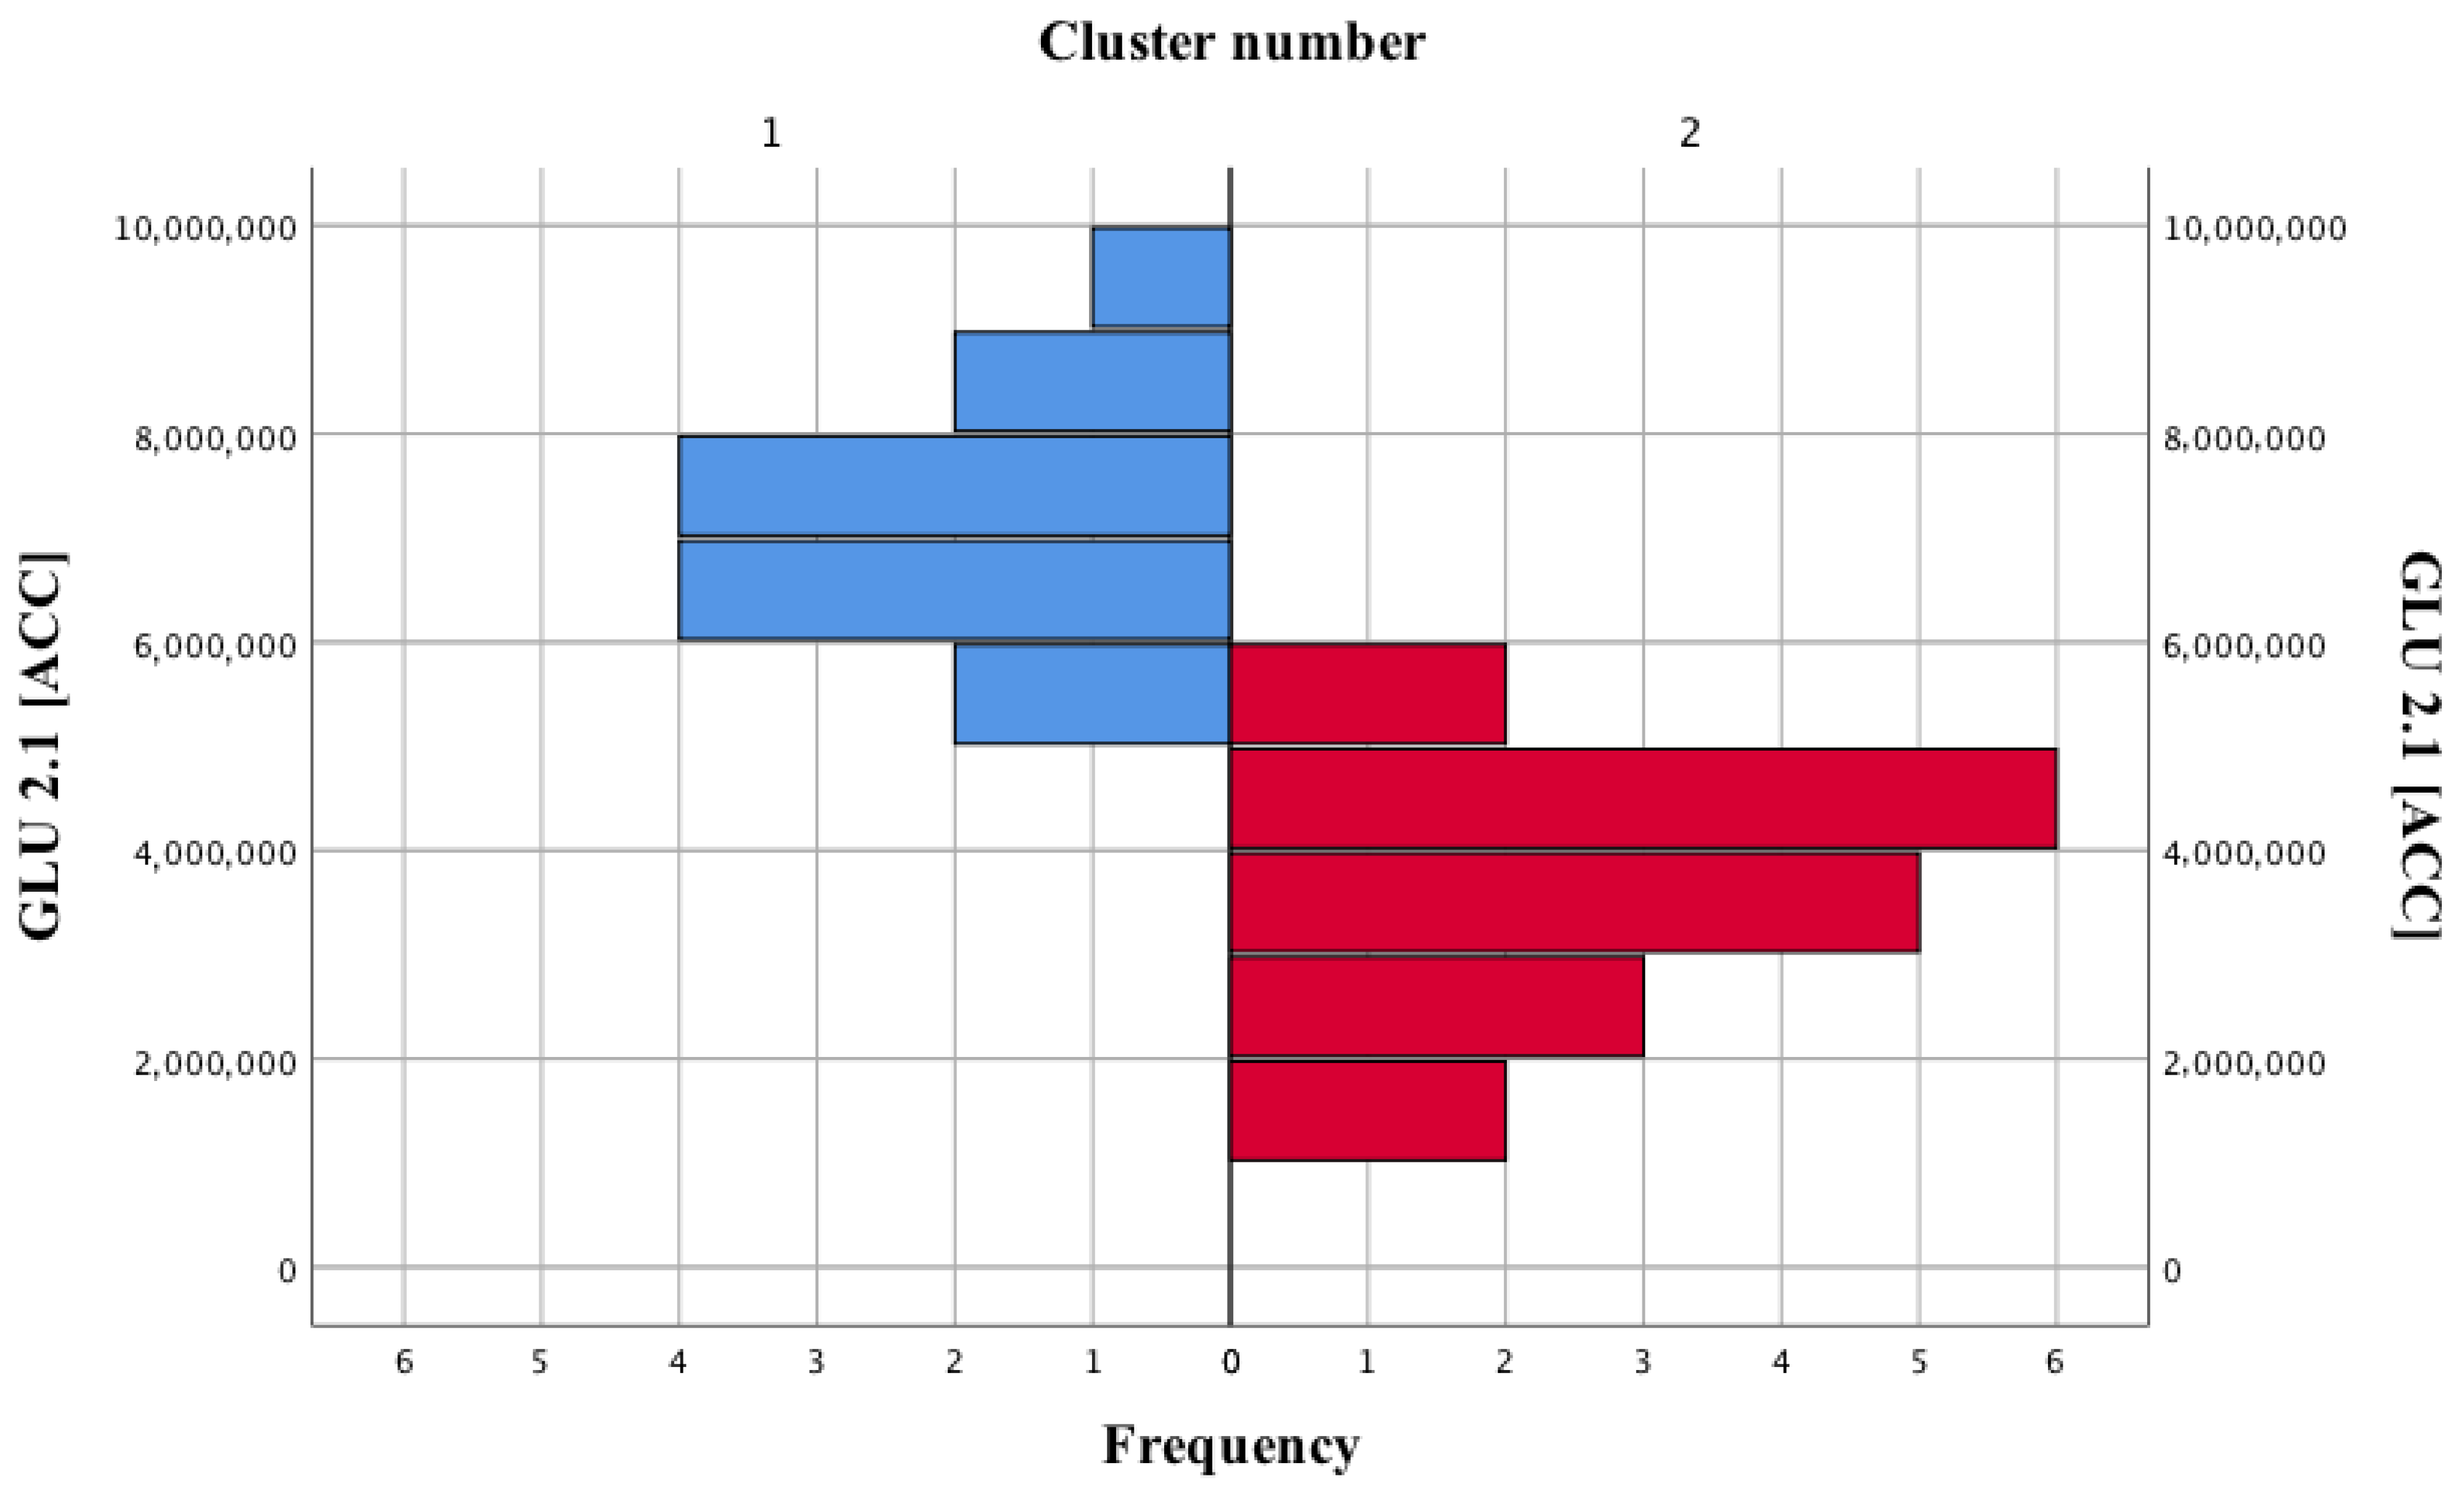
| Cluster Number | GLU 2.1 (ACC) (Mean ± SD) |
|---|---|
| I | 7,132,000 ± 1,167,008.62 |
| II | 3,574,438.89 ± 141,242.09 |
| Statistical result | U = 0; p < 0.001 |
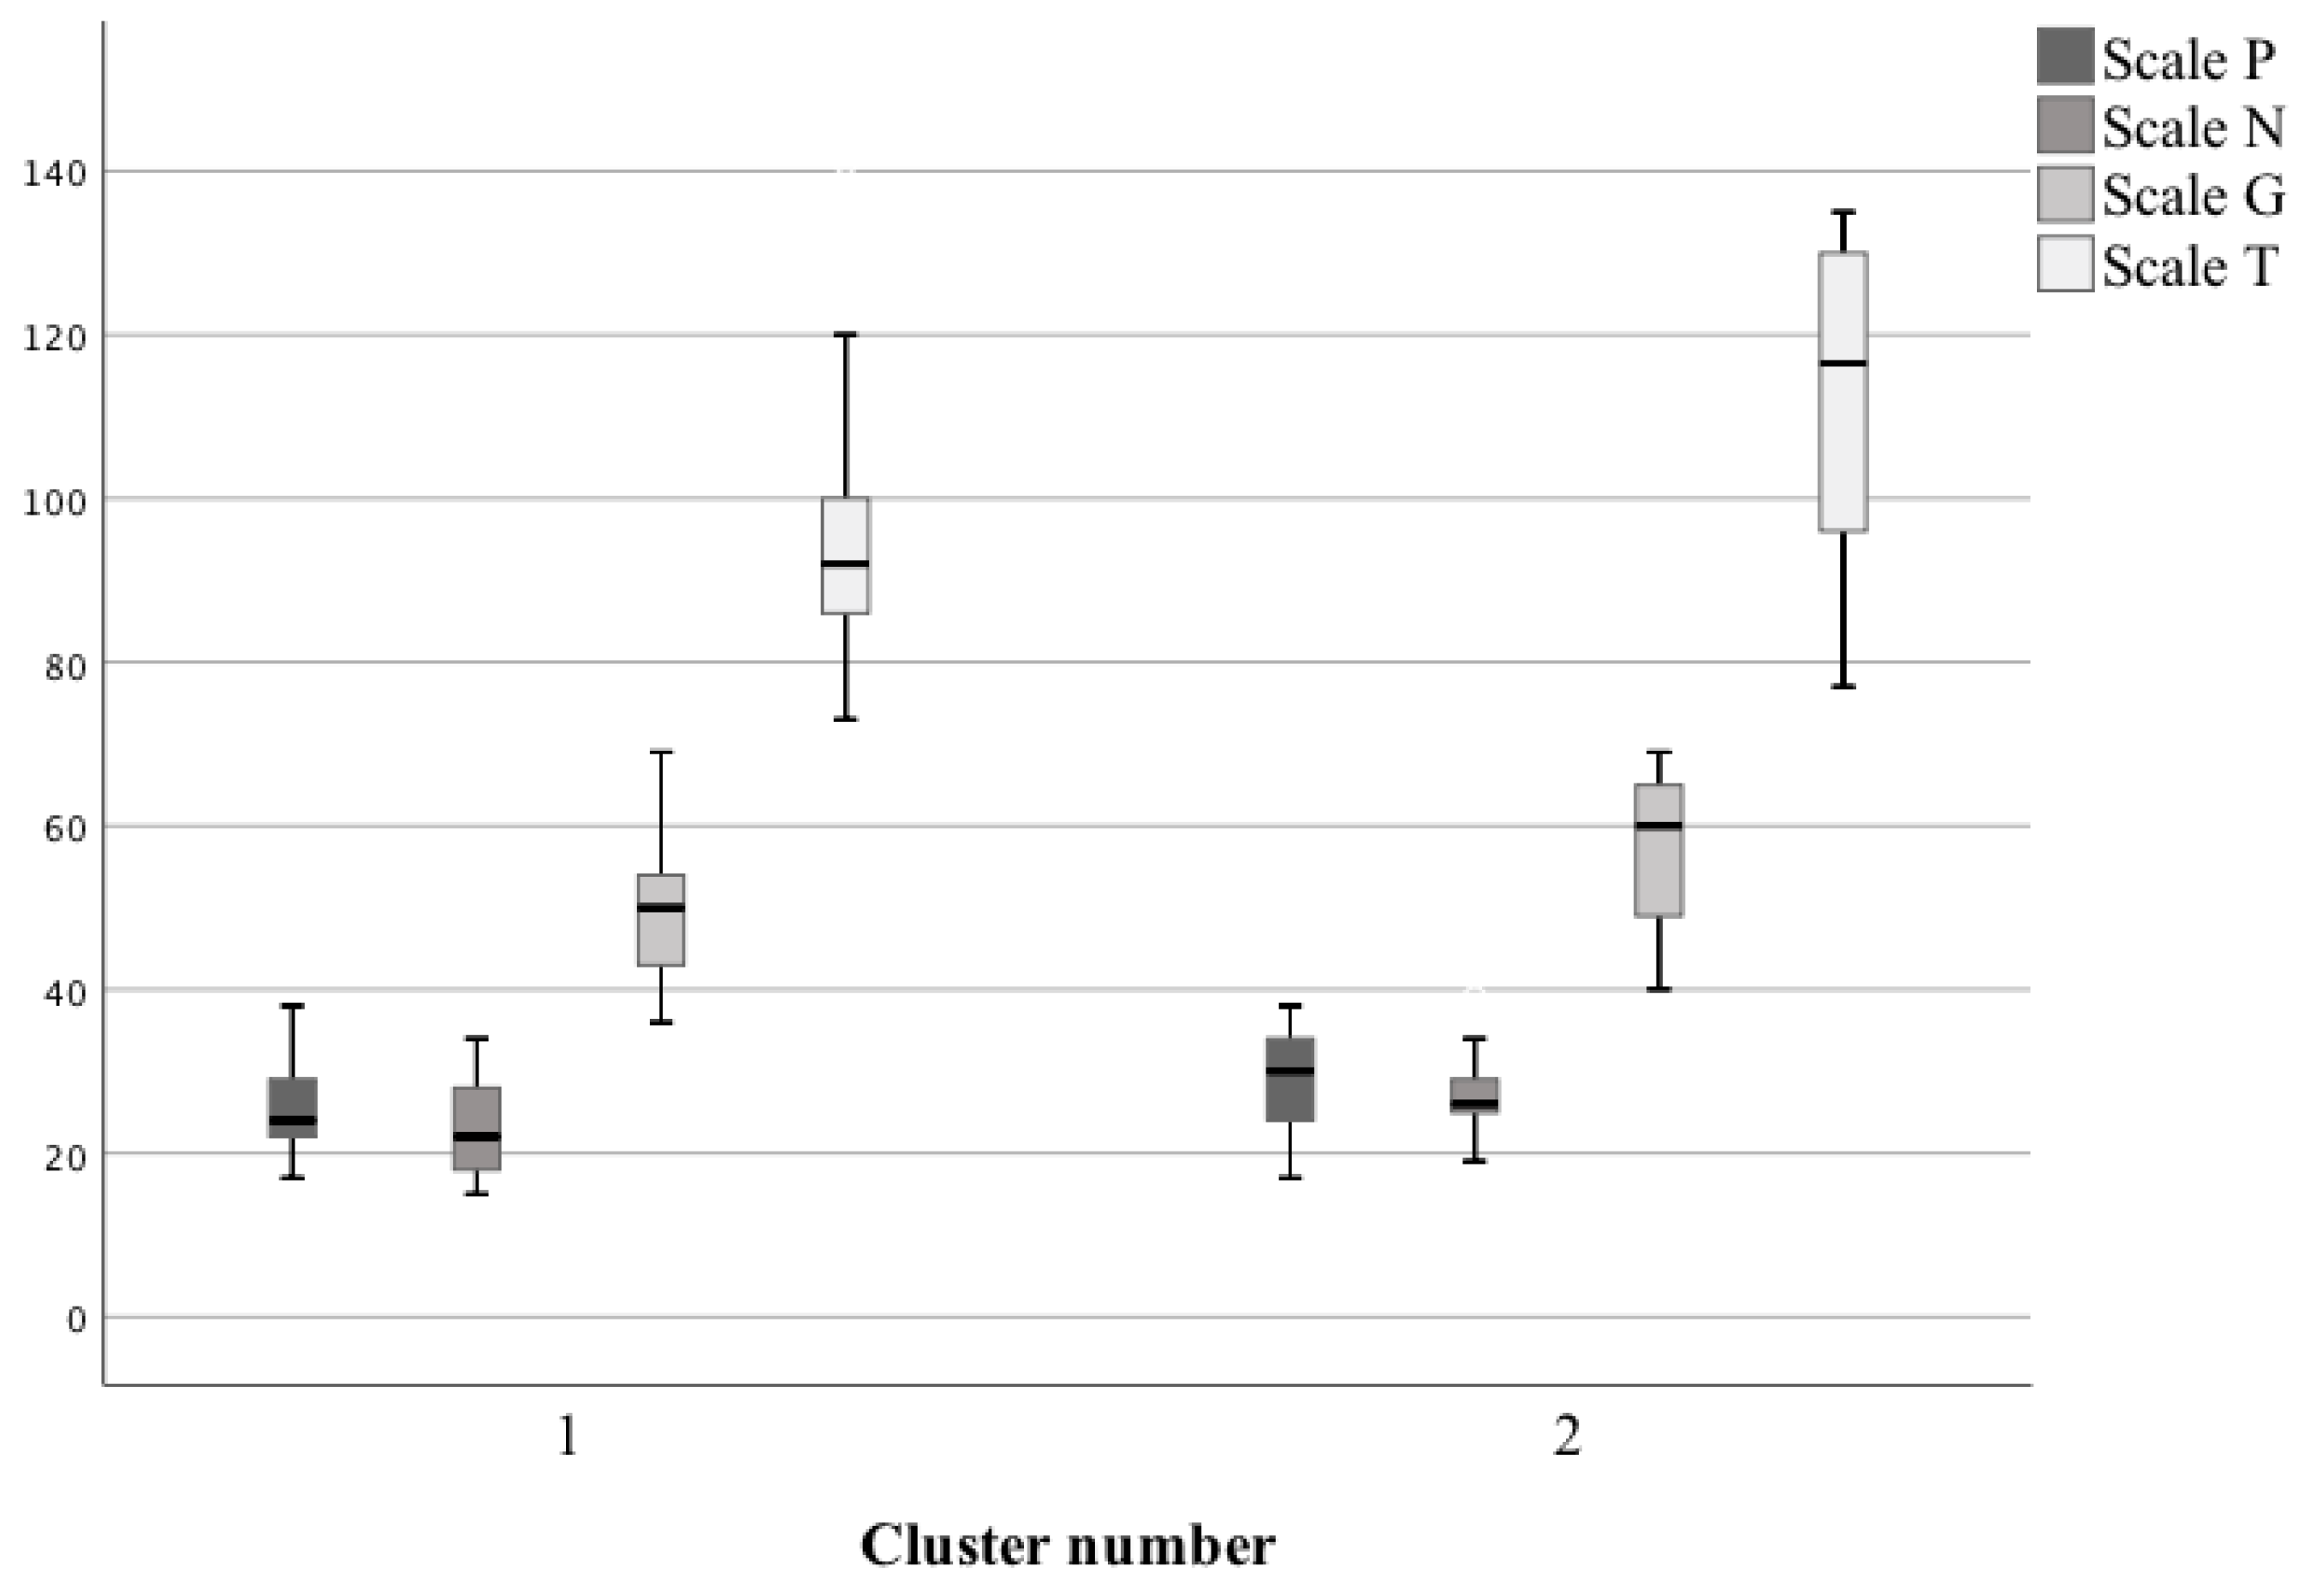
| Cluster Number | P Scale (Mean ± SD) | N Scale (Mean ± SD) | G Scale (Mean ± SD) | T Scale (Mean ± SD) |
|---|---|---|---|---|
| I | 25.85 ± 6.44 | 23.08 ± 6.03 | 50.35 ± 9.22 | 97.77 ± 19.46 |
| II | 28.94 ± 6.22 | 27.44 ± 4.71 | 57.22 ± 8.97 | 112.28 ± 19.15 |
| Statistical result | U = 85.5 p = 0.21 | U = 64 p = 0.03 | U = 69 p = 0.049 | U = 67.5 p = 0.046 |
| Cluster Number | Neutrophils [%] (Mean ± SD) | Lymphocytes [%] (Mean ± SD) |
|---|---|---|
| I | 48.34 ± 7.67 | 38.95 ± 6.66 |
| II | 59.14 ± 8.78 | 29.35 ± 7.39 |
| Statistical result | U = 44.5 p = 0.003 | U = 45 p = 0.003 |
| Variable | P Scale | N Scale | G Scale | T Scale |
|---|---|---|---|---|
| Neutrophils [%] | 0.46 p < 0.001 | 0.47 p < 0.001 | 0.48 p < 0.001 | 0.55 p < 0.001 |
| Lymphocytes [%] | −0.4 p < 0.001 | −0.45 p < 0.001 | −0.46 p < 0.001 | 0.51 p < 0.001 |
| Cluster Number | GLU 2.1 (ACC) (Mean ± SD) | FRAP (Mean ± SD) | MDA (Mean ± SD) | DWI, Frontal Lobes (AVG) | ADC, Right Frontal Lobe (DEV) (Mean ± SD) | PON-1 (Mean ± SD) | |
|---|---|---|---|---|---|---|---|
| Left (Mean ± SD) | Right (Mean ± SD) | ||||||
| I | 7,132,000 ± 1,167,008.62 | 0.36 ± 0.22 | 0.7 ± 0.16 | 333.69 ± 27.53 | 325.13 ± 33.09 | 0.00073 ± 0.0001 | 102.69 ± 3.79 |
| II | 3,574,438.89 ± 141,242.09 | 0.4 ± 0.23 | 0.78 ± 0.14 | 342.07 ± 41.02 | 343.07 ± 37.1 | 0.00069 ± 0.00064 | 101.08 ± 5.35 |
| Statistical result | U = 0 p < 0.001 | U = 105 p = 0.63 | U = 114 p = 0.92 | U = 85 p = 0.21 | U = 99 p = 0.49 | U = 94 p = 0.36 | U = 101 p = 0.52 |
Publisher’s Note: MDPI stays neutral with regard to jurisdictional claims in published maps and institutional affiliations. |
© 2021 by the authors. Licensee MDPI, Basel, Switzerland. This article is an open access article distributed under the terms and conditions of the Creative Commons Attribution (CC BY) license (https://creativecommons.org/licenses/by/4.0/).
Share and Cite
Bryll, A.; Krzyściak, W.; Karcz, P.; Pilecki, M.; Śmierciak, N.; Szwajca, M.; Skalniak, A.; Popiela, T.J. Determinants of Schizophrenia Endophenotypes Based on Neuroimaging and Biochemical Parameters. Biomedicines 2021, 9, 372. https://0-doi-org.brum.beds.ac.uk/10.3390/biomedicines9040372
Bryll A, Krzyściak W, Karcz P, Pilecki M, Śmierciak N, Szwajca M, Skalniak A, Popiela TJ. Determinants of Schizophrenia Endophenotypes Based on Neuroimaging and Biochemical Parameters. Biomedicines. 2021; 9(4):372. https://0-doi-org.brum.beds.ac.uk/10.3390/biomedicines9040372
Chicago/Turabian StyleBryll, Amira, Wirginia Krzyściak, Paulina Karcz, Maciej Pilecki, Natalia Śmierciak, Marta Szwajca, Anna Skalniak, and Tadeusz J. Popiela. 2021. "Determinants of Schizophrenia Endophenotypes Based on Neuroimaging and Biochemical Parameters" Biomedicines 9, no. 4: 372. https://0-doi-org.brum.beds.ac.uk/10.3390/biomedicines9040372