
GBP5 Repression Suppresses the Metastatic Potential and PD-L1 Expression in Triple-Negative Breast Cancer

 ,
,  and
and 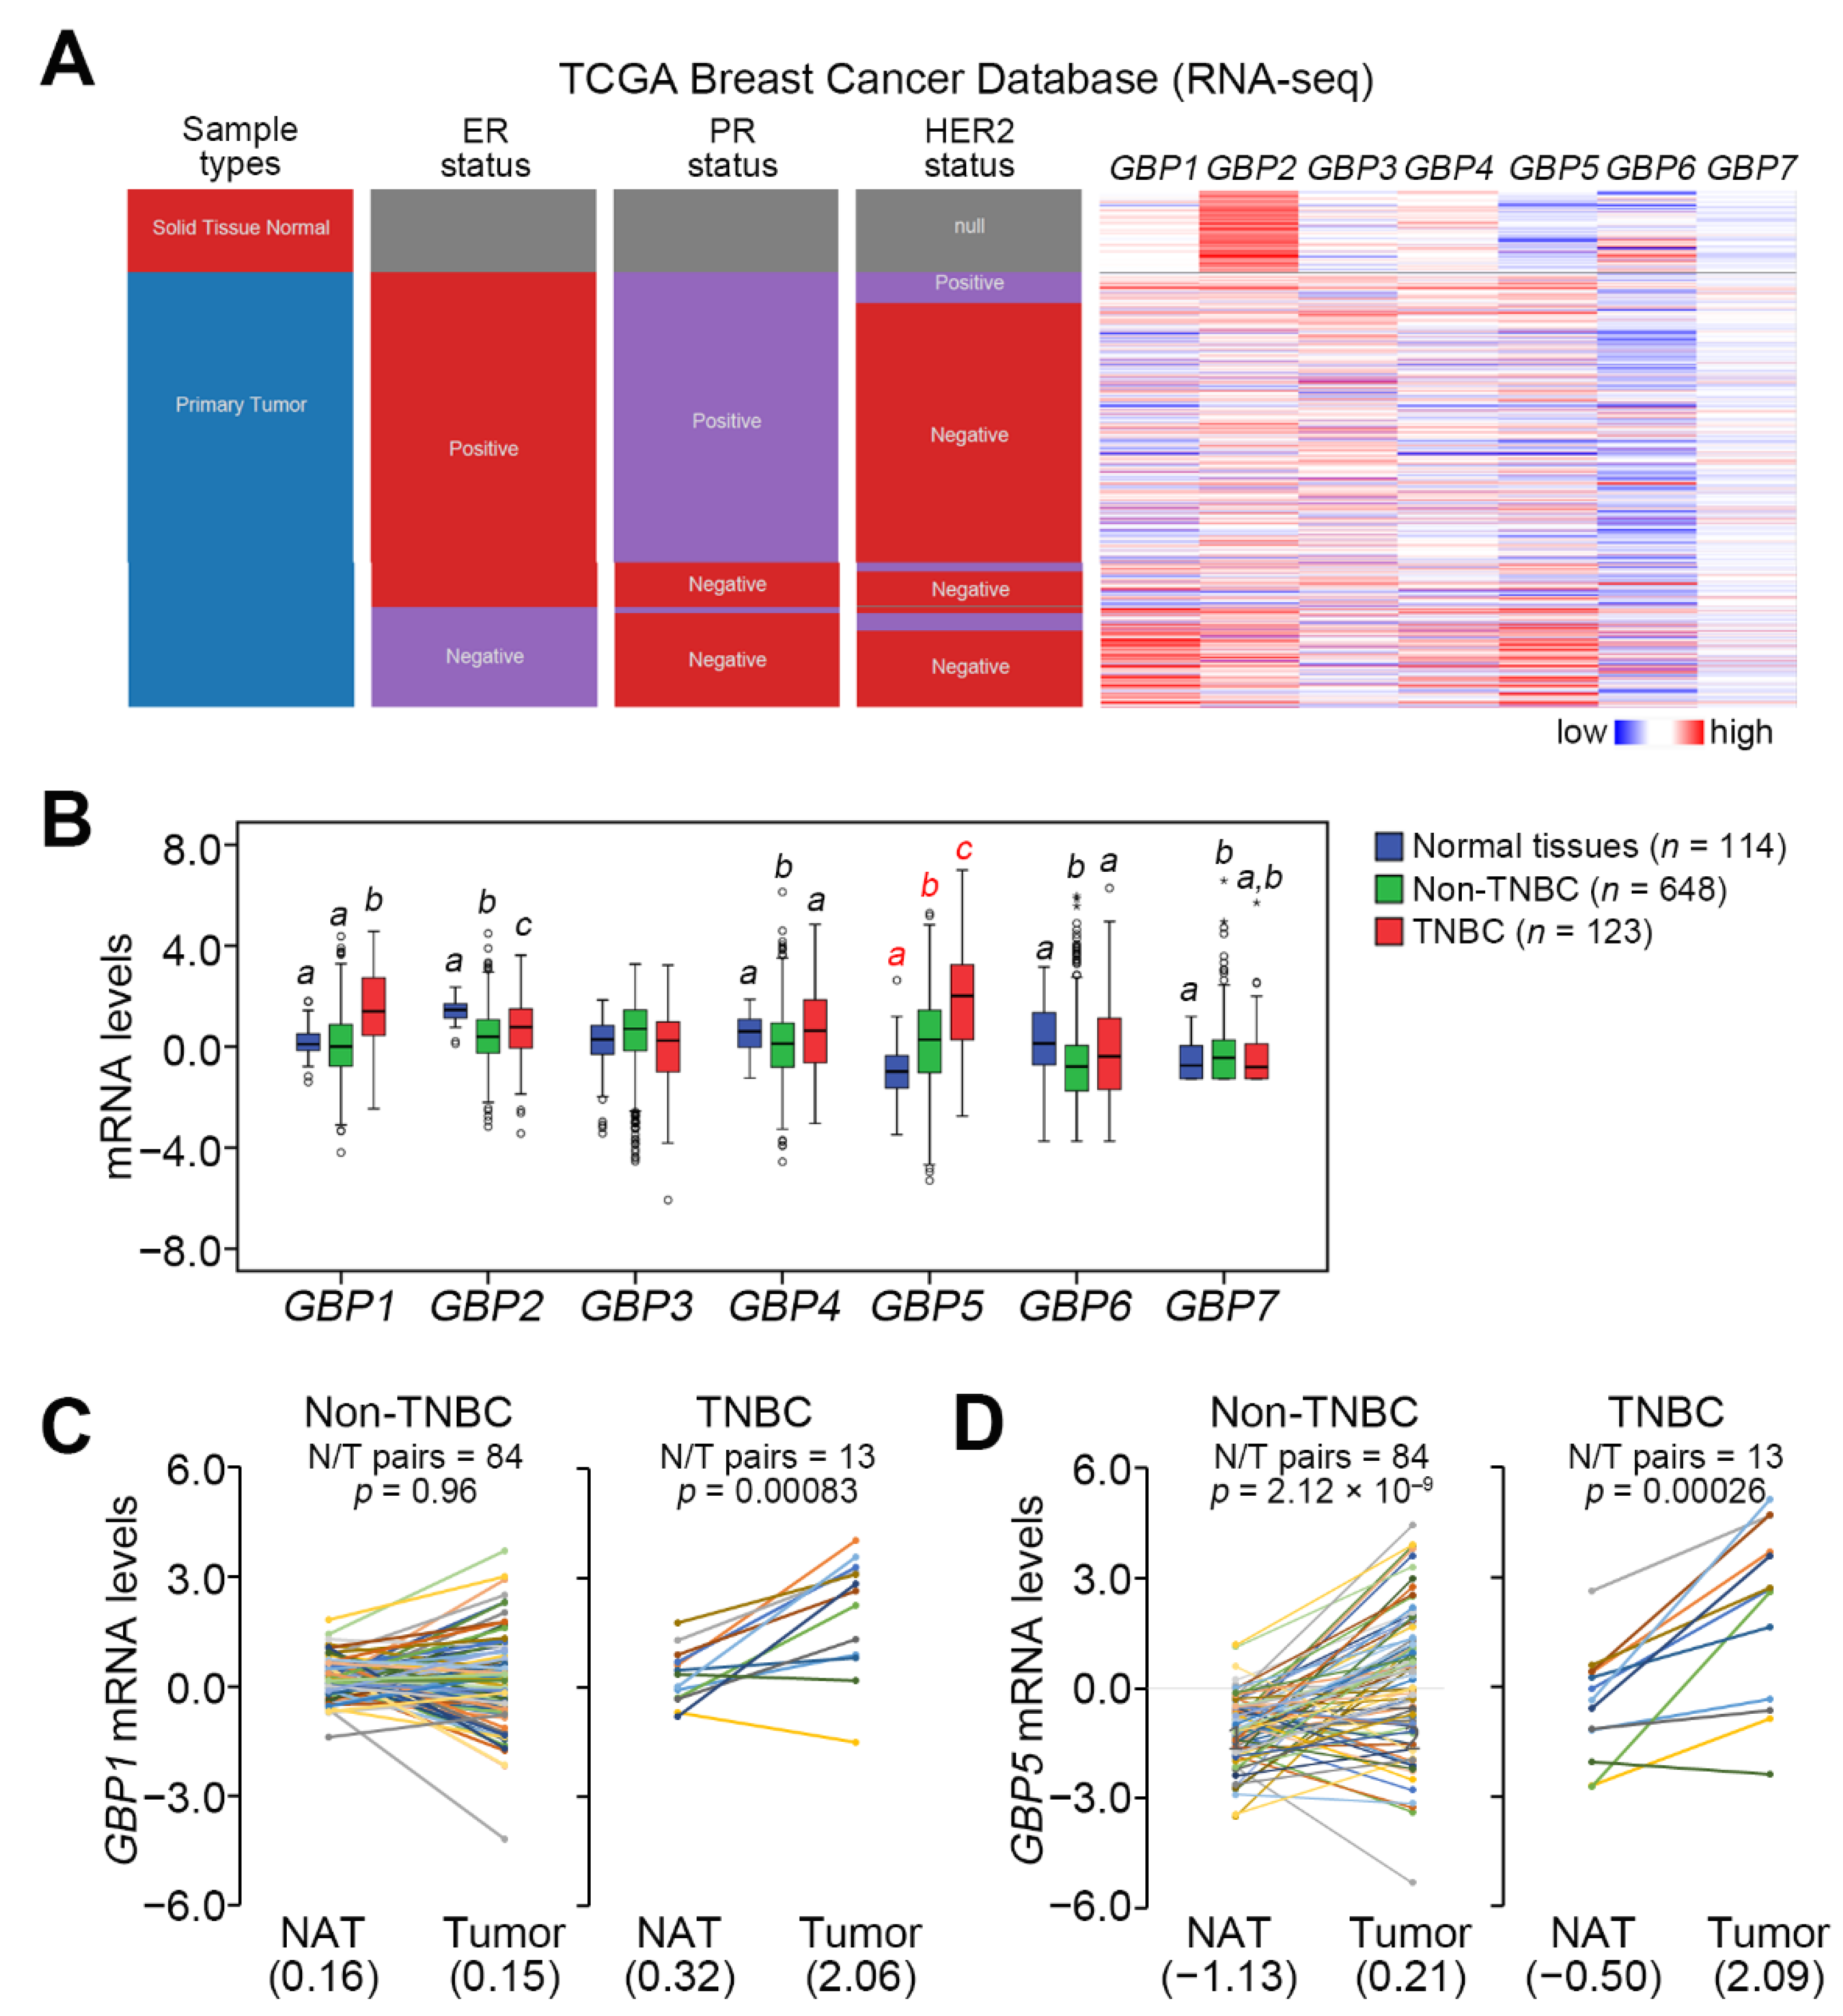
Abstract
:1. Introduction
2. Materials and Methods
2.1. Clinicopathologic Results and Molecular Data for Breast Cancer Samples
2.2. Cell Culture
2.3. Reverse Transcription PCR (RT-PCR) and Westen Blot Analyses
2.4. Cellular Migration Assay
2.5. Gene Knockdown and Reconstitution Experiments
2.6. Luciferase Reporter Assay
2.7. Statistical Analysis
3. Results
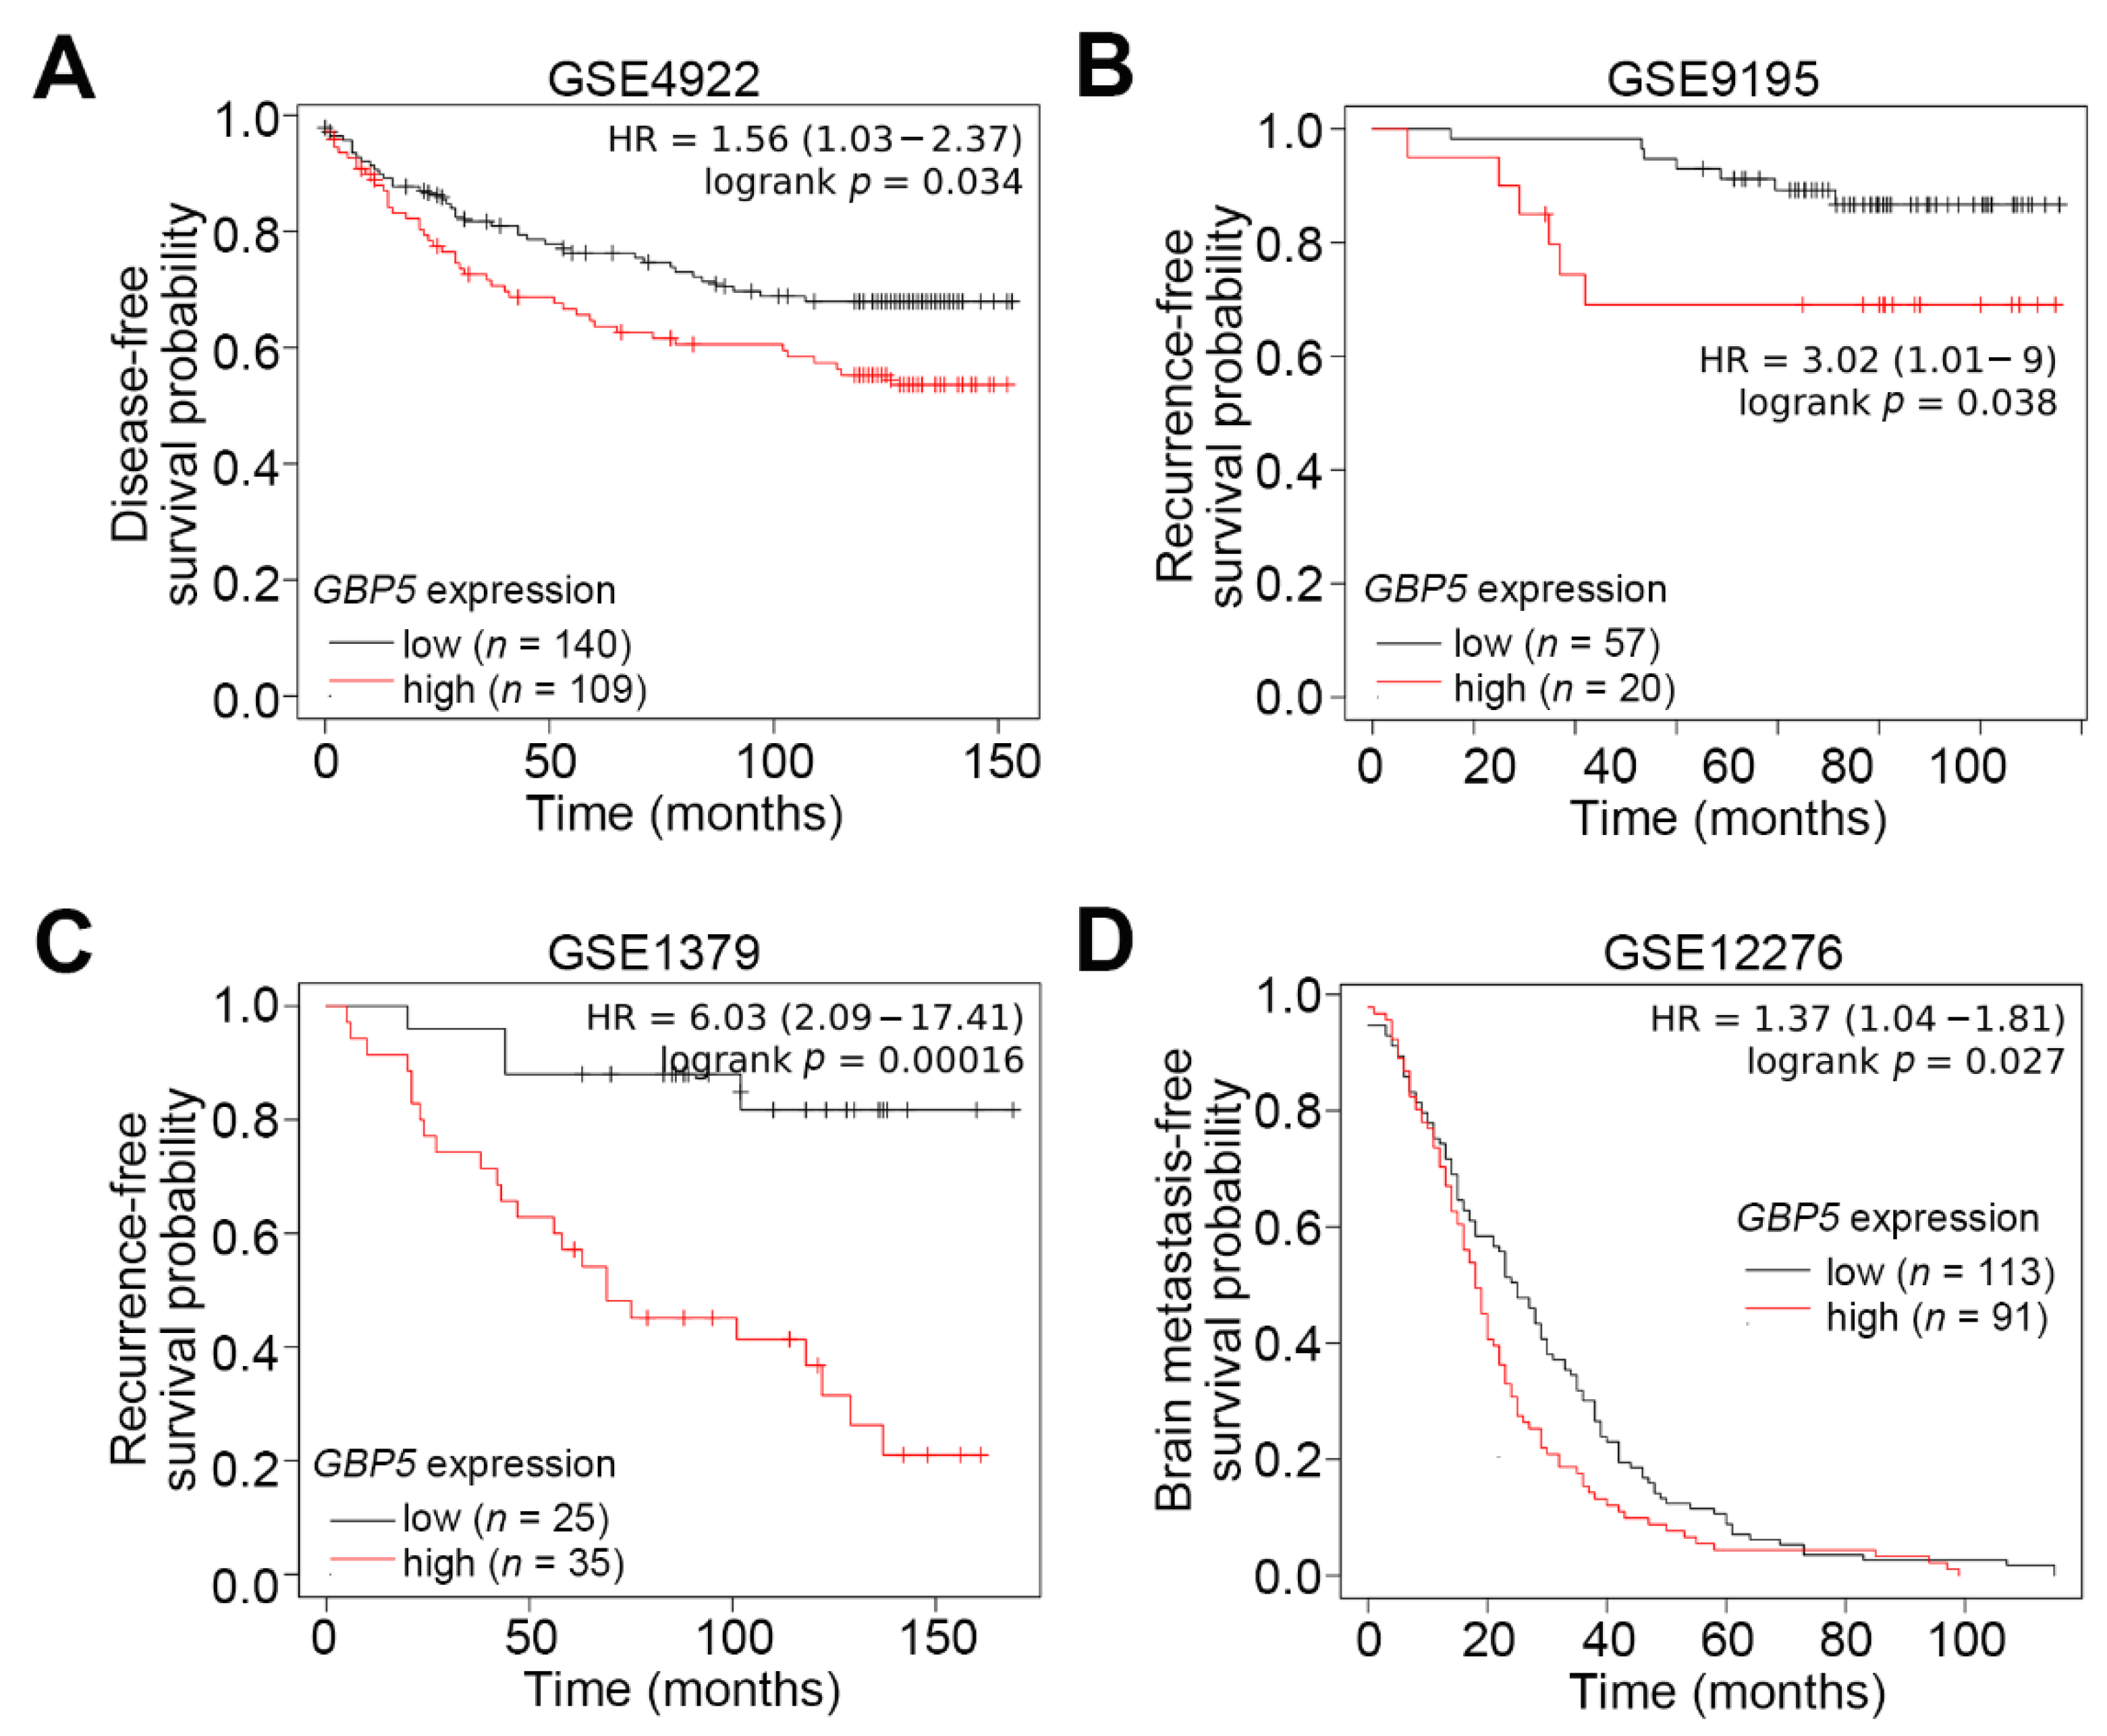
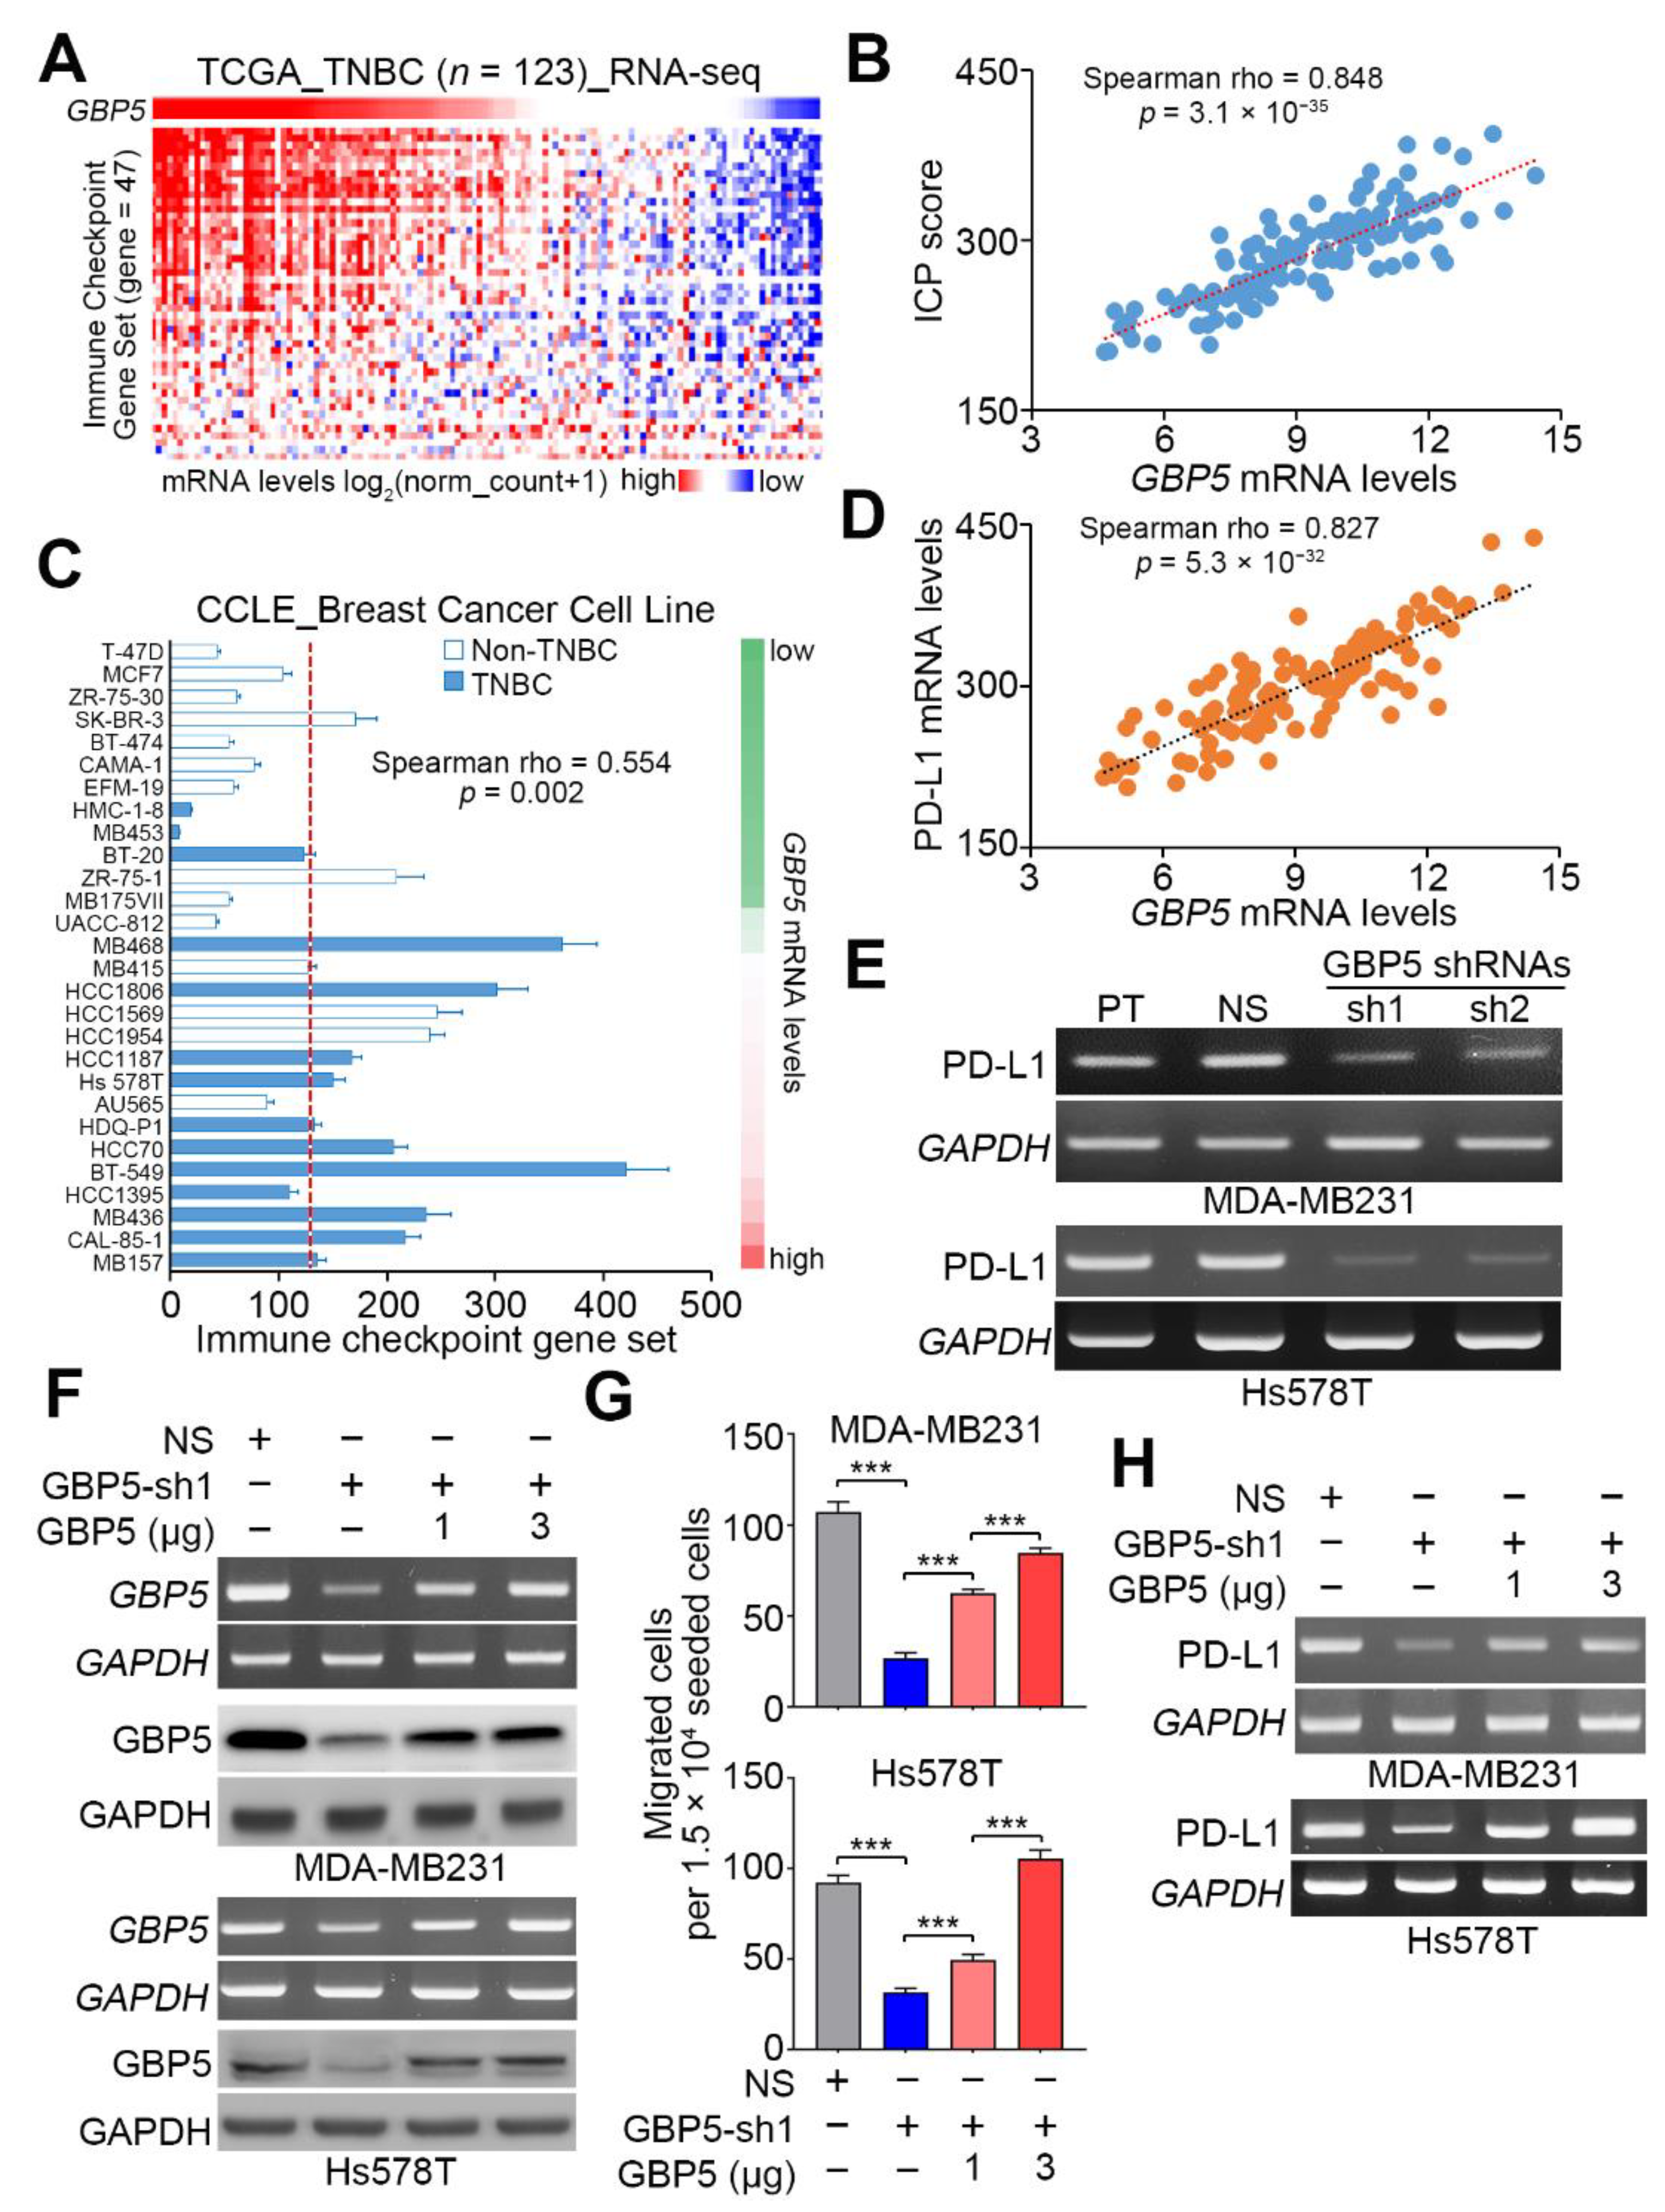
3.1. GBP5 Upregulation Correlates with Triple-Negative Characteristics and Poorer Prognosis in Breast Cancer
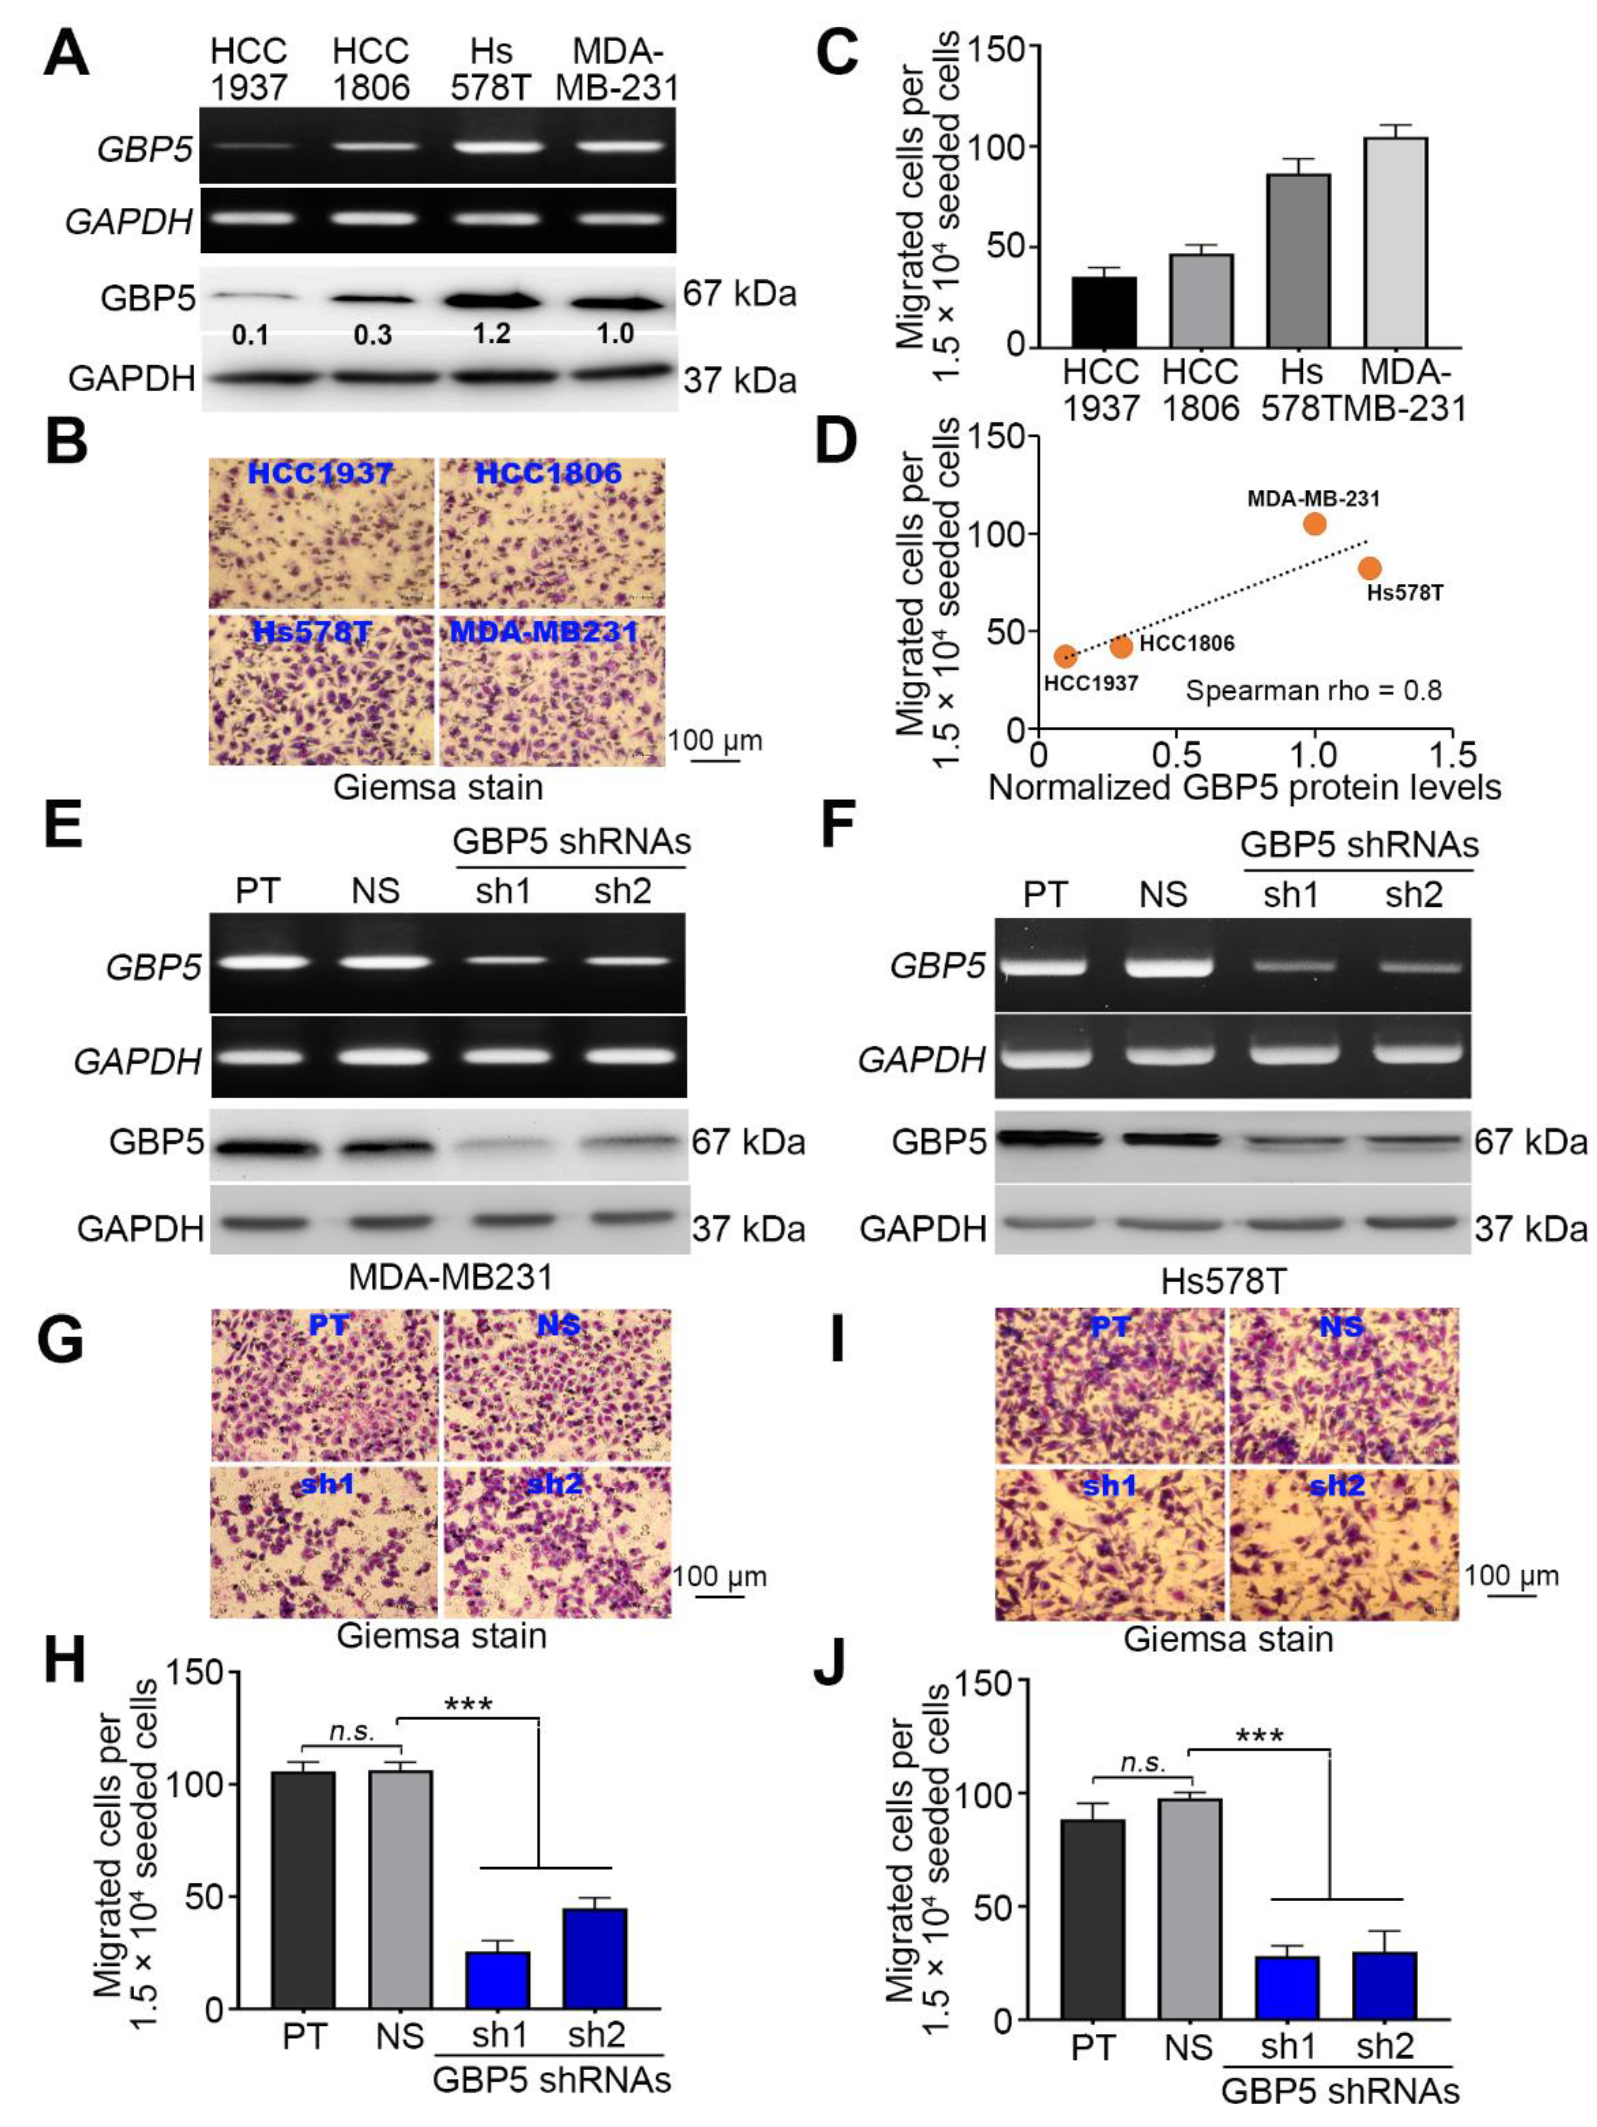
3.2. GBP5 Expression Is Causally Associated with Cellular Migration Ability in TNBC Cells
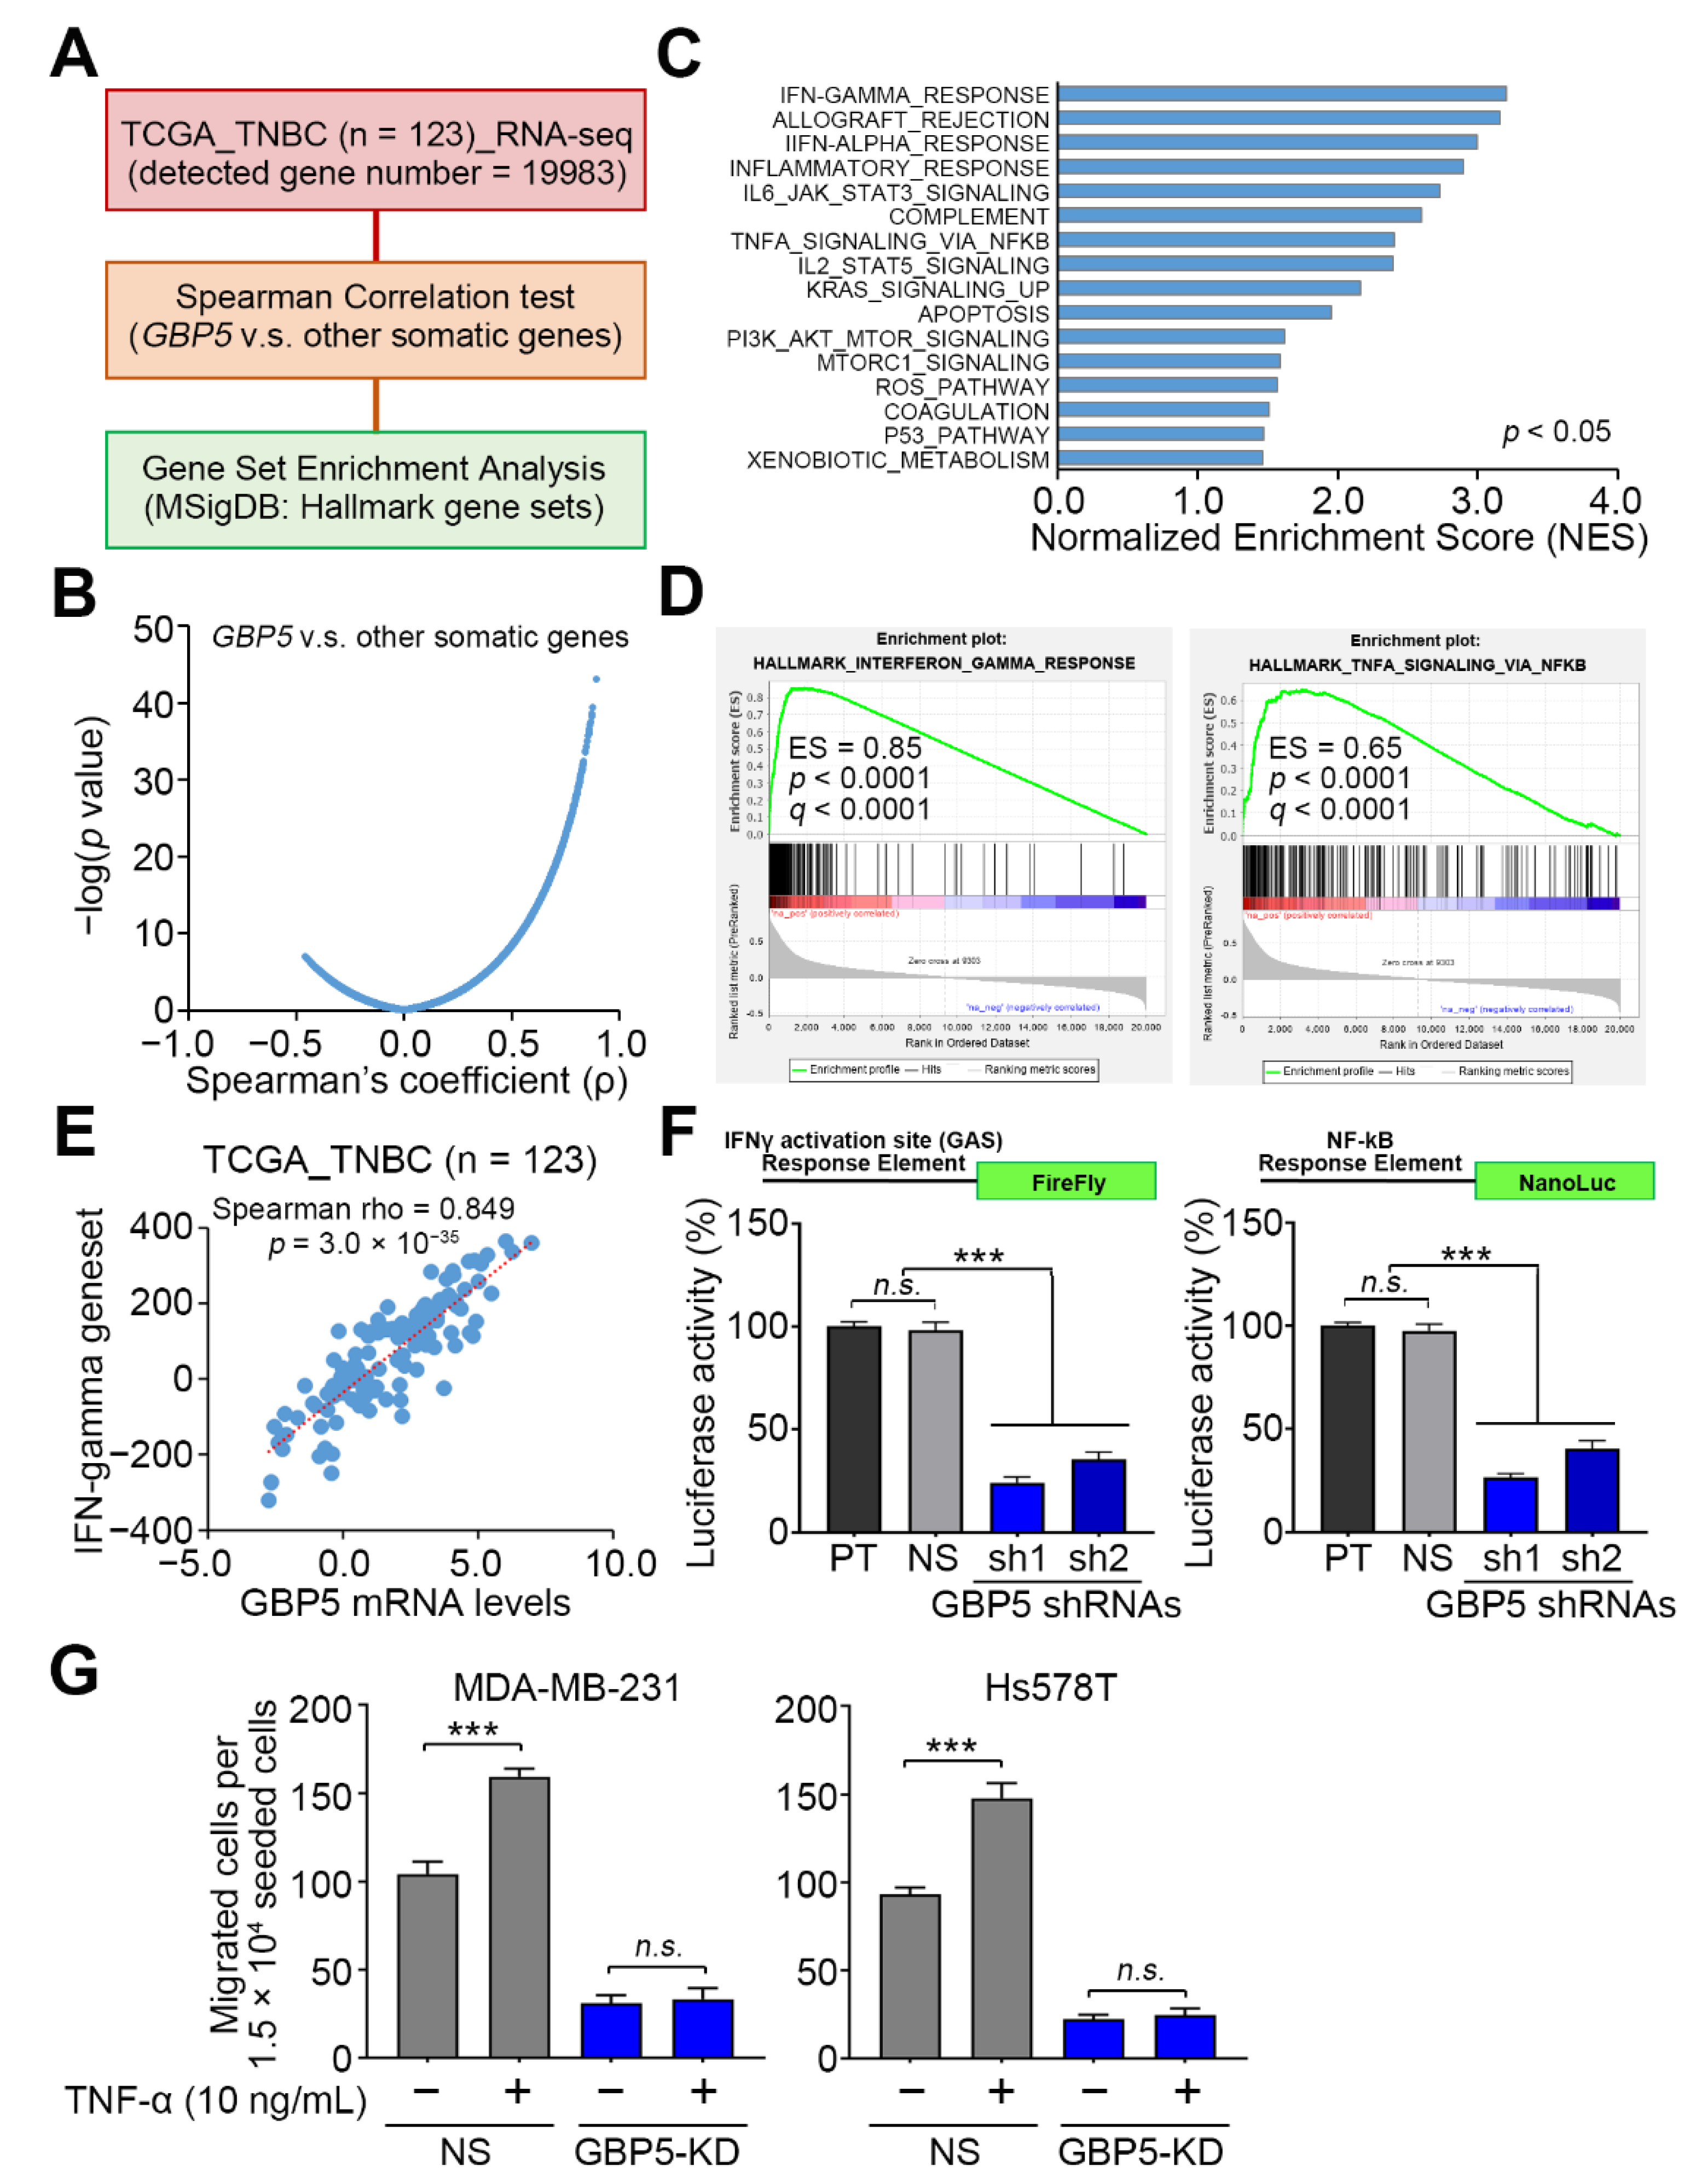
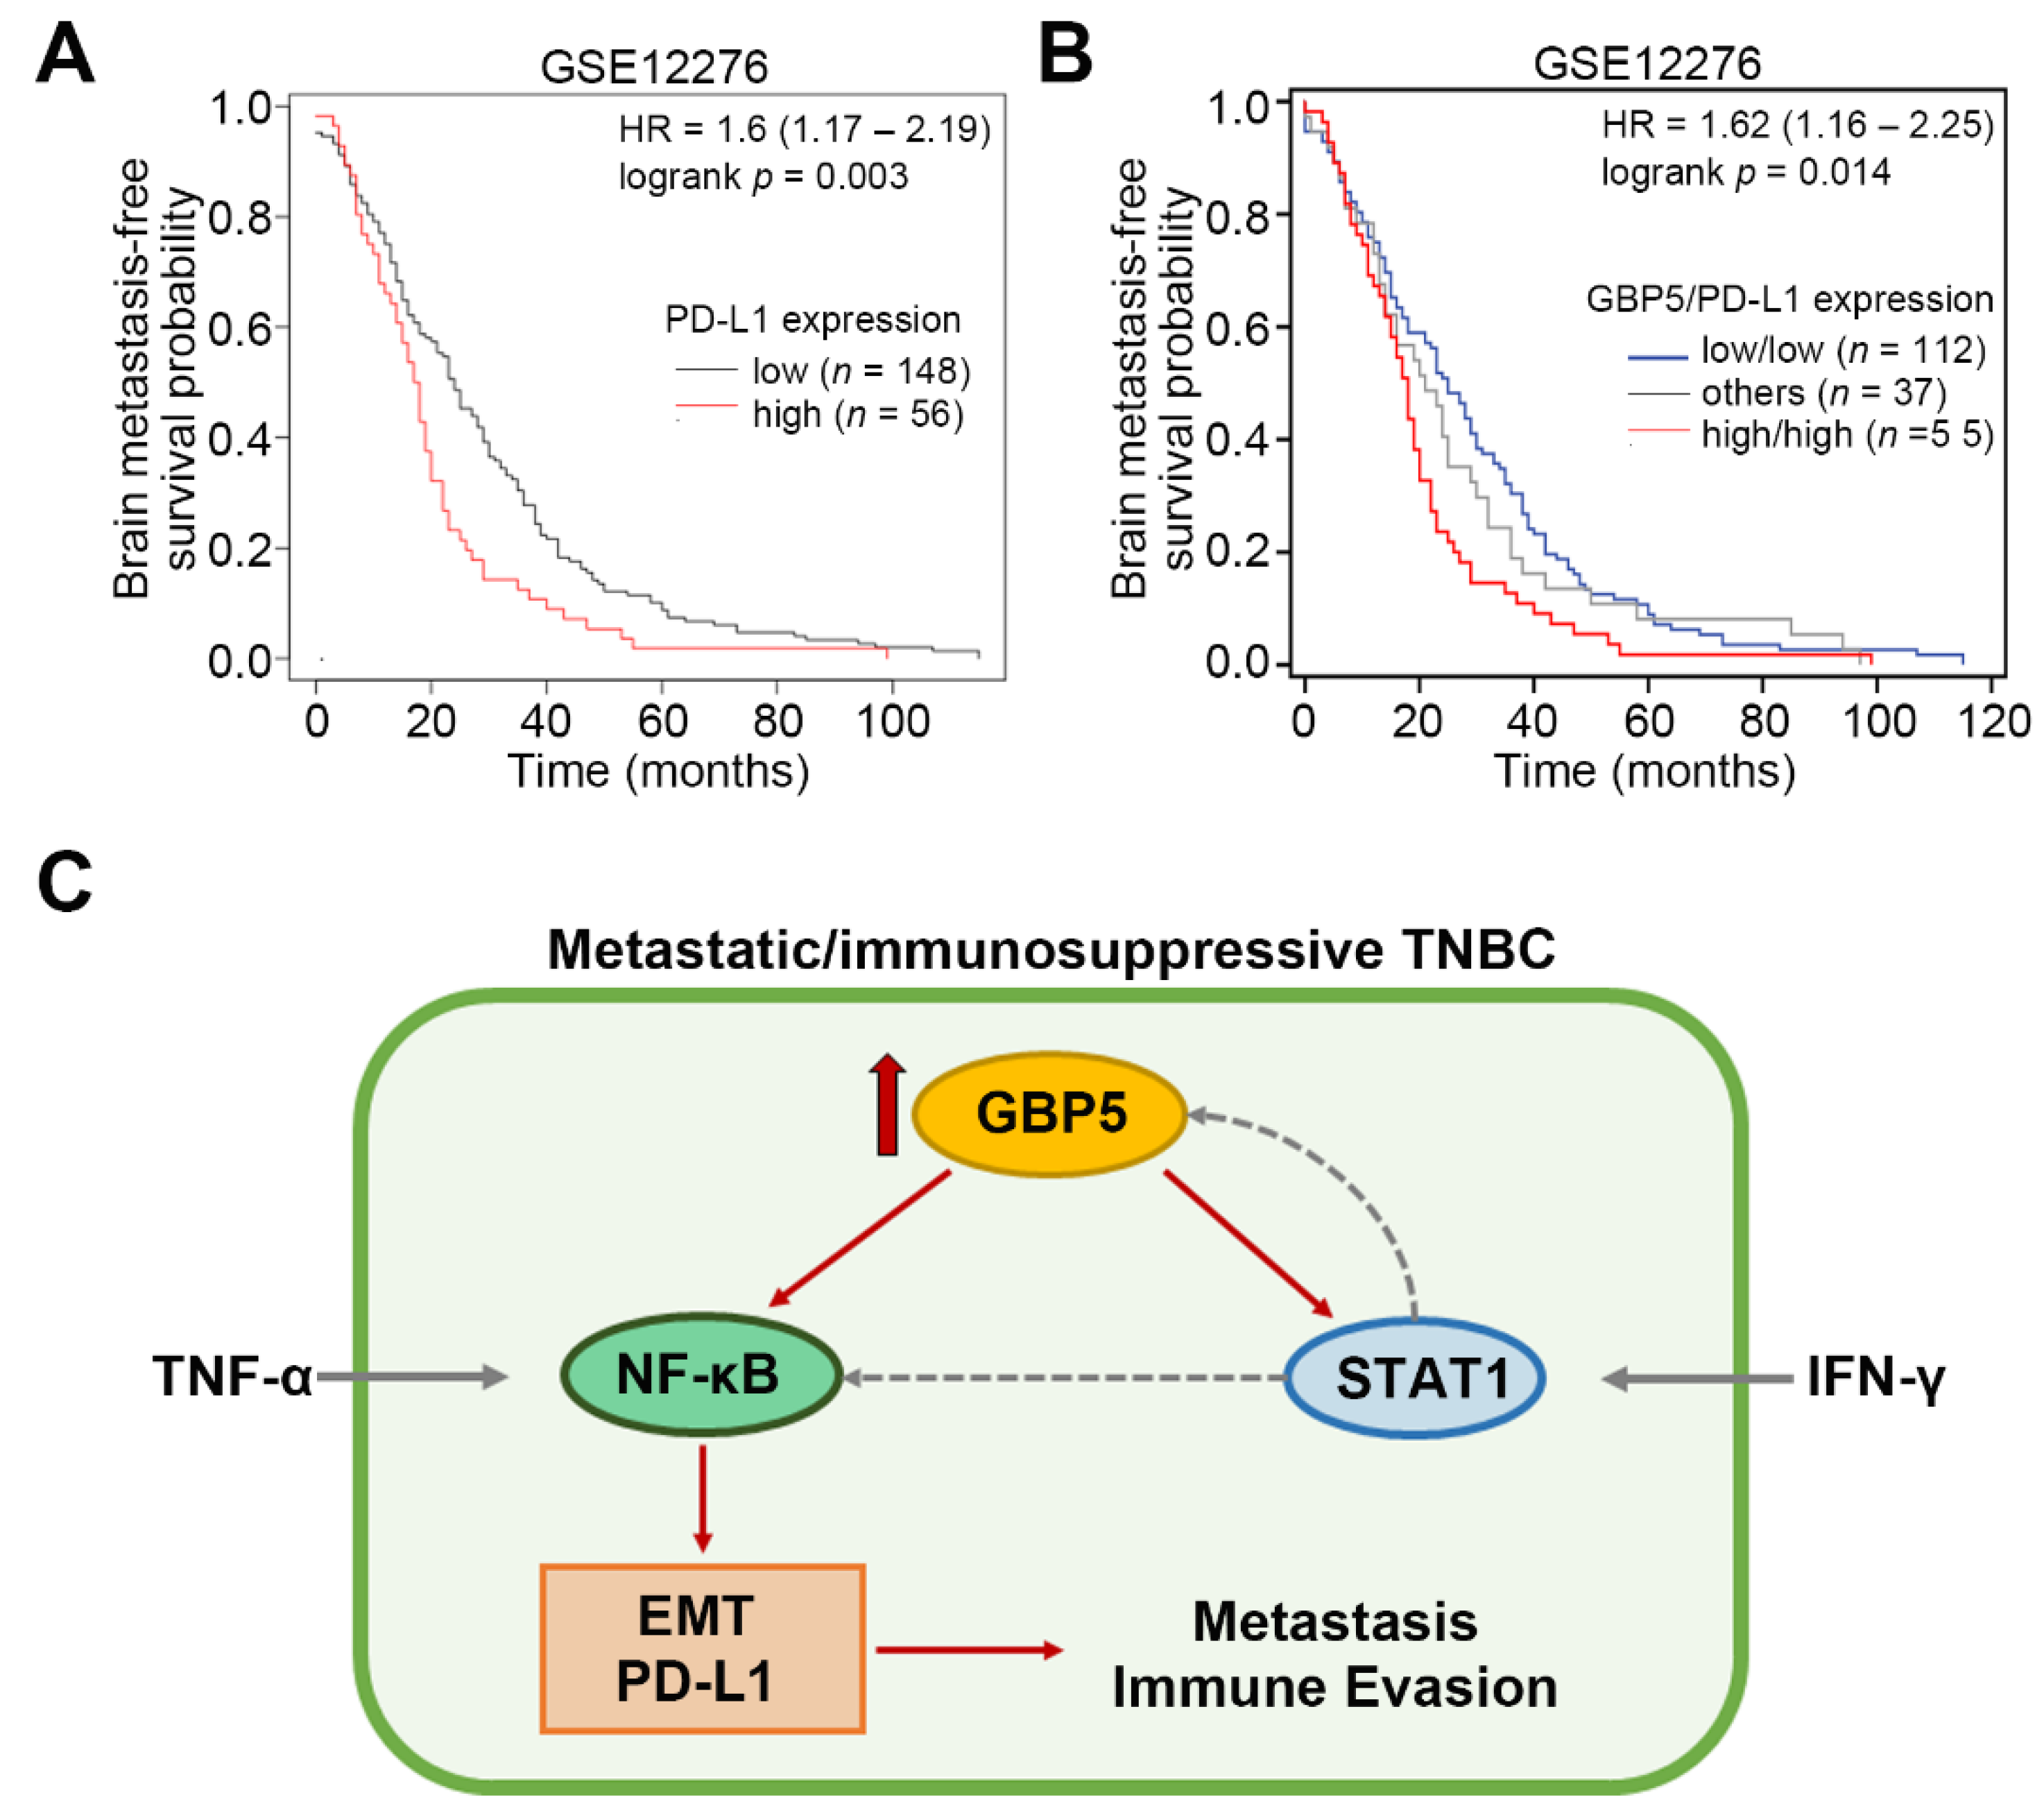
3.3. GBP5 Upregulation Probably Correlates with Elevated Activities of IFN-γ and NF-κB-Related Signaling Pathways in TNBC
3.4. GBP5 Repression Reduces the Expression of PD-L1 in TNBC, and Its Upregulation Predicts a Shorter Time Interval for Brain Metastasis of Breast Cancer
4. Discussion
5. Conclusions
Supplementary Materials
Author Contributions
Funding
Institutional Review Board Statement
Informed Consent Statement
Data Availability Statement
Acknowledgments
Conflicts of Interest
References
- Perou, C.M.; Sorlie, T.; Eisen, M.B.; van de Rijn, M.; Jeffrey, S.S.; Rees, C.A.; Pollack, J.R.; Ross, D.T.; Johnsen, H.; Akslen, L.A.; et al. Molecular portraits of human breast tumours. Nature 2000, 406, 747–752. [Google Scholar] [CrossRef]
- Schmadeka, R.; Harmon, B.E.; Singh, M. Triple-negative breast carcinoma: Current and emerging concepts. Am. J. Clin. Pathol. 2014, 141, 462–477. [Google Scholar] [CrossRef] [Green Version]
- Lee, K.L.; Chen, G.; Chen, T.Y.; Kuo, Y.C.; Su, Y.K. Effects of cancer stem cells in triple-negative breast cancer and brain metastasis: Challenges and solutions. Cancers 2020, 12, 2122. [Google Scholar] [CrossRef]
- Neophytou, C.; Boutsikos, P.; Papageorgis, P. Molecular mechanisms and emerging therapeutic targets of triple-negative breast cancer metastasis. Front. Oncol. 2018, 8, 31–43. [Google Scholar] [CrossRef] [PubMed] [Green Version]
- Gibson, J. Anti-PD-L1 for metastatic triple-negative breast cancer. Lancet Oncol. 2015, 16, e264. [Google Scholar] [CrossRef]
- Mittendorf, E.A.; Philips, A.V.; Meric-Bernstam, F.; Qiao, N.; Wu, Y.; Harrington, S.; Su, X.; Wang, Y.; Gonzalez-Angulo, A.M.; Akcakanat, A.; et al. PD-L1 expression in triple-negative breast cancer. Cancer Immunol. Res. 2014, 2, 361–370. [Google Scholar] [CrossRef] [PubMed] [Green Version]
- Akiki, M.; Haddad, F.G.; Kourie, H.R.; Khaddage, A.; Smayra, V.T. PD-L1: An unavoidable biomarker in advanced triple-negative breast cancer. Biomark. Med. 2019, 13, 1539–1541. [Google Scholar] [CrossRef] [PubMed]
- Shenoy, A.R.; Wellington, D.A.; Kumar, P.; Kassa, H.; Booth, C.J.; Cresswell, P.; MacMicking, J.D. GBP5 promotes NLRP3 inflammasome assembly and immunity in mammals. Science 2012, 336, 481–485. [Google Scholar] [CrossRef]
- Hotter, D.; Sauter, D.; Kirchhoff, F. Guanylate binding protein 5: Impairing virion infectivity by targeting retroviral envelope glycoproteins. Small GTPases. 2017, 8, 31–37. [Google Scholar] [CrossRef] [Green Version]
- Li, Z.; Qu, X.; Liu, X.; Huan, C.; Wang, H.; Zhao, Z.; Yang, X.; Hua, S.; Zhang, W. GBP5 Is an interferon-induced inhibitor of respiratory syncytial virus. J. Virol. 2020, 94, e01407–e01420. [Google Scholar] [CrossRef]
- Matta, S.K.; Patten, K.; Wang, Q.; Kim, B.H.; MacMicking, J.D.; Sibley, L.D. NADPH oxidase and guanylate binding protein 5 restrict survival of avirulent type III strains of toxoplasma gondii in Naive Macrophages. mBio 2018, 9, e01393–e01418. [Google Scholar] [CrossRef] [Green Version]
- Koltes, J.E.; Fritz-Waters, E.; Eisley, C.J.; Choi, I.; Bao, H.; Kommadath, A.; Serao, N.V.; Boddicker, N.J.; Abrams, S.M.; Schroyen, M.; et al. Identification of a putative quantitative trait nucleotide in guanylate binding protein 5 for host response to PRRS virus infection. BMC Genom. 2015, 16, 412–424. [Google Scholar] [CrossRef] [PubMed] [Green Version]
- Tripal, P.; Bauer, M.; Naschberger, E.; Mortinger, T.; Hohenadl, C.; Cornali, E.; Thurau, M.; Sturzl, M. Unique features of different members of the human guanylate-binding protein family. J. Interferon Cytokine Res. 2007, 27, 44–52. [Google Scholar] [CrossRef] [PubMed]
- Cheng, L.; Gou, L.; Wei, T.; Zhang, J. GBP1 promotes erlotinib resistance via PGK1activated EMT signaling in nonsmall cell lung cancer. Int. J. Oncol. 2020, 57, 858–870. [Google Scholar] [CrossRef] [PubMed]
- Zhao, J.; Li, X.; Liu, L.; Cao, J.; Goscinski, M.A.; Fan, H.; Li, H.; Suo, Z. Oncogenic role of guanylate binding protein 1 in human prostate cancer. Front. Oncol. 2019, 9, 1494–1511. [Google Scholar] [CrossRef]
- Mustafa, D.A.M.; Pedrosa, R.M.S.M.; Smid, M.; van der Weiden, M.; de Weerd, V.; Nigg, A.L.; Berrevoets, C.; Zeneyedpour, L.; Priego, N.; Valiente, M.; et al. T lymphocytes facilitate brain metastasis of breast cancer by inducing guanylate-binding protein 1 expression. Acta Neuropathol. 2018, 135, 581–599. [Google Scholar] [CrossRef] [PubMed] [Green Version]
- Quintero, M.; Adamoski, D.; Reis, L.M.D.; Ascencao, C.F.R.; Oliveira, K.R.S.; Goncalves, K.A.; Dias, M.M.; Carazzolle, M.F.; Dias, S.M.G. Guanylate-binding protein-1 is a potential new therapeutic target for triple-negative breast cancer. BMC Cancer 2017, 17, 727–742. [Google Scholar] [CrossRef] [Green Version]
- Godoy, P.; Cadenas, C.; Hellwig, B.; Marchan, R.; Stewart, J.; Reif, R.; Lohr, M.; Gehrmann, M.; Rahnenfuhrer, J.; Schmidt, M.; et al. Interferon-inducible guanylate binding protein (GBP2) is associated with better prognosis in breast cancer and indicates an efficient T cell response. Breast Cancer 2014, 21, 491–499. [Google Scholar] [CrossRef]
- Rahvar, F.; Salimi, M.; Mozdarani, H. Plasma GBP2 promoter methylation is associated with advanced stages in breast cancer. Genet. Mol. Biol. 2020, 43, e20190230–e20190238. [Google Scholar] [CrossRef]
- Cimas, F.J.; Manzano, A.; Baliu-Piqué, M.; García-Gil, E.; Pérez-Segura, P.; Nagy, Á.; Pandiella, A.; Győrffy, B.; Ocana, A. Genomic mapping identifies mutations in RYR2 and AHNAK as associated with favorable outcome in basal-like breast tumors expressing PD1/PD-L1. Cancers 2020, 12, 2243. [Google Scholar] [CrossRef]
- Fujiwara, Y.; Hizukuri, Y.; Yamashiro, K.; Makita, N.; Ohnishi, K.; Takeya, M.; Komohara, Y.; Hayashi, Y. Guanylate-binding protein 5 is a marker of interferon-gamma-induced classically activated macrophages. Clin. Transl. Immunol. 2016, 5, e111–e117. [Google Scholar] [CrossRef] [PubMed]
- Rupper, A.C.; Cardelli, J.A. Induction of guanylate binding protein 5 by gamma interferon increases susceptibility to Salmonella enterica serovar Typhimurium-induced pyroptosis in RAW 264.7 cells. Infect. Immun. 2008, 76, 2304–2315. [Google Scholar] [CrossRef] [PubMed] [Green Version]
- De, S.M.; Arrigoni, A.; Rossetti, G.; Gruarin, P.; Ranzani, V.; Politano, C.; Bonnal, R.J.P.; Provasi, E.; Sarnicola, M.L.; Panzeri, I.; et al. Transcriptional landscape of human tissue lymphocytes unveils uniqueness of tumor-infiltrating T regulatory cells. Immunity 2016, 45, 1135–1147. [Google Scholar]
- Yasumoto, K.; Okamoto, S.; Mukaida, N.; Murakami, S.; Mai, M.; Matsushima, K. Tumor necrosis factor alpha and interferon gamma synergistically induce interleukin 8 production in a human gastric cancer cell line through acting concurrently on AP-1 and NF-kB-like binding sites of the interleukin 8 gene. J. Biol. Chem. 1992, 267, 22506–22511. [Google Scholar] [CrossRef]
- Asgarova, A.; Asgarov, K.; Godet, Y.; Peixoto, P.; Nadaradjane, A.; Boyer-Guittaut, M.; Galaine, J.; Guenat, D.; Mougey, V.; Perrard, J.; et al. PD-L1 expression is regulated by both DNA methylation and NF-kB during EMT signaling in non-small cell lung carcinoma. Oncoimmunology 2018, 7, e1423170–e1423182. [Google Scholar] [CrossRef] [PubMed] [Green Version]
- Lin, N.U.; Claus, E.; Sohl, J.; Razzak, A.R.; Arnaout, A.; Winer, E.P. Sites of distant recurrence and clinical outcomes in patients with metastatic triple-negative breast cancer: High incidence of central nervous system metastases. Cancer 2008, 113, 2638–2645. [Google Scholar] [CrossRef] [Green Version]
- Zaidi, M.R.; Merlino, G. The two faces of interferon-gamma in cancer. Clin. Cancer Res. 2011, 17, 6118–6124. [Google Scholar] [CrossRef] [Green Version]
- Ershaid, N.; Sharon, Y.; Doron, H.; Raz, Y.; Shani, O.; Cohen, N.; Monteran, L.; Leider-Trejo, L.; Ben-Shmuel, A.; Yassin, M.; et al. NLRP3 inflammasome in fibroblasts links tissue damage with inflammation in breast cancer progression and metastasis. Nat. Commun. 2019, 10, 4375–4389. [Google Scholar] [CrossRef] [Green Version]
- Wellenstein, M.D.; Coffelt, S.B.; Duits, D.E.M.; van Miltenburg, M.H.; Slagter, M.; de Rink, I.; Henneman, L.; Kas, S.M.; Prekovic, S.; Hau, C.-S.; et al. Loss of p53 triggers WNT-dependent systemic inflammation to drive breast cancer metastasis. Nature 2019, 572, 538–542. [Google Scholar] [CrossRef]
- Ilchovska, D.D.; Barrow, D.M. An overview of the NF-kB mechanism of pathophysiology in rheumatoid arthritis, investigation of the NF-kB ligand RANKL and related nutritional interventions. Autoimmun. Rev. 2020, 20, 102741–102746. [Google Scholar] [CrossRef]
- Ma, C.; Zu, X.; Liu, K.; Bode, A.M.; Dong, Z.; Liu, Z.; Kim, D.J. Knockdown of pyruvate kinase M inhibits cell growth and migration by reducing NF-kB activity in triple-negative breast cancer cells. Mol. Cells 2019, 42, 628–636. [Google Scholar] [PubMed]
- Arora, R.; Yates, C.; Gary, B.D.; McClellan, S.; Tan, M.; Xi, Y.; Reed, E.; Piazza, G.A.; Owen, L.B.; Dean-Colomb, W. Panepoxydone targets NF-kB and FOXM1 to inhibit proliferation, induce apoptosis and reverse epithelial to mesenchymal transition in breast cancer. PLoS ONE 2014, 9, e98370–e98381. [Google Scholar] [CrossRef] [PubMed] [Green Version]
- Rajendran, P.; Ben, A.R.; Al-Saeedi, F.J.; Elsayed, M.M.; Islam, M.; Al-Ramadan, S.Y. Thidiazuron decreases epithelial-mesenchymal transition activity through the NF-kB and PI3K/AKT signalling pathways in breast cancer. J. Cell Mol. Med. 2020, 24, 14525–14538. [Google Scholar] [CrossRef] [PubMed]
- Vyas, D.; Lopez-Hisijos, N.; Shah, P.; Deshpande, K.S.; Basson, M.D.; Vyas, A.; Chaturvedi, L.S. A second-generation proteasome inhibitor and doxorubicin modulates IL-6, pSTAT-3 and NF-kB activity in MDA-MB-231 breast cancer cells. J. Nanosci. Nanotechnol. 2017, 17, 175–185. [Google Scholar] [CrossRef]
- Saleh, R.; Taha, R.Z.; Sasidharan, N.V.; Alajez, N.M.; Elkord, E. PD-L1 Blockade by atezolizumab downregulates signaling pathways associated with tumor growth, metastasis, and hypoxia in human triple negative breast cancer. Cancers 2019, 11, 1050–1066. [Google Scholar] [CrossRef] [PubMed] [Green Version]


Publisher’s Note: MDPI stays neutral with regard to jurisdictional claims in published maps and institutional affiliations. |
© 2021 by the authors. Licensee MDPI, Basel, Switzerland. This article is an open access article distributed under the terms and conditions of the Creative Commons Attribution (CC BY) license (https://creativecommons.org/licenses/by/4.0/).
Share and Cite
Cheng, S.-W.; Chen, P.-C.; Lin, M.-H.; Ger, T.-R.; Chiu, H.-W.; Lin, Y.-F. GBP5 Repression Suppresses the Metastatic Potential and PD-L1 Expression in Triple-Negative Breast Cancer. Biomedicines 2021, 9, 371. https://0-doi-org.brum.beds.ac.uk/10.3390/biomedicines9040371
Cheng S-W, Chen P-C, Lin M-H, Ger T-R, Chiu H-W, Lin Y-F. GBP5 Repression Suppresses the Metastatic Potential and PD-L1 Expression in Triple-Negative Breast Cancer. Biomedicines. 2021; 9(4):371. https://0-doi-org.brum.beds.ac.uk/10.3390/biomedicines9040371
Chicago/Turabian StyleCheng, Shun-Wen, Po-Chih Chen, Min-Hsuan Lin, Tzong-Rong Ger, Hui-Wen Chiu, and Yuan-Feng Lin. 2021. "GBP5 Repression Suppresses the Metastatic Potential and PD-L1 Expression in Triple-Negative Breast Cancer" Biomedicines 9, no. 4: 371. https://0-doi-org.brum.beds.ac.uk/10.3390/biomedicines9040371