
Low Hemoglobin-to-Red Cell Distribution Width Ratio Is Associated with Disease Progression and Poor Prognosis in Upper Tract Urothelial Carcinoma

 , , , ,
Abstract
:1. Introduction
2. Materials and Methods
3. Results
3.1. Patient Characteristics
3.2. Clinicopathological Features in High and Low HRR Groups
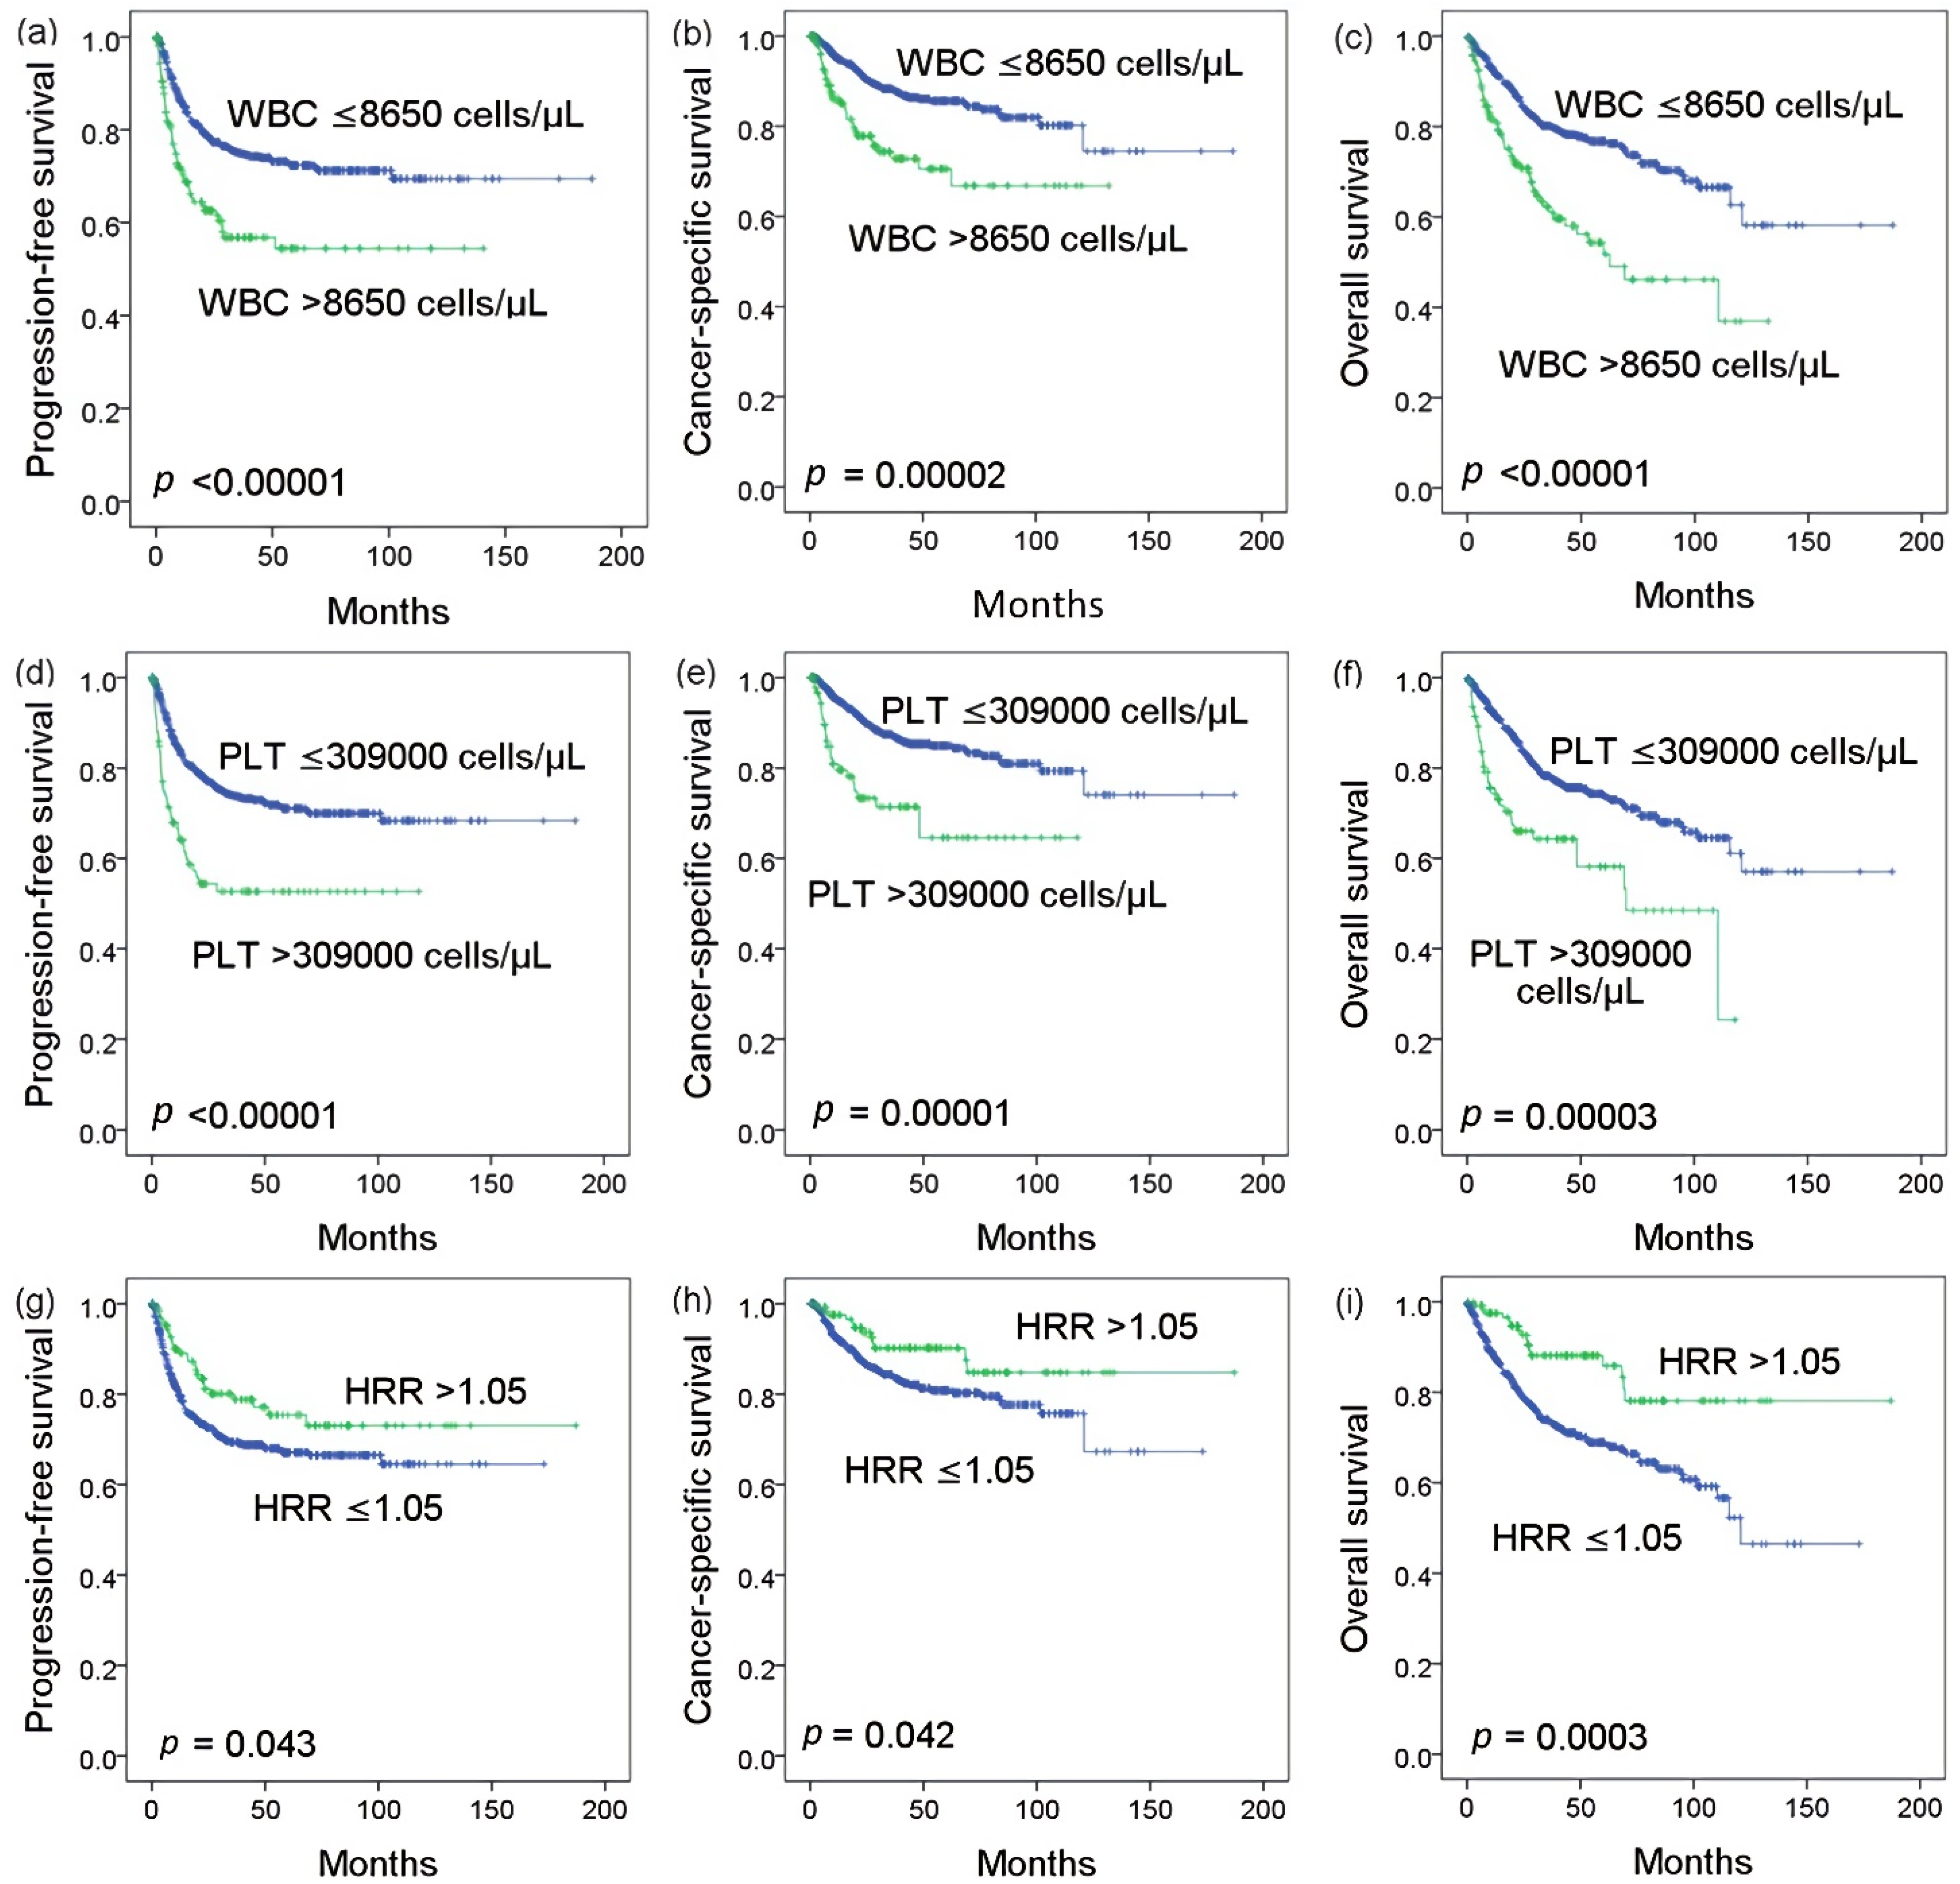
3.3. Kaplan–Meier Analysis
3.4. Cox Regression Analysis
4. Discussion
5. Conclusions
Author Contributions
Funding
Institutional Review Board Statement
Informed Consent Statement
Data Availability Statement
Conflicts of Interest
References
- Siegel, R.L.; Miller, K.D.; Fuchs, H.E.; Jemal, A. Cancer Statistics. Ca Cancer J. Clin. 2021, 71, 7–33. [Google Scholar] [CrossRef] [PubMed]
- Raman, J.D.; Messer, J.; Sielatycki, J.A.; Hollenbeak, C.S. Incidence and survival of patients with carcinoma of the ureter and renal pelvis in the USA, 1973–2005. Bju Int. 2011, 107, 1059–1064. [Google Scholar] [CrossRef]
- Milojevic, B.; Dzamic, Z.; Grozdic Milojevic, I.; Bumbasirevic, U.; Santric, V.; Kajmakovic, B.; Janicic, A.; Durutovic, O.; Dragicevic, D.; Bojanic, N.; et al. Prognostic value of Balkan endemic nephropathy and gender on upper tract urothelial carcinoma outcomes after radical nephroureterectomy: A cohort study. Urol. Oncol. 2021. [Google Scholar] [CrossRef]
- Yu, L.C.; Chang, C.H.; Huang, C.P.; Huang, C.Y.; Hong, J.H.; Tai, T.Y.; Weng, H.Y.; Lo, C.W.; Tsai, C.Y.; Lee, Y.K.; et al. Prognostic Significance of Primary Tumor Location in Upper Tract Urothelial Carcinoma Treated with Nephroureterectomy: A Retrospective, Multi-Center Cohort Study in Taiwan. J. Clin. Med. 2020, 9, 3866. [Google Scholar] [CrossRef]
- Lughezzani, G.; Sun, M.; Perrotte, P.; Shariat, S.F.; Jeldres, C.; Budaus, L.; Alasker, A.; Duclos, A.; Widmer, H.; Latour, M. Should bladder cuff excision remain the standard of care at nephroureterectomy in patients with urothelial carcinoma of the renal pelvis? A population-based study. Eur. Urol. 2010, 57, 956–962. [Google Scholar] [CrossRef] [PubMed]
- Margulis, V.; Shariat, S.F.; Matin, S.F.; Kamat, A.M.; Zigeuner, R.; Kikuchi, E.; Lotan, Y.; Weizer, A.; Raman, J.D.; Wood, C.G.; et al. Outcomes of radical nephroureterectomy: A series from the upper tract urothelial carcinoma collaboration. Cancer 2009, 115, 1224–1233. [Google Scholar] [CrossRef]
- Lehmann, J.; Suttmann, H.; Kovač, I.; Hack, M.; Kamradt, J.; Siemer, S.; Wullich, B.; Zwergel, U.; Stöckle, M. Transitional cell carcinoma of the ureter: Prognostic factors influencing progression and survival. Eur. Urol. 2007, 51, 1281–1288. [Google Scholar] [CrossRef]
- Foerster, B.; Moschini, M.; Abufaraj, M.; Soria, F.; Gust, K.M.; Rouprêt, M.; Karakiewicz, P.I.; Briganti, A.; Rink, M.; Kluth, L. Predictive and prognostic value of preoperative thrombocytosis in upper tract urothelial carcinoma. Clin. Genitourin. Cancer 2017, 15, e1039–e1045. [Google Scholar] [CrossRef]
- Rink, M.; Sharifi, N.; Fritsche, H.-M.; Aziz, A.; Miller, F.; Kluth, L.A.; Ngamsri, T.; Dahlem, R.; Chun, F.K.; Shariat, S.F. Impact of preoperative anemia on oncologic outcomes of upper tract urothelial carcinoma treated with radical nephroureterectomy. J. Urol. 2014, 191, 316–322. [Google Scholar] [CrossRef]
- Cheng, Y.C.; Huang, C.N.; Wu, W.J.; Li, C.C.; Ke, H.L.; Li, W.M.; Tu, H.P.; Li, C.F.; Chang, L.L.; Yeh, H.C. The prognostic significance of inflammation-associated blood cell markers in patients with upper tract urothelial carcinoma. Ann. Surg. Oncol. 2016, 23, 343–351. [Google Scholar] [CrossRef] [PubMed]
- Chung, H.S.; Hwang, E.C.; Kim, M.S.; Yu, S.H.; Jung, S.I.; Kang, T.W.; Choi, C.; Choi, S.H.; Kwon, T.G.; Noh, J.H. Effects of Variant Histology on the Oncologic Outcomes of Patients with Upper Urinary Tract Carcinoma After Radical Nephroureterectomy: A Propensity Score–Matched Analysis. Clin. Genitourin. Cancer 2019, 17, e394–e407. [Google Scholar] [CrossRef]
- Fujita, K.; Uemura, M.; Yamamoto, Y.; Tanigawa, G.; Nakata, W.; Sato, M.; Nagahara, A.; Kiuchi, H.; Nakai, Y.; Matsumiya, K. Preoperative risk stratification for cancer-specific survival of patients with upper urinary tract urothelial carcinoma treated by nephroureterectomy. Int. J. Clin. Oncol. 2015, 20, 156–163. [Google Scholar] [CrossRef]
- Gunay, L.M.; Akdogan, B.; Koni, A.; Inci, K.; Bilen, C.Y.; Ozen, H. Upper urinary tract transitional cell carcinoma: Is there a best? Clin. Genitourin. Cancer 2013, 11, 39–44. [Google Scholar] [CrossRef]
- Milojevic, B.; Dzamic, Z.; Kajmakovic, B.; Durutovic, O.; Bumbasirevic, U.; Grujicic, S.S. Prognostic impact of preoperative anemia on urothelial and extraurothelial recurrence in patients with upper tract urothelial carcinoma. Clin. Genitourin. Cancer 2015, 13, 485–491. [Google Scholar] [CrossRef]
- Qin, C.; Liang, E.L.; Du, Z.Y.; Qiu, X.Y.; Tang, G.; Chen, F.R.; Zhang, B.; Tian, D.W.; Hu, H.L.; Wu, C.L. Prognostic significance of urothelial carcinoma with divergent differentiation in upper urinary tract after radical nephroureterectomy without metastatic diseases: A retrospective cohort study. Medicine 2017, 96. [Google Scholar] [CrossRef]
- Sakano, S.; Matsuyama, H.; Kamiryo, Y.; Hayashida, S.; Yamamoto, N.; Kaneda, Y.; Nasu, T.; Hashimoto, O.; Joko, K.; Baba, Y. Risk group stratification based on preoperative factors to predict survival after nephroureterectomy in patients with upper urinary tract urothelial carcinoma. Ann. Surg. Oncol. 2013, 20, 4389–4396. [Google Scholar] [CrossRef]
- Rink, M.; Soave, A.; Dahlem, R.; Aziz, A.; Al-Sayed, F.; Peine, S.; Engel, O.; Kluth, L.A.; Stenzl, A.; Burger, M. Impact of perioperative allogenic blood transfusion on survival after radical nephroureterectomy for upper tract urothelial carcinoma. Clin. Genitourin. Cancer 2016, 14, 96–104. [Google Scholar] [CrossRef]
- Tan, P.; Chen, J.; Xie, N.; Xu, H.; Ai, J.; Xu, H.; Liu, L.; Yang, L.; Wei, Q. Is preoperative serum lactate dehydrogenase useful in predicting the outcomes of patients with upper tract urothelial carcinoma? Cancer Med. 2018, 7, 5096–5106. [Google Scholar] [CrossRef] [PubMed]
- Takahara, K.; Inamoto, T.; Komura, K.; Watsuji, T.; Azuma, H. Post-operative urothelial recurrence in patients with upper urinary tract urothelial carcinoma managed by radical nephroureterectomy with an ipsilateral bladder cuff: Minimal prognostic impact in comparison with non-urothelial recurrence and other clinical indicators. Oncol. Lett. 2013, 6, 1015–1020. [Google Scholar] [CrossRef]
- Yeh, H.C.; Chien, T.M.; Wu, W.J.; Li, C.C.; Li, W.M.; Ke, H.L.; Chou, Y.H.; Wang, C.J.; Huang, S.P.; Li, C.F.; et al. Is preoperative anemia a risk factor for upper tract urothelial carcinoma following radical nephroureterectomy? Urol. Oncol. 2016, 34, 337.e1–337.e9. [Google Scholar] [CrossRef] [PubMed]
- Gabrilovich, D.I.; Nagaraj, S. Myeloid-derived suppressor cells as regulators of the immune system. Nat. Rev. Immunol. 2009, 9, 162–174. [Google Scholar] [CrossRef]
- Schlesinger, M. Role of platelets and platelet receptors in cancer metastasis. J. Hematol. Oncol. 2018, 11, 125. [Google Scholar] [CrossRef] [PubMed]
- Friedman, J.S.; Lopez, M.F.; Fleming, M.D.; Rivera, A.; Martin, F.M.; Welsh, M.L.; Boyd, A.; Doctrow, S.R.; Burakoff, S.J. FRSOD2-deficiency anemia: Protein oxidation and altered protein expression reveal targets of damage, stress response, and antioxidant responsiveness. Blood 2004, 104, 2565–2573. [Google Scholar] [CrossRef]
- Patel, K.V.; Semba, R.D.; Ferrucci, L.; Newman, A.B.; Fried, L.P.; Wallace, R.B.; Bandinelli, S.; Phillips, C.S.; Yu, B.; Connelly, S.; et al. Red cell distribution width and mortality in older adults: A meta-analysis. J. Gerontol. A Biol. Sci. Med. Sci. 2010, 65, 258–265. [Google Scholar] [CrossRef]
- Lippi, G.; Targher, G.; Montagnana, M.; Salvagno, G.L.; Zoppini, G.; Guidi, G.C. Relation between red blood cell distribution width and inflammatory biomarkers in a large cohort of unselected outpatients. Arch. Pathol. Lab. Med. 2009, 133, 628–632. [Google Scholar] [CrossRef]
- Weiss, G.; Ganz, T.; Goodnough, L.T. Anemia of inflammation. Blood 2019, 133, 40–50. [Google Scholar] [CrossRef] [Green Version]
- Sun, P.; Zhang, F.; Chen, C.; Bi, X.; Yang, H.; An, X.; Wang, F.; Jiang, W. The ratio of hemoglobin to red cell distribution width as a novel prognostic parameter in esophageal squamous cell carcinoma: A retrospective study from southern China. Oncotarget 2016, 7, 42650. [Google Scholar] [CrossRef]
- Levey, A.S.; Bosch, J.P.; Lewis, J.B.; Greene, T.; Rogers, N.; Roth, D. A more accurate method to estimate glomerular filtration rate from serum creatinine: A new prediction equation. Modification of Diet in Renal Disease Study Group. Ann. Intern. Med. 1999, 130, 461–470. [Google Scholar] [CrossRef]
- Spadaro, S.; Taccone, F.S.; Fogagnolo, A.; Franchi, F.; Scolletta, S.; Ragazzi, R.; Fanni, A.; Marangoni, E.; Govoni, M.; Reverberi, R.; et al. The effects of blood transfusion on red blood cell distribution width in critically ill patients: A pilot study. Transfusion 2018, 58, 1863–1869. [Google Scholar] [CrossRef]
- Mantovani, A. Molecular pathways linking inflammation and cancer. Curr. Mol. Med. 2010, 10, 369–373. [Google Scholar] [CrossRef]
- Schito, L.; Semenza, G.L. Hypoxia-inducible factors: Master regulators of cancer progression. Trends Cancer 2016, 2, 758–770. [Google Scholar] [CrossRef] [PubMed] [Green Version]
- Tan, P.; Xie, N.; Ai, J.; Xu, H.; Xu, H.; Liu, L.; Yang, L.; Wei, Q. The prognostic significance of Albumin-to-Alkaline Phosphatase Ratio in upper tract urothelial carcinoma. Sci. Rep. 2018, 8, 1–8. [Google Scholar] [CrossRef] [PubMed] [Green Version]
- de Gonzalo-Calvo, D.; de Luxán-Delgado, B.; Rodríguez-González, S.; García-Macia, M.; Suárez, F.M.; Solano, J.J.; Rodríguez-Colunga, M.J.; Coto-Montes, A. Interleukin 6, soluble tumor necrosis factor receptor I and red blood cell distribution width as biological markers of functional dependence in an elderly population: A translational approach. Cytokine 2012, 58, 193–198. [Google Scholar] [CrossRef]
- Dugdale, A.E. Predicting iron and folate deficiency anaemias from standard blood testing: The mechanism and implications for clinical medicine and public health in developing countries. Biol. Med. Model. 2006, 3, 34. [Google Scholar] [CrossRef] [PubMed] [Green Version]
- Ai, L.; Mu, S.; Hu, Y. Prognostic role of RDW in hematological malignancies: A systematic review and meta-analysis. Cancer Cell Int. 2018, 18, 61. [Google Scholar] [CrossRef] [PubMed]
- Tham, T.; Bardash, Y.; Teegala, S.; Herman, W.S.; Costantino, P.D. The red cell distribution width as a prognostic indicator in upper aerodigestive tract (UADT) cancer: A systematic review and meta-analysis. Am. J. Otolaryngol. 2018, 39, 453–458. [Google Scholar] [CrossRef]
- Wang, P.F.; Song, S.Y.; Guo, H.; Wang, T.J.; Liu, N.; Yan, C.X. Prognostic role of pretreatment red blood cell distribution width in patients with cancer: A meta-analysis of 49 studies. J. Cancer 2019, 10, 4305–4317. [Google Scholar] [CrossRef]
- Zhou, Y.; Li, X.; Lu, Z.; Zhang, L.; Dai, T. Prognostic significance of red blood cell distribution width in gastrointestinal cancers: A meta-analysis. Medicine 2020, 99, e19588. [Google Scholar] [CrossRef]
- Hu, L.; Li, M.; Ding, Y.; Pu, L.; Liu, J.; Xie, J.; Cabanero, M.; Li, J.; Xiang, R.; Xiong, S. Prognostic value of RDW in cancers: A systematic review and meta-analysis. Oncotarget 2017, 8, 16027–16035. [Google Scholar] [CrossRef] [Green Version]
- Xu, W.Y.; Yang, X.B.; Wang, W.Q.; Bai, Y.; Long, J.Y.; Lin, J.Z.; Xiong, J.P.; Zheng, Y.C.; He, X.D.; Zhao, H.T.; et al. Prognostic impact of the red cell distribution width in esophageal cancer patients: A systematic review and meta-analysis. World J. Gastroenterol. 2018, 24, 2120–2129. [Google Scholar] [CrossRef]
- Penninx, B.W.; Pahor, M.; Cesari, M.; Corsi, A.M.; Woodman, R.C.; Bandinelli, S.; Guralnik, J.M.; Ferrucci, L. Anemia is associated with disability and decreased physical performance and muscle strength in the elderly. J. Am. Geriatr. Soc. 2004, 52, 719–724. [Google Scholar] [CrossRef]
- Groarke, E.M.; Young, N.S. Aging and hematopoiesis. Clin. Geriatr. Med. 2019, 35, 285–293. [Google Scholar] [CrossRef] [PubMed]
- Kozlitina, J.; Garcia, C.K. Red blood cell size is inversely associated with leukocyte telomere length in a large multi-ethnic population. PLoS ONE 2012, 7, e51046. [Google Scholar] [CrossRef] [Green Version]
- Broadway-Duren, J.B.; Klaassen, H. Anemias. Crit. Care Nurs. Clin. North Am. 2013, 25, 411–426. [Google Scholar] [CrossRef] [PubMed]
- Salvagno, G.L.; Sanchis-Gomar, F.; Picanza, A.; Lippi, G. Red blood cell distribution width: A simple parameter with multiple clinical applications. Crit. Rev. Clin. Lab Sci. 2015, 52, 86–105. [Google Scholar] [CrossRef]
- Patel, H.H.; Patel, H.R.; Higgins, J.M. Modulation of red blood cell population dynamics is a fundamental homeostatic response to disease. Am. J. Hematol. 2015, 90, 422–428. [Google Scholar] [CrossRef] [PubMed] [Green Version]
- Stermer, E.; Levy, N. Ileus as a complication of colonoscopy. Am. J. Gastroenterol. 1990, 85, 333–334. [Google Scholar]
- Mantovani, A.; Allavena, P.; Sica, A.; Balkwill, F. Cancer-related inflammation. Nature 2008, 454, 436–444. [Google Scholar] [CrossRef]
- Kelleher, D.K.; Mattheinsen, U.; Thews, O.; Vaupel, P. Blood flow, oxygenation, and bioenergetic status of tumors after erythropoietin treatment in normal and anemic rats. Cancer Res. 1996, 56, 4728–4734. [Google Scholar] [PubMed]
- Banzet, S.; Sanchez, H.; Chapot, R.; Bigard, X.; Vaulont, S.; Koulmann, N. Interleukin-6 contributes to hepcidin mRNA increase in response to exercise. Cytokine 2012, 58, 158–161. [Google Scholar] [CrossRef] [PubMed]
- Sun, C.C.; Vaja, V.; Babitt, J.L.; Lin, H.Y. Targeting the hepcidin-ferroportin axis to develop new treatment strategies for anemia of chronic disease and anemia of inflammation. Am. J. Hematol. 2012, 87, 392–400. [Google Scholar] [CrossRef] [PubMed] [Green Version]
- Ycas, J.W.; Horrow, J.C.; Horne, B.D. Persistent increase in red cell size distribution width after acute diseases: A biomarker of hypoxemia? Clin. Chim. Acta 2015, 448, 107–117. [Google Scholar] [CrossRef]
- Weiss, G.; Goodnough, L.T. Anemia of chronic disease. N. Engl. J. Med. 2005, 352, 1011–1023. [Google Scholar] [CrossRef] [Green Version]
- Kiefer, C.R.; Snyder, L.M. Oxidation and erythrocyte senescence. Curr. Opin. Hematol. 2000, 7, 113–116. [Google Scholar] [CrossRef]
- Pialoux, V.; Mounier, R.; Brown, A.D.; Steinback, C.D.; Rawling, J.M.; Poulin, M.J. Relationship between oxidative stress and HIF-1 alpha mRNA during sustained hypoxia in humans. Free Radic. Biol. Med. 2009, 46, 321–326. [Google Scholar] [CrossRef]
- Forhecz, Z.; Gombos, T.; Borgulya, G.; Pozsonyi, Z.; Prohaszka, Z.; Janoskuti, L. Red cell distribution width in heart failure: Prediction of clinical events and relationship with markers of ineffective erythropoiesis, inflammation, renal function, and nutritional state. Am. Heart J. 2009, 158, 659–666. [Google Scholar] [CrossRef] [PubMed]
- Pilling, L.C.; Atkins, J.L.; Duff, M.O.; Beaumont, R.N.; Jones, S.E.; Tyrrell, J.; Kuo, C.L.; Ruth, K.S.; Tuke, M.A.; Yaghootkar, H.; et al. Red blood cell distribution width: Genetic evidence for aging pathways in 116,666 volunteers. PLoS ONE 2017, 12, e0185083. [Google Scholar] [CrossRef] [PubMed] [Green Version]
- Yılmaz, A.; Mirili, C.; Tekin, S.B.; Bilici, M. The ratio of hemoglobin to red cell distribution width predicts survival in patients with gastric cancer treated by neoadjuvant FLOT: A retrospective study. Irish J. Med. Sci. 2020, 189, 91–102. [Google Scholar] [CrossRef] [PubMed]
- Tham, T.; Olson, C.; Wotman, M.; Teegala, S.; Khaymovich, J.; Coury, J.; Costantino, P. Evaluation of the prognostic utility of the hemoglobin-to-red cell distribution width ratio in head and neck cancer. Eur. Arch. Otorhinolaryngol. 2018, 275, 2869–2878. [Google Scholar] [CrossRef]
- Bozkaya, Y.; Kurt, B.; Gurler, F. A prognostic parameter in advanced non-small cell lung cancer: The ratio of hemoglobin-to-red cell distribution width. Int. J. Clin. Oncol. 2019, 24, 798–806. [Google Scholar] [CrossRef]
- Wu, F.; Yang, S.; Tang, X.; Liu, W.; Chen, H.; Gao, H. Prognostic value of baseline hemoglobin-to-red blood cell distribution width ratio in small cell lung cancer: A retrospective analysis. Thorac. Cancer 2020, 11, 888–897. [Google Scholar] [CrossRef] [PubMed] [Green Version]
- Yılmaz, A.; Yılmaz, H.; Tekin, S.B.; Bilici, M. The prognostic significance of hemoglobin-to-red cell distribution width ratio in muscle-invasive bladder cancer. Biomark. Med. 2020, 14, 727–738. [Google Scholar] [CrossRef] [PubMed]


| Variables | All Patients | HRR ≤ 1.05 | HRR > 1.05 | p Value | |||
|---|---|---|---|---|---|---|---|
| (N = 730) | (N = 603) | (N = 127) | |||||
| N | % | N | % | N | % | ||
| Age (Mean ± SD), years | 67.36 ± 10.48 | 68.15 ± 10.37 | 63.58 ± 10.21 | <0.00001 ** | |||
| Hemoglobin (g/dL) | 11.69 ± 2.03 | 11.11 ± 1.69 | 14.45 ± 0.91 | <0.00001 ** | |||
| RDW (%) | 13.92 ± 2.04 | 14.17 ± 2.14 | 12.72 ± 0.59 | <0.00001 ** | |||
| Gender | <0.00001 ** | ||||||
| Female | 407 | 55.8 | 370 | 61.4 | 37 | 29.1 | |
| Male | 323 | 44.2 | 233 | 38.6 | 90 | 70.9 | |
| Smoking | <0.00001 ** | ||||||
| No | 577 | 79 | 499 | 82.8 | 78 | 61.4 | |
| Yes | 153 | 21 | 104 | 17.2 | 49 | 38.6 | |
| Chronic kidney disease | <0.00001 ** | ||||||
| Stage 1 (≥90 mL/min/1.73 m2) | 61 | 8.4 | 44 | 7.3 | 17 | 13.4 | |
| Stage 2 (60–89 mL/min/1.73 m2) | 195 | 26.7 | 135 | 22.4 | 60 | 47.2 | |
| Stage 3 (30–59 min/1.73 m2) | 294 | 40.3 | 245 | 40.6 | 49 | 38.6 | |
| Stage 4 (15–30 mL/min/1.73 m2) | 57 | 7.8 | 57 | 9.5 | 0 | 0 | |
| Stage 5 (<15 mL/min/1.73 m2) | 123 | 16.8 | 122 | 20.2 | 1 | 0.8 | |
| History of bladder cancer | 0.241 | ||||||
| No | 619 | 84.8 | 507 | 84.1 | 112 | 88.2 | |
| Yes | 111 | 15.2 | 96 | 15.9 | 15 | 11.8 | |
| Tumor location | 0.68 | ||||||
| Renal pelvis | 319 | 43.7 | 262 | 43.4 | 57 | 44.9 | |
| Ureter | 270 | 37 | 221 | 36.7 | 49 | 38.6 | |
| Synchronous | 141 | 19.3 | 120 | 19.9 | 21 | 16.5 | |
| Approach | 0.016 * | ||||||
| Open | 358 | 49 | 308 | 51.1 | 50 | 39.4 | |
| Laparoscopy | 372 | 51 | 295 | 48.9 | 77 | 60.6 | |
| Pathological T stage | 0.009 ** | ||||||
| pTa/pTis | 130 | 17.8 | 108 | 17.9 | 22 | 17.3 | |
| pT1 | 173 | 23.7 | 137 | 22.7 | 36 | 28.3 | |
| pT2 | 158 | 21.6 | 134 | 22.2 | 24 | 18.9 | |
| pT3 | 221 | 30.3 | 176 | 29.2 | 45 | 35.4 | |
| pT4 | 48 | 6.6 | 48 | 8 | 0 | 0 | |
| Nodal status | 0.252 | ||||||
| pN0 | 188 | 25.8 | 158 | 26.2 | 30 | 23.6 | |
| pNx | 492 | 67.4 | 400 | 66.3 | 92 | 72.4 | |
| pN1/pN2 | 50 | 6.8 | 45 | 7.5 | 5 | 3.9 | |
| Grade | 0.028 * | ||||||
| Low | 129 | 17.7 | 98 | 16.3 | 31 | 24.4 | |
| High | 601 | 82.3 | 505 | 83.7 | 96 | 75.6 | |
| Focality | 0.519 | ||||||
| Unifocal | 535 | 73.3 | 439 | 72.8 | 96 | 75.6 | |
| Multifocal | 195 | 26.7 | 164 | 27.2 | 31 | 24.4 | |
| WBC | 0.662 | ||||||
| ≤8.65 × 10³ cells/μL | 564 | 77.3 | 464 | 76.9 | 100 | 78.7 | |
| >8.65 × 10³ cells/μL | 166 | 22.7 | 139 | 23.1 | 27 | 21.3 | |
| Platelet | 0.002 ** | ||||||
| ≤309 × 103 cells/μL | 634 | 86.8 | 513 | 85.1 | 121 | 95.3 | |
| >309 × 103 cells/μL | 96 | 13.2 | 90 | 14.9 | 6 | 4.7 | |
| Univariate Analysis | Progression-Free Survival | Cancer-Specific Survival | Overall Survival | |||
|---|---|---|---|---|---|---|
| HR (95% CI) | p Value | HR (95% CI) | p Value | HR (95% CI) | p Value | |
| Age, years | 1.009 (0.995, 1.023) | 0.198 | 1.016 (0.996, 1.035) | 0.112 | 1.026 (1.011, 1.041) | 0.001 ** |
| Gender | 0.036 * | 0.046 * | 0.473 | |||
| Female | 1 | 1 | 1 | |||
| Male | 1.354 (1.019, 1.798) | 1.484 (1.008, 2.187) | 1.114 (0.830, 1.496) | |||
| Smoking | 0.092 | 0.082 | 0.082 | |||
| No | 1 | 1 | 1 | |||
| Yes | 1.327 (0.955, 1.845) | 1.478 (0.952, 2.294) | 1.353 (0.962, 1.903) | |||
| Chronic kidney disease | 0.015 | 0.149 | 0.325 | |||
| Stage 1 (≥90 mL/min/1.73 m2) | 1 | 1 | 1 | |||
| Stage 2 (60–89 mL/min/1.73 m2) | 2.128 (1.056, 4.288) | 0.035 | 1.285 (0.561, 2.944) | 0.552 | 0.730 (0.425, 1.253) | 0.253 |
| Stage 3 (30–59 mL/min/1.73 m2) | 2.159 (1.088, 4.283) | 0.028 | 1.556 (0.706, 3.428) | 0.273 | 0.901 (0.546, 1.486) | 0.682 |
| Stage 4 (15–30 mL/min/1.73 m2) | 1.629 (0.686, 3.867) | 0.269 | 1.515 (0.549, 4.182) | 0.422 | 1.003 (0.503, 2.003) | 0.992 |
| Stage 5 (<15 mL/min/1.73 m2) | 1.091 (0.497, 2.396) | 0.829 | 0.642 (0.239, 1.724) | 0.379 | 0.607 (0.331, 1.115) | 0.108 |
| History of bladder cancer | 0.4 | 0.136 | 0.568 | |||
| No | 1 | 1 | 1 | |||
| Yes | 1.177 (0.805, 1.721) | 1.450 (0.890, 2.364) | 1.125 (0.751, 1.684) | |||
| Tumor location | 0.0002 ** | 0.015 * | 0.005 ** | |||
| Renal pelvis | 1 | 1 | 1 | |||
| Ureter | 1.042 (0.745, 1.457) | 0.812 | 1.118 (0.709, 1.764) | 0.632 | 1.303 (0.927, 1.831) | 0.128 |
| Synchronous | 1.993 (1.401, 2.834) | 0.0001 ** | 1.975 (1.218, 3.203) | 0.006 ** | 1.887 (1.290, 2.761) | 0.001 * |
| Approach | 0.164 | 0.013 * | 0.020 * | |||
| Open | 1 | 1 | 1 | |||
| Laparoscopy | 0.817 (0.614, 1.086) | 0.605 (0.406, 0.900) | 0.702 (0.522, 0.946) | |||
| Pathological T stage | <0.00001 ** | <0.00001 ** | <0.00001 ** | |||
| pTa/pTis | 1 | 1 | 1 | |||
| pT1 | 3.277 (1.103, 9.739) | 0.033 * | 4.594 (0.553, 38.165) | 0.158 | 1.089 (0.550, 2.156) | 0.807 |
| pT2 | 8.439 (3.008, 23.678) | 0.00005 ** | 14.171 (1.879, 106.879) | 0.010 ** | 2.149 (1.153, 4.006) | 0.016 * |
| pT3-4 | 24.907 (9.205, 67.397) | <0.00001 ** | 56.131 (7.806, 403.618) | 0.000006 ** | 5.596 (3.205, 9.768) | <0.00001 ** |
| Nodal status | <0.00001 ** | <0.00001 ** | <0.00001 ** | |||
| pN0 | 1 | 1 | 1 | |||
| pNx | 0.827 (0.590, 1.160) | 0.271 | 0.814 (0.510, 1.298) | 0.387 | 0.830 (0.586, 1.174) | 0.292 |
| pN1/pN2 | 5.197 (3.341, 8.086) | <0.00001 ** | 7.018 (3.934, 12.518) | <0.00001 ** | 5.714 (3.613, 9.036) | <0.00001 ** |
| Grade | <0.00001 ** | 0.0002 ** | 0.00007 ** | |||
| Low | 1 | 1 | 1 | |||
| High | 4.431 (2.409, 8.149) | 9.148 (2.898, 28.879) | 2.833 (1.693, 4.740) | |||
| Focality | 0.00004 ** | 0.002 ** | 0.007 ** | |||
| Unifocal | 1 | 1 | 1 | |||
| Multifocal | 1.855 (1.383, 2.489) | 1.880 (1.265, 2.795) | 1.530 (1.123, 2.084) | |||
| WBC | <0.00001 ** | 0.00003 ** | <0.00001 ** | |||
| ≤8.65 × 10³ cells/μL | 1 | 1 | 1 | |||
| >8.65 × 10³ cells/μL | 2.026 (1.489, 2.758) | 2.400 (1.592, 3.618) | 2.264 (1.652, 3.104) | |||
| Platelet | <0.00001 ** | 0.00003 ** | 0.00005 ** | |||
| ≤309 × 103 cells/μL | 1 | 1 | 1 | |||
| >309 × 103 cells/μL | 2.230 (1.573, 3.161) | 2.673 (1.690, 4.227) | 2.154 (1.487, 3.120) | |||
| Hemoglobin | 0.752 | 0.077 | 0.006 * | |||
| >11.4 g/dL | 1 | 1 | 1 | |||
| ≤11.4 g/dL | 1.047 (0.787, 1.394) | 1.417 (0.963, 2.086) | 1.506 (1.123, 2.019) | |||
| RDW | 0.027 * | 0.06 | <0.00001 ** | |||
| ≤14.1% | 1 | 1 | 1 | |||
| >14.1% | 1.401 (1.039, 1.888) | 1.471 (0.983, 2.201) | 1.988 (1.478, 2.673) | |||
| HRR | 0.044 * | 0.045 * | 0.0005 ** | |||
| >1.05 | 1 | 1 | 1 | |||
| ≤1.05 | 1.529 (1.011, 2.313) | 1.853 (1.014, 3.386) | 2.493 (1.491, 4.168) | |||
| Multivariate Analysis | Progression-Free Survival | Cancer-Specific Survival | Overall Survival | |||
|---|---|---|---|---|---|---|
| HR (95% CI) | p Value | HR (95% CI) | p Value | HR (95% CI) | p Value | |
| Age, years | 1.019 (1.004, 1.034) | 0.015 ** | ||||
| Gender | 0.149 | 0.063 | ||||
| Female | 1 | 1 | ||||
| Male | 1.247 (0.924, 1.682) | 1.472 (0.980, 2.213) | ||||
| Chronic kidney disease | 0.122 | |||||
| Stage 1 (≥90 mL/min/1.73 m2) | 1 | |||||
| Stage 2 (60–89 mL/min/1.73 m2) | 1.319 (0.643, 2.706) | 0.45 | ||||
| Stage 3 (30–59 mL/min/1.73 m2) | 1.086 (0.534, 2.210) | 0.82 | ||||
| Stage 4 (15–30 mL/min/1.73 m2) | 0.711 (0.292, 1.733) | 0.453 | ||||
| Stage 5 (<15 mL/min/1.73 m2) | 0.713 (0.320, 1.592) | 0.41 | ||||
| Tumor location | 0.223 | 0.657 | 0.094 | |||
| Renal pelvis | 1 | 1 | 1 | |||
| Ureter | 0.994 (0.695, 1.422) | 0.975 | 1.047 (0.646, 1.699) | 0.852 | 1.265 (0.888, 1.803) | 0.193 |
| Synchronous | 1.553 (0.904, 2.666) | 0.111 | 1.396 (0.673, 2.893) | 0.37 | 1.823 (1.043, 3.187) | 0.035* |
| Approach | 0.324 | 0.559 | ||||
| Open | 1 | 1 | ||||
| Laparoscopy | 0.809 (0.531, 1.233) | 0.911 (0.666, 1.246) | ||||
| Pathological T stage | <0.00001 ** | <0.00001 ** | <0.00001 ** | |||
| pTis/pTa | 1 | 1 | 1 | |||
| pT1 | 3.057 (1.007, 9.279) | 0.049 * | 4.031 (0.473, 34.334) | 0.202 | 1.110 (0.549, 2.244) | 0.772 |
| pT2 | 7.761 (2.696, 22.339) | 0.0001 ** | 10.930 (1.394, 85.669) | 0.023 * | 1.872 (0.959, 3.656) | 0.066 |
| pT3-4 | 16.961 (5.933, 48.486) | <0.0001 ** | 32.687 (4.274, 249.986) | 0.0008 ** | 4.226 (2.227, 8.020) | 0.00001 ** |
| Nodal status | <0.00001 ** | 0.00006 * | <0.00001 ** | |||
| pN0 | 1 | 1 | 1 | |||
| pNx | 0.958 (0.679, 1.352) | 0.807 | 1.021 (0.631, 1.650) | 0.934 | 0.974 (0.682, 1.391) | 0.885 |
| pN1/pN2 | 2.623 (1.664, 4.136) | 0.00003 ** | 3.207 (1.777, 5.789) | 0.0001 * | 3.077 (1.918, 4.934) | <0.00001 ** |
| Grade | 0.27 | 0.216 | 0.418 | |||
| Low | 1 | 1 | 1 | |||
| High | 1.448 (0.750, 2.794) | 2.145 (0.640, 7.187) | 1.274 (0.708, 2.292) | |||
| Focality | 0.262 | 0.501 | 0.709 | |||
| Unifocal | 1 | 1 | 1 | |||
| Multifocal | 1.310 (0.817, 2.099) | 1.237 (0.666, 2.300) | 0.913 (0.567, 1.471) | |||
| WBC | <0.00001 ** | 0.0001 ** | <0.00001 ** | |||
| ≤8.65 × 10³ cells/μL | 1 | 1 | 1 | |||
| >8.65 × 10³ cells/μL | 2.212 (1.568, 3.122) | 2.387 (1.513, 3.768) | 2.371 (1.674, 3.358) | |||
| Platelet | 0.45 | 0.259 | 0.318 | |||
| ≤309 × 103 cells/μL | 1 | 1 | 1 | |||
| >309 × 103 cells/μL | 1.166 (0.783, 1.739) | 1.351 (0.801, 2.280) | 1.237 (0.815, 1.878) | |||
| HRR | 0.007 ** | 0.020 * | 0.0009 ** | |||
| >1.05 | 1 | 1 | 1 | |||
| ≤1.05 | 1.873 (1.191, 2.944) | 2.174 (1.130, 4.182) | 2.515 (1.460, 4.331) | |||
Publisher’s Note: MDPI stays neutral with regard to jurisdictional claims in published maps and institutional affiliations. |
© 2021 by the authors. Licensee MDPI, Basel, Switzerland. This article is an open access article distributed under the terms and conditions of the Creative Commons Attribution (CC BY) license (https://creativecommons.org/licenses/by/4.0/).
Share and Cite
Su, Y.-C.; Wen, S.-C.; Li, C.-C.; Su, H.-C.; Ke, H.-L.; Li, W.-M.; Lee, H.-Y.; Li, C.-Y.; Yang, S.-F.; Tu, H.-P.; et al. Low Hemoglobin-to-Red Cell Distribution Width Ratio Is Associated with Disease Progression and Poor Prognosis in Upper Tract Urothelial Carcinoma. Biomedicines 2021, 9, 672. https://0-doi-org.brum.beds.ac.uk/10.3390/biomedicines9060672
Su Y-C, Wen S-C, Li C-C, Su H-C, Ke H-L, Li W-M, Lee H-Y, Li C-Y, Yang S-F, Tu H-P, et al. Low Hemoglobin-to-Red Cell Distribution Width Ratio Is Associated with Disease Progression and Poor Prognosis in Upper Tract Urothelial Carcinoma. Biomedicines. 2021; 9(6):672. https://0-doi-org.brum.beds.ac.uk/10.3390/biomedicines9060672
Chicago/Turabian StyleSu, Yung-Chun, Sheng-Chen Wen, Ching-Chia Li, Hsiao-Chun Su, Hung-Lung Ke, Wei-Ming Li, Hsiang-Ying Lee, Chia-Yang Li, Sheau-Fang Yang, Hung-Pin Tu, and et al. 2021. "Low Hemoglobin-to-Red Cell Distribution Width Ratio Is Associated with Disease Progression and Poor Prognosis in Upper Tract Urothelial Carcinoma" Biomedicines 9, no. 6: 672. https://0-doi-org.brum.beds.ac.uk/10.3390/biomedicines9060672