Subjective Family Socioeconomic Status and Adolescents’ Attention: Blacks’ Diminished Returns


1
Department of Family Medicine, Charles R Drew University of Medicine and Science, Los Angeles, CA 90059, USA
2
Department of Pediatrics, Charles R Drew University of Medicine and Science, Los Angeles, CA 90059, USA
3
Department of Family Medicine, University of California, Los Angeles, CA 90095, USA
*
Author to whom correspondence should be addressed.
Children 2020, 7(8), 80; https://0-doi-org.brum.beds.ac.uk/10.3390/children7080080
Submission received: 26 April 2020
/
Revised: 26 June 2020
/
Accepted: 20 July 2020
/
Published: 23 July 2020
(This article belongs to the Section Child Neurology)
Abstract
:Background: Racial minorities, particularly non-Hispanic blacks (NHBs) in the US, experience weaker effects from their families’ socioeconomic status on tangible outcomes, a pattern called the Minorities’ Diminished Returns (MDRs) theory. These MDRs are frequently shown in the effects of the families’ socioeconomic status (SES) on NHB adolescents’ school performance. As a result of these MDRs, NHB adolescents from high SES families show a worse than expected school performance. The existing knowledge is, however, minimal about the role of attention in explaining the diminished returns of the families’ SES with regard to the adolescents’ outcomes. Aim: To investigate the racial differences in the effects of the subjective family SES on adolescents’ attention, we compared non-Hispanic white (NHW) and NHB adolescents to assess the effect of the subjective family SES on adolescents’ attention. Methods: This was a cross-sectional analysis that included 4188 adolescents from the Adolescent Brain Cognitive Development (ABCD) Study. The independent variable was the subjective family SES. The primary outcome was the adolescents’ attention to be measured by the stop-signal task (SST). The attention domain of the Child Behavior Checklist (CBCL) was also measured. Results: Overall, a high subjective family SES was associated with a higher task-based and CBCL-based attention. Race showed statistically significant interactions with subjective family SES in terms of adolescents’ attention outcomes. These interactions suggested that a high subjective family SES has smaller tangible effects on increasing the attention of NHB than NHW adolescents. Conclusion: The boosting effect of subjective family SES on attention is diminished for NHB rather than NHW adolescents. To minimize the racial gap in attention-related behaviors, such as school performance, we need to address the diminished returns of resources in the lives of NHB families. Not only should we equalize SES, but also increase the marginal returns of SES for racial minorities, particularly NHB families. Such efforts require public policies that empower NHB families to better leverage their SES resources and turn them into tangible outcomes. In addition, social policies should directly aim to alter the societal barriers that limit NHB families’ ability to effectively utilize their resources. Discrimination, segregation, and racism should be targets of our policy solutions.
1. Introduction
Compared to non-Hispanic white (NHW) adolescents, racial minority adolescents, particularly non-Hispanic black (NHB) adolescents, are at an increased risk of school dropout and poor academic achievement [1]. As academic success in the earlier stages of life is a gateway to future economic development and health later in life [2,3,4,5], it is imperative to close the racial inequalities early in life if we wish to eliminate subsequent inequalities during adulthood [2,3,4,5].
Closely associated with race is family socioeconomic status (SES) [6,7,8]. Race and SES have combined effects on adolescents’ development and health outcomes [6,7,8]. This is mainly because both low SES and racial minority status reflect marginalization, economic adversities, stress, and financial difficulties [9,10,11,12]. One of the strongest social determinants of adolescents’ developmental, behavioral, and health outcomes, is family SES [13,14,15,16]. A high family SES is linked to a wide range of positive outcomes for adolescents across domains [13,14,15,16]. Regardless of the domain, studies have established a link between low SES and the risk of behavioral and health problems among adolescents [17,18,19]. High SES families have a higher investment and involvement in the lives of their adolescents [20,21,22]. Adolescents from high SES families are also sent to better schools which have more educational resources [23,24,25]. High SES adolescents also have access to a wide range of educational and stimulating resources in their homes [26]. Finally, high SES adolescents are being raised in environments which are low in stress [27,28,29,30,31]. All these factors have strong positive effects on adolescents’ development [32,33,34,35,36].
Subjective and objective measures of SES capture different aspects of SES [37]. While education, income, employment, marital status, and wealth reflect the objective elements of SES [38], there are aspects of SES that are not reflected in objective SES measures. Subjective SES reflects aspects such as the sufficiency of economic means, financial strains, and a sense of social status relative to others. Research has shown that subjective SES may have some effects on health that are not explained by objective SES [37,39,40,41,42,43]. For racial and ethnic minorities, subjective SES may even better explain the variance of some outcome than objective SES [44,45]. This is because objective SES may lose some of its protective effect for marginalized and racialized groups [46,47]. Thus, there is a need to study subjective SES indicators as well [45,48]. This is particularly important because most of the existing research is on objective rather than subjective SES indicators [49,50,51].
There are two approaches that researchers have taken to study the joint effects of family SES and race on adolescents’ outcomes. The first approach, a more traditional one, has tried to explain the racial gap in adolescents’ outcomes by a lower family SES of racial minority families such as NHBs [52,53,54,55]. In this view, family SES mediates (explains) the effects of race on adolescents’ outcomes [56,57,58]. As such, the belief is that enhancing family SES and closing the racial differences in SES through income redistribution policies, tax policies, and empowering racial minorities to secure gain income and accumulate wealth would be the primary strategy for ending the inequalities racial adolescents are subjected to [59,60].
The second strategy, however, proposes that SES has differential effects on adolescents’ outcomes across racial groups. The Minorities’ Diminished Returns (MDRs) theory [46,61] argues that, relative to NHWs, NHB adolescents show weaker effects from their family’s SES on their tangible outcomes. This view is supported by recent evidence suggesting that family SES indicators, such as parental education [62], family income [63,64], and marital status [65], generate more desired outcomes for NHW than NHB adolescents.
It is well established by the MDR literature that the education and income of own-self [66] and parents [67,68,69] generate unequal outcomes for diverse racial groups. NHBs may differ from NHWs in their opportunities to mobilize resources, navigate systems, and secure desirable outcomes in the presence of SES resources [61,63,68,70,71,72]. As a result of these MDRs, compared to their non-HW counterparts, NHBs with a high SES show worse than expected outcomes, despite their family SES [46,61,63,64,73].
Aims
To extend the existing knowledge on the combined effects of race and family SES on adolescents’ outcomes, we built this study on the MDRs literature and compared racial groups of adolescents for the effects of family SES on school performance. We expected weaker effects of family SES on adolescents’ attention, as a main predictor of school performance [30,74,75] for NHB than NHW adolescents.
2. Methods
2.1. Design
2.2. ABCD Sample & Sampling
In the ABCD study, participants were all adolescents aged between 9 and 10 years. The ABCD participants were recruited through a collaborative national effort that included 21 sites across various US states. The main source of recruitment in the ABCD study was schools [82]. In this analysis, we included 4188 participants. To be eligible for our analysis, the participants needed valid data on race, task-based attention, Child Behavior Checklist (CBCL)-based attention, and to be either NHB or NHW. The ABCD study sample is generalizable to the broader U.S. adolescent population [82].
2.3. Study Variables
Variables included race, age, sex, marital status, subjective family SES, and task-based and Child Behavior Checklist (CBCL)-based parental reports of adolescents’ attention.
2.3.1. Demographic Data
Sex, age, and parental marital status were the covariate and confounders in this study. Age was reported by the parents. Sex was 1 for males and 0 for females. Parental marital status was 1 for married and 0 for any other status.
2.3.2. Primary Outcome
Adolescents’ Attention. Attention in this study was measured using the stop-signal task (SST) [83]. In the ABCD, the SST included two runs of 180 trials. These trials showed images of a black arrows that were pointing to either the right or left. These images were displayed on a screen while the participants were in a scanner. Participants were instructed to click a button that would correspond to the direction of the arrow. They were asked to click as soon as they could see the image. They were all asked to use their dominant hand. Attention was measured as the total number of correct “Go” trials in a run. This variable was continuously a higher score, indicating a higher level of attention [84,85,86,87]. The stop-signal task is a commonly used indicator of adolescents’ attention. The SST is reliable and valid [88,89,90] and commonly used to measure attention [91,92,93]. How reliable this measure is across racial groups is still unknown.
2.3.3. Secondary Outcome
Parental Report of Adolescents’ Attention Problems. Attention problems were measured using the Achenbach System of Empirically Based Assessment (CBCL). Attention problems are the sixth domain of the CBCL measure [94]. The attention problem scale of the CBCL measure strongly correlates with the Diagnostic and Statistical Manual of Mental Disorders (DSM-IV-TR)-based diagnosis of ADHD [95]. The CBCL instrument relied on the parental reports form to screen for social, emotional, and behavioral problems of adolescents’ behaviors and problems. The CBCL is one of the most widely used measures of adolescents’ behavioral problems including those related to poor attention, and has been used for thousands of published papers [96]. Our variable was a continuous measure. For this measure, a high score was indicative of a higher attention problem.
2.3.4. Independent Variable
Subjective Family SES. This study measured subjective family SES using the following seven items. Participants were asked “In the past 12 months, has there been a time when you and your immediate family experienced any of the following:” (1) “Needed food but couldn’t afford to buy it or couldn’t afford to go out to get it?”, (2) “Were without telephone service because you could not afford it?”, (3) “Didn’t pay the full amount of the rent or mortgage because you could not afford it?”, (4) “Were evicted from your home for not paying the rent or mortgage?”, (5) “Had services turned off by the gas or electric company, or the oil company wouldn’t deliver oil because payments were not made?”, (6) “Had someone who needed to see a doctor or go to the hospital but didn’t go because you could not afford it?” and (7) “Had someone who needed a dentist but couldn’t go because you could not afford it?”. Responses were either 0 or 1. We calculated a mean score (a continuous measure), which ranged between 0 and 1 with a higher score, indicating a higher subjective family SES. Subjective family SES is an accepted SES indicator, as it reflects some aspects of the SES which are not captured by objective SES indicators [41,43,45,48,97,98,99]. Subjective SES is shown to have some health effects that are not seen with objective SES [37,39,40,43,45,48].
2.3.5. Moderator
Race. Race was self-identified and was recorded as 1 for NHBs and 0 for NHWs (reference category).
2.4. Statistics
We used the statistical package SPSS to perform our data analysis. A Pearson bivariate test was applied to test bivariate associations. For our multivariable analysis, linear regression models were used. We ran separate models for our two outcomes: task-based attention and a CBCL-based parental report of attention problems. Results were identical for the CBCL-attention (parental report) and task-based attention. Thus, the results for models predicting parental report of attention problems are not shown (because they are identical to the models predicting task-based attention). The results are available upon request. Our first models were applied in the overall sample. Our last two models were applied in each race. Model 1 was performed without the interaction terms. Model 2 added an interaction term between race/ethnicity and subjective family SES. Model 3 was performed in NHWs. Model 4 was performed in NHBs.
2.5. Ethics
Our paper was exempt from a full institutional review board (IRB) review, however, the original study (ABCD) was approved by the IRB board of the University of California, San Diego (UCSD). While adolescents and parents provided assent and consent [81], given the full de-identified nature of the data, our study was non-human subject research.
3. Results
3.1. Descriptives
This study included 4188 adolescents all between 9 and 10 years old. Most participants were NHWs (n = 2985; 71.3%) and a minority were NHBs (n = 1203; 28.7%). Table 1 can be consulted for a summary of the data in the pooled sample.
Table 2 shows a correlation matrix of all the study variables in the pooled sample and by race. NHB status was associated with a lower SES and lower attention. Task-based and CBCL-based attention were positively correlated. Family SES was positively correlated with both task-based and CBCL-based attention measures.
3.2. Multivariate Analysis (Pooled Sample)
Table 3 shows the results of two linear regression models in the overall (pooled) sample. Model 1 (main effect model) showed the protective effects of a high family SES on task-based attention. Model 2 (interaction model) showed a statistically significant interaction term between race and subjective family SES on task-based attention (b = 9.33, 95% CI = 0.36 to 18.31, p = 0.042), suggesting that the boosting effect of a high family SES on attention is weaker for NHB adolescents relative to their NHW counterparts (Table 3).
3.3. Race-Stratified Models
Table 4 presents the summary of the results of two linear regression models. These models were performed in racial groups. Model 3 showed a boosting effect of subjective family SES on the task-based attention of NHW adolescents. Model 4 did not show any effect of a high subjective family SES on attention for NHB adolescents. While b was 11.12 for HBWs (95% CI = 4.94 to 17.31, p < 0.001), it was only 1.55 for NHBs (95% CI =−5.81 to 8.92, p = 0.679). The difference between the b corrections was statistically significant, as shown by Model 2.
4. Discussion
Overall, a high subjective family SES was associated with higher task-based and CBCL-based attention. However, the boosting effect of the subjective family SES on adolescents’ attention is diminished for NHBs than NHWs. The magnitude of the difference seems large (b was 11.12 for HBWs (95% CI = 4.94 to 17.31, p < 0.001), but only 1.55 for NHBs (95% CI = −5.81 to 8.92, p = 0.679) and was significant, statistically and clinically.
The observed diminished return of the subjective family SES on attention for the NHB compared to NHW adolescents is similar to what the previous research suggested [66,70,100,101]. MDRs are shown for various SES resources, age and developmental groups, health and behavioral outcomes, as well as types of marginalizing identities [46,61]. Across SES resources, MDRs are shown for the family income [63], education level [66], employment status [102], as well as marital status [71]. All these show that family SES results in stronger health effects for NHWs than NHBs, and this is true for adolescents [63,64,73], adults [70], and older [103] adults. Regarding the type of marginalization, MDRs hold for NHB [64], Latino [66,104,105,106] Asian American [107], Native American [108], and sexual minority [100] people. For example, Cross’ work (2020) [109] has documented racial differences in the effects of family structure on youth health. She showed that the return of living in a two-biological-parent family is weaker for NHB adolescents than NHW adolescents.
MDRs are not due to a single cause but are the result of multilevel factors and processes that operate across macro, meso, and micro levels. These may include economic, societal, psychological, and even behavioral mechanisms that carry the indirect effects of race on outcomes, across all SES levels. These include many barriers that hinder NHB people’s access to and utilization of resources. As such, MDRs reflect how racism operates even when the family is of high SES backgrounds [46,47]. Exposure to racial prejudice is higher, not lower, in the life of high SES NHB families, and interferes with the gains that are expected to follow SES resources [110,111,112]. An increased exposure [113,114,115,116,117] and vulnerability [48] to racial discrimination in high SES NHB families reduces the effects of SES, given discrimination is a risk factor for many undesired outcomes and is shown to reduce the expected gains of SES [48,116,118]. In addition, as a result of childhood poverty, adulthood SES shows a weaker effect for NHB than NHW families [119].
Due to redlining, and social stratification, residential segregation has separated the lives of NHB and NHW families. Thus, high SES NHW and NHB people are exposed to different sets of environmental and contextual risk and protective factors. As a result of such segregation, schools that high SES NHB and NHW adolescents attend are qualitatively different [120,121,122]. When high SES NHB adolescents attend poor schools, they remain at a high risk of developing educational and behavioral problems [24]. High SES NHB families may face difficulties to move out of their original neighborhoods and find new areas that are distant from the communities they used to belong to. Similarly, high SES NHB people may remain at an increased economic risk compared to high SES NHWs [69,123]. In addition, high SES NHB families remain at risk of negative environmental and toxic exposures, a pattern which is absent for NHW families with similar SES [113,114,116,124,125,126,127,128]. Similarly, high SES NHB adolescents spend time with peers with higher risk and behavioral problems than NHW adolescents with the same level of SES [62,107].
MDRs reflect a specific type of disadvantage that is not the result of low SES at an individual- or a family- level. MDRs reflect how the society fails people who have high aspirations and make it to high SES categories, because of their racial minority status. Such groups still face challenges and disadvantages regardless of their SES and middle-class status [46,61]. These MDRs are reflective of systemic racism that generates unequal outcomes despite access to equal SES resources. Combined with the low SES that affects a large part of the NHB communities, these MDRs also impact another section of the NHB population. To address social, health, and behavioral inequalities, policymakers should not take a minimalistic approach and limit their programs and plans to increase the SES of NHB communities. While SES should be improved in impoverished areas, additional policies should specifically address inequalities that are influencing the lives of NHB people across all SES and class groups [46,47].
Several scholars such as Lacy [129], Feagin and Sikes [130], and Patillo-McCoy [131], have studied the life experiences of middle-class NHB families. Reviewing the work of the above-mentioned researchers suggests that middle-class NHB families experience their social class position differently from middle-class NHW families [131]. These may be in part due to an increases in vulnerability and exposure to discrimination [48].
5. Conclusions
When compared to their NHW counterparts, NHB adolescents show a lower level of task-based attention and a higher level of parental-report of attention problems. NHB adolescents also have a lower level of subjective family SES. These two adversities are also compounded with a weaker association between subjective family SES and attention in NHB than NHW adolescents. As a result of the latter relative disadvantage, NHB adolescents show low attention despite across all family SES levels. It is still unknown why high-SES NHB adolescents remain at risk of undesired outcomes.
Author Contributions
S.A. conceptual design, first draft, revision, approval: S.B., and M.B.: conceptual design, revision, and approval. All authors have read and agreed to the published version of the manuscript.
Funding
Shervin Assari is supported by the National Institutes of Health (NIH) grants 5S21MD000103, D084526-03, D084526-03, CA201415 02, DA035811-05, U54MD008149, U54MD007598, and U54CA229974. ABCD Funding.
Conflicts of Interest
This manuscript reflects the views of the authors and may not reflect the opinions or views of the NIH, its affiliated Institutes, Centers or offices, or ABCD consortium in-vestigators. The authors declare no conflict of interest.
Disclosure
The data used in the preparation of this article were obtained from the Adolescent Brain Cognitive Development (ABCD) study (https://abcdstudy.org) held in the NIMH Data Archive (NDA). This is a multisite, longitudinal study designed to recruit more than 10,000 children aged between 9 and 10 and follow them over 10 years into early adulthood. The ABCD study is supported by the National Institutes of Health and additional federal partners under award numbers U01DA041022, U01DA041028, U01DA041048, U01DA041089, U01DA041106, U01DA041117, U01DA041120, U01DA041134, U01DA041148, U01DA041156, U01DA041174, U24DA041123, and U24DA041147. A full list of supporters is available at https://abcdstudy.org/federal-partners.html. A listing of participating sites and a complete listing of the study investigators can be found at https://abcdstudy.org/Consortium_Members.pdf. ABCD consortium investigators designed and implemented the study and/or provided data but did not necessarily participate in the analysis or writing of this report. The ABCD data repository grows and changes over time. The ABCD data used in this report came from NIMH Data https://0-doi-org.brum.beds.ac.uk/10.15154/1412097.
References
- Bumpus, J.P.; Umeh, Z.; Harris, A.L. Social class and educational attainment: Do blacks benefit less from increases in parents’ social class status? Soc. Race Ethn. 2019, 6, 223–241. [Google Scholar] [CrossRef]
- Cohen, G.L.; Sherman, D.K. Stereotype threat and the social and scientific contexts of the race achievement gap. Am. Psychol. 2005, 60, 270–271, discussion 271–272. [Google Scholar] [CrossRef]
- Burchinal, M.; McCartney, K.; Steinberg, L.; Crosnoe, R.; Friedman, S.L.; McLoyd, V.; Pianta, R.; Nichd Early Child Care Research Network. Examining the Black-White achievement gap among low-income children using the NICHD study of early child care and youth development. Child. Dev. 2011, 82, 1404–1420. [Google Scholar] [CrossRef]
- Gorey, K.M. Comprehensive school reform: Meta-analytic evidence of Black-White achievement gap narrowing. Educ. Policy Anal. Arch. 2009, 17, 1–17. [Google Scholar] [CrossRef] [Green Version]
- Hair, N.L.; Hanson, J.L.; Wolfe, B.L.; Pollak, S.D. Association of child poverty, brain development, and academic achievement. JAMA Pediatr. 2015, 169, 822–829. [Google Scholar] [CrossRef]
- Valencia, M.L.C.; Tran, B.T.; Lim, M.K.; Choi, K.S.; Oh, J.K. Association between socioeconomic status and early initiation of smoking, alcohol drinking, and sexual behavior among Korean adolescents. Asia Pac. J. Public Health 2019, 31, 443–453. [Google Scholar] [CrossRef]
- Ahmad, A.; Zulaily, N.; Shahril, M.R.; Syed Abdullah, E.F.H.; Ahmed, A. Association between socioeconomic status and obesity among 12-year-old Malaysian adolescents. PLoS ONE 2018, 13, e0200577. [Google Scholar] [CrossRef] [Green Version]
- Merz, E.C.; Tottenham, N.; Noble, K.G. Socioeconomic status, amygdala volume, and internalizing symptoms in children and adolescents. J. Clin. Child Adolesc. Psychol. 2018, 47, 312–323. [Google Scholar] [CrossRef]
- Dismukes, A.; Shirtcliff, E.; Jones, C.W.; Zeanah, C.; Theall, K.; Drury, S. The development of the cortisol response to dyadic stressors in Black and White infants. Dev. Psychopathol. 2018, 30, 1995–2008. [Google Scholar] [CrossRef]
- Hanson, J.L.; Nacewicz, B.M.; Sutterer, M.J.; Cayo, A.A.; Schaefer, S.M.; Rudolph, K.D.; Shirtcliff, E.A.; Pollak, S.D.; Davidson, R.J. Behavioral problems after early life stress: Contributions of the hippocampus and amygdala. Biol. Psychiatry 2015, 77, 314–323. [Google Scholar] [CrossRef] [Green Version]
- Miller, B.; Taylor, J. Racial and socioeconomic status differences in depressive symptoms among black and white youth: An examination of the mediating effects of family structure, stress and support. J. Youth Adolesc. 2012, 41, 426–437. [Google Scholar] [CrossRef]
- DeSantis, A.S.; Adam, E.K.; Doane, L.D.; Mineka, S.; Zinbarg, R.E.; Craske, M.G. Racial/ethnic differences in cortisol diurnal rhythms in a community sample of adolescents. J. Adolesc. Health 2007, 41, 3–13. [Google Scholar] [CrossRef]
- Alvarado, S.E. The impact of childhood neighborhood disadvantage on adult joblessness and income. Soc. Sci. Res. 2018, 70, 1–17. [Google Scholar] [CrossRef]
- Barreto, S.M.; de Figueiredo, R.C.; Giatti, L. Socioeconomic inequalities in youth smoking in Brazil. BMJ Open 2013, 3, e003538. [Google Scholar] [CrossRef] [Green Version]
- Schreier, H.M.; Chen, E. Socioeconomic status and the health of youth: A multilevel, multidomain approach to conceptualizing pathways. Psychol. Bull. 2013, 139, 606–654. [Google Scholar] [CrossRef]
- Hemovich, V.; Lac, A.; Crano, W.D. Understanding early-onset drug and alcohol outcomes among youth: The role of family structure, social factors, and interpersonal perceptions of use. Psychol. Health Med. 2011, 16, 249–267. [Google Scholar] [CrossRef] [Green Version]
- Yelin, E.; Trupin, L.; Bunde, J.; Yazdany, J. Poverty, neighborhoods, persistent stress, and systemic lupus erythematosus outcomes: A qualitative study of the patients’ perspective. Arthritis Care Res. (Hoboken) 2019, 71, 398–405. [Google Scholar] [CrossRef]
- Harnett, N.G.; Wheelock, M.D.; Wood, K.H.; Goodman, A.M.; Mrug, S.; Elliott, M.N.; Schuster, M.A.; Tortolero, S.; Knight, D.C. Negative life experiences contribute to racial differences in the neural response to threat. Neuroimage 2019, 202, 116086. [Google Scholar] [CrossRef]
- Schulz, A.J.; Mentz, G.; Lachance, L.; Johnson, J.; Gaines, C.; Israel, B.A. Associations between socioeconomic status and allostatic load: Effects of neighborhood poverty and tests of mediating pathways. Am. J. Public Health 2012, 102, 1706–1714. [Google Scholar] [CrossRef]
- Cummings, J.R. Contextual socioeconomic status and mental health counseling use among US adolescents with depression. J. Youth Adolesc. 2014, 43, 1151–1162. [Google Scholar] [CrossRef] [Green Version]
- Takada, M.; Kondo, N.; Hashimoto, H.; Committee, J.S.D.M. Japanese study on stratification, health, income, and neighborhood: Study protocol and profiles of participants. J. Epidemiol 2014, 24, 334–344. [Google Scholar] [CrossRef] [PubMed] [Green Version]
- Nogueira, G.J.; Castro, A.; Naveira, L.; Nogueira-Antunano, F.; Natinzon, A.; Gigli, S.L.; Grossi, M.C.; Frugone, M.; Leofanti, H.; Marchesi, M. Evaluation of the higher brain functions in 1st and 7th grade schoolchildren belonging to two different socioeconomic groups. Rev. Neurol. 2005, 40, 397–406. [Google Scholar] [PubMed]
- Richards, M.; James, S.N.; Sizer, A.; Sharma, N.; Rawle, M.; Davis, D.H.J.; Kuh, D. Identifying the lifetime cognitive and socioeconomic antecedents of cognitive state: seven decades of follow-up in a British birth cohort study. BMJ Open 2019, 9, e024404. [Google Scholar] [CrossRef] [Green Version]
- Jefferson, A.L.; Gibbons, L.E.; Rentz, D.M.; Carvalho, J.O.; Manly, J.; Bennett, D.A.; Jones, R.N. A life course model of cognitive activities, socioeconomic status, education, reading ability, and cognition. J. Am. Geriatr. Soc. 2011, 59, 1403–1411. [Google Scholar] [CrossRef] [PubMed]
- Manly, J.J.; Jacobs, D.M.; Touradji, P.; Small, S.A.; Stern, Y. Reading level attenuates differences in neuropsychological test performance between African American and White elders. J. Int. Neuropsychol. Soc. 2002, 8, 341–348. [Google Scholar] [CrossRef] [PubMed]
- Larson, K.; Russ, S.A.; Nelson, B.B.; Olson, L.M.; Halfon, N. Cognitive ability at kindergarten entry and socioeconomic status. Pediatrics 2015, 135, e440–e448. [Google Scholar] [CrossRef] [Green Version]
- Vargas, T.; Rouhakhtar, P.J.R.; Schiffman, J.; Zou, D.S.; Rydland, K.J.; Mittal, V.A. Neighborhood crime, socioeconomic status, and suspiciousness in adolescents and young adults at Clinical High Risk (CHR) for psychosis. Schizophr. Res. 2020, 215, 74–80. [Google Scholar] [CrossRef]
- Gerra, G.; Benedetti, E.; Resce, G.; Potente, R.; Cutilli, A.; Molinaro, S. Socioeconomic status, parental education, school connectedness and individual socio-cultural resources in vulnerability for drug use among students. Int. J. Environ. Res. Public Health 2020, 17, 1306. [Google Scholar] [CrossRef] [Green Version]
- Rodriguez, J.M.; Karlamangla, A.S.; Gruenewald, T.L.; Miller-Martinez, D.; Merkin, S.S.; Seeman, T.E. Social stratification and allostatic load: Shapes of health differences in the MIDUS study in the United States. J. Biosoc. Sci. 2019, 51, 1–18. [Google Scholar] [CrossRef]
- Schibli, K.; Wong, K.; Hedayati, N.; D’Angiulli, A. Attending, learning, and socioeconomic disadvantage: Developmental cognitive and social neuroscience of resilience and vulnerability. Ann. NY Acad. Sci. 2017, 1396, 19–38. [Google Scholar] [CrossRef]
- Kelishadi, R.; Jari, M.; Qorbani, M.; Motlagh, M.E.; Ardalan, G.; Bahreynian, M.; Kasaeian, A.; Ahadi, Z.; Najafi, F.; Asayesh, H.; et al. Does the socioeconomic status affect the prevalence of psychiatric distress and violent behaviors in children and adolescents? The CASPIAN-IV study. Minerva Pediatr. 2017, 69, 264–273. [Google Scholar] [CrossRef] [PubMed]
- Poh, B.K.; Lee, S.T.; Yeo, G.S.; Tang, K.C.; Afifah, A.R.N.; Hanisa, A.S.; Parikh, P.; Wong, J.E.; Ng, A.L.O.; Group, S.S. Low socioeconomic status and severe obesity are linked to poor cognitive performance in Malaysian children. BMC Public Health 2019, 19, 541. [Google Scholar] [CrossRef] [Green Version]
- Karlsson, O.; De Neve, J.W.; Subramanian, S.V. Weakening association of parental education: Analysis of child health outcomes in 43 low- and middle-income countries. Int. J. Epidemiol. 2018, 48, 83–97. [Google Scholar] [CrossRef]
- Madhushanthi, H.J.; Wimalasekera, S.W.; Goonewardena, C.S.E.; Amarasekara, A.; Lenora, J. Socioeconomic status is a predictor of neurocognitive performance of early female adolescents. Int. J. Adolesc. Med. Health 2018. [Google Scholar] [CrossRef]
- Christensen, D.L.; Schieve, L.A.; Devine, O.; Drews-Botsch, C. Socioeconomic status, child enrichment factors, and cognitive performance among preschool-age children: Results from the follow-up of growth and development experiences study. Res. Dev. Disabil. 2014, 35, 1789–1801. [Google Scholar] [CrossRef] [PubMed] [Green Version]
- Bouthoorn, S.H.; Wijtzes, A.I.; Jaddoe, V.W.; Hofman, A.; Raat, H.; van Lenthe, F.J. Development of socioeconomic inequalities in obesity among Dutch pre-school and school-aged children. Obesity (Silver Spring) 2014, 22, 2230–2237. [Google Scholar] [CrossRef]
- Senn, T.E.; Walsh, J.L.; Carey, M.P. The mediating roles of perceived stress and health behaviors in the relation between objective, subjective, and neighborhood socioeconomic status and perceived health. Ann. Behav. Med. 2014, 48, 215–224. [Google Scholar] [CrossRef] [Green Version]
- Marmot, M. The Status Syndrome: How Social Standing Affects Our Health and Longevity; Bloomsbury Press: London, UK, 2004. [Google Scholar]
- Ursache, A.; Noble, K.G.; Blair, C. Socioeconomic status, subjective social status, and perceived stress: Associations with stress physiology and executive functioning. Behav. Med. 2015, 41, 145–154. [Google Scholar] [CrossRef] [Green Version]
- Manuck, S.B.; Phillips, J.E.; Gianaros, P.J.; Flory, J.D.; Muldoon, M.F. Subjective socioeconomic status and presence of the metabolic syndrome in midlife community volunteers. Psychosom. Med. 2010, 72, 35–45. [Google Scholar] [CrossRef] [Green Version]
- Wright, C.E.; Steptoe, A. Subjective socioeconomic position, gender and cortisol responses to waking in an elderly population. Psychoneuroendocrinology 2005, 30, 582–590. [Google Scholar] [CrossRef]
- Feldman, P.J.; Steptoe, A. How neighborhoods and physical functioning are related: the roles of neighborhood socioeconomic status, perceived neighborhood strain, and individual health risk factors. Ann. Behav. Med. 2004, 27, 91–99. [Google Scholar] [CrossRef] [PubMed]
- Moon, C. Subjective economic status, sex role attitudes, fertility, and mother’s work. Ingu Pogon Nonjip 1987, 7, 177–196. [Google Scholar] [PubMed]
- Assari, S.; Smith, J.L.; Saqib, M.; Bazargan, M. Binge drinking among economically disadvantaged african american older adults with diabetes. Behav. Sci. (Basel) 2019, 9, 97. [Google Scholar] [CrossRef] [Green Version]
- Assari, S.; Smith, J.; Mistry, R.; Farokhnia, M.; Bazargan, M. Substance use among economically disadvantaged african american older adults; objective and subjective socioeconomic status. Int. J. Environ. Res. Public Health 2019, 16, 1826. [Google Scholar] [CrossRef] [Green Version]
- Assari, S. health disparities due to diminished return among Black Americans: Public policy solutions. Soc. Issues Policy Rev. 2018, 12, 112–145. [Google Scholar] [CrossRef]
- Assari, S. Unequal gain of equal resources across racial groups. Int. J. Health Policy Manag. 2018, 7, 1–9. [Google Scholar] [CrossRef] [PubMed] [Green Version]
- Assari, S.; Preiser, B.; Lankarani, M.M.; Caldwell, C.H. Subjective socioeconomic status moderates the association between discrimination and depression in African American youth. Brain. Sci. 2018, 8, 71. [Google Scholar] [CrossRef] [Green Version]
- Link, B.G.; Phelan, J. The social shaping of health and smoking. Drug Alcohol. Depend. 2009, 104 (Suppl. 1), S6–S10. [Google Scholar] [CrossRef]
- Phelan, J.C.; Link, B.G.; Diez-Roux, A.; Kawachi, I.; Levin, B. "Fundamental causes" of social inequalities in mortality: A test of the theory. J. Health Soc. Behav. 2004, 45, 265–285. [Google Scholar] [CrossRef]
- Link, B.G.; Phelan, J. Social conditions as fundamental causes of disease. J. Health Soc. Behav. 1995, 35, 80–94. [Google Scholar] [CrossRef] [Green Version]
- Kaufman, J.S.; Cooper, R.S.; McGee, D.L. Socioeconomic status and health in blacks and whites: The problem of residual confounding and the resiliency of race. Epidemiology 1997, 8, 621–628. [Google Scholar] [CrossRef]
- Bell, C.N.; Sacks, T.K.; Thomas Tobin, C.S.; Thorpe, R.J., Jr. Racial non-equivalence of socioeconomic status and self-rated health among African Americans and Whites. SSM Popul. Health 2020, 10, 100561. [Google Scholar] [CrossRef] [PubMed]
- Samuel, L.J.; Roth, D.L.; Schwartz, B.S.; Thorpe, R.J.; Glass, T.A. Socioeconomic status, race/ethnicity, and diurnal cortisol trajectories in middle-aged and older adults. J. Gerontol. B. Psychol. Sci. Soc. Sci. 2018, 73, 468–476. [Google Scholar] [CrossRef] [PubMed] [Green Version]
- Fuentes, M.; Hart-Johnson, T.; Green, C.R. The association among neighborhood socioeconomic status, race and chronic pain in black and white older adults. J. Natl. Med. Assoc. 2007, 99, 1160–1169. [Google Scholar]
- Assari, S.; Khoshpouri, P.; Chalian, H. Combined effects of race and socioeconomic status on cancer beliefs, cognitions, and emotions. Healthcare (Basel) 2019, 7, 17. [Google Scholar] [CrossRef] [PubMed] [Green Version]
- Assari, S. Number of chronic medical conditions fully mediates the effects of race on mortality; 25-year follow-up of a nationally representative sample of Americans. J. Racial Ethn. Health Disparities 2017, 4, 623–631. [Google Scholar] [CrossRef]
- Assari, S. Distal, intermediate, and proximal mediators of racial disparities in renal disease mortality in the United States. J. Nephropathol. 2016, 5, 51–59. [Google Scholar] [CrossRef]
- Williams, D.R.; Costa, M.V.; Odunlami, A.O.; Mohammed, S.A. Moving upstream: How interventions that address the social determinants of health can improve health and reduce disparities. J. Public Health Manag. Pract. 2008, 14 (Suppl), S8–S17. [Google Scholar] [CrossRef]
- Williams, D.R. Race, socioeconomic status, and health the added effects of racism and discrimination. Ann. NY Acad. Sci. 1999, 896, 173–188. [Google Scholar] [CrossRef]
- Assari, S.; Boyce, S.; Bazargan, M.; Caldwell, C.H. Diminished returns of parental education in terms of youth school performance: Ruling out regression toward the mean. Children 2017, 7, 74. [Google Scholar] [CrossRef]
- Assari, S.; Caldwell, C.H.; Bazargan, M. Association between parental educational attainment and youth outcomes and role of race/ethnicity. JAMA Netw. Open 2019, 2, e1916018. [Google Scholar] [CrossRef] [PubMed] [Green Version]
- Assari, S.; Caldwell, C.H.; Mincy, R. Family socioeconomic status at birth and youth impulsivity at age 15; blacks’ diminished return. Children (Basel) 2018, 5, 58. [Google Scholar] [CrossRef] [PubMed] [Green Version]
- Assari, S.; Thomas, A.; Caldwell, C.H.; Mincy, R.B. Blacks’ diminished health return of family structure and socioeconomic status; 15 years of follow-up of a national urban sample of youth. J. Urban Health 2018, 95, 21–35. [Google Scholar] [CrossRef] [PubMed]
- Assari, S.; Bazargan, M. Being married increases life expectancy of white but not black Americans. J. Family Reprod Health 2019, 13, 132–140. [Google Scholar] [CrossRef]
- Assari, S.; Farokhnia, M.; Mistry, R. Education attainment and alcohol binge drinking: Diminished returns of hispanics in Los Angeles. Behav. Sci. (Basel) 2019, 9, 9. [Google Scholar] [CrossRef] [PubMed] [Green Version]
- Assari, S. Parental education attainment and educational upward mobility; role of race and gender. Behav. Sci. (Basel) 2018, 8, 107. [Google Scholar] [CrossRef] [PubMed] [Green Version]
- Assari, S. Parental educational attainment and mental well-being of college students; diminished returns of blacks. Brain Sci. 2018, 8, 193. [Google Scholar] [CrossRef] [PubMed] [Green Version]
- Assari, S. Parental education better helps white than black families escape poverty: National survey of children’s health. Economies 2018, 6, 30. [Google Scholar] [CrossRef] [Green Version]
- Assari, S. Blacks’ diminished return of education attainment on subjective health; mediating effect of income. Brain Sci. 2018, 8, 176. [Google Scholar] [CrossRef] [Green Version]
- Assari, S.; Caldwell, C.H.; Zimmerman, M.A. Family structure and subsequent anxiety symptoms; minorities’ diminished return. Brain Sci. 2018, 8, 97. [Google Scholar] [CrossRef] [Green Version]
- Assari, S.; Hani, N. Household income and children’s unmet dental care need; blacks’ diminished return. Dent. J. (Basel) 2018, 6, 17. [Google Scholar] [CrossRef] [PubMed] [Green Version]
- Assari, S.; Caldwell, C.H.; Mincy, R.B. Maternal educational attainment at birth promotes future self-rated health of white but not black youth: A 15-year cohort of a national sample. J. Clin. Med. 2018, 7, 93. [Google Scholar] [CrossRef] [PubMed] [Green Version]
- Jacques, T.; Seitz, A.R. Moderating effects of visual attention and action video game play on perceptual learning with the texture discrimination task. Vis. Res. 2020, 171, 64–72. [Google Scholar] [CrossRef] [PubMed]
- King, J.; Markant, J. Individual differences in selective attention and scanning dynamics influence children’s learning from relevant non-targets in a visual search task. J. Exp. Child Psychol. 2020, 193, 104797. [Google Scholar] [CrossRef]
- Alcohol Research: Current Reviews Editorial Staff. NIH’s Adolescent Brain Cognitive Development (ABCD) study. Alcohol. Res. 2018, 39, 97. [Google Scholar]
- Casey, B.J.; Cannonier, T.; Conley, M.I.; Cohen, A.O.; Barch, D.M.; Heitzeg, M.M.; Soules, M.E.; Teslovich, T.; Dellarco, D.V.; Garavan, H.; et al. The Adolescent Brain Cognitive Development (ABCD) study: Imaging acquisition across 21 sites. Dev. Cogn. Neurosci. 2018, 32, 43–54. [Google Scholar] [CrossRef] [PubMed]
- Karcher, N.R.; O’Brien, K.J.; Kandala, S.; Barch, D.M. Resting-state functional connectivity and psychotic-like experiences in childhood: Results from the Adolescent Brain Cognitive Development study. Biol. Psychiatry 2019, 86, 7–15. [Google Scholar] [CrossRef]
- Lisdahl, K.M.; Sher, K.J.; Conway, K.P.; Gonzalez, R.; Ewing, S.W.F.; Nixon, S.J.; Tapert, S.; Bartsch, H.; Goldstein, R.Z.; Heitzeg, M. Adolescent brain cognitive development (ABCD) study: Overview of substance use assessment methods. Dev. Cogn. Neurosci. 2018, 32, 80–96. [Google Scholar] [CrossRef]
- Luciana, M.; Bjork, J.M.; Nagel, B.J.; Barch, D.M.; Gonzalez, R.; Nixon, S.J.; Banich, M.T. Adolescent neurocognitive development and impacts of substance use: Overview of the adolescent brain cognitive development (ABCD) baseline neurocognition battery. Dev. Cogn. Neurosci. 2018, 32, 67–79. [Google Scholar] [CrossRef]
- Auchter, A.M.; Mejia, M.H.; Heyser, C.J.; Shilling, P.D.; Jernigan, T.L.; Brown, S.A.; Tapert, S.F.; Dowling, G.J. A description of the ABCD organizational structure and communication framework. Dev. Cogn. Neurosci. 2018, 32, 8–15. [Google Scholar] [CrossRef]
- Garavan, H.; Bartsch, H.; Conway, K.; Decastro, A.; Goldstein, R.Z.; Heeringa, S.; Jernigan, T.; Potter, A.; Thompson, W.; Zahs, D. Recruiting the ABCD sample: Design considerations and procedures. Dev. Cogn. Neurosci 2018, 32, 16–22. [Google Scholar] [CrossRef] [PubMed]
- Logan, G.D. On the ability to inhibit thought and action: A users’ guide to the stop signal paradigm. In Inhibitory Processes in Attention, Memory, and Language; Academic Press: Cambridge, MA, USA, 1994. [Google Scholar]
- Clark, S.V.; King, T.Z.; Turner, J.A. Cerebellar contributions to proactive and reactive control in the stop signal task: A systematic review and meta-analysis of functional magnetic resonance imaging studies. Neuropsychol. Rev. 2020. [Google Scholar] [CrossRef] [PubMed]
- Dupuis, A.; Indralingam, M.; Chevrier, A.; Crosbie, J.; Arnold, P.; Burton, C.L.; Schachar, R. Response time adjustment in the stop signal task: Development in children and adolescents. Child. Dev. 2019, 90, e263–e272. [Google Scholar] [CrossRef] [PubMed]
- Hiraoka, K.; Kinoshita, A.; Kunimura, H.; Matsuoka, M. Effect of variability of sequence length of go trials preceding a stop trial on ability of response inhibition in stop-signal task. Somatosens. Mot. Res. 2018, 35, 95–102. [Google Scholar] [CrossRef] [PubMed]
- Carver, A.C.; Livesey, D.J.; Charles, M. Age related changes in inhibitory control as measured by stop signal task performance. Int. J. Neurosci. 2001, 107, 43–61. [Google Scholar] [CrossRef]
- Congdon, E.; Mumford, J.A.; Cohen, J.R.; Galvan, A.; Canli, T.; Poldrack, R.A. Measurement and reliability of response inhibition. Front. Psychol. 2012, 3, 37. [Google Scholar] [CrossRef] [Green Version]
- Weafer, J.; Baggott, M.J.; de Wit, H. Test–retest reliability of behavioral measures of impulsive choice, impulsive action, and inattention. Exp. Clin Psychopharmacol. 2013, 21, 475–481. [Google Scholar] [CrossRef]
- Soreni, N.; Crosbie, J.; Ickowicz, A.; Schachar, R. Stop signal and conners’ continuous performance tasks: Test—Retest reliability of two inhibition measures in adhd children. J. Atten. Disord. 2009, 13, 137–143. [Google Scholar] [CrossRef]
- Quay, H.C. Inhibition and attention deficit hyperactivity disorder. J. Abnorm.Child Psychol. 1997, 25, 7–13. [Google Scholar] [CrossRef]
- Bari, A.; Robbins, T. Noradrenergic versus dopaminergic modulation of impulsivity, attention and monitoring behaviour in rats performing the stop-signal task. Psychopharmacology 2013, 230, 89–111. [Google Scholar] [CrossRef] [Green Version]
- Schachar, R.; Logan, G.D.; Robaey, P.; Chen, S.; Ickowicz, A.; Barr, C. Restraint and cancellation: Multiple inhibition deficits in attention deficit hyperactivity disorder. J. Abnorm. Child Psychol. 2007, 35, 229–238. [Google Scholar] [CrossRef] [PubMed]
- Association, A.P. Diagnostic and statistical manual of mental disorders (DSM-5®); American Psychiatric Pub: Washington, DC, USA, 2013. [Google Scholar]
- Achenbach, T.M.; Rescorla, L. Manual for the ASEBA School-Age Forms & Profiles: An Integrated System of Multi-Informant Assessment; Aseba Burlington, VT: Burlington, VT, USA, 2001. [Google Scholar]
- ASEBA® Web-Link™ ASEBA Overview. 2020. Available online: https://aseba.org/aseba-overview/ (accessed on 23 July 2020).
- Chen, E.; Paterson, L.Q. Neighborhood, family, and subjective socioeconomic status: How do they relate to adolescent health? Health Psychol. 2006, 25, 704–714. [Google Scholar] [CrossRef] [PubMed] [Green Version]
- Boe, T.; Petrie, K.J.; Sivertsen, B.; Hysing, M. Interplay of subjective and objective economic well-being on the mental health of Norwegian adolescents. SSM Popul. Health 2019, 9, 100471. [Google Scholar] [CrossRef] [PubMed]
- Ye, Z.; Wen, M.; Wang, W.; Lin, D. Subjective family socio-economic status, school social capital, and positive youth development among young adolescents in China: A multiple mediation model. Int. J. Psychol. 2020, 55, 173–181. [Google Scholar] [CrossRef] [PubMed]
- Assari, S. Education attainment and obesitydifferential returns based on sexual orientation. Behav. Sci. (Basel) 2019, 9, 16. [Google Scholar] [CrossRef] [Green Version]
- Assari, S. Family income reduces risk of obesity for white but not black children. Children (Basel) 2018, 5, 73. [Google Scholar] [CrossRef] [Green Version]
- Assari, S. Life expectancy gain due to employment status depends on race, gender, education, and their intersections. J. Racial Ethn. Health Disparities 2018, 5, 375–386. [Google Scholar] [CrossRef]
- Assari, S.; Lankarani, M.M. Education and alcohol consumption among older Americans; black-white differences. Front. Public Health 2016, 4, 67. [Google Scholar] [CrossRef] [Green Version]
- Shervin, A.; Ritesh, M. Diminished return of employment on ever smoking among hispanic whites in Los Angeles. Health Equity 2019, 3, 138–144. [Google Scholar] [CrossRef] [Green Version]
- Assari, S. Socioeconomic determinants of systolic blood pressure; minorities’ diminished returns. J. Health Econ. Dev. 2019, 1, 1–11. [Google Scholar]
- Assari, S. Socioeconomic status and self-rated oral health; diminished return among hispanic whites. Dent. J. (Basel) 2018, 6, 11. [Google Scholar] [CrossRef] [Green Version]
- Assari, S.; Boyce, S.; Bazargan, M.; Caldwell, C.H. Mathematical performance of American youth: Diminished returns of educational attainment of Asian-American parents. Educ. Sci. 2020, 10, 32. [Google Scholar] [CrossRef] [Green Version]
- Assari, S.; Bazargan, M. Protective effects of educational attainment against cigarette smoking; diminished returns of American Indians and Alaska Natives in the national health interview survey. Int. J. Travel Med. Glob. Health 2019, 7, 105–110. [Google Scholar] [CrossRef]
- Cross, C.J. Racial/ethnic differences in the association between family structure and children’s education. J. Marriage Fam. 2020, 82, 691–712. [Google Scholar] [CrossRef]
- Hudson, D.L.; Bullard, K.M.; Neighbors, H.W.; Geronimus, A.T.; Yang, J.; Jackson, J.S. Are benefits conferred with greater socioeconomic position undermined by racial discrimination among African American men? J. Mens Health 2012, 9, 127–136. [Google Scholar] [CrossRef] [Green Version]
- Hudson, D.L.; Neighbors, H.W.; Geronimus, A.T.; Jackson, J.S. The relationship between socioeconomic position and depression among a US nationally representative sample of African Americans. Soc Psychiatry Psychiatr. Epidemiol. 2012, 47, 373–381. [Google Scholar] [CrossRef] [Green Version]
- Hudson, D.; Sacks, T.; Irani, K.; Asher, A. The price of the ticket: Health costs of upward mobility among African Americans. Int. J. Environ. Res. Public Health 2020, 17, 1179. [Google Scholar] [CrossRef] [Green Version]
- Assari, S.; Gibbons, F.X.; Simons, R. Depression among black youth; interaction of class and place. Brain Sci. 2018, 8, 108. [Google Scholar] [CrossRef] [Green Version]
- Assari, S.; Gibbons, F.X.; Simons, R.L. Perceived discrimination among black youth: An 18-year longitudinal study. Behav. Sci. (Basel) 2018, 8, 44. [Google Scholar] [CrossRef] [Green Version]
- Assari, S. Does school racial composition explain why high income black youth perceive more discrimination? A gender analysis. Brain Sci. 2018, 8, 140. [Google Scholar] [CrossRef] [Green Version]
- Assari, S.; Lankarani, M.M.; Caldwell, C.H. Does discrimination explain high risk of depression among high-income African American men? Behav. Sci. (Basel) 2018, 8, 40. [Google Scholar] [CrossRef] [Green Version]
- Assari, S.; Moghani Lankarani, M. Workplace racial composition explains high perceived discrimination of high socioeconomic status African American men. Brain Sci. 2018, 8, 139. [Google Scholar] [CrossRef] [Green Version]
- Assari, S.; Caldwell, C.H. Social determinants of perceived discrimination among black youth: Intersection of ethnicity and gender. Children (Basel) 2018, 5, 24. [Google Scholar] [CrossRef] [Green Version]
- Bartik, T.J.; Hershbein, B. Degrees of poverty: The relationship between family income background and the returns to education. SSRN Electron. J. 2018. [Google Scholar] [CrossRef] [Green Version]
- Assari, S. Parental educational attainment and academic performance of american college students; blacks’ diminished returns. J. Health Econ. Dev. 2019, 1, 21–31. [Google Scholar]
- Assari, S.; Caldwell, C.H. Parental educational attainment differentially boosts school Performance of American adolescents: Minorities’ diminished returns. J. Fam. Reprod Health 2019, 13, 7–13. [Google Scholar] [CrossRef]
- Assari, S.; Boyce, S.; Bazargan, M.; Caldwell, C.H. A dream deferred: African American women’s diminished socioeconomic returns of postponing childbearing from teenage to adulthood. Reprod. Med. 2020, 1, 62–76. [Google Scholar] [CrossRef]
- Assari, S.; Preiser, B.; Kelly, M. Education and income predict future emotional well-being of whites but not blacks: A ten-year cohort. Brain Sci. 2018, 8, 122. [Google Scholar] [CrossRef] [Green Version]
- Assari, S.; Bazargan, M. Second-hand exposure home second-hand smoke exposure at home in the United States; minorities’ diminished returns. Int. J. Travel Med. Glob. Health 2019, 7, 135–141. [Google Scholar] [CrossRef]
- Assari, S.; Bazargan, M. Unequal effects of educational attainment on workplace exposure to second-hand smoke by race and ethnicity; minorities’ diminished returns in the National Health Interview Survey (NHIS). J. Med. Res. Innov. 2019, 3. [Google Scholar] [CrossRef]
- Assari, S.; Boyce, S.; Caldwell, C.H.; Bazargan, M.; Mincy, R. Family income and gang presence in the neighborhood: Diminished returns of black families. Urban Sci. 2020, 4, 29. [Google Scholar] [CrossRef] [PubMed]
- Assari, S. Race, intergenerational social mobility and stressful life events. Behav Sci. (Basel) 2018, 8, 86. [Google Scholar] [CrossRef] [PubMed] [Green Version]
- Assari, S.; Bazargan, M. Unequal associations between educational attainment and occupational stress across racial and ethnic groups. Int. J. Environ. Res. Public Health 2019, 16, 3539. [Google Scholar] [CrossRef] [Green Version]
- Lacy, K.R. Blue-Chip Black: Race, Class, and Status in the New Black Middle Class, 1st ed.; University of California Press: Berkeley, CA, USA, 2007. [Google Scholar]
- Feagin, J.R.; Sikes, M.P. How black students cope with racism on white campuses. J. Blacks High. Educ. 1995, 91–97. [Google Scholar] [CrossRef]
- Pattillo, M. Black Picket Fences: Privilege and Peril among the Black Middle Class, 2nd ed.; University of Chicago Press: Chicago, IL, USA, 2013. [Google Scholar]
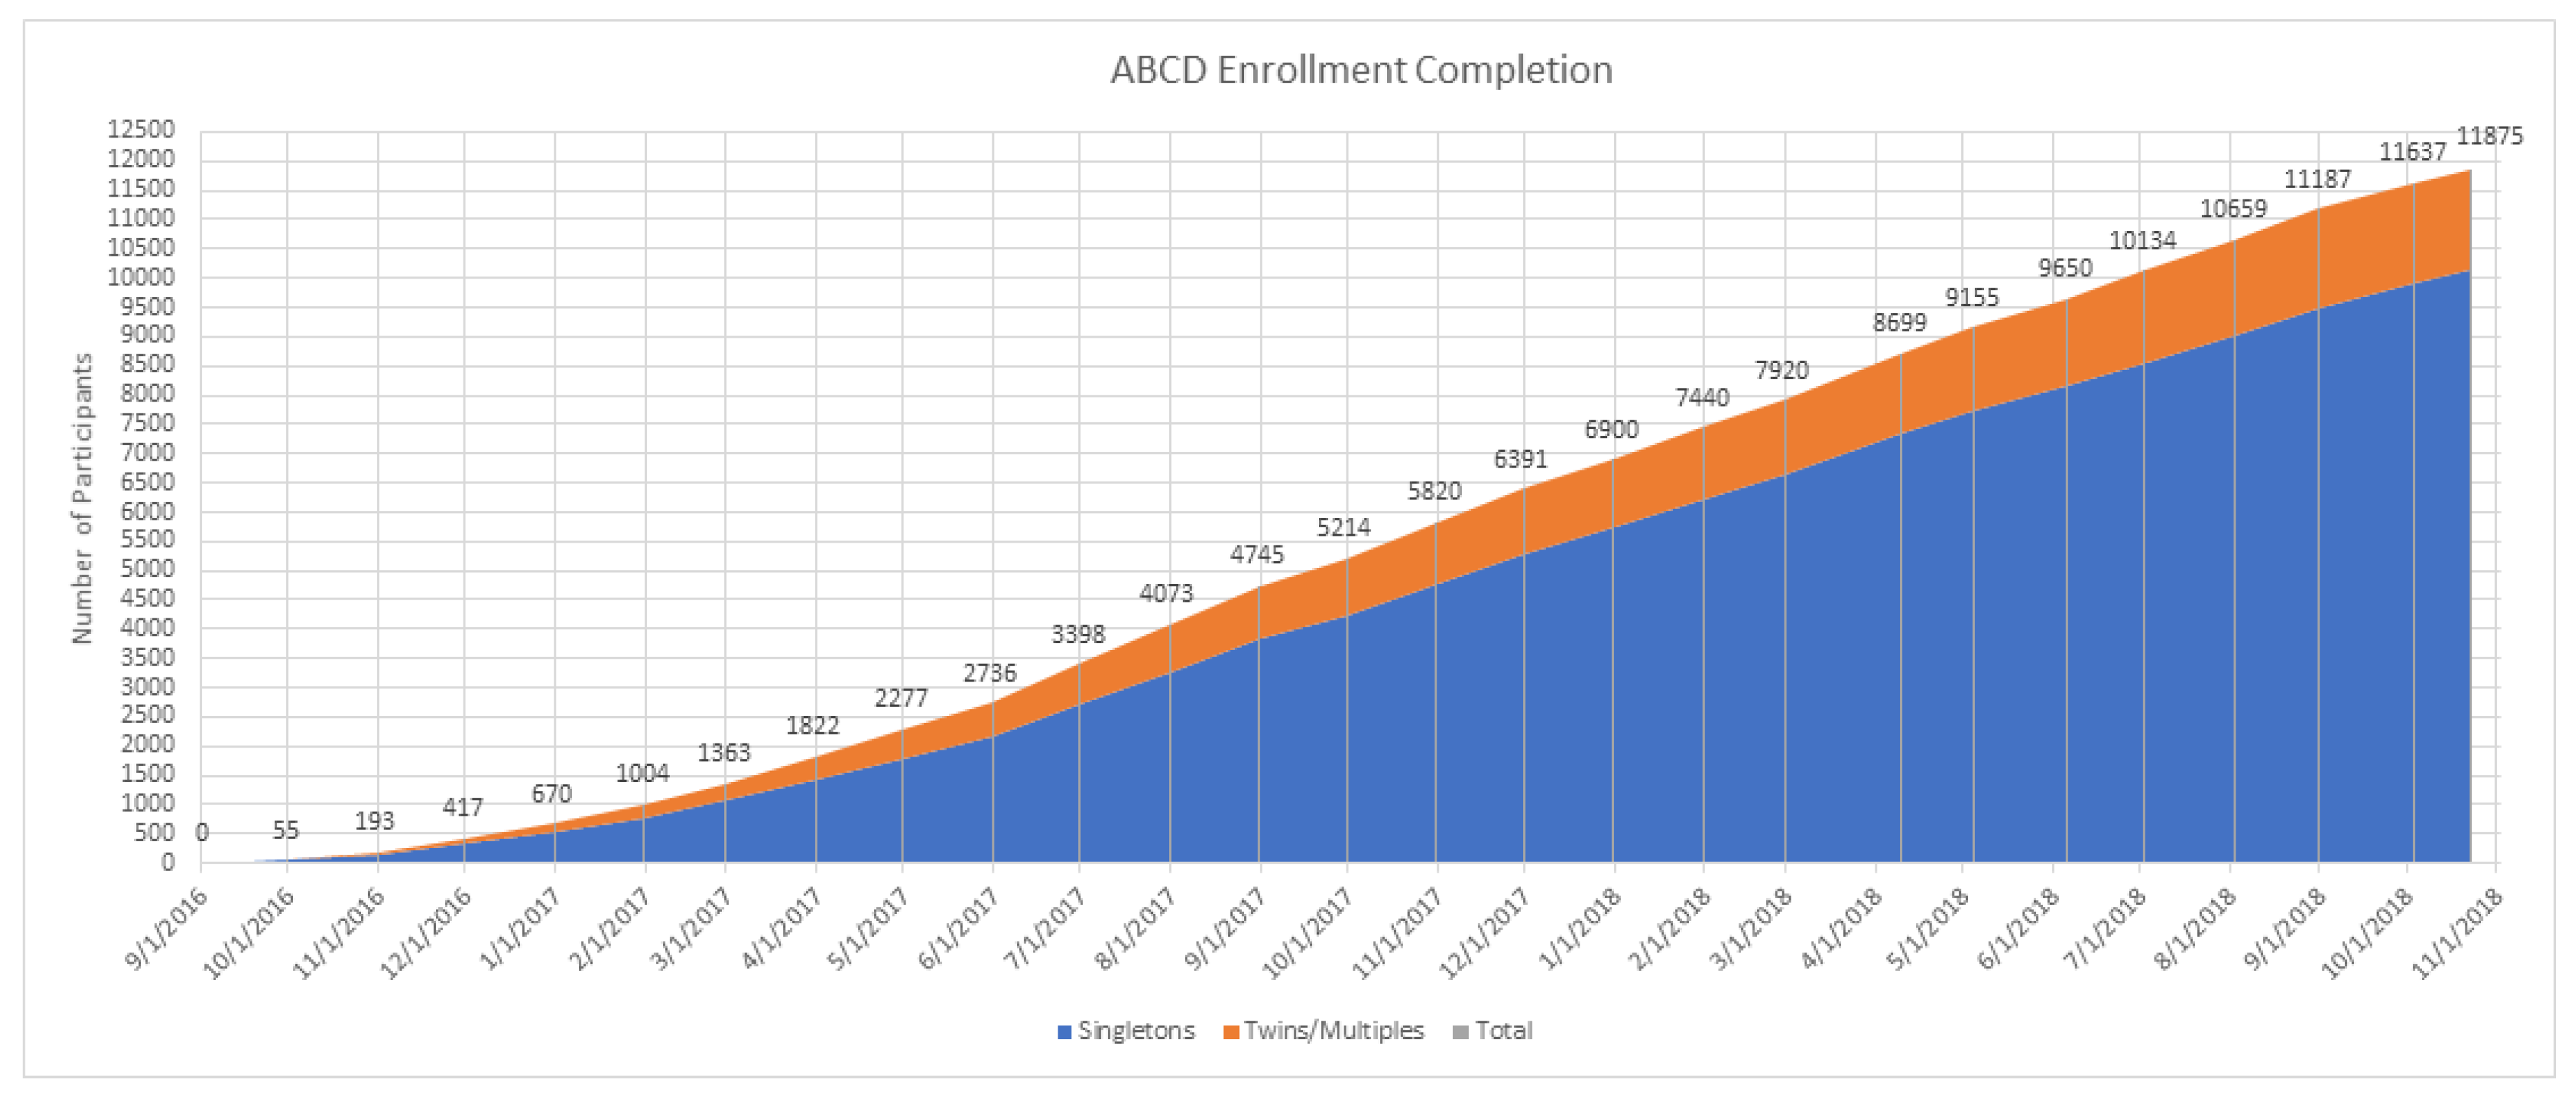
Figure 1.
Enrolment to the Adolescent Brain Cognitive Development (ABCD) Study.


Table 1.
Socio-demographic data overall (n = 4188).
| n | % | |
|---|---|---|
| Race | ||
| NHWs | 2985 | 71.3 |
| NHBs | 1203 | 28.7 |
| Sex | ||
| Male | 2026 | 48.4 |
| Female | 2162 | 51.6 |
| Marital Status | ||
| Not Married | 1323 | 31.6 |
| Married | 2865 | 68.4 |
| Mean | SD | |
| Age (Year) | 9.45 | 0.50 |
| Subjective Family SES (0–1, High) | 0.93 | 0.16 |
| Attention CBCL (0–37, Poor Attention) | 31.61 | 5.40 |
| Attention-Task (0–150, High Attention) | 122.95 | 22.71 |
CBCL = Child Behavior Checklist; SD = standard deviation; SES = socioeconomic status; NHBs = non-Hispanic blacks; NHWs = non-Hispanic whites.
Table 2.
Correlations between the study variables (n = 4188).
| 1 | 2 | 3 | 4 | 5 | 6 | 7 | |
|---|---|---|---|---|---|---|---|
| All | |||||||
| 1 Race (NHB) | 1 | −0.02 | 0.01 | −0.51 ** | −0.30 ** | 0.04 ** | −0.16 ** |
| 2 Sex (Male) | 1 | 0.03 | 0.00 | −0.02 | 0.15 ** | −0.01 | |
| 3 Age | 1 | 0.00 | −0.02 | 0.00 | 0.11 ** | ||
| 4 Married | 1 | 0.31 ** | −0.11 ** | 0.13 ** | |||
| 5 Subjective Family SES (High) | 1 | −0.20 ** | 0.09 ** | ||||
| 6 Attention Problems—CBCL (Poor) | 1 | −0.11 ** | |||||
| 7 Attention—Task (Good) | 1 | ||||||
| NHWs | |||||||
| 2 Sex (Male) | 1 | 0.03 | −0.02 | −0.02 | 0.15 ** | −0.02 | |
| 3 Age | 1 | −0.01 | −0.01 | 0.00 | 0.13 ** | ||
| 4 Married | 1 | 0.24 ** | −0.12 ** | 0.05 ** | |||
| 5 Subjective Family SES (High) | 1 | −0.20 ** | 0.08 ** | ||||
| 6 Attention Problems—CBCL (Poor) | 1 | −0.11 ** | |||||
| 7 Attention—Task (Good) | 1 | ||||||
| NHBs | |||||||
| 2 Sex (Male) | 1 | 0.03 | 0.01 | −0.03 | 0.17 ** | −0.01 | |
| 3 Age | 1 | 0.04 | −0.04 | −0.00 | 0.08 ** | ||
| 4 Married | 1 | 0.16 ** | −0.07 * | 0.04 | |||
| 5 Subjective Family SES (High) | 1 | −0.20 ** | 0.02 | ||||
| 6 Attention Problems—CBCL (Poor) | 1 | −0.09 ** | |||||
| 7 Attention—Task (High) | 1 |
* p < 0.05; ** p < 0.01. SES = socioeconomic status; NHBs = non-Hispanic blacks; NHWs = non-Hispanic whites; CBCL = Child Behavior Checklist.
Table 3.
Summary of linear regressions overall (n = 4188).
| Model 1 Main Effects | Model 2 Interaction Effects | |||||||||
|---|---|---|---|---|---|---|---|---|---|---|
| b | SE | 95% CI | p | b | SE | 95% CI | p | |||
| Race (NHBs) | −6.61 | 0.90 | −8.37 | −4.85 | <0.001 | −7.45 | 0.99 | −9.38 | −5.51 | <0.001 |
| Sex (Male) | −0.84 | 0.69 | −2.19 | 0.51 | 0.223 | −0.83 | 0.69 | −2.18 | 0.52 | 0.226 |
| Age | 5.01 | 0.68 | 3.67 | 6.35 | <0.001 | 5.00 | 0.68 | 3.66 | 6.34 | <0.001 |
| Married household | 2.29 | 0.88 | 0.56 | 4.01 | 0.009 | 2.15 | 0.88 | 0.42 | 3.88 | 0.015 |
| Subjective family SES (High) | −5.68 | 2.31 | −10.21 | −1.15 | 0.014 | −11.03 | 3.50 | −17.89 | −4.18 | 0.002 |
| Subjective family SES (High) × NHBs | - | - | - | - | - | 9.33 | 4.58 | 0.36 | 18.31 | 0.042 |
| Intercept | 76.73 | 6.50 | 63.99 | 89.47 | <0.001 | 77.17 | 6.50 | 64.43 | 89.91 | <0.001 |
B = regression coefficient; CI = confidence interval; SE = standard error; SES = socioeconomic status.
Table 4.
Linear regression models by race (n = 4188).
| Model 3 NHWs | Model 4 NHBs | |||||||||
|---|---|---|---|---|---|---|---|---|---|---|
| b | SE | 95% CI | p | b | SE | 95% CI | p | |||
| Male | −0.89 | 0.73 | −2.32 | 0.53 | 0.221 | −0.69 | 1.58 | −3.80 | 2.42 | 0.663 |
| Age | 5.31 | 0.72 | 3.89 | 6.73 | <0.001 | 4.24 | 1.55 | 1.20 | 7.28 | 0.006 |
| Married household | 2.03 | 1.01 | 0.06 | 4.01 | 0.044 | 2.37 | 1.73 | −1.03 | 5.77 | 0.171 |
| Subjective family SES (High) | 11.12 | 3.15 | 4.94 | 17.31 | <0.001 | 1.55 | 3.75 | −5.81 | 8.92 | 0.679 |
| Intercept | 74.35 | 6.92 | 60.78 | 87.92 | <0.001 | 76.73 | 14.63 | 48.02 | 105.44 | <0.001 |
B = regression coefficient; CI = confidence interval; SES = socioeconomic status SE = standard error; CI = confidence interval.
© 2020 by the authors. Licensee MDPI, Basel, Switzerland. This article is an open access article distributed under the terms and conditions of the Creative Commons Attribution (CC BY) license (http://creativecommons.org/licenses/by/4.0/).
Share and Cite
MDPI and ACS Style
Assari, S.; Boyce, S.; Bazargan, M. Subjective Family Socioeconomic Status and Adolescents’ Attention: Blacks’ Diminished Returns. Children 2020, 7, 80. https://0-doi-org.brum.beds.ac.uk/10.3390/children7080080
AMA Style
Assari S, Boyce S, Bazargan M. Subjective Family Socioeconomic Status and Adolescents’ Attention: Blacks’ Diminished Returns. Children. 2020; 7(8):80. https://0-doi-org.brum.beds.ac.uk/10.3390/children7080080
Chicago/Turabian StyleAssari, Shervin, Shanika Boyce, and Mohsen Bazargan. 2020. "Subjective Family Socioeconomic Status and Adolescents’ Attention: Blacks’ Diminished Returns" Children 7, no. 8: 80. https://0-doi-org.brum.beds.ac.uk/10.3390/children7080080
Note that from the first issue of 2016, this journal uses article numbers instead of page numbers. See further details here.