
Application of the EGSB-CMBR Process to High-Concentration Organic Wastewater Treatment

1
Guangxi Key Laboratory of Environmental Pollution Control Theory and Technology, College of Environmental Science and Engineering, Guilin University of Technology, Guilin 541004, China
2
Guangxi Collaborative Innovation Center for Water Pollution Control and Water Safety in Karst Area, Guilin University of Technology, Guilin 541004, China
3
College of Civil Engineering and Architecture, Guilin University of Technology, Guilin 541004, China
*
Authors to whom correspondence should be addressed.
Processes 2022, 10(5), 1039; https://0-doi-org.brum.beds.ac.uk/10.3390/pr10051039
Submission received: 15 April 2022
/
Revised: 16 May 2022
/
Accepted: 20 May 2022
/
Published: 23 May 2022
Abstract
:To decrease the cost of wastewater treatment at the plant, the Wuzhou Shenguan Protein Enteric Coating Production Plant designed and built an expanded granular sludge bed (EGSB)-ceramic membrane bioreactor reactor (CMBR) process for treating high-concentration organic wastewater with a capacity of 25 m3/d. The EGSB is divided into anaerobic and microaerobic sections. The purpose of the anaerobic section is to substantially degrade COD, and the main functions of the microaerobic section are to coordinate the relationship between hydrolytic acid-producing bacteria, methanogenic bacteria (MBP), and sulfate-reducing bacteria (SRB) and to mitigate the inhibitory effects between them to simultaneously remove COD and sulfate. Anaerobic ammonia-oxidizing bacteria were added to the CMBR reactor to remove both COD and ammonia nitrogen. The results of the operation showed that more than 99% of the COD was removed by the EGSB-CMBR process, while the removal rates of NH4+-N and SS were greater than 70% and 90%, respectively. In addition, the effluent met the requirements of the secondary standard of the Comprehensive Wastewater Discharge Standard (8978-1996). Economic and technical analyses showed that the modified EGSB-CMBR reactor has a high treatment efficiency, which greatly saves on the cost of the “commissioned treatment” of high-concentration organic waste liquid in the plant. Specifically, it can save more than 800,000 CNY for the plant annually.

1. Introduction
The Wuzhou Shenguan factory is the largest manufacturer of collagen-derived enteric coating in Asia. A small amount of high-concentration organic wastewater is generated by the curing and rinsing processes during the manufacture of these collagen protein casings, and it is discharged intermittently during the production process. This wastewater is typically high-COD salt-containing food wastewater with unstable water quality and quantity, a high concentration of organic pollutants, complex composition, a poor conventional biochemical treatment effect, and great difficulty in treatment [1]. Initially, the plant commissioned an external party to treat this part of the high-concentration organic wastewater. In recent years, with the expansion of the production scale of the plant, the emission of high-concentration organic wastewater has increased dramatically, and treating this wastewater is expensive. To decrease operating costs, the plant is considering renovating an existing wastewater treatment facility to absorb high-concentration organic wastewater [2,3].
Compared with the traditional physical and chemical methods, the biological method has low energy consumption and is not easy to produce secondary pollution. Therefore, it has become one of the most common water treatment technologies at present [4]. Anaerobic nitrification is a typical biological water treatment technology, which has the advantages of high removal efficiency and low energy consumption [5]. Ordinary digesters are the first generation of anaerobic bioreactors, but they have a large areal footprint and high energy consumption. The second generation of anaerobic biological treatment processes is based on the theory of increasing the biomass in the treatment equipment to enhance the mass transfer effect [6], such as anaerobic filters (AFs) [7] and up-flow anaerobic sludge beds (UASBs) [8]. These reactors are smaller and consume much less energy than the first-generation bioreactors, but they also have disadvantages, such as a complex structure, inadequate sludge–water mixing, and susceptibility to toxic effects. To resolve these issues, the reactor hydraulic load must be increased; thus, a third-generation anaerobic process has emerged that uses effluent return technologies, such as EGSBs [9] and anaerobic internal circulation reactors (ICs) [10]. EGSBs are modified UASB reactors [11], and because of their thin, tall reaction structures, they inherit the advantages of a small footprint and low energy consumption of UASB reactors. Effluent reflux technology is used to increase the hydraulic load of the reactor and dilute the concentration of substrate and toxic substances entering the reactor to decrease its inhibitory effects and toxicity to microorganisms. At the same time, refluxing increases the contact between wastewater and sludge; increases the mass transfer; and effectively solves the problems of short flow, dead space, and clogging common in UASBs. This enables the EGSB reactor to maintain a high removal rate for low-concentration organic wastewater under low-temperature conditions [12,13]. Under high-hydraulic loading conditions, the granular sludge has large particles (3 to 4 mm), as well as good coalescence and settling performance, with a particle settling velocity up to 60–80 m/h [14].
Although the bioreactor has the characteristics of high efficiency and low energy consumption, the loss of sludge in the reactor leads to incomplete wastewater treatment, affects the treatment effect of the reactor, and produces a large amount of residual sludge, which increases the cost of the subsequent sludge treatment and disposal. Meanwhile, membrane bioreactors (MBRs) combine biodegradation in an activated sludge system with physical membrane filtration in a single reactor, replace the sedimentation tank with a membrane module, occupy a small area, and resolve the issue of serious biomass loss with traditional bioreactors while also improving the nitrification and decreasing sludge production [15,16]. They also improve the reactor effluent quality and, thus, have been considered one of the most promising biological wastewater treatment technologies [17]. The core components of the MBR process are the membrane modules. When these membranes are made of inorganic ceramic materials fired at high temperatures, they have the advantages of high chemical stability, acid and alkali resistance, and long lifetimes [18]. This is called the ceramic plate membrane bioreactor process (CMBR), and it has obvious advantages in treating industrial wastewater with complex water composition or high concentrations [19].
In this study, we consider modifying the existing wastewater treatment facilities in the plant and developing a high-efficiency EGSB anaerobic reactor based on the injection of biological carriers (mainly activated carbon, iron salts, etc.) to increase the biomass. For the EGSB reactor, high-performance granular sludge must be cultivated for its rapid start-up and efficient operation. The cultivation of a large amount of granular sludge is an important sign of the successful start-up of an EGSB reactor; thus, the commissioning process described herein focused on observing the formation process of granular sludge in an EGSB reactor. The effectiveness of the combined EGSB-CMBR process in removing organic matter from the high-concentration organic waste stream generated in the plant was analyzed, and an economic cost/benefit analysis was carried out.
2. Materials and Methods
2.1. Water Volumes and Water Quality
The amount of high-concentration organic wastewater generated in the plant is approximately 25 m3/d. The raw water quality is shown in Table 1. The industrial park where the plant is located has a wastewater treatment plant. Therefore, the water-saving “Sewage Comprehensive Emission Standard” (8978-1996) Secondary Standard was implemented to evaluate the water quality.
2.2. Analytical Methods
COD, NH4+-N, and SS were determined by the national standard analytical methods [20]. The sludge settlement ratio (SV30), mixed liquid suspended solids concentration (MLSS), and mixed liquid volatile suspension solids concentration (MLVSS) were measured by the standard methods. The average particle size measurement refers to the measurement method of Long et al. [21].
2.3. Inoculating Sludge and Starting Method
The inoculated sludge for EGSB was obtained from anaerobic-activated sludge from the UASB reactor of a citric acid plant in Shandong. This activated sludge is flocculated sludge, and the mixed liquor volatile suspended solid (MLVSS)/mixed liquor suspended solid (MLSS) of the activated sludge was 0.49. Biological carriers and iron salts were added to the EGSB reactor during the operation to increase the biomass, and the dosage was approximately 10% of the effective reactor volume. The EGSB anaerobic section was controlled below 0.1 mg/L, the EGSB microaerobic section was controlled below 0.5 mg/L, and the sludge was tamed by gradually increasing the reactor water intake. For CMBR [22], the inoculated sludge was the activated sludge from a wastewater treatment plant in Wuzhou. The initial sludge concentration was set at 5 g/L.
2.4. Process Flow Diagrams
To reduce the cost of this civil engineering project, the original organic wastewater storage tank was converted into an EGSB-CMBR reactor (Figure 1).
2.4.1. EGSB
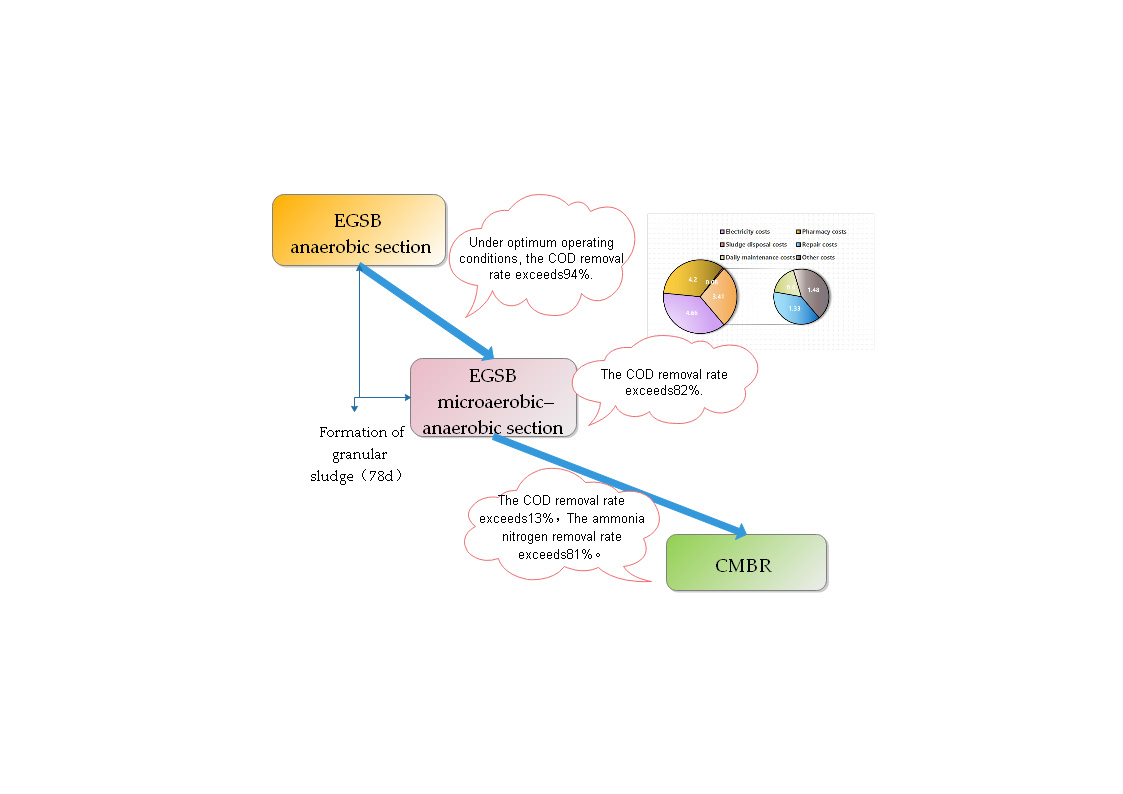
The EGSB section is divided into an anaerobic section and a microaerobic–anaerobic section. The original 5 tandem organic wastewater storage tanks were converted into tanks for the EGSB anaerobic section (tanks #1–5). The bodies of these cylindrical tanks are made of extra-thick reinforced glass steel. Each tank has dimensions of (D × H) = 2.5 m × 5 m, and a stirrer is set at the top. Dissolved oxygen is controlled below 0.1 mg/L. The treatment unit mainly removes grease, suspended solids, etc. The high-concentration wastewater degrades large-molecule organic matter into small-molecule organic matter and ensures the normal operation of the subsequent treatment facilities. The volume of the EGSB micro-oxygen anaerobic section should be equal to that of the previous EGSB anaerobic section, which is modified by the remaining 5 organic waste stream storage tanks (tanks #6–10). The top of these tanks is equipped with a mixer, and the dissolved oxygen is controlled below 0.5 mg/L. This unit mainly generates methane from small and medium molecules of organic matter in wastewater by anaerobic fermentation while oxidizing the anaerobically produced H2S into singlet sulfur.
2.4.2. CMBR
The CMBR reactor is a reinforced concrete structure with dimensions of (L × B × H) = 4 m × 5 m × 3 m. The dissolved oxygen in the tank is controlled below 1 mg/L, and anaerobic ammonia-oxidizing bacteria (AOB) and denitrifying sludge are added to enhance the denitrification treatment. This unit mainly functions as follows: The effluent of the microaerobic EGSB section enters the conditioning tank as the feed water for CMBR, and the organic matter in the effluent is gradually decomposed and retained under the action of the membrane module and microorganisms; inoculated anammox bacteria can effectively remove ammonia nitrogen from wastewater [23].
3. Results and Discussion
3.1. Operational Effect of the EGSB Reactor in the Commissioning Stage
The proportion of newly inoculated sludge is small. According to the research of Faria et al., the excessively fast liquid-rising flow rate in the EGSB reactor can easily lead to the loss of microorganisms and cause the reactor efficiency to decrease or even fail to start [24]. Therefore, the rising flow rate of liquid in the reactor is only 1 m/h during the start-up period of the reactor. The EGSB reactor is started up by an intermittent pulsed water feed. On the one hand, this pulsed water increases the rising speed of the reaction zone and improves the mass transfer, and on the other hand, it can evenly distribute the organic load and enhance the stability of the system. After the successful start-up of the EGSB reactor, the sludge was then tamed by gradually increasing the influent volume, and the system operation conditions were adjusted according to the inlet and outlet water qualities. Finally, after 120 days of commissioning, the system operated stably and reached the designed treatment capacity of 25 m3/d. In addition, the effluent quality met the secondary standard of the Comprehensive Wastewater Discharge Standard (8978-1996).
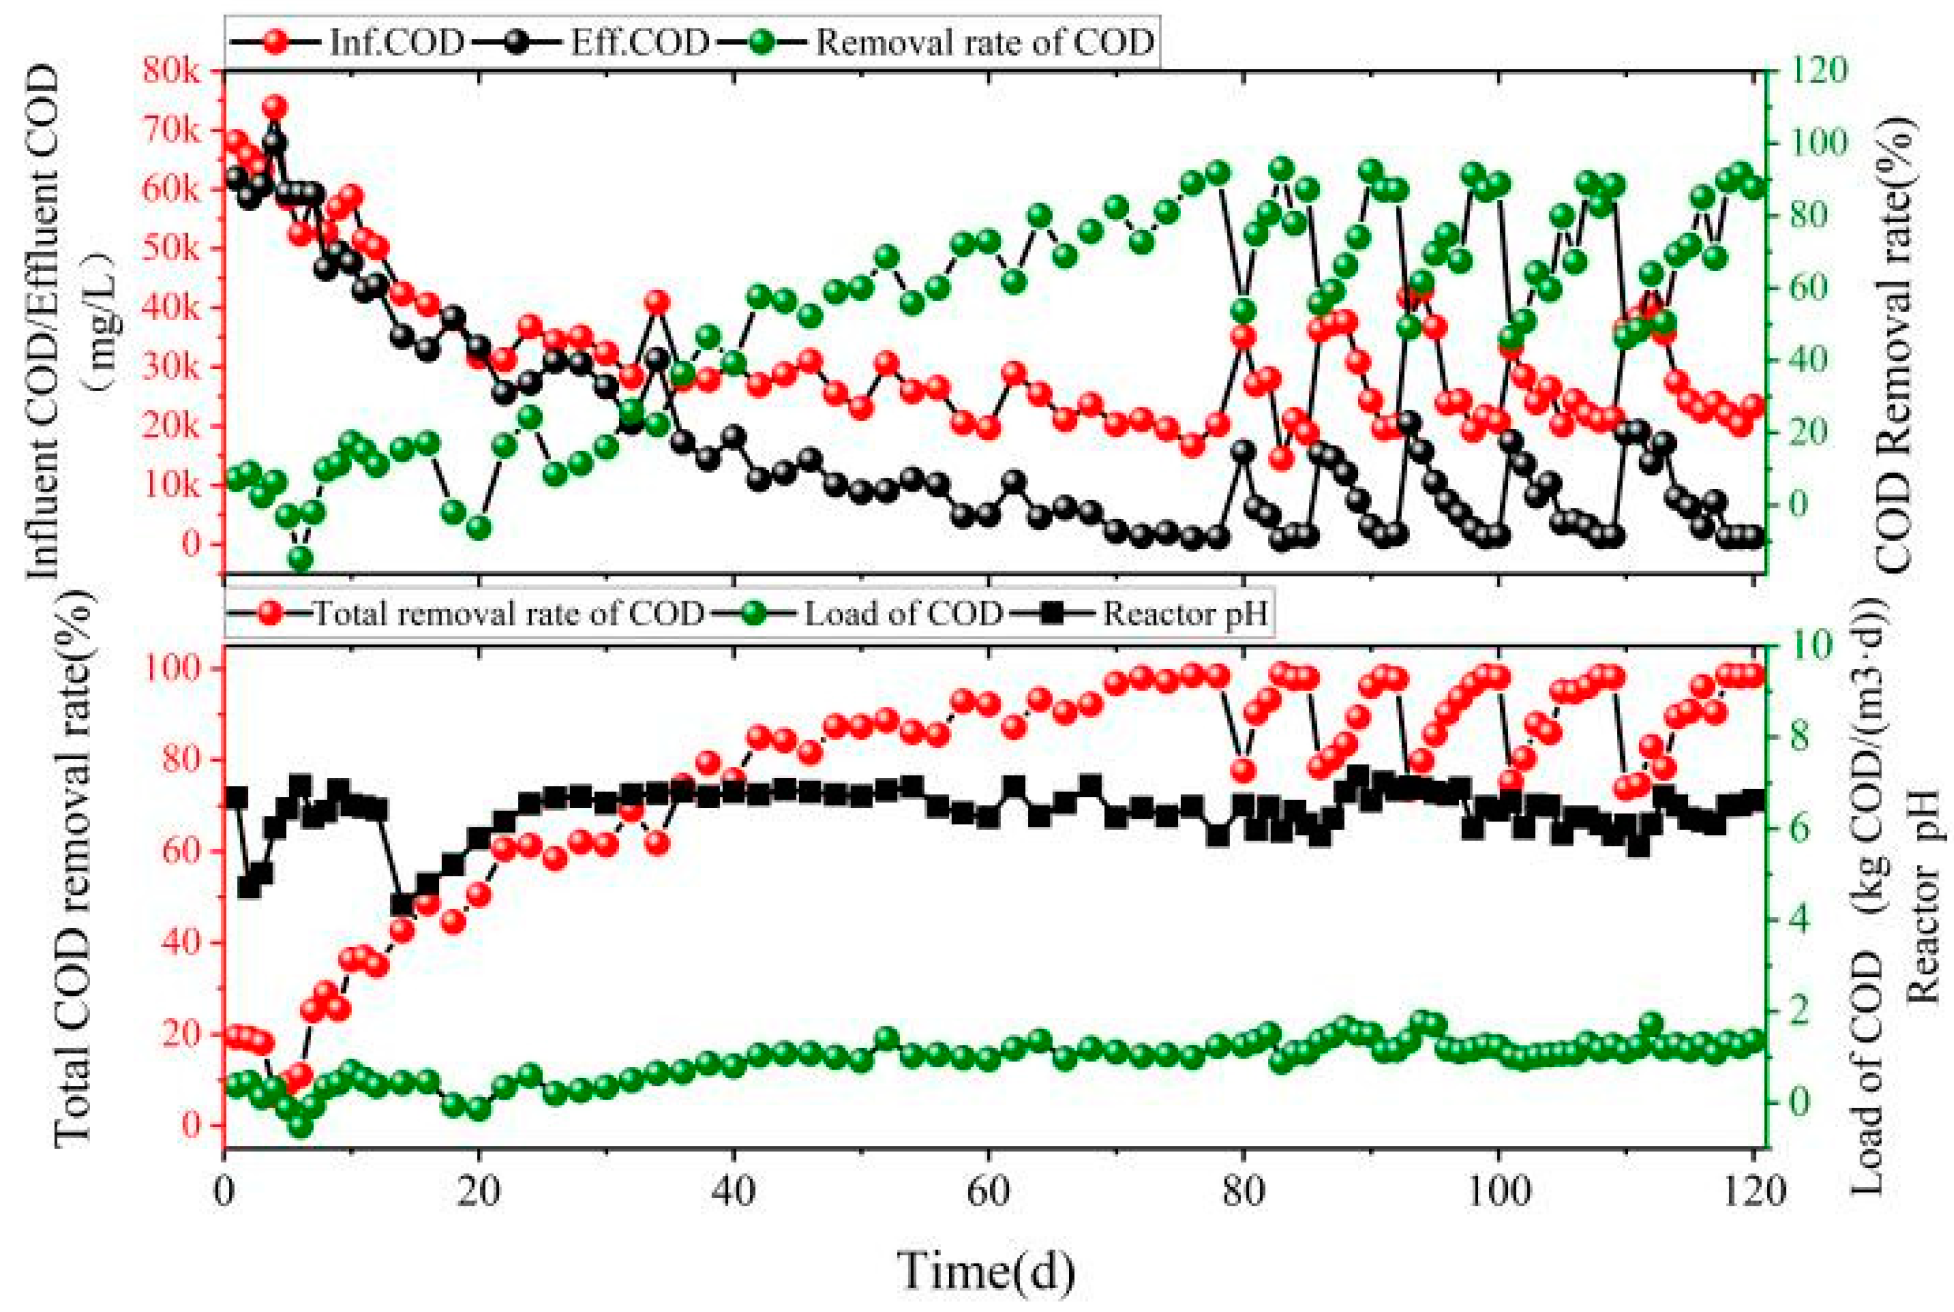
The EGSB reactor start-up commissioning operation can be divided into a granular sludge domestication period (days 1–78) and volumetric load increase period (days 78–120). The domestication period further involves three stages: dormant (days 1–12), growth (days 12–42), and granular sludge-forming (days 44–78) periods. The water was sampled daily during the dormant and load increase periods, whereas the rest of the time, samples were taken once every two days to monitor the reactor inlet and outlet water qualities, and the daily inlet volume was set to 10 m3 in the early stage of the reactor start-up to adapt the inoculated sludge to the water quality as soon as possible. By the 78th day of the reactor operation, granular sludge with a uniform particle size and good settling performance was observed in the reactor, and the total removal rate of COD in the two EGSB reactors was more than 98% at this time. At this point, the reactor start-up could be considered complete. Thereafter, the reactor volume load was increased by gradually feeding it water. The changes in the operating parameters during the start-up of the anaerobic section and microaerobic section of EGSB are shown in Figure 2 and Figure 3.
At the beginning of the experiment (dormant period, days 1–12), the COD removal rate in the anaerobic section of EGSB was low. In addition, the removal effect was unstable, with an average influent COD of 70,700 mg/L, an average removal rate of only 16.3%, and a negative COD removal rate of −1.67% on the fourth day of the start-up. The pH data showed that acidification occurred frequently in the reactor at this time, and the pH in the reactor was below 6 for six of these twelve days, reaching a minimum pH of only 3.78. The highest COD removal in the reactor was 25.48% at this stage. The highest COD removal rate in the microaerobic section was only 18.99%, which indicated that the operation of the newly inoculated reactor was extremely unstable. Most of the freshly inoculated sludge was assumed to be dormant, because it could not adapt to the new water quality, and some of the sludge even died because it could not adapt, which led to the unstable operation of the reactor. In this case, the reactor pH was maintained by a series of strategies, such as decreasing the inlet water, increasing the reflux, and adding alkaline chemicals to regulate the reactor.
After that, the reactor entered the growth period (days 12–42), and the COD removal rate greatly increased. The COD volume load in the EGSB anaerobic section increased 2.6-fold within 30 days. The average influent COD at this stage was 70,500 mg/L. The removal of COD increased particularly rapidly in the early stage of the growth period (days 14–22), which was due to the rapid recovery of activity and starvation of the inoculated sludge after the dormant period, so the removal of COD suddenly increased. No obvious acidification occurred in the reactor during the growth period, and the pH fluctuated within the range of 4.17–7.48, with an average of 6.75. On the 28th day, the pH in the reactor was as low as 4.17, but it returned to normal after approximately 4 d. The average COD concentrations in the inlet and outlet of the microaerobic section of the EGSB were 33,600 and 26,200 mg/L, respectively. The average removal rate reached 23.40%, and the total COD removal of the two-stage EGSB reactor reached 62.31%. These results showed that the sludge activity was good during this stage, and the reactor operated normally and showed a certain stability.
After the 30 days growth period, most of the sludge activity in the reactor recovered, and the reactor entered the granular sludge-forming period (days 44–78). As shown in Figure 2, the pH in the anaerobic section of the EGSB reactor fluctuated within the range of 6.45–7.20, with an average of 6.89. The COD removal increased slowly and steadily on days 44–56, then decreased slightly and showed a small fluctuation on days 56–64. This is because, at this stage, to promote the formation of granular sludge and increase the expansion rate of the sludge bed, the upward flow rate of liquid in the reactor was increased to 3 m/h, which led to the loss of some unformed flocculated sludge and the fluctuation in the COD removal. After that, granular sludge with a uniform particle size and good settling performance gradually formed in the reactor, and the removal rate of COD gradually increased and finally stabilized at approximately 72%. The average COD concentrations in the inlet and outlet water of the EGSB microaerobic section were 237.00 mg/L and 662.0 mg/L, respectively, and the average COD removal rate increased to 73.90%. Li et al. [25] demonstrated passing a small amount of oxygen into the EGSB reactor, so that anaerobic microorganisms and aerobic microorganisms coexist. The inhibition of anaerobic nitrification by sulfate-reducing bacteria (SRB) was relieved, which may be one of the reasons why the two-stage EGSB reactor can efficiently remove COD [26].
Then, the COD removal rate of the two-stage EGSB reactor gradually increased and stabilized above 98%; at which time, the EGSB reactor was successfully started, and the granular sludge domestication was completed. During the reactor COD load increase period (days 78–120), the reactor load was increased by increasing the reactor influent volume. When the COD removal by the two EGSB reactors was approximately 98% for three consecutive days, the influent was increased 3 m3 until the reactor reached the target treatment capacity of 25 m3/d. Meanwhile, the effluent from the EGSB section was used as the feed water for the CMBR reactor after passing through the conditioning tank.
The reactor load uprating period lasted for a total of 42 days, and the effectiveness of the reactor for COD removal decreased after each increase in influent, and the pH in the reactor also decreased slightly for 2 to 3 days after the influent was increased. This occurred because the microorganisms in the reactor must adapt to the higher hydraulic load, leading to fluctuations in the system, and the magnitude of these fluctuations increases with the increased influent water. For example, with the first increase in influent, the reactor COD load decreased from 5.09 to 4.83 kg COD/(m3·d), a decrease of 5.10%. With the third increase in the feed water, the COD load decreased by 8.74%, from 8.58 kg COD/(m3·d) to 7.83 kg COD/(m3·d). The fifth increase in influent decreased the COD load from 11.82 kg COD/(m3·d) to 9.83 kg COD/(m3·d), a decrease of 16.83%. The times required to stabilize the reactor with each increase of the influent were 6 days, 6 days, 8 days, 9 days, and 12 days, respectively. This indicates that, as the influent water increases, the closer the actual reactor load is to the upper limit of the reactor load, the greater the magnitude of the reactor fluctuations caused by this increase, and therefore, the reactor needs a longer time to adapt [23]. However, during the load increase, the EGSB reactor showed fluctuations but overall adapted quickly, with an average reactor pH of 6.49. The variations in the inlet and outlet water in the anaerobic section of the EGSB were the same as those in the anaerobic section, and the COD removal in the two EGSB reactors was more than 98% at a daily influent of 25 m3/d. In summary, EGSB was proven to be a system with high stability and anti-disturbance capability.
In the whole process of the reactor operation, when the system influent was 10, 13, 16, 19, 22, and 25m3, the average organic loads of the influent in each stage were 4.63, 5.92, 7.88, 9.69, 10.73, and 12.59 kg COD/(m3·d), and the actual organic loads were 2.38, 3.84, 4.74, 6.02, 7.14, and 7.83 kg COD/(m3·d), respectively. That is to say, the two-stage EGSB reactor has a good removal effect on organic wastewater under low organic loads and high organic loads in the process of load increase.
3.2. Formation of Granular Sludge
The granular sludge in the reactor is a self-colloid composed of methanogenic bacteria, acetic acid-producing bacteria, and hydrolytic fermenting bacteria, and it is a symbiotic or mutualistic system composed of different types of microorganisms. The formation of granular sludge facilitates the absorption of nutrients by the bacteria it contains. In addition, granular sludge can maintain a relatively stable microenvironment when the nature of the wastewater changes suddenly, enabling the metabolic process to continuously operate, which is the main reason for the high tolerance of the shock loads of the EGSB reactor. However, owing to the slow formation of granular sludge in anaerobic digestion technology and the harsh environmental requirements inside the reactor, the start-up time of the EGSB reactor is too long, which is an important factor limiting its development. During commissioning operation, a high sludge concentration and good sludge activity in the reactor must be ensured. At the same time, granular sludge with a better settling performance is required because of the high upward liquid flow rate in the EGSB reactor. Therefore, changes in the sludge activity and performance in the reactor must be analyzed when examining the feasibility, efficiency, and stability of the long-term operation of the EGSB reactor [27].
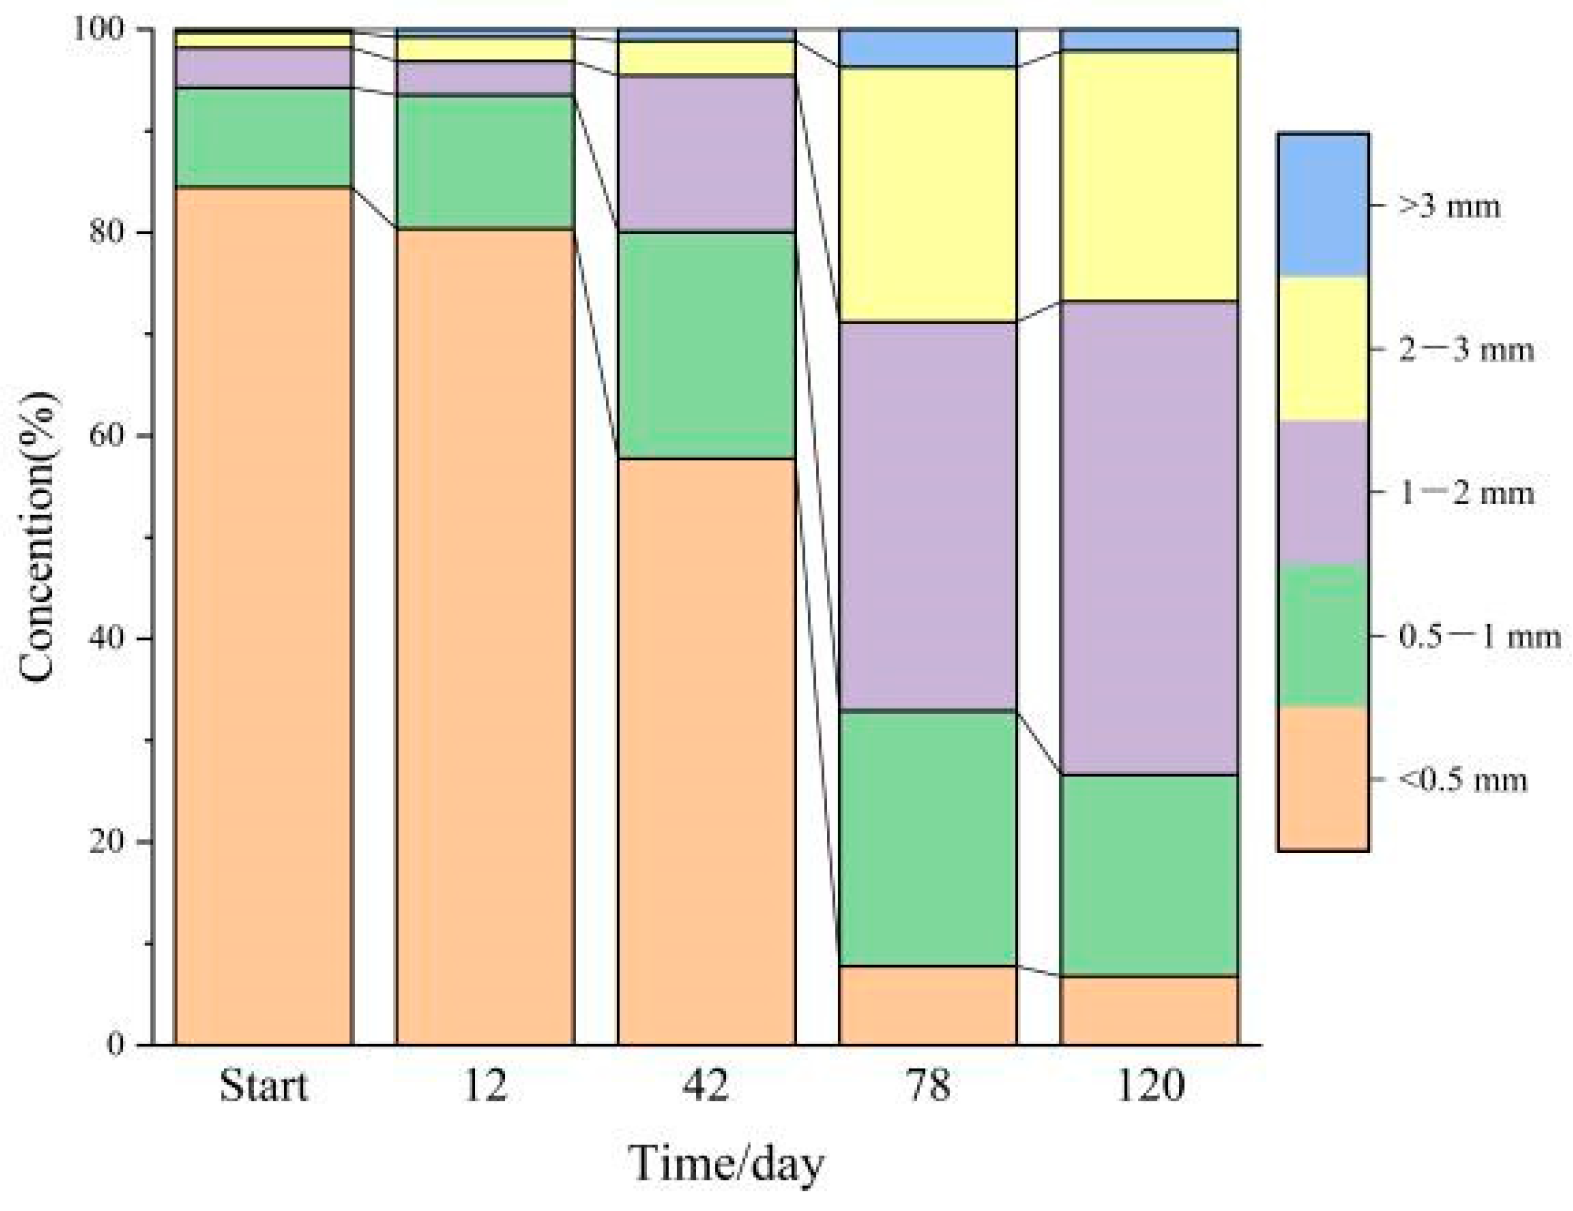
Granular sludge forms in the EGSB reactor in the four main stages. The first 12 days of a reactor start-up is the sludge acclimation period, and the first granulated form of flocculated sludge develops on days 12–42. Then, the basic formation of granular sludge occurs on days 43–78, and finally, the reactor load increases on days 79–120. Most of the sludge in the reactor was transformed into granular sludge by day 78 of the start-up, and the average particle size increased from 0.392 mm to 1.542 mm. In the later stage of the operation, the sludge layer swelling was high, the granular sludge settling performance was good, and the COD removal rate of the two EGSB reactors exceeded 98% at a COD volumetric load of 5.64 kg COD/(m3·d). At this point, the reactor can be considered to have been successfully started. The reactor feed load was continuously increased to tame the sludge, and finally, the combined EGSB-CMBR reactor reached the target treatment capacity of 25 m3/d with a COD removal rate of over 98%.
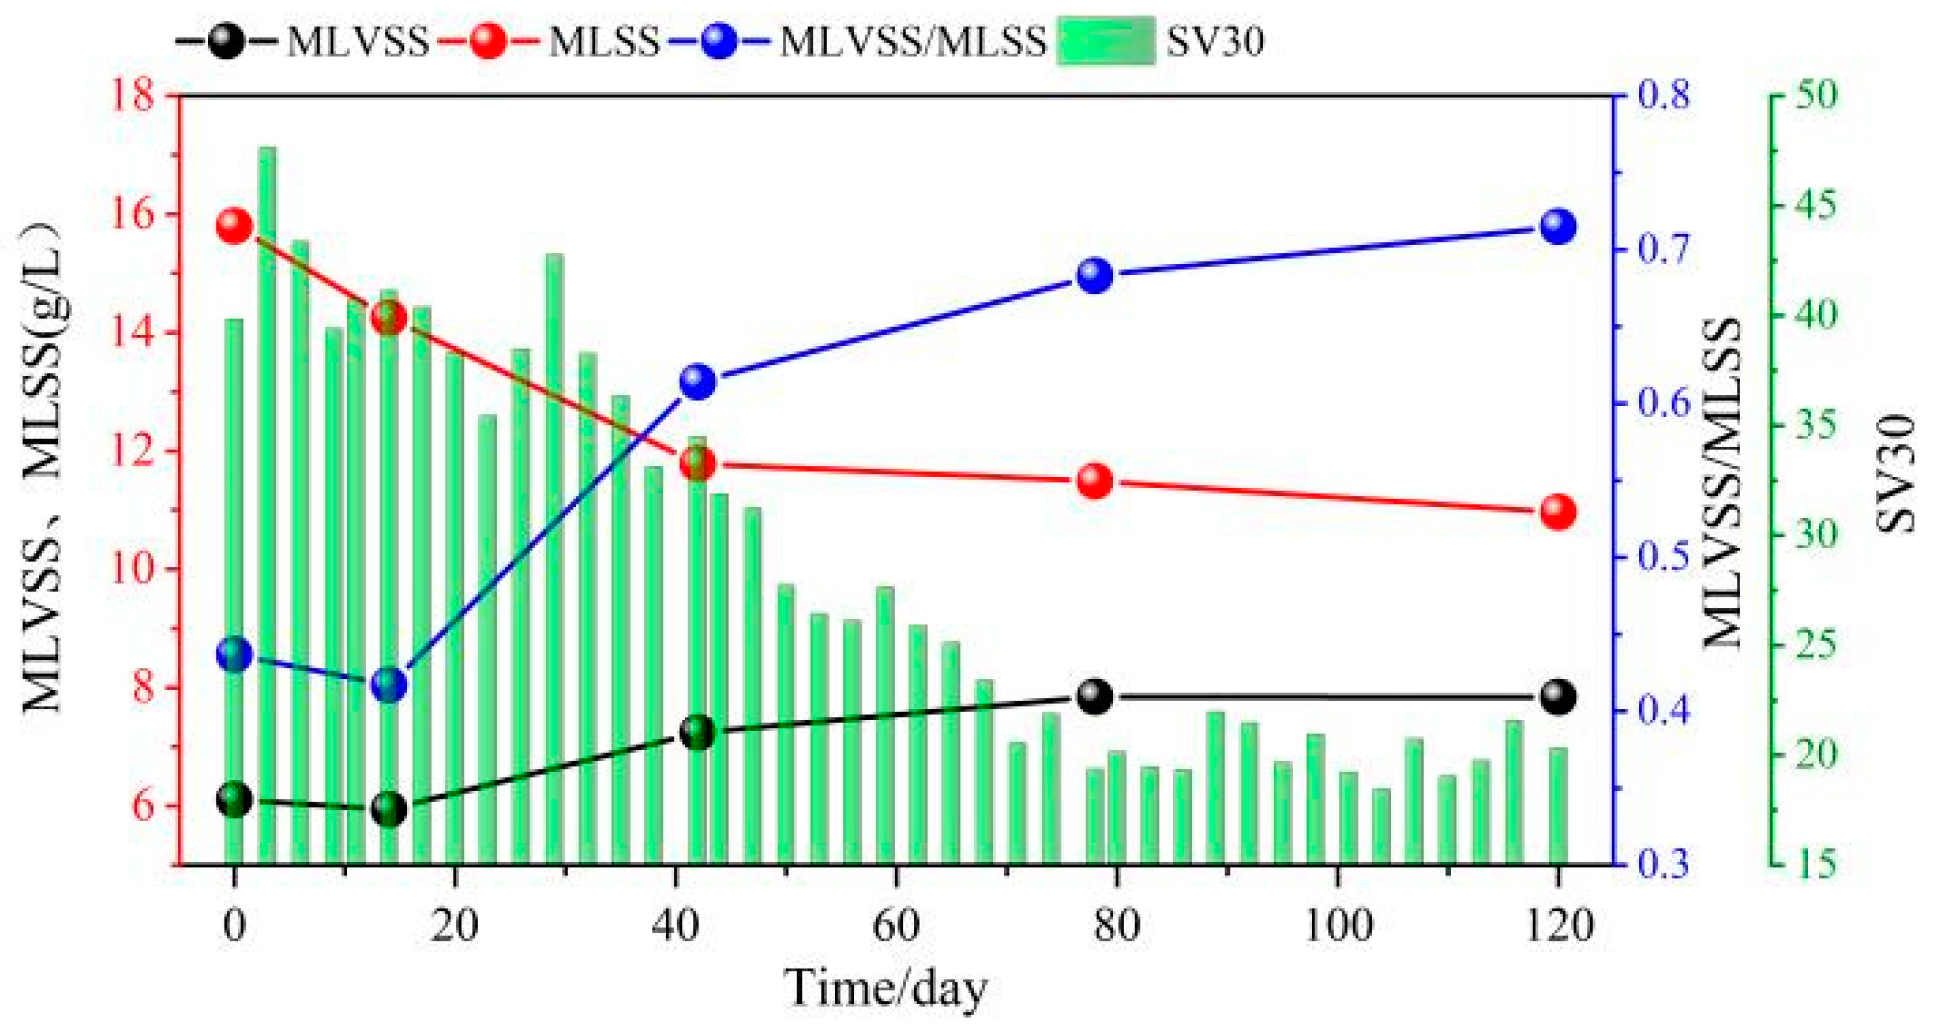
In the early stage of the reactor start-up, the inoculated flocculated sludge had a loose structure, and more than 80% of the sludge particles were smaller than 0.5 mm. In contrast, the height-to-diameter ratio of the modified EGSB reactor was only 2. If the upward flow rate of liquid in the reactor is too rapid, a large amount of sludge will be lost, and the reactor will not start successfully, owing to the low microbial concentration. Therefore, we chose to start the EGSB reactor with the operation method of the UASB reactor in the early stage of sludge inoculation, and we cultivated the granular sludge first. The sludge properties and liquid upward flow rate at each stage in the reactor are shown in Table 2. When the densities of the individual sludge particles are the same, their settling performance is related only to their particle size, and generally, granular sludge with larger particles has a better settling performance. Therefore, the size distribution of sludge particles can indirectly reflect the operation of the reactor. The main particle size distribution of sludge in the EGSB reactor during each period is shown in Figure 4, and the sludge microbial content and settling performance are shown in Figure 5.
The initial inoculated sludge MLVSS was 6.10 mg/L, the MLSS was 15.80 mg/L, the MLVSS/MLSS was 0.437, and the average particle size of the initial sludge was 0.392 mm. The rising flow rate of the liquid in the reactor was controlled to 1 m/h and the daily water inflow to 10 m3/d. After the dormant period (days 1–14), the MLVSS and SS values of the sludge in the reactor decreased to 5.94 mg/L and 14.25 mg/L, respectively, and the MLVSS/MLSS ratio decreased to 0.417. At this time, only a small part of the sludge in the reactor was granular, and the rest of the sludge had a loose flocculent structure. The MLVSS, MLSS, and MLVSS/MLSS decreased simultaneously. On the one hand, this sludge behavior is due to the soluble impurities entrained in the floc sludge and the light floc sludge flowing out of the effluent. On the other hand, the inoculated flocculent sludge cannot adapt to the water quality, the microbial metabolism is disordered. In addition, the part of the sludge that cannot adapt to the system environment dies, thus decreasing the total amount of microorganisms in the EGSB reactor. At this time, most of the activated sludge in the reactor is still flocculent sludge. The loss of flocculent sludge with small particles and a poor sedimentation performance slightly increases the average particle size of sludge. Observing the reactor revealed that some flocculent sludge floated and stratified on the third day of the reactor start-up. The SV30 value increased from 39.84% to 46.63%, and the sludge sedimentation performance became worse. At this time, the upper sludge was stirred by the agitator in the reactor, and nutrient elements such as N and P were added to the reactor to solve the problem of the floating sludge [28]. On day 9, the SV30 value of the sludge returned to the initial level and did not decrease significantly thereafter. The average SV30 value in the dormancy period was 41.68%.
Sludge samples were collected during the sludge growth period (days 14–42) by continuing to maintain a constant reactor influent load and a constant upward liquid flow rate. The sludge MLSS decreased from 14.25 mg/L to 11.79 mg/L, while the MLVSS value increased from 5.94 mg/L to 7.24 mg/L. The MLVSS/MLSS ratio increased to 0.534, indicating that the sludge in the reactor was domesticated, and no significant sludge loss occurred. At this stage, the total amount of sludge decreased, but the sludge activity increased. Owing to the rich nutrients in the reactor, the sludge growth condition was good, and the flocculated sludge gradually transformed into granular sludge initially under the actions of the water flow shear force and friction. At this time, 57.74% of the sludge particles were smaller than 0.5 mm, 22.31% of the sludge particles were 0.5–1.0 mm, and 15.39% of the sludge particles were 1 to 2 mm. In addition, the average particle size increased from 0.436 mm to 0.668 mm, and the settling performance of the sludge in the reactor also improved slightly at this time. Moreover, the sludge SV30 value decreased from 41.13% to 33.14%, with an average of 37.51%.
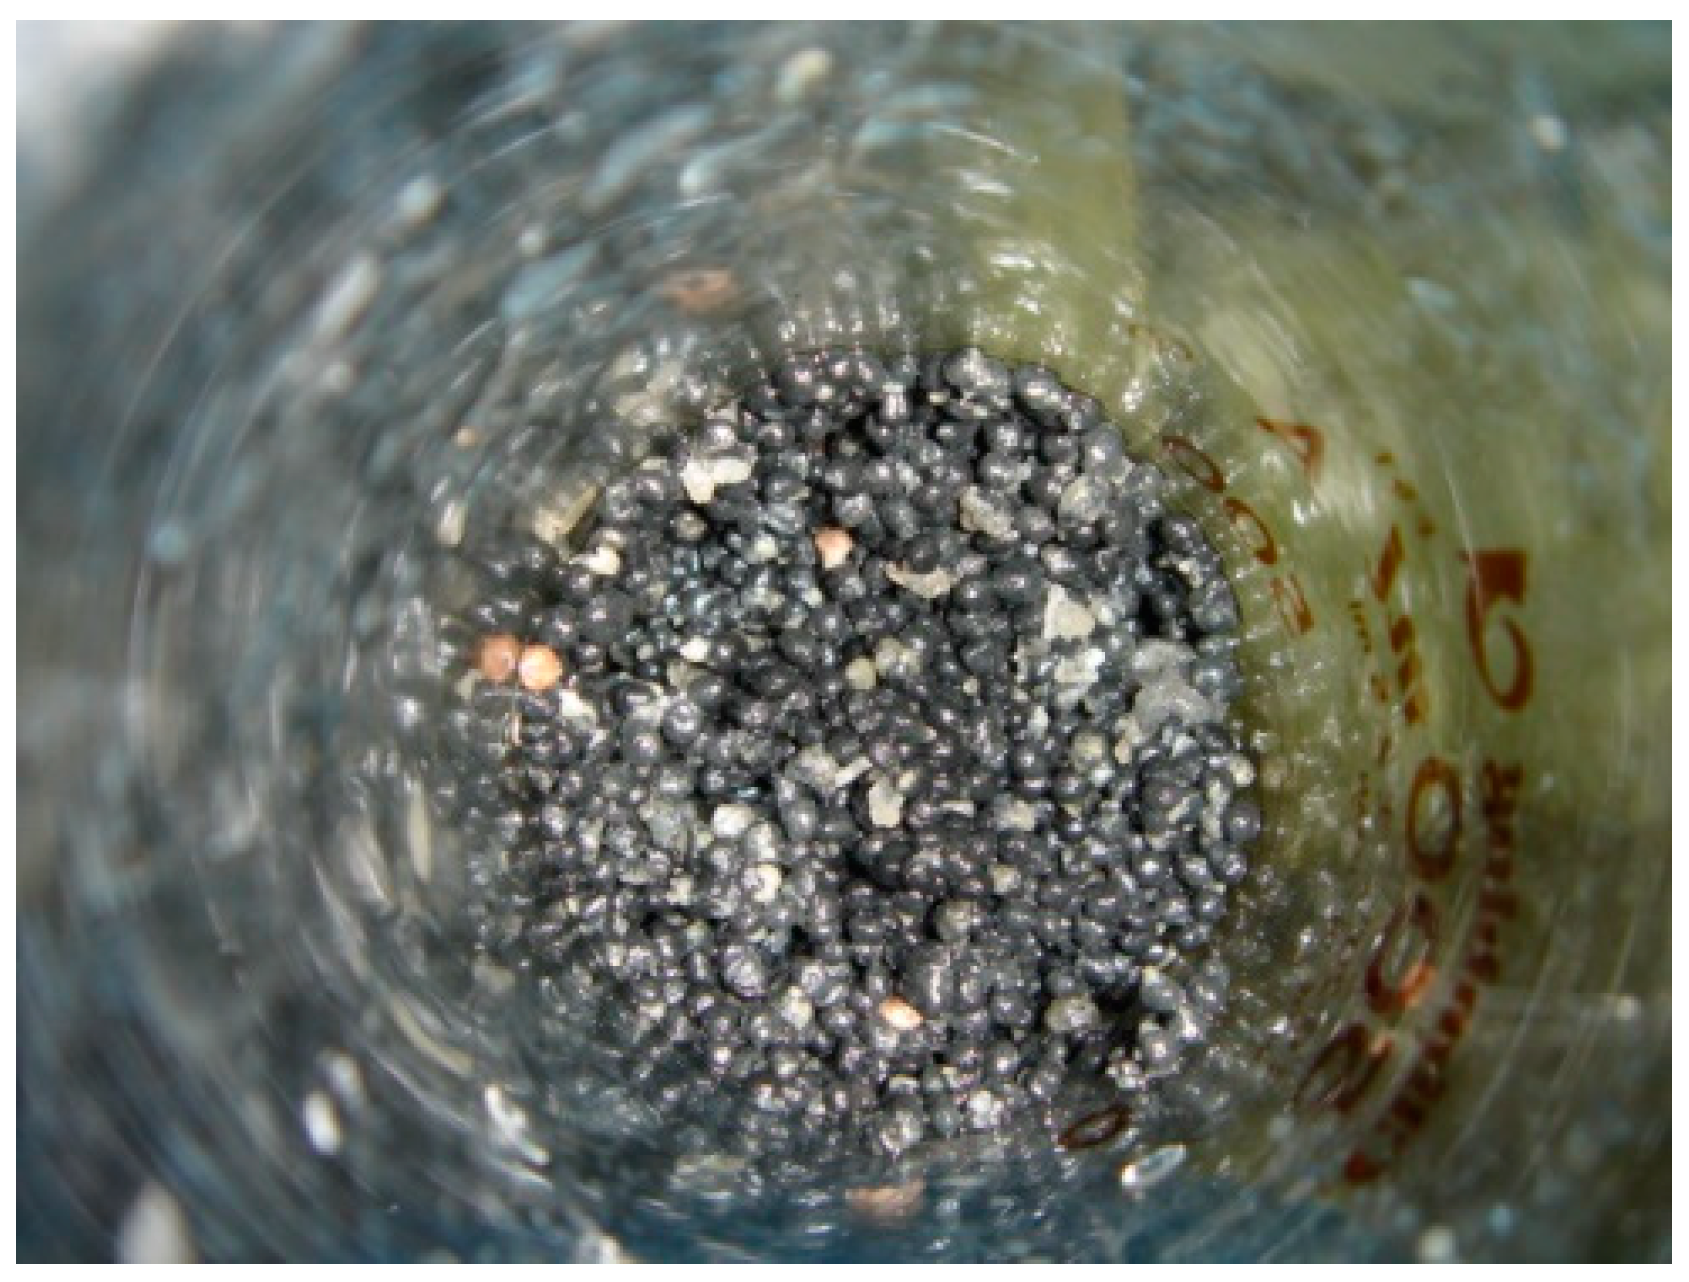
The sludge layer expansion rate in the EGSB reactor was only 10.7%, because the liquidity increased slowly. During the operation, sludge stratification was observed in the reactor, which was caused by the low expansion rate of the sludge bed, the smaller gap between sludge particles at the bottom of the reactor, and the accumulation of gas in the sludge bed, which could not be eliminated in a timely manner. To improve the sludge bulking rate, promote a mass transfer, and accelerate the formation of granular sludge during the granular sludge-forming period (days 42–78), the liquid up-flow rate in the reactor was increased to 2 m/h [29]. During this stage, the upper part of the granular sludge layer was gradually clarified, and the sludge MLSS in the reactor was 11.49 mg/L. The MLVSS was 7.85 mg/L, and the MLVSS/MLSS ratio increased to 0.683 on day 78 of the reactor operation. At this time, it was observed that most of the sludge in the reactor had turned into homogeneous granular sludge. Specifically, 88.36% of the sludge particles were 0.5–3 mm, while the flocculent sludge with particles smaller than 0.5 mm only accounted for 7.87%, and the average particle size of the sludge increased to 1.563 mm. The sludge settling performance greatly improved at this stage. The SV30 value decreased from 34.47% to 19.37%, with an average value of 25.60%. The sludge particles in the reactor were spherical or ellipsoidal, and the sludge-water interface was very distinct. The granular sludge in the reactor is shown in Figure 6. The sludge bulking rate also increased from 6.7% to 21.76%; thus, it was judged that granular sludge had been successfully cultivated in the EGSB reactor.
The load increase period (days 78–120) further domesticated the granular sludge and increased the reactor treatment load by gradually increasing the water inflow. At the same time, the liquid-rising velocity in the reactor increased to 3 m/h to increase the sludge bulking rate and enhance the mass transfer. By the end of the sludge domestication on day 120, the reactor successfully reached the target capacity of 25 m3/d. The sludge properties in the reactor were observed at this time, and the MLVSS was found to be 7.8 mg/L. In addition, the MLSS decreased to 10.96 mg/L, and the MLVSS/MLSS increased to 0.715. Increasing the liquid flow rate in the reactor did not result in sludge loss. The sludge in the EGSB reactor was thus more active after domestication. At this time, the average particle size of the sludge decreased slightly, from 1.556 mm to 1.542 mm, and 0.5–3 mm particles accounted for 91.21% of the sludge; among which, a proportion of 1 to 2 mm particles increased from 38.67% to 46.13%. The particle size distribution of the sludge was more uniform after 40 d of domestication. The SV30 value fluctuated smoothly from 19.37% to 21.9%, with an average of 20.15%. These findings confirmed that the granular sludge formed in the EGSB reactor was stable and had a strong ability to resist a shock load, and it maintained a good settling performance during the process of increasing the reactor load.
3.3. CMBR
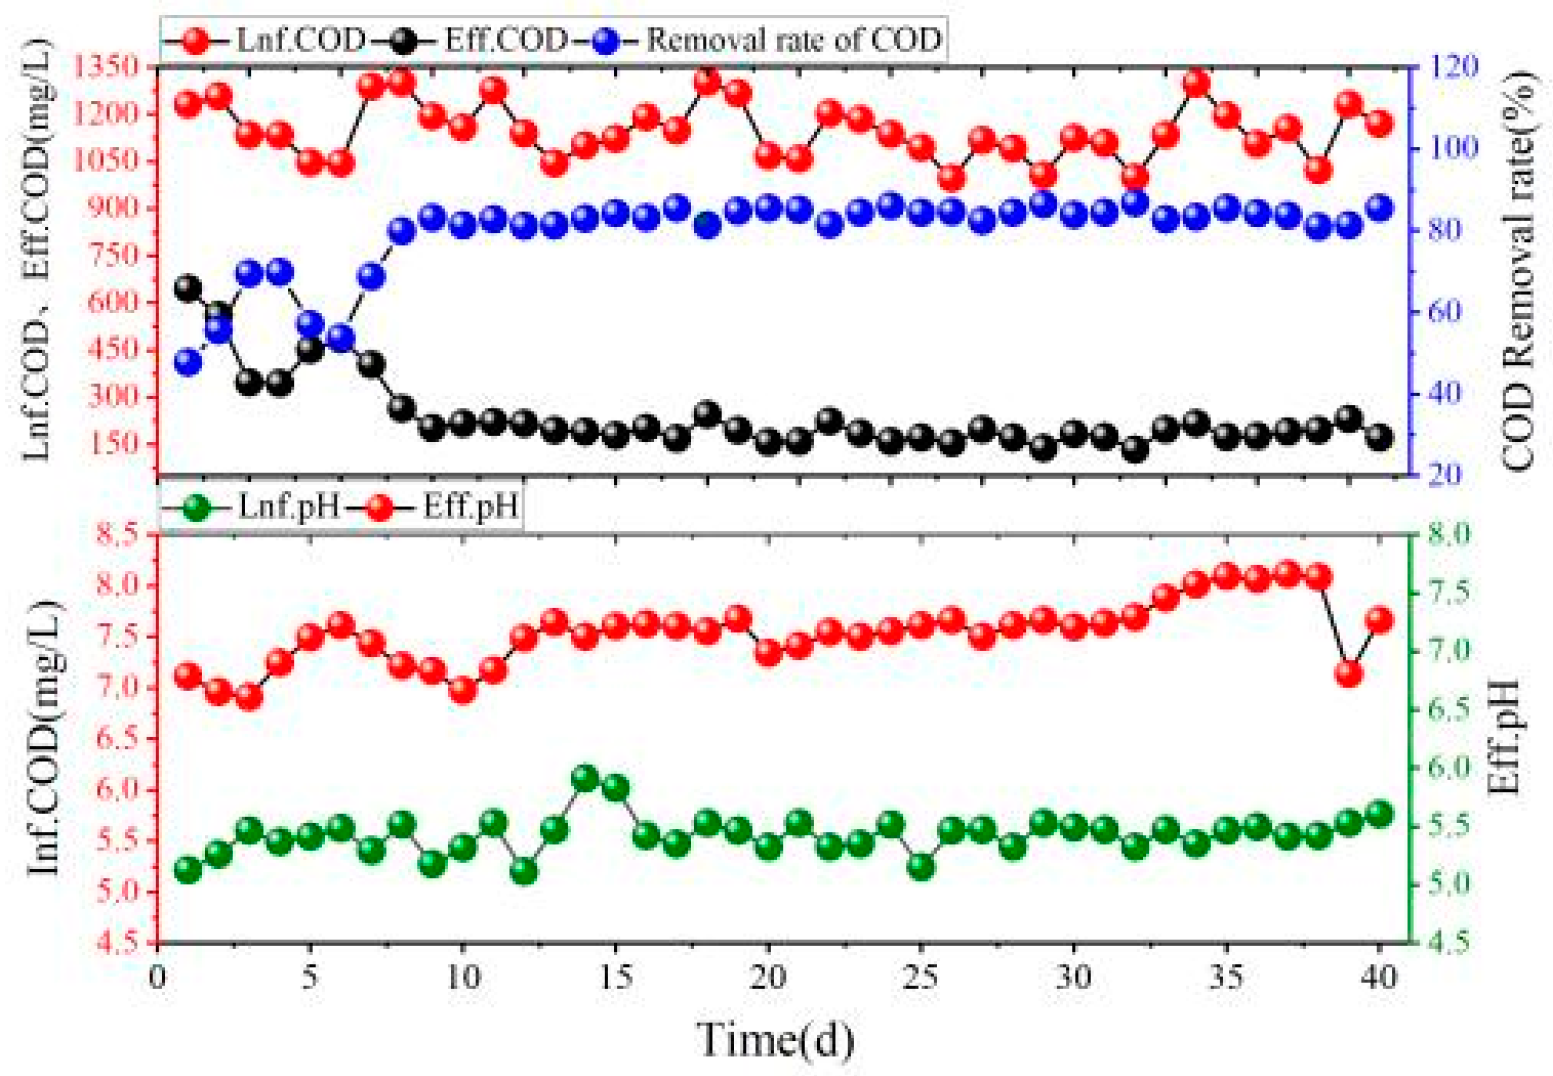
When the EGSB reactor entered the load increase period, its effluent was introduced into the regulating tank to control the influent pH to approximately 5.56, and the influent COD concentration was approximately 1150 mg/L. The CMBR reactor was started very smoothly. The data on the reactor start-up and operation are shown in Figure 7. The CMBR reactor ran for 40 d, and the degradation efficiency of the COD was low in the initial stage of the start-up (days 1–7), so the COD removal fluctuated greatly. The average influent and effluent COD were 1160 and 460 mg/L, respectively, and the average removal rate was 60.28%. In this stage, the average ammonia nitrogen concentrations in the inflow and outflow water were 207.43 and 114.17 mg/L, respectively, and the average removal rate was 44.96%. The reason for this performance was that the newly inoculated sludge could not fully adapt to the quality of the sewage water. After several days of adaptation, the CMBR reactor achieved stable COD removal (days 8–40). Further, the influent and effluent COD were 211.27 and 20.47 mg/L, respectively, and the removal rate was 90.13%. The average pH of the inlet and outlet water were 5.56 and 7.13, respectively. The removal of COD by the CMBR reactor can mainly be attributed to two aspects: the degradation of microorganisms in the reactor and the retention of the membrane module. Two complete sets of membrane modules were set up in the CMBR reactor. During operation, sludge accumulated on the surface of the membrane module, forming a filter cake layer and a gel layer, both of which helped retain some soluble molecules in the water [30].
3.4. Operation Phase
The effluent quality after the stable operation of the overall process is shown in Table 3.
Table 2 shows that the removal rate of COD by the EGSB-CMBR process is more than 99%, and the removal rates of NH4+-N and SS are more than 70% and 90%, respectively. The average values of COD, NH4+-N, and SS at the main outlet are 141, 33.03, and 83 mg/L, respectively. The effluent quality meets the class II standard of the Integrated Wastewater Discharge Standard (GB 8978-1996).
4. Operation Cost Analysis
For this project, the total investment was mainly in civil engineering costs. The engineering design and equipment cost a total of approximately 550,000 CNY. Among these costs, the civil engineering investment was 172,500 CNY, the cost of the equipment and materials was 292,400 CNY, and the other aspects (design, installation, and commissioning) amounted to 75,100 CNY. The sewage treatment process adopted the Programmable Logic Controller (PLC) automatic control operation, which was operated by technicians from the original sewage treatment plant at this facility, and their salaries did not increase. The plant can treat 25 m3/d of sewage, its design service life is 20 years, and the fixed investment is 550,000 CNY.
Table 4 indicates that, without considering depreciation, amortization, or reclaimed water reuse income, the cost of treating each ton of high-concentration organic wastewater is approximately 12.35 CNY/ton, so the annual operating cost is 200,476 CNY. The cost of treating high-concentration organic wastewater by “entrusted treatment” in the plant is 110 CNY/ton, which means the annual cost for treating high-concentration organic wastewater using this method would exceed 1 million CNY. The EGSB-CMBR process can effectively treat the high concentration of organic wastewater generated in the plant, thereby saving more than 800,000 CNY for the plant annually.
5. Conclusions
The EGSB reactor start-up and commissioning operation can be divided into the granular sludge domestication period (days 1–78) and the volumetric load increase period (days 78–120). By day 78 of the reactor operation, granular sludge with a uniform particle size and good settling performance was observed to have formed in the reactor. In addition, at a COD volumetric load of 5.64 kg COD/(m3·d), the COD removal rate of the two EGSB reactors exceeded 98%; at which, point the reactor could be considered successfully started up. Thereafter, the reactor volume load was increased by a gradual water intake until day 120. The reactor treated 25 m3 of wastewater per day.
Granular sludge formation in the EGSB reactor was divided into four stages: acclimatization (days 1–12), initial granulation (days 12–42), basic granular sludge formation (days 43–78), and reactor load increase (days 79–120). The majority of the flocculated sludge in the reactor was converted into granular sludge by day 78 of the start-up, with the average sludge particle size increasing from 0.392 mm to 1.542 mm. In addition, the VSS and SS values were 7.8 and 10.96 mg/L, respectively, and the VSS/SS was 0.715. The cultured granular sludge had a good settling performance, with an average SV30 value of 20.15%.
The CMBR reactor was operated for 40 days. The COD degradation efficiency was low during the initial period (days 1–7), and the removal of COD fluctuated greatly, with an average removal rate of 60.28%. From day 8 to day 40, the CMBR reactor achieved stable COD removal, with influent and effluent COD of 1140 and 186.35 mg/L, respectively, and an average removal rate of 83.66%.
The total project cost was approximately 550,000 CNY; among which, the civil construction investment was 172,500 CNY; the equipment and material cost was 292,400 CNY; and the other costs (design, installation, and commissioning) were 75,100 CNY. Treating each ton of high-concentration organic wastewater using the EGSB-CMBR process cost approximately 21.97 CNY. Therefore, using this process to effectively treat the high-concentration organic wastewater generated in the plant can save more than 800,000 CNY per year.
Author Contributions
Conceptualization, X.Z. and Y.J.; methodology, X.Z. and Y.J.; software, X.Z. and Y.J.; validation, X.Z. and Y.J.; formal analysis, X.Z. and Y.J.; investigation, X.Z. and Y.J.; resources, X.Z. and Y.J.; data curation, X.Z. and Y.J.; writing—original draft preparation, X.Z. and Y.J.; writing—review and editing, X.Z., D.W. and Y.J.; visualization, X.Z. and Y.J.; supervision, Y.J.; project administration, Y.J.; and funding acquisition, Y.J. All authors have read and agreed to the published version of the manuscript.
Funding
This research was supported by the Guangxi Natural Science Foundation (grant number 2019GXNSFFA245017).
Institutional Review Board Statement
Not applicable.
Informed Consent Statement
Not applicable.
Data Availability Statement
Not applicable.
Conflicts of Interest
The authors declare no conflict of interest.
References
- Zou, B.; Chen, Y. Research progress of high concentration organic wastewater treatment technology. Chem. Manag. 2021, 9, 40–41. [Google Scholar]
- Zhang, W.; Zhang, X.; Wang, D.; Koga, Y.; Rouse, J.D.; Furukawa, K.J. Trace elements enhance biofilm formation in UASB reactor for solo simple molecule wastewater treatment. Bioresour. Technol. 2011, 102, 9296–9299. [Google Scholar] [CrossRef] [PubMed]
- Zhang, W.; Zhang, Y.; Li, L.; Zhang, X.; Jin, Y. Fast start-up of expanded granular sludge bed (EGSB) reactor using stored Anammox sludge. Water Sci. Technol. 2014, 69, 7. [Google Scholar]
- Li, B.; Wang, Y.; Guo, Y.; Wang, W.; Huang, X.; Wang, Z. Partial nitrification coupled with anammox in a biofilter reactor (BR) of large height-to-diameter ratio for treatment of wastewater with low C/N. Process. Biochem. 2021, 104, 19–26. [Google Scholar] [CrossRef]
- Yan, H.; Li, J.; Meng, J.; Li, J.; Avinash, K.J.; Zhang, Y.; Fan, Y.; Wang, X. Effects of reflux ratio on the anaerobic sludge and microbial social behaviors in an expanded granular sludge bed reactor: From the perspective of acyl-homoserine lactones-mediated quorum sensing. Bioresour. Technol 2021, 337, 125360. [Google Scholar] [CrossRef] [PubMed]
- Hamdi, M.; Garcia, J.L. Comparison between the anaerobic filter and anaerobic contact process for fermented olive mill wastewaters. Bioresour. Technol 1991, 38, 23–29. [Google Scholar] [CrossRef]
- Feng, L.; Ward, A.J.; Ambye, J.M.; Møller, H.B. Pilot-Scale anaerobic digestion of by-product liquid (brown juice) from grass protein extraction using an un-heated anaerobic filter. Process. Saf. Environ. Prot. 2021, 146, 886–892. [Google Scholar] [CrossRef]
- Jia, H.; Liu, W.; Wang, J.; Ngo, H.H.; Guo, W.; Zhang, H. Optimization of sensing performance in an integrated dual sensors system combining microbial fuel cells and up-flow anaerobic sludge bed reactor. Chemosphere 2018, 210, 931–940. [Google Scholar] [CrossRef]
- Cai, M.H.; Luo, G.; Li, J.; Li, W.; Li, Y.; Li, A. Substrate competition and microbial function in sulfate-reducing internal circulation anaerobic reactor in the presence of nitrate. Chemosphere 2021, 280, 130937. [Google Scholar] [CrossRef]
- Granatto, C.F.; Grosseli, G.M.; Sakamoto, I.K.; Fadini, P.S.; Varesche, M.B. Influence of cosubstrate and hydraulic retention time on the removal of drugs and hygiene products in sanitary sewage in an anaerobic Expanded Granular Sludge Bed reactor. J. Environ. Manag. 2021, 299, 113532. [Google Scholar] [CrossRef]
- Li, Z.; Hu, Y.; Liu, C.; Shen, J.; Wu, J.; Li, H.; Wang, K.; Zuo, J. Performance and microbial community of an expanded granular sludge bed reactor in the treatment of cephalosporin wastewater. Bioresour. Technol. 2019, 275, 94–100. [Google Scholar] [CrossRef] [PubMed]
- Menezes, A.D.; Silva, E.L. Hydrogen production from sugarcane juice in expanded granular sludge bed reactors under mesophilic conditions: The role of homoacetogenesis and lactic acid production. Ind. Crops Prod. 2019, 138, 111586. [Google Scholar] [CrossRef]
- Ji, M.; Huo, J. Process characteristics and operational performance of anaerobic granular sludge expansion bed (EGSB). Ind. Water Wastewater 1999, 4, 1–4. [Google Scholar]
- Cheng, Y.; Tian, K.; Xie, P.; Ren, X.; Li, Y.; Kou, Y.; Chon, K.; Hwang, M.H.; Ko, M.H. Insights into the minimization of excess sludge production in micro-aerobic reactors coupled with a membrane bioreactor: Characteristics of extracellular polymeric substances. Chemosphere 2022, 292, 133434. [Google Scholar] [CrossRef] [PubMed]
- Fida, Z.; Price, W.E.; Pramanik, B.K.; Dhar, B.R.; Kumar, M.; Jiang, G.; Hai, F.I. Reduction of excess sludge production by membrane bioreactor coupled with anoxic side-stream reactors. J. Environ. Manag. 2021, 28, 111919. [Google Scholar] [CrossRef]
- Xiang, L.; Long, F.; Zheng, B. A pilot studied on the treatment of low concentration organic wastewater using biofilm process. Environ. Sci. Res. 2007, 2, 46–50. [Google Scholar]
- Asif, M.B.; Zhang, Z. Ceramic membrane technology for water and wastewater treatment: A critical review of performance, full-scale applications, membrane fouling and prospects. Chem. Eng. J. 2021, 418, 129481. [Google Scholar] [CrossRef]
- Zhang, Y.; Qin, Y.; Fan, X. Application of flat plate ceramic membrane MBR process in rural wastewater treatment. China Water Supply Drain. 2021, 37, 120–125. [Google Scholar]
- Di, S.W. Potassium dichromate method for the determination of COD in wastewater. Sci. Technol. Inf. 2017, 15, 113–114. [Google Scholar]
- State Environmental Protection Administration. Methods of Analysis for Water and Wastewater Monitoring, 3rd ed.; China Environmental Science Press: Beijing, China, 2006; pp. 154–169. [Google Scholar]
- Long, P.; Yang, C.; Pu, W.; Yang, J.; Bai, J.; Wang, J.; Zhou, X.; Jiang, G.; Li, C. Cultivation and Characteristics of Aerobic Granular Sludge in SFBR. Environ. Sci. 2014, 35, 1857–1865. [Google Scholar]
- Wei, Y.; Jin, Y.; Zhang, W. Treatment of high-concentration wastewater from an oil and gas field via a paired sequencing batch and ceramic membrane reactor. Int. J. Environ. Res. Pub. Health 2020, 17, 1953. [Google Scholar] [CrossRef] [PubMed] [Green Version]
- Li, J.; Zheng, L.; Ye, C.; Zhou, Z.; Baosen, N.; Zhang, X.; Liu, H. Unveiling organic loading shock-resistant mechanism in a pilot-scale moving bed biofilm reactor-assisted dual-anaerobic-anoxic/oxic system for effective municipal wastewater treatment. Bioresour. Technol 2022, 347, 126339. [Google Scholar] [CrossRef] [PubMed]
- Fariaa, C.V.; Souzab, D.F.; Pontesb, T.M.; Amaralc, M.C.; Fonsecaa, F.V. Strategies of anaerobic sludge granulation in an EGSB reactor. J. Environ. Manag. 2019, 244, 69–76. [Google Scholar] [CrossRef] [PubMed]
- Li, Y.; Xie, Q.; Zhang, P. New technology for the treatment of molasses alcoholic wastewater. Guanghou Environ. Sci. 2006, 3, 9–12. [Google Scholar]
- Jia, X.; Li, S. Kinetic Competition between Methanogenic and Sulfate-reducing Bacteria in Anaerobic Mixed Cultures I. A model and experimental approach for kinetic presumptions. J. Zhongshan Univ. (Nat. Sci. Ed.) 2003, 42, 103–106. [Google Scholar]
- Yang, B.; Wang, M.; Wang, J.; Song, X.; Wang, Y.; Xu, H.; Bai, J. Mechanism of high contaminant removal performance in the expanded granular sludge blanket (EGSB) reactor involved with granular activated carbon for low-strength wastewater treatment. Chem. Eng. J. 2018, 334, 1176–1185. [Google Scholar] [CrossRef]
- Xue, Y.; Ma, H.; Kong, Z.; Guo, Y.; Li, Y. Bulking and floatation of the anammox-HAP granule caused by low phosphate concentration in the anammox reactor of expanded granular sludge bed (EGSB). Bioresour. Technol. 2020, 310, 123421. [Google Scholar] [CrossRef]
- Bárecnas-Ruiz, C.D.; Carrillo-Reyes, J.; Arellano-García, L.; Celis, L.B.; Alatriste-Mondragón, F.; Elías, R.F. Pretreatment and upward liquid velocity effects over granulation in hydrogen-producing EGSB reactors. Biochem. Eng. J. 2016, 107, 75–84. [Google Scholar] [CrossRef]
- Qi, B.; Jiang, X.; Wang, H.; Li, J.; Zhao, Q.; Li, R.; Wang, W. Resource recovery from liquid digestate on swine wastewater by an ultrafiltration membrane bioreactor (UF-MBR) and reverse osmosis (RO) process. Environ. Technol. Innov. 2021, 24, 101830. [Google Scholar] [CrossRef]
Figure 1.
Schematic diagram of EGSB-CMBR.

Figure 2.
EGSB anaerobic segment operating parameters.

Figure 3.
EGSB microscopic anaerobic segment operating parameters.

Figure 4.
Major particle size distribution of sludge in the reactor.

Figure 5.
Sludge microbial content and sedimentation performance.

Figure 6.
Granular sludge formed in the EGSB.

Figure 7.
CMBR reactor operating parameters.


Table 1.
Quality of raw wastewater and treated water.
| pH | COD (mg/L) | NH4+-N (mg/L) | Suspended Solids (SS) (mg/L) | |
|---|---|---|---|---|
| Inlet | 4.74–6.88 | 65,000–80,000 | 200–400 | 2290–3440 |
| Effluent | 6-9 | 300 | 50 | 200 |
Table 2.
Sludge properties and liquid upward flow rate at each stage in the reactor.
| Time | Average Particle Size/ mm | Sludge State | The Rising Flow Rate of Liquid in the Reactor (m/h) |
|---|---|---|---|
| Start | 0.392 | Flocculent | 1 |
| 14 days | 0.436 | Flocculent (small amounts of fine particles) | 1 |
| 43 days | 0.668 | Partially granulated sludge | 2 |
| 86 days | 1.556 | Uniform granular sludge | 3 |
| 120 days | 1.542 | Uniform granular sludge | 3 |
Table 3.
Treatment performance of each unit.
| pH | COD (mg/L) | NH4+-N (mg/L) | SS (mg/L) | |
|---|---|---|---|---|
| EGSB anaerobic section | 6.42 | 16,800 | – | 2020 |
| EGSB microscopic section | 6.37 | 941 | 178.33 | 241 |
| CMBR | 7.59 | 162 | 33.79 | 143 |
| Total discharge | 7.55 | 141 | 33.03 | 83 |
Table 4.
Operating costs.
| Project | Details | Fees (RMB 10,000/Year) | Cost per Ton of Water (CNY/Ton) |
|---|---|---|---|
| Electricity costs | Electricity Tariff (0.75 CNY/kwh) | 4.25 | 4.66 |
| Pharmacy costs | Potassium dihydrogen phosphate, urea, sodium bicarbonate, microbial promoter (added as appropriate for the operation) Other agents (flocculant polyacrylamide, coagulant polymeric aluminum chloride, ferric chloride, etc. used in sludge dewatering machines) | 3.83 | 4.2 |
| Repair costs | Discounted at 2.2% of the original value of fixing assets | 1.21 | 1.33 |
| Daily maintenance costs | Routine maintenance of fixed assets, including maintenance of automatic control systems, a strong inspection of dosage instruments, preventive testing of electrical equipment, and the cost of materials used for some routine repairs. At 1% of the original value of fixed assets | 0.55 | 0.60 |
| Depreciation costs | Set useful life of 20 years, the residual value of assets at 10% | 2.475 | 2.71 |
| Sludge disposal costs | Costs for sludge discharge, sludge dewatering, sludge compaction, off-site transport, and environmentally sound landfill disposal during reactor operation | 560 | 0.08 |
| Other costs | For example, the water treatment process is used to flush various types of structures, membrane modules, treatment equipment water consumption, reactor operation, commissioning and routine maintenance of sewage, sludge test fee, greening costs, etc. | 1 | 1.48 |
Publisher’s Note: MDPI stays neutral with regard to jurisdictional claims in published maps and institutional affiliations. |
© 2022 by the authors. Licensee MDPI, Basel, Switzerland. This article is an open access article distributed under the terms and conditions of the Creative Commons Attribution (CC BY) license (https://creativecommons.org/licenses/by/4.0/).
Share and Cite
MDPI and ACS Style
Zhang, X.; Wang, D.; Jin, Y. Application of the EGSB-CMBR Process to High-Concentration Organic Wastewater Treatment. Processes 2022, 10, 1039. https://0-doi-org.brum.beds.ac.uk/10.3390/pr10051039
AMA Style
Zhang X, Wang D, Jin Y. Application of the EGSB-CMBR Process to High-Concentration Organic Wastewater Treatment. Processes. 2022; 10(5):1039. https://0-doi-org.brum.beds.ac.uk/10.3390/pr10051039
Chicago/Turabian StyleZhang, Xuli, Dunqiu Wang, and Yue Jin. 2022. "Application of the EGSB-CMBR Process to High-Concentration Organic Wastewater Treatment" Processes 10, no. 5: 1039. https://0-doi-org.brum.beds.ac.uk/10.3390/pr10051039
Note that from the first issue of 2016, this journal uses article numbers instead of page numbers. See further details here.