
Using Periphyton Assemblage and Water Quality Variables to Assess the Ecological Recovery of an Ecologically Engineered Wetland Affected by Acid Mine Drainage after a Dry Spell


 ,
,
Abstract
:1. Introduction
2. Materials and Methods
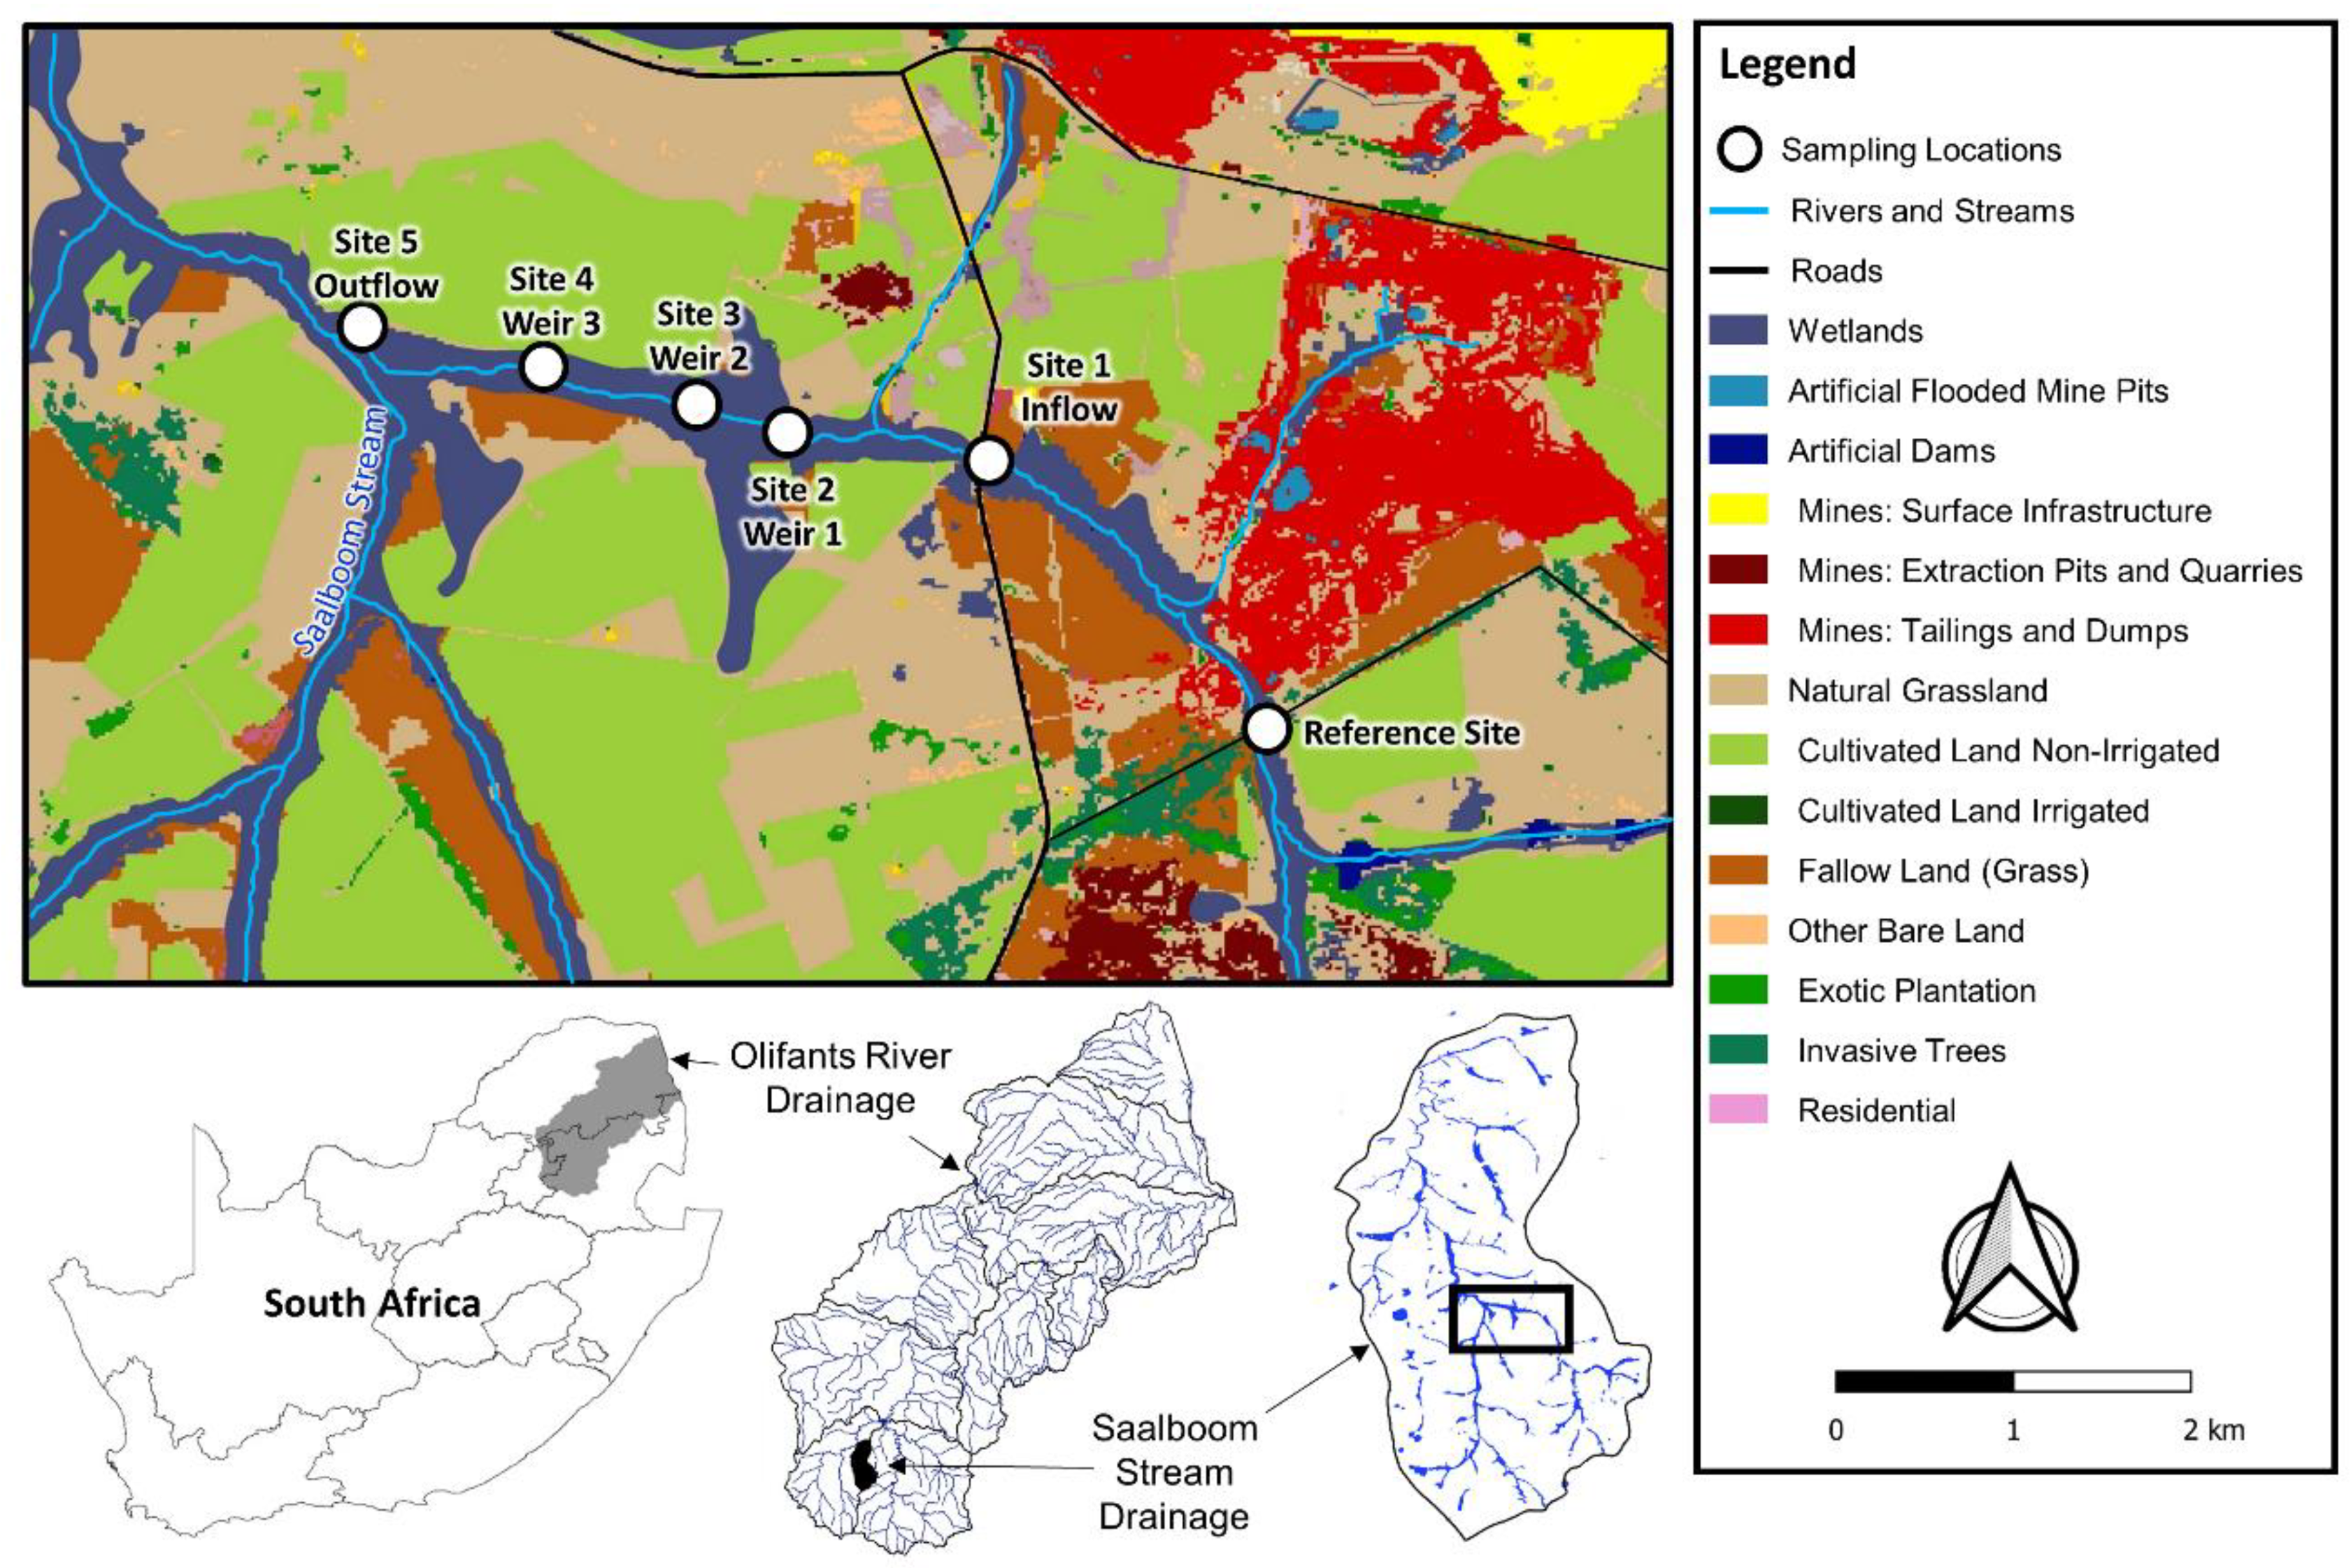
2.1. Background and Description of the Study Site
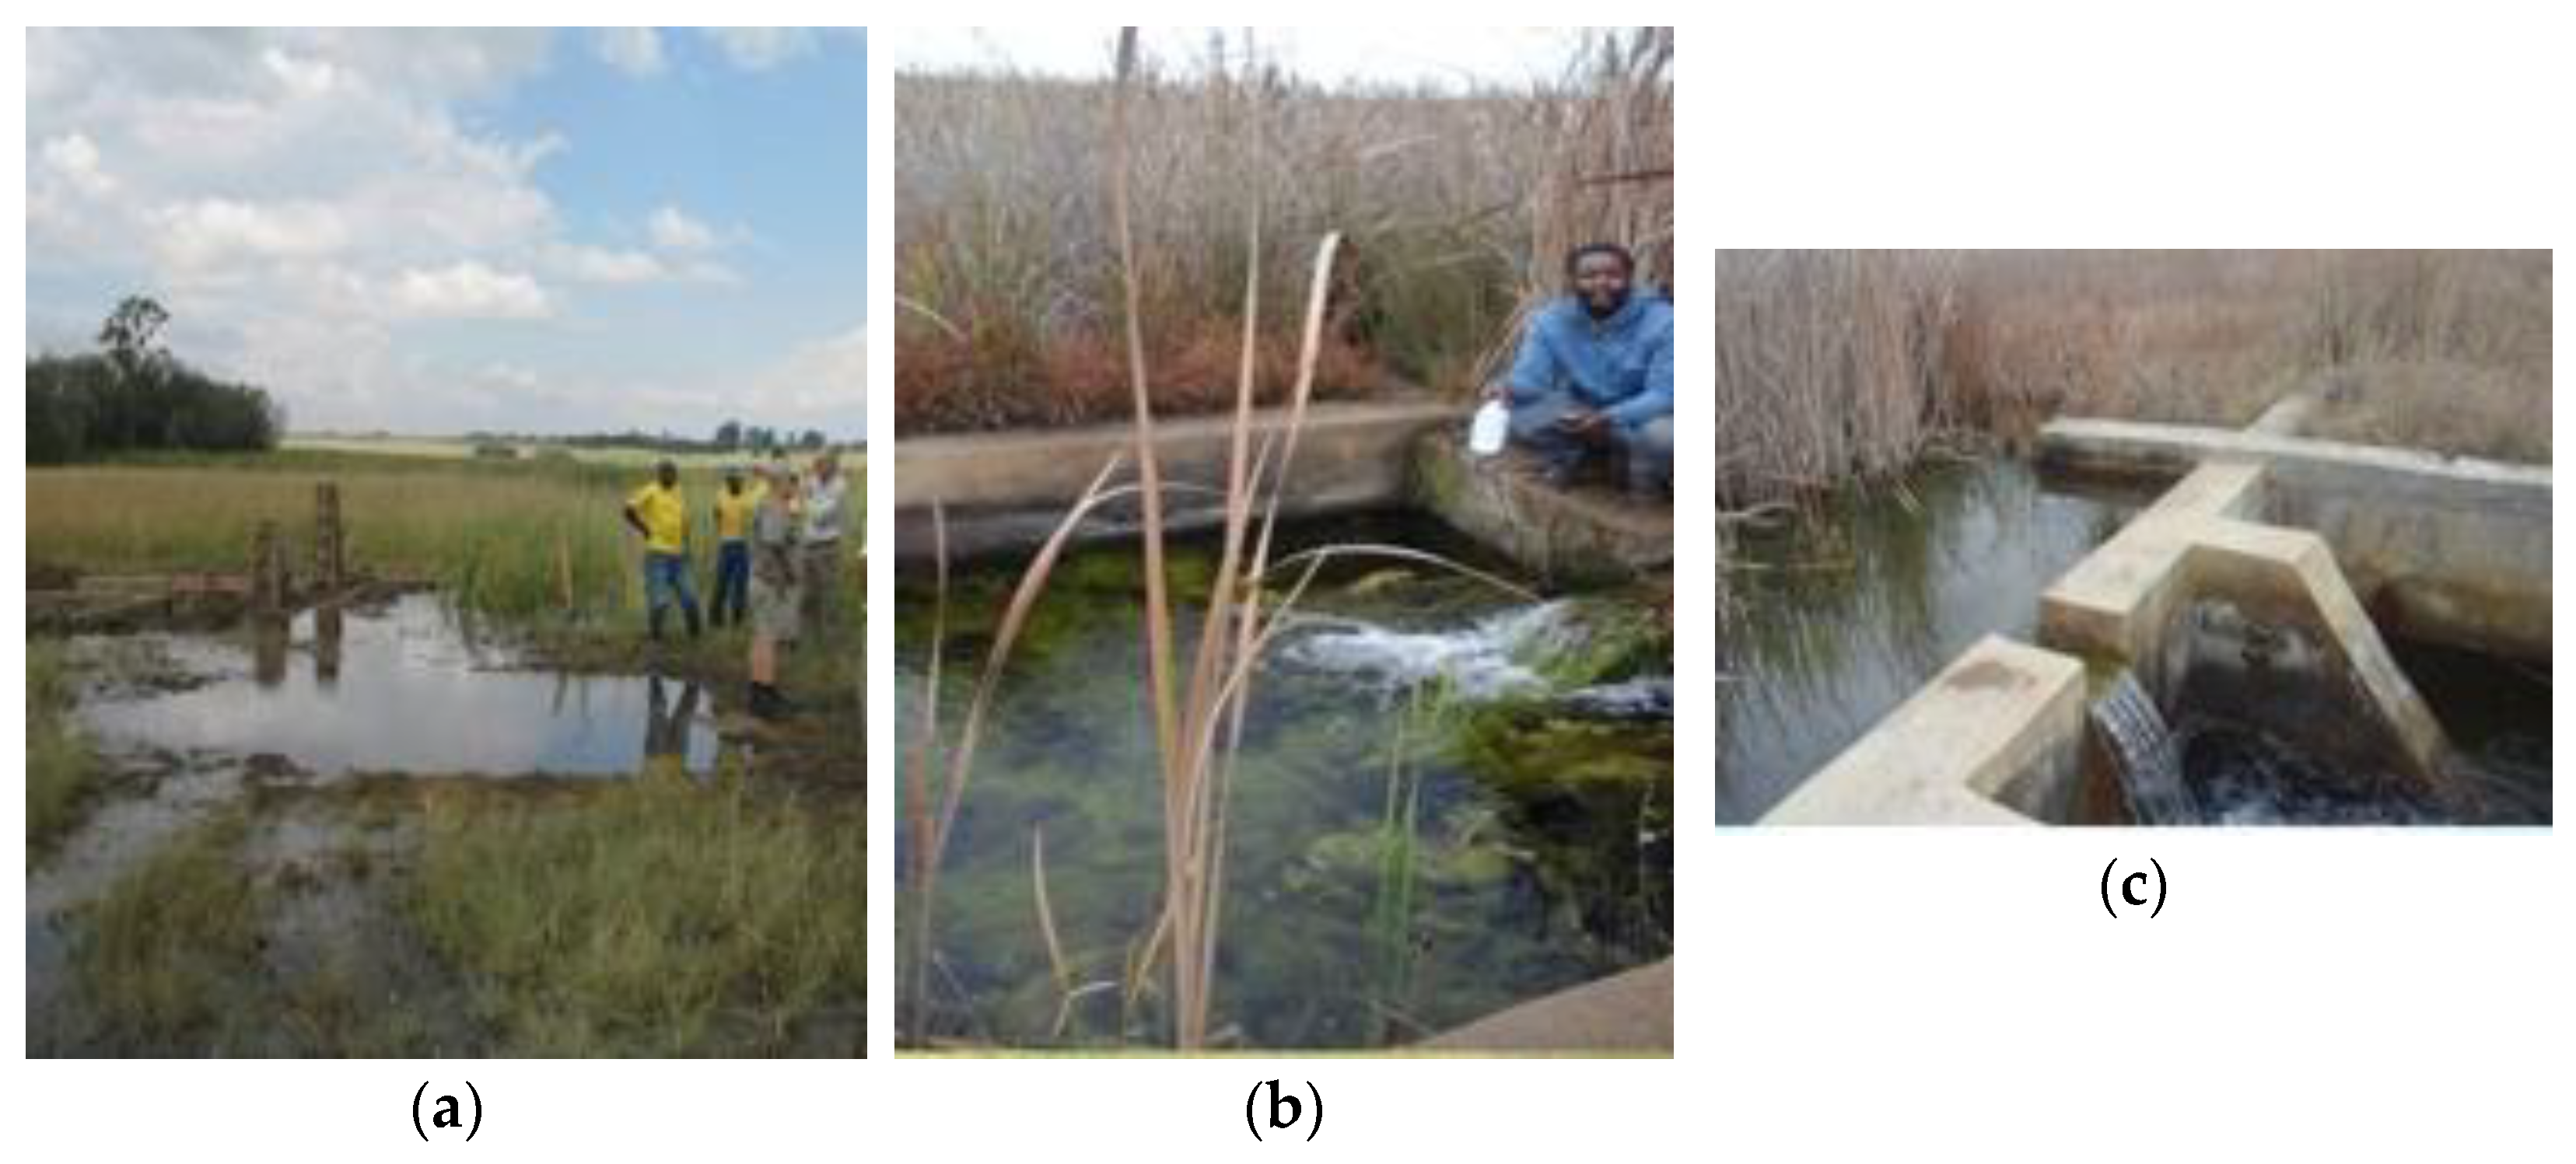
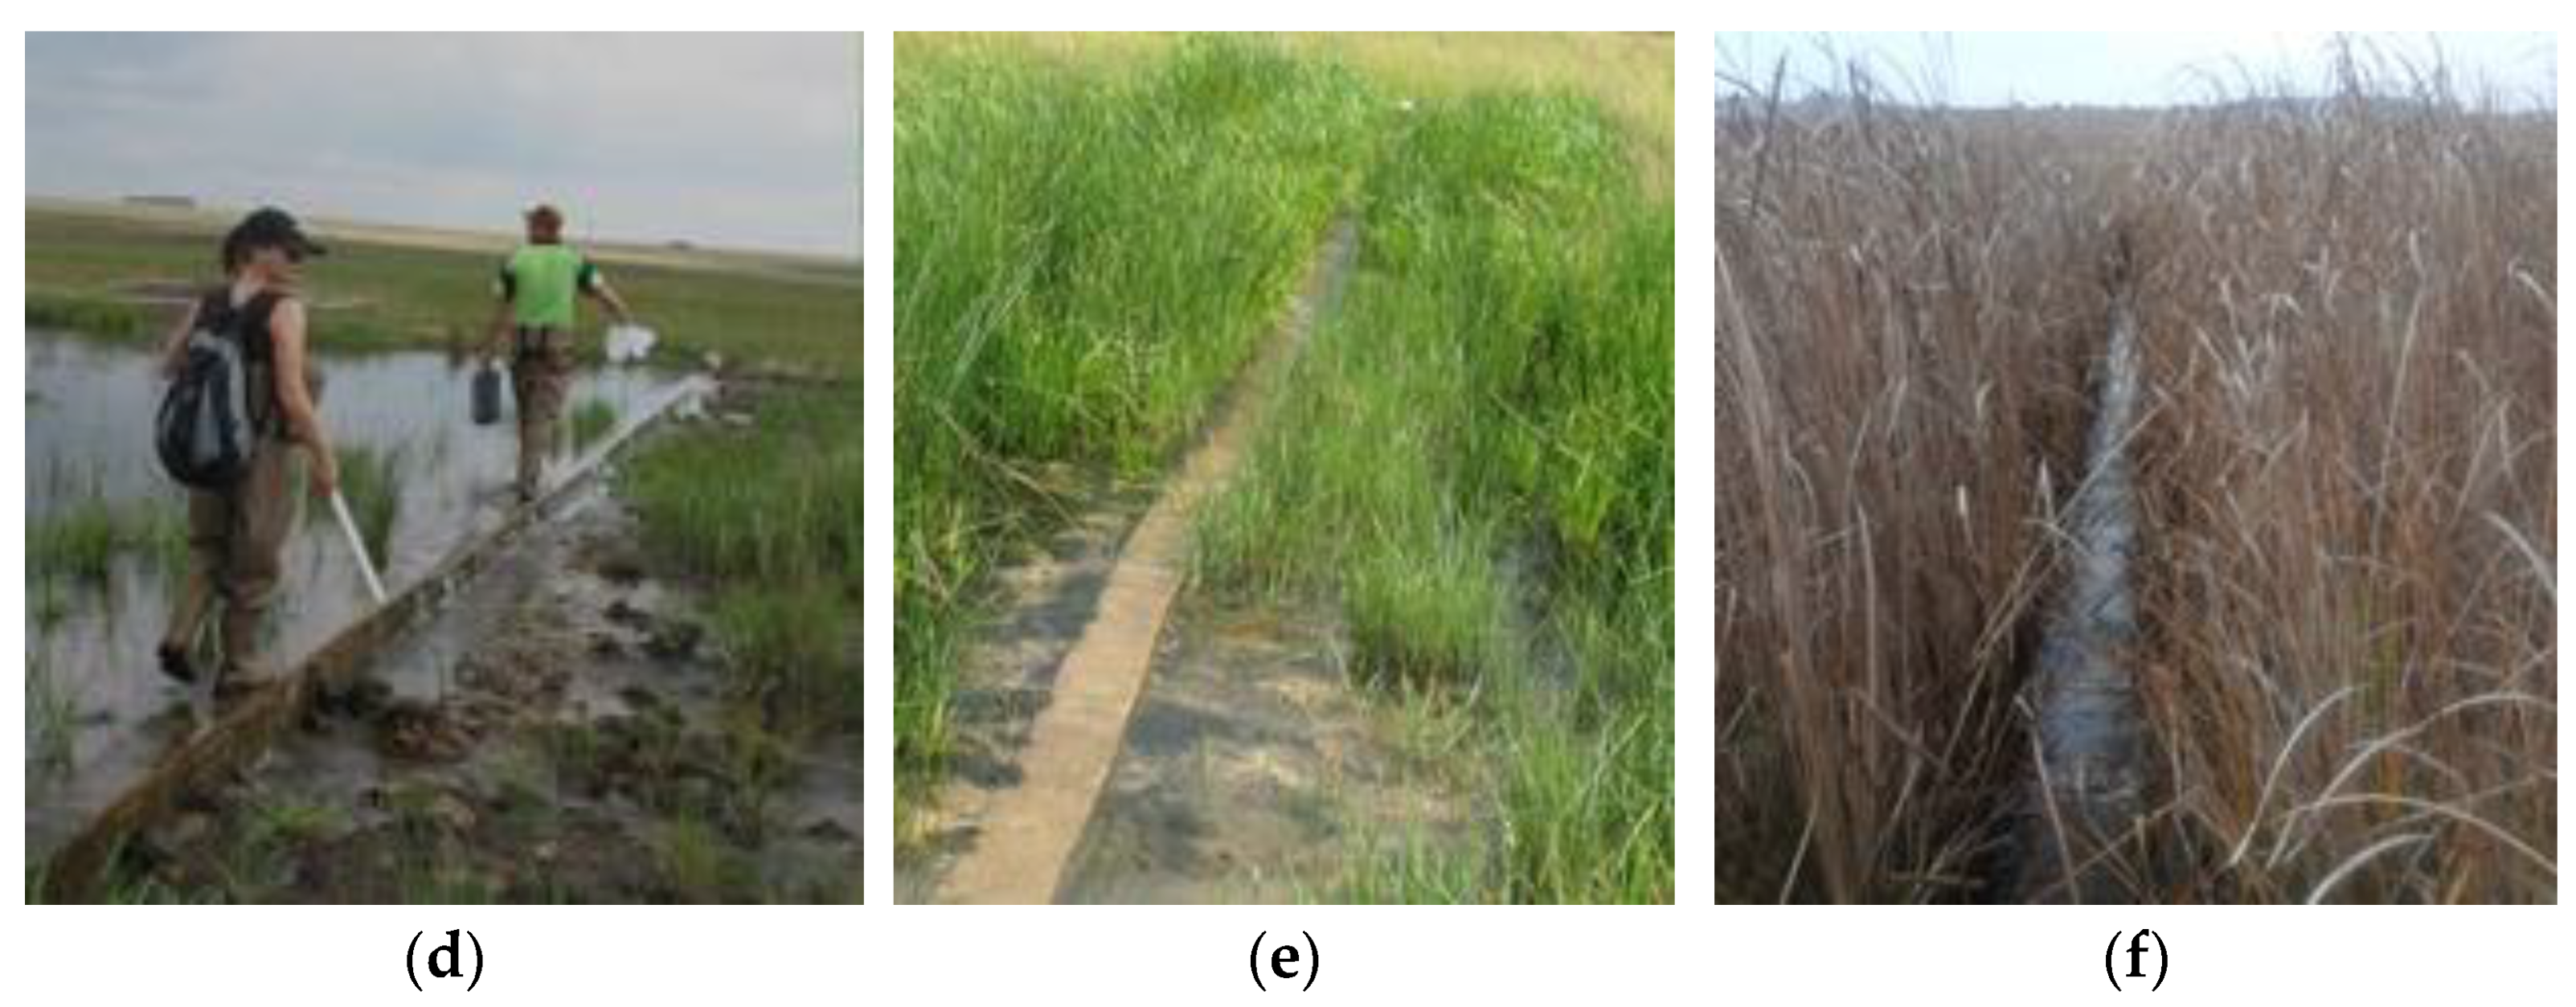
2.2. Surface Water Sampling
2.3. Periphyton Sampling
- Absent species: not present in the samples collected;
- Rare species: present in less than 25% of the samples collected;
- Low frequency species: present in between 26 and 50% of the samples collected;
- Frequent species: present in between 51 and 90% of the samples collected;
- Permanent species: present in more than 90% of the samples collected.
2.4. Wetland Substrate Cover and Erosion
2.5. Data Analysis
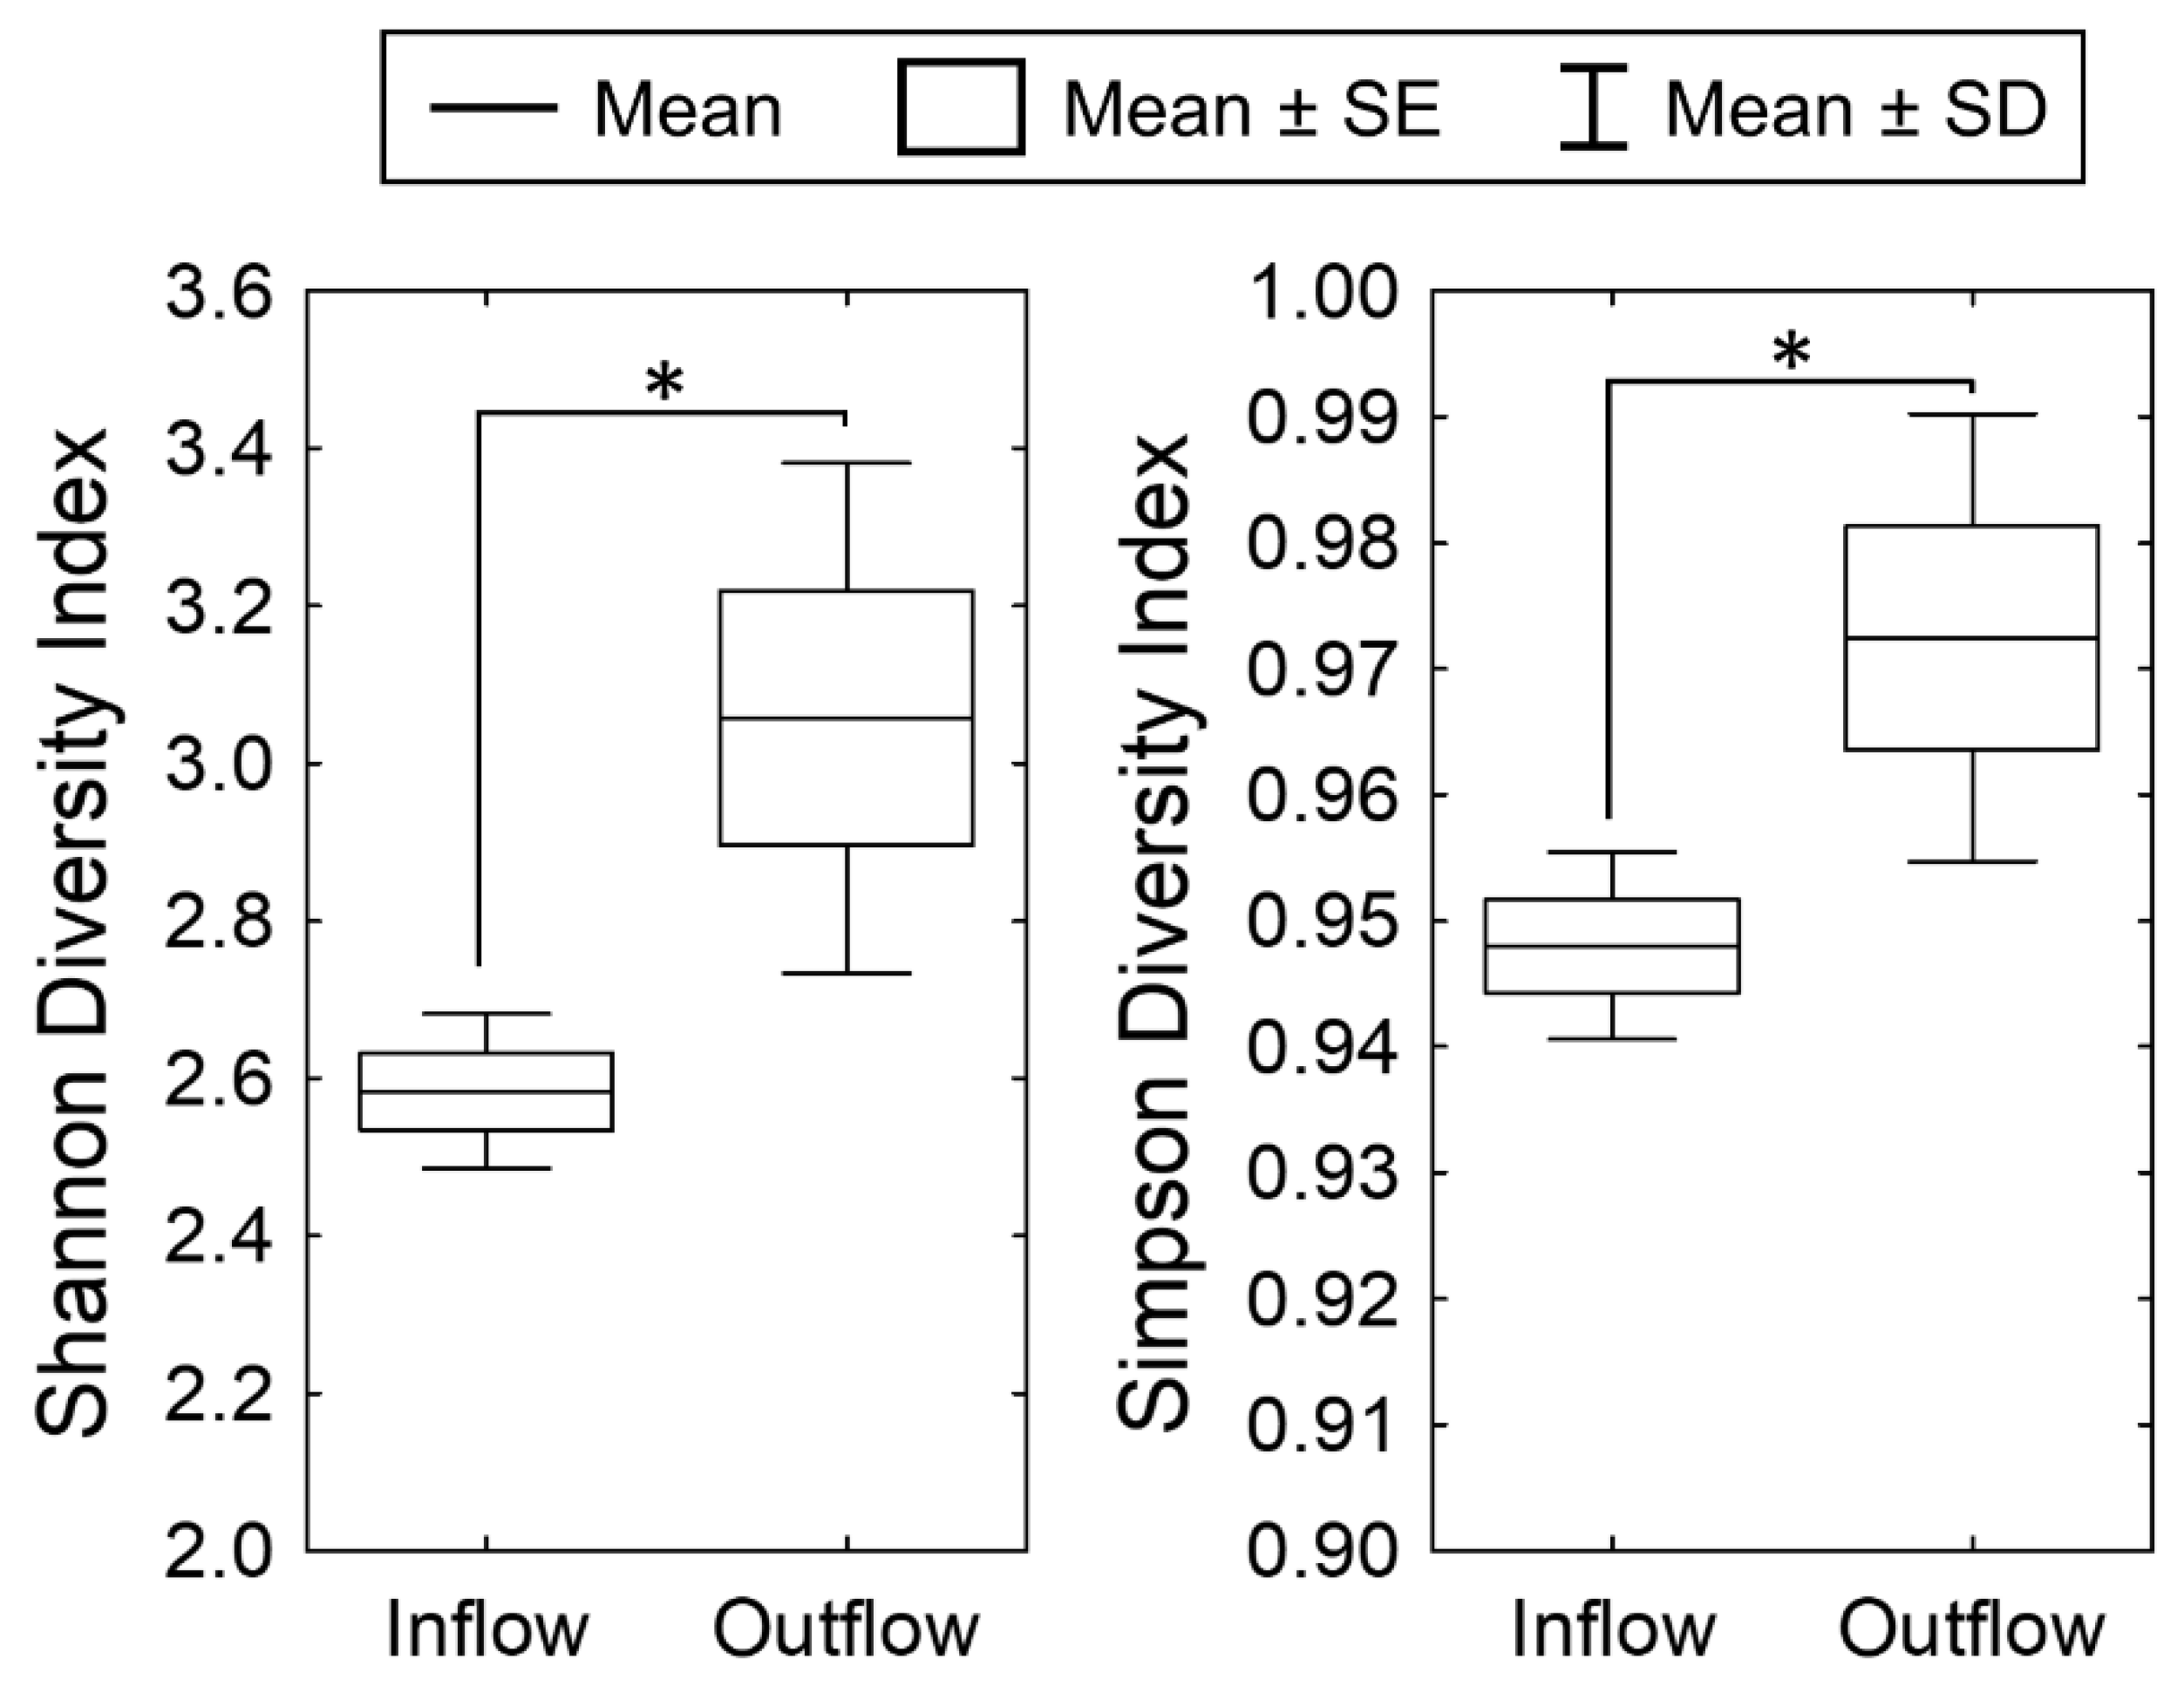
3. Results
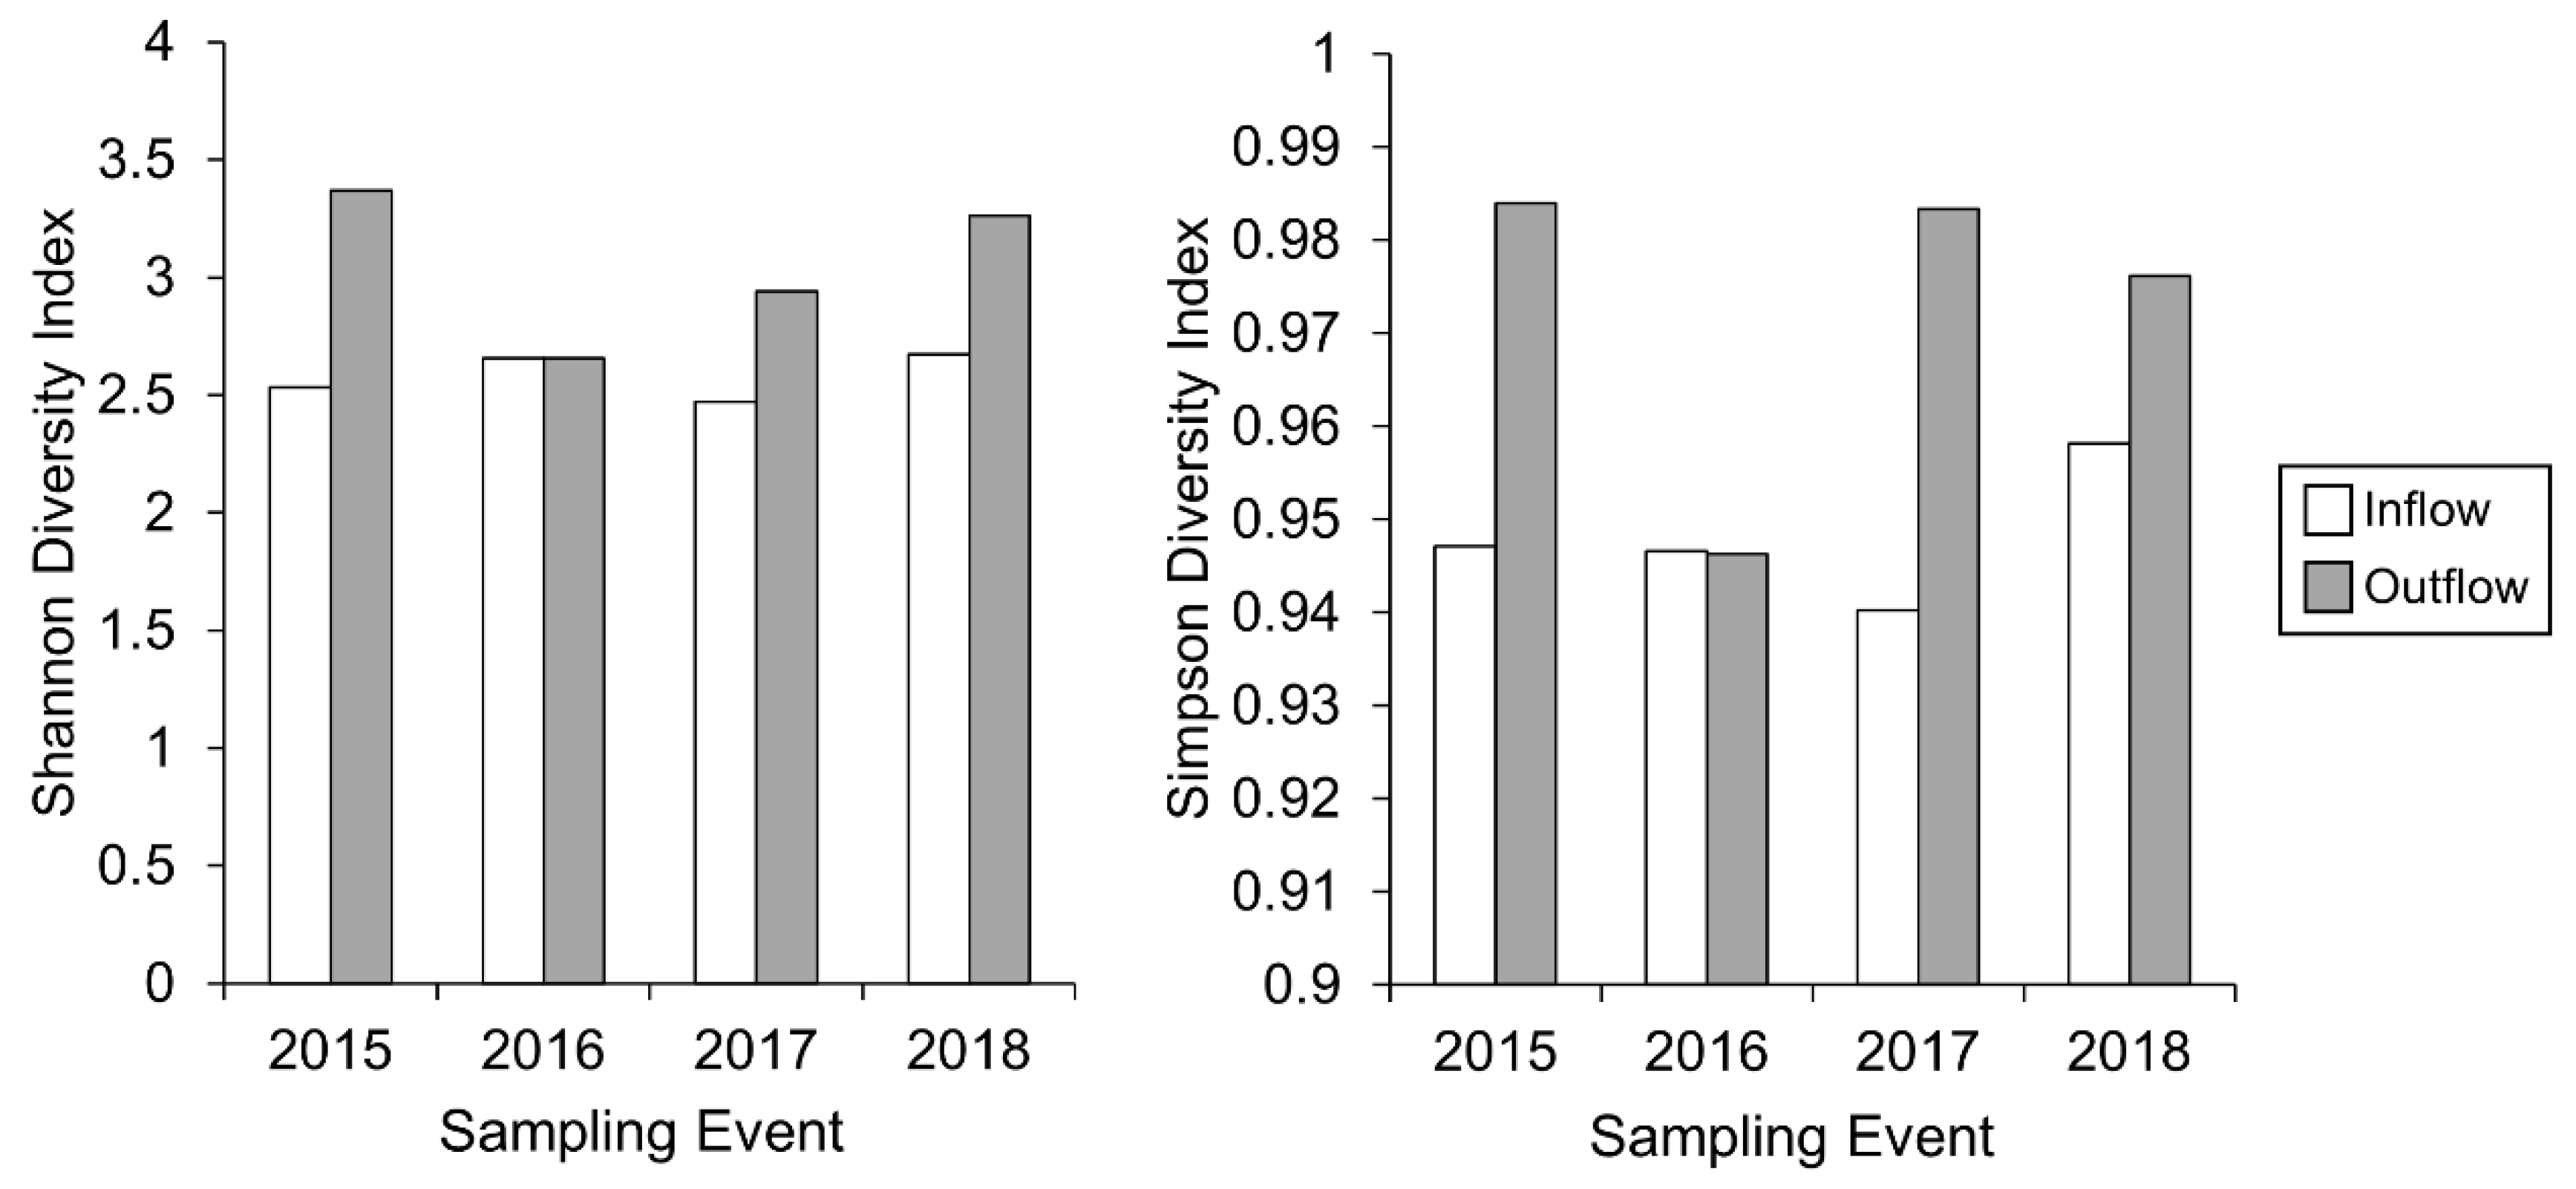
3.1. Dynamics of Periphyton at the Inflow of the Ecologically Engineered Wetland (2015–2018)
3.2. Dynamics of Periphyton at the Outflow of the Wetland (2015–2018)
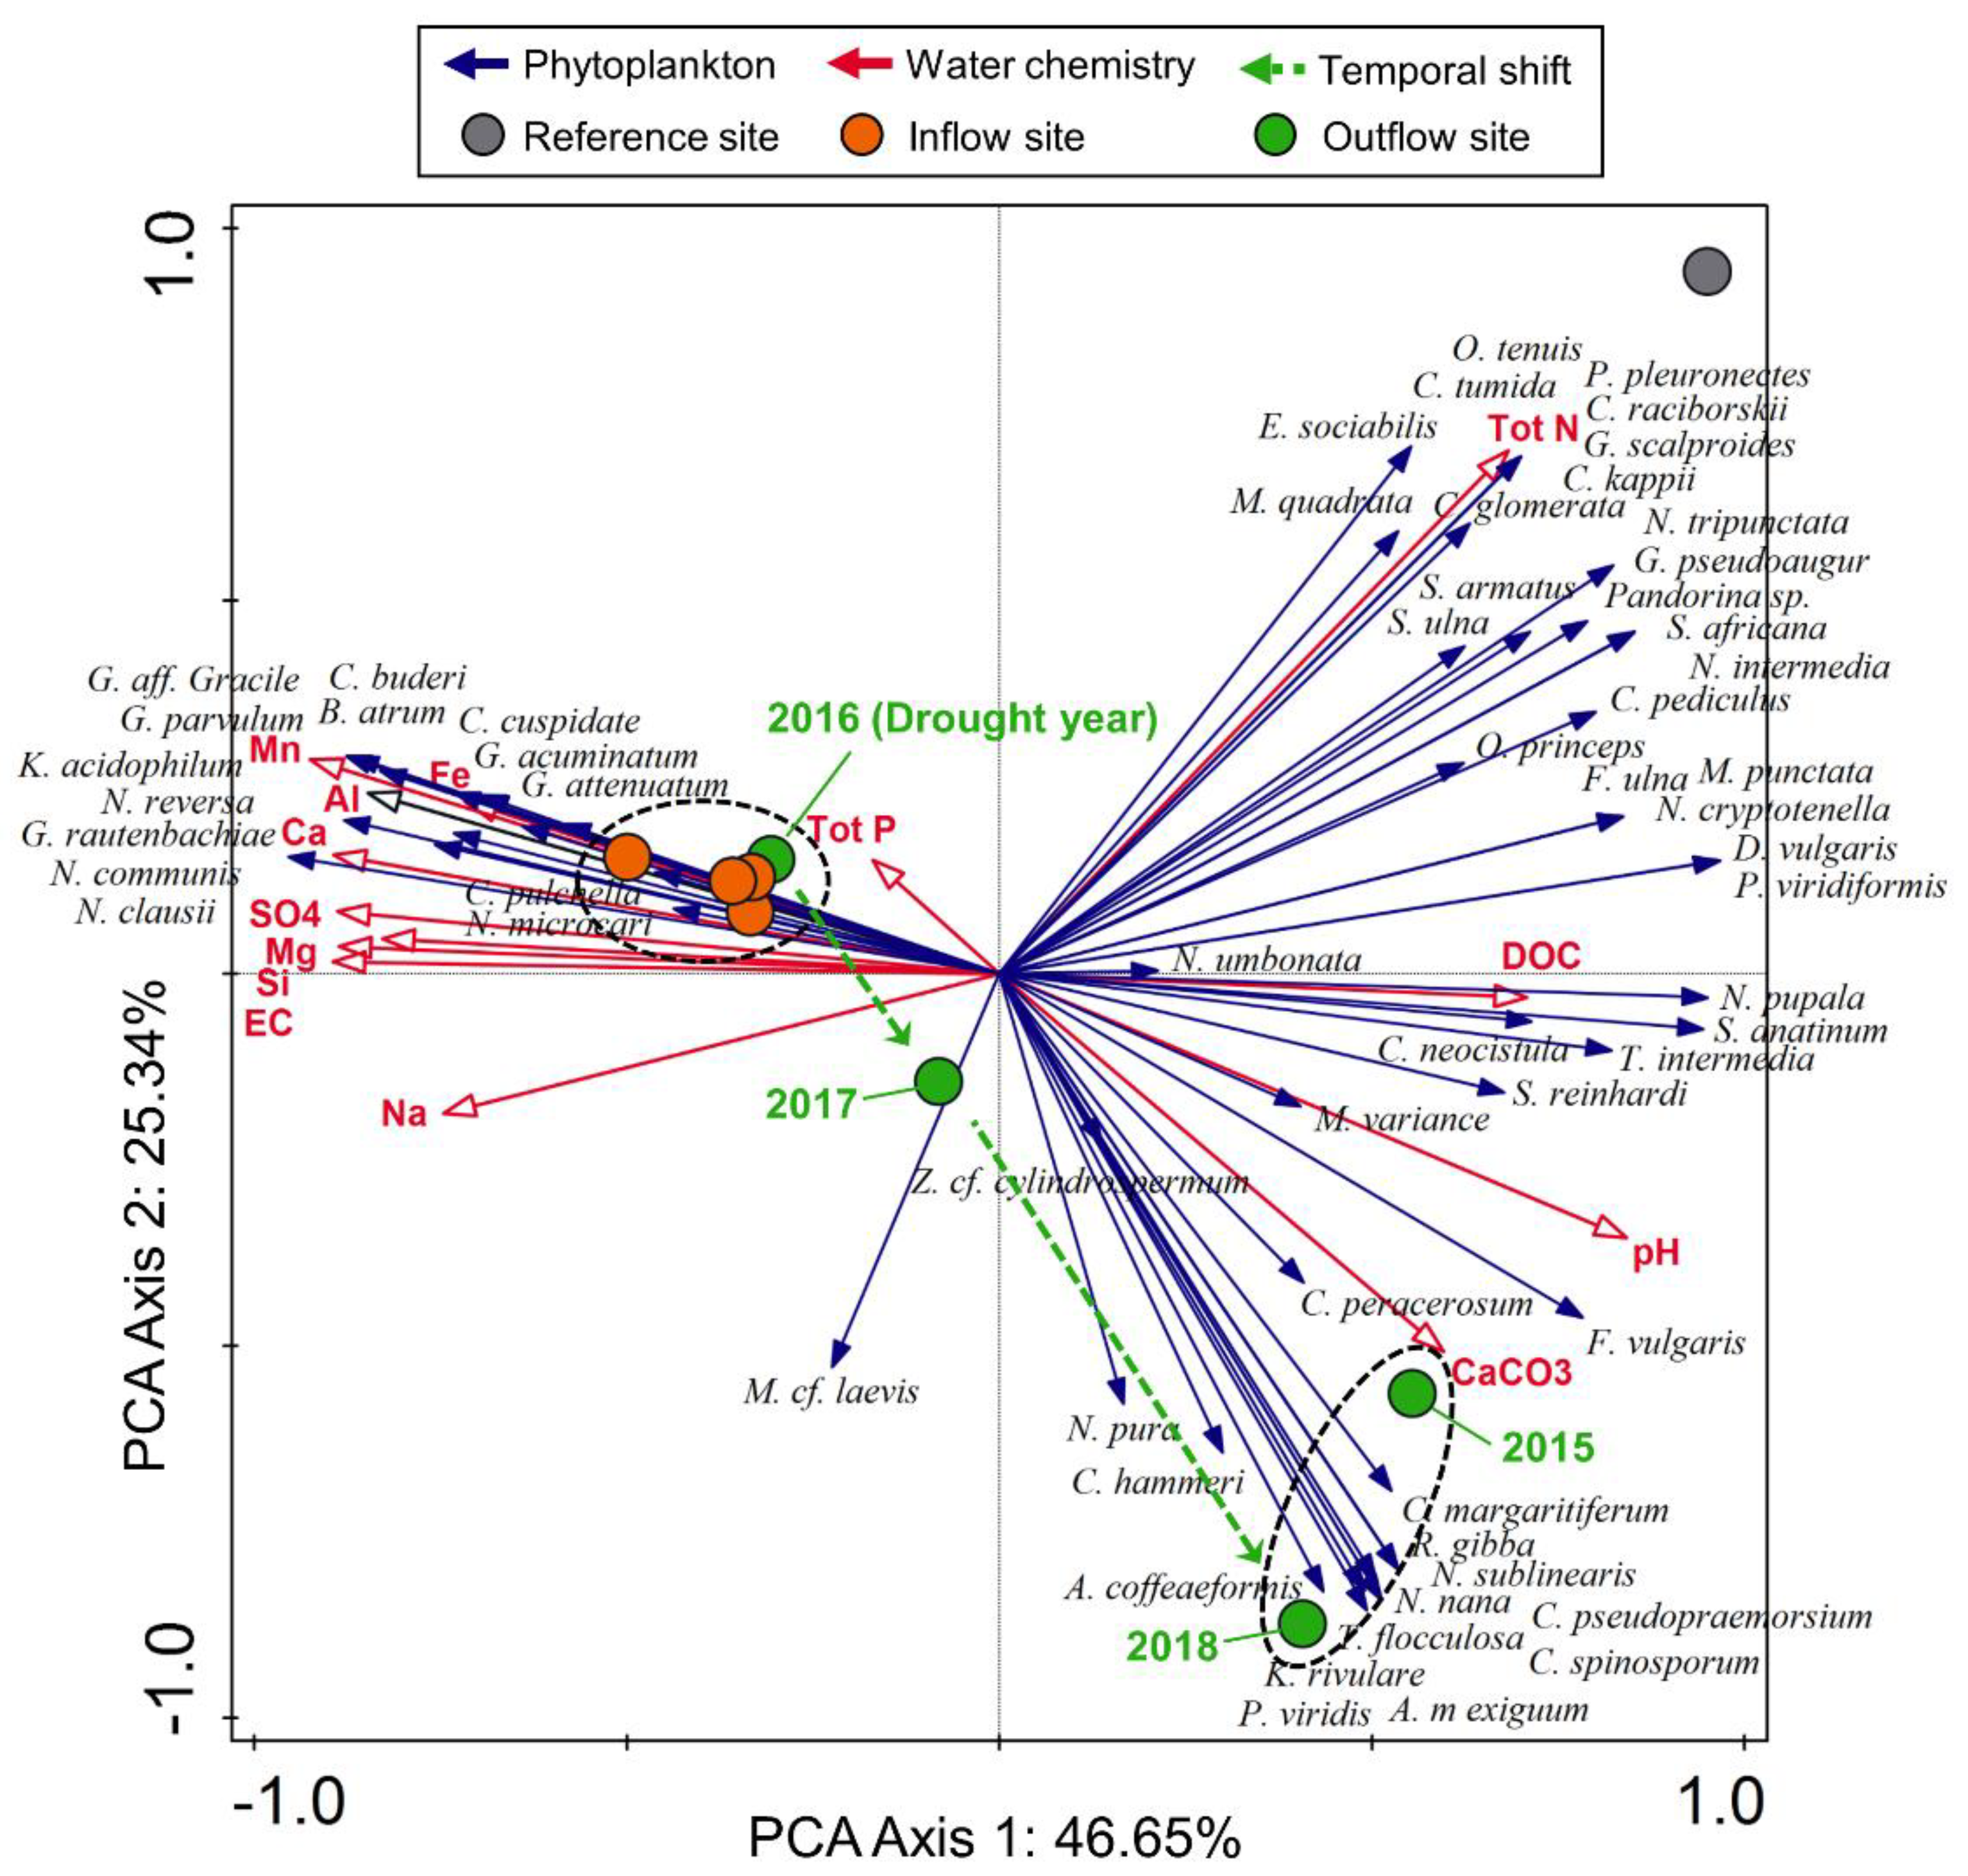
3.3. Periphyton Dynamics after the Dry Spell of 2016
3.4. Surface Water Chemistry
4. Discussion
5. Conclusions
Author Contributions
Funding
Institutional Review Board Statement
Informed Consent Statement
Data Availability Statement
Acknowledgments
Conflicts of Interest
References
- Cui, L.J. Evaluation of functions of Poyang Lake ecosystem. Chin. J. Ecol. 2004, 23, 47–51. [Google Scholar]
- Oberholster, P.J.; Cheng, P.; Botha, A.-M.; Genthe, B. The potential of selected macroalgal species for treatment of AMD at different pH ranges in temperate regions. Water Res. 2014, 60, 82–92. [Google Scholar] [CrossRef] [Green Version]
- Atazadeh, E.; Barton, A.; Shirinpour, M.; Zarghami, M.; Rajabifard, A. River management and environmental water allocation in regulated ecosystems of arid and semi-arid regions—A review. Fundam. Appl. Limnol. 2020, 193, 327–345. [Google Scholar] [CrossRef]
- Opitz, J.; Bauer, M.; Eckert, J.; Peiffer, S.; Alte, M. Optimising Operational Reliability and Performance in Aerobic Passive Mine Water Treatment: The Multistage Westfield Pilot Plant. Water Air Soil Pollut. 2022, 233, 66. [Google Scholar] [CrossRef]
- Kadlec, R.; Wallace, S. Treatment Wetlands, 2nd ed.; CRC Press: Boca Raton, FL, USA, 2009. [Google Scholar]
- Vymazal, J. Constructed wetlands for treatment of industrial wastewaters: A review. Ecol. Eng. 2014, 73, 724–751. [Google Scholar] [CrossRef]
- Zedler, J.B. Progress in wetland restoration ecology. Trends Ecol. Evol. 2000, 15, 402–407. [Google Scholar] [CrossRef]
- Kadlec, R.; Knight, R.; Vymazal, J.; Brix, H.; Cooper, P.; Haberl, R. Constructed Wetlands for Pollution Control: Processes, Performance, Design and Operation; IWA Publishing: London, UK, 2000. [Google Scholar]
- Mitsch, W.; Zhang, L.; Stefanik, K.; Nahlik, A.; Anderson, C.; Bernal, B.; Hernandez, M.; Song, K. Creating wetlands: Primary succession, water quality changes, and self-design over 15 years. BioScience 2012, 62, 237–250. [Google Scholar] [CrossRef] [Green Version]
- Kleinmann, B.; Skousen, J.; Wildeman, T.; Hedin, B.; Nairn, B.; Gusek, J. The early development of passive treatment systems for mining-influenced water: A North American perspective. Mine Water Environ. 2021, 40, 818–830. [Google Scholar] [CrossRef]
- Gusek, J. A periodic table of passive treatment for mining influenced water. In Proceedings of the 2009 National Meeting of the American Society of Mining and Reclamation, Billings, MT, USA, 30 May–5 June 2009; pp. 550–562. [Google Scholar] [CrossRef]
- Nairn, R.W.; LaBar, J.A.; Strevett, K.A.; Strosnider, W.H.; Morris, D.; Neely, C.A.; Garrido, A.; Santamaria, B.; Oxenford, L.; Kauk, K.; et al. A large, multi-cell, ecologically engineered passive treatment system for ferruginous lead-zinc mine waters. In Proceedings of the International Mine Water Association Annual Meeting, Sydney, NS, Canada, 5–9 September 2010; pp. 255–258. [Google Scholar]
- Skousen, J.; Sexstone, A.; Ziemkiewicz, P. Acid mine drainage control and treatment. In Reclamation of Drastically Disturbed Lands; Agronomy Monographs: Madison, WI, USA, 2000; p. 41. [Google Scholar]
- URS. Passive and Semi-Active Treatment of Acid Rock Drainage from Metal Mines—State of the Practice; U.S. Army Corps of Engineers: Concord, MA, USA, 2003.
- Watzlaf, G.R.; Schroeder, K.T.; Kairies, C. Long-term performance of alkalinity-producing passive systems for the treatment of mine drainage. In Proceedings of the 2000 National Meeting of the American Society for Surface Mining and Reclamation, Tampa, FL, USA, 11–15 June 2000; pp. 262–274. [Google Scholar] [CrossRef]
- Wieder, R.K. The Kentucky Wetlands Project: A Field Study to Evaluate Man-Made Wetlands for Acid Coal Mine Drainage Treatment; Final Report to the U.S. Office of Surface Mining; Villanova University: Villanaova, PA, USA, 1992.
- Sobolewski, A.; Sobolewski, N. Holistic design of wetlands for mine water treatment and biodiversity: A case study. Mine Water Environ. 2022, 41, 292–299. [Google Scholar] [CrossRef]
- Skousen, J.; Zipper, C.E.; Rose, A.; Ziemkiewicz, P.F.; Nairn, R.; McDonald, L.M.; Kleinmann, R.L. Review of passive systems for acid mine drainage treatment. Mine Water Environ. 2017, 36, 133–153. [Google Scholar] [CrossRef] [Green Version]
- Mitsch, W.J.; Wilson, R.F. Improving the success of wetland creation and restoration with know-how, time and self-design. Ecol. Appl. 1996, 6, 77–83. [Google Scholar] [CrossRef]
- Simenstad, C.A.; Cordell, J.R. Ecological assessment criteria for restoring anadromous salmon habitat in Pacific Northwest estuaries. Ecol. Eng. 2000, 15, 283–302. [Google Scholar] [CrossRef]
- Zedler, J.B.; Callaway, J. Evaluating the progress of engineered tidal wetlands. Ecol. Eng. 2000, 15, 211–225. [Google Scholar] [CrossRef]
- Pat-Espadas, A.M.; Portales, R.L.; Amabilis-Sosa, L.E.; Gomez, G.; Vidal, G. Review of constructed wetlands for acid mine drainage treatment. Water 2018, 10, 1685. [Google Scholar] [CrossRef] [Green Version]
- Oberholster, P.J.; McMillan, P.; Durgapersad, K.; Botha, A.-M.; De Klerk, A.R. The development of a wetland classification and risk assessment index (WCRAI) for non-wetland specialists for the management of natural freshwater wetland ecosystems. Water Air Soil Pollut. 2013, 225, 1833. [Google Scholar] [CrossRef]
- Van Deventer, H.; Smith-Adao, L.; Mbona, N.; Petersen, C.; Skowno, A.; Collins, N.B.; Grenfell, M.; Job, N.; Lötter, M.; Ollis, D.; et al. South African National Biodiversity Assessment 2018: Technical Report; South African Inventory of Inland Aquatic Ecosystems (SAIIAE); CSIR Report Number CSIR/NRE/ECOS/IR/2018/0001/A; Council for Scientific and Industrial Research (CSIR) and South African National Biodiversity Institute (SANBI): Pretoria, South Africa, 2018; Volume 2a. [Google Scholar]
- Hogsden, K.L.; Harding, J.S. Anthropogenic and natural sources of acidity and metals and their influence on the structure of stream food webs. Environ. Pollut. 2012, 162, 466–474. [Google Scholar] [CrossRef]
- Jarvis, A.P.; Younger, P.L. Broadening the scope of mine water environmental impact assessment: A UK perspective. Environ. Impact Assess. Rev. 2000, 20, 85–96. [Google Scholar] [CrossRef]
- DeNicola, D.M. A review of diatoms found in highly acidic environments. Hydrobiologia 2000, 433, 111–122. [Google Scholar] [CrossRef]
- Van Ho, A.; Ward, D.M.; Kaplan, J. Transition metal transport in yeast. Annu. Rev. Microbiol. 2002, 56, 237–261. [Google Scholar] [CrossRef]
- Baudoin, M.-A.; Vogel, C.; Nortje, K.; Naik, M. Living with drought in South Africa: Lessons learnt from the recent EL Nino drought period. Int. J. Disaster Risk Reduct. 2017, 23, 128–137. [Google Scholar] [CrossRef]
- Wehr, J.D.; Sheath, R.G. Habitats of freshwater algae. In Freshwater Algae of North America: Ecology and Classification; Wehr, J.D., Sheath, R.G., Kociolek, J.P., Eds.; Academic Press: San Diego, CA, USA, 2003; pp. 13–29. [Google Scholar]
- Korneva, L.G.; Mineeva, N.M. Phytoplankton composition and pigment concentrations as indicators of water quality in the Rybinsky reservoir. Hydrobiologia 1996, 322, 255–259. [Google Scholar] [CrossRef]
- Willén, E. Phytoplankton and water quality characterization: Experiences from the Swedish large lakes Mälaren, Hjälmaren, Vätten and Vänern. AMBIO 2001, 30, 529–537. [Google Scholar] [CrossRef] [PubMed]
- Gogoi, P.; Sinha, A.; Tayung, T.; Naskar, M.; Das Sarkar, S.; Ramteke, M.H.; Das, S.K.; Kumar, K.L.; Suresh, V.R.; Das, B.K. Unravelling the structural changes of periphyton in relation to environmental variables in a semilotic environment in the Sundarban eco-region, India. Arab. J. Geosci. 2021, 14, 2038. [Google Scholar] [CrossRef]
- Department of Forestry, Fisheries & the Environment. South African National Land Cover (SANLC); DFFE: Pretoria, South Africa, 2020.
- Tóth, J.; Hayashi, M. The theory of basinal gravity flow of groundwater and its impacts on hydrology in Japan. J. Groundw. Hydrol. 2010, 52, 335–354. [Google Scholar] [CrossRef] [Green Version]
- Oberholster, P.J.; Madlala, T.; Oberholster, P.F. Post Restoration Monitoring of the Zaalklapspruit Wetland with Special Reference to Groundwater-Surface Water Interaction; Coaltech Technical Report: E2019-7; Coaltech: Johannesburg, South Africa, 2019; pp. 1–21. [Google Scholar]
- Shelton, L.R. Field Guide for Collecting and Processing Stream Water Samples for the National Water Quality Assessment Program; U.S. Geological Survey Open File Report 94-455; U.S. Geological Survey: Reston, VA, USA, 1994.
- American Public Health Association (APHA). Standard Methods for Examination of Water and Wastewater, 20th ed.; American Public Health Association: Washington, DC, USA, 2006. [Google Scholar]
- Appelo, C.A.J.; Postma, D. Geochemistry, Groundwater and Pollution, 2nd ed.; A.A. Balkema Publishers: Leiden, The Netherlands, 2005. [Google Scholar]
- Department of Water Affairs. South African Water Quality Guidelines: Vol. 7. Aquatic Ecosystems, 2nd ed.; Department of Water Affairs and Forestry: Pretoria, South Africa, 1996.
- Steinman, A.D.; Lamberti, G.A.; Leavitt, P.R. Biomass and Pigments of Benthic Algae. In Methods in Stream Ecology; Hauer, F.R., Lamberti, G.A., Eds.; Academic Press: Amsterdam, The Netherlands, 2006; pp. 357–377. [Google Scholar]
- Ostenfeld, C.H.; Nygaard, G. On the phytoplankton of the Gatun Lake, Panama Canal. Dan. Bot. Ark. Udg. Dan. Bot. Foren. 1925, 4, 1–16. [Google Scholar]
- Truter, E. An Aid to the Identification of the Dominant and Commonly Occurring Genera of Algae Observed in Some South African Impoundments; Department of Water Affairs, Hydrological Institute: Pretoria, South Africa, 1987.
- Komarek, J.; Anagnostidis, K. Cyanoprokaryota: Chroococcales. In Susswasserflora von Mitteleuropa 19/1; Ettl, H., Gartner, H., Heynig, D., Mollenhauer, D., Eds.; Gustav Fischer: Stuttgart, Germany, 1999. [Google Scholar]
- Komarek, J.; Anagnostidis, K. Cyanoprokaryota: Oscillatoriales. In Susswasserflora von Mitteleuropa 19/2; Budel, B., Gartner, G., Krienitz, L., Schagerl, M., Eds.; Elsevier: Munchen, Germany, 2005. [Google Scholar]
- Van Vuuren, S.; Taylor, J.C.; Van Ginkel, C.; Gerber, A. Easy Identification of the Most Common Freshwater Algae; North-West University and Department of Water Affairs and Forestry: Pretoria, South Africa, 2006. [Google Scholar]
- Taylor, J.C.; Harding, W.R.; Archibald, C.G.M. An Illustrated Guide to Some Common Diatom Species from South Africa; Water Research Commission: Pretoria, South Africa, 2007.
- Stancheva, R.; Sheath, R.G.; Hall, J.D. Systematics of the genus Zygnema (Zygnematophyceae, Charophyta) from Californian watersheds. J. Phycol. 2012, 48, 409–422. [Google Scholar] [CrossRef] [PubMed]
- Porra, R.J.; Thompson, W.A.; Kriedemann, P.E. Determination of accurate extinction coefficient and simultaneous equations for assaying chlorophylls a and b extracted with four different solvents: Verification of the concentration of chlorophyll standards by atomic absorption spectrometry. Biochim. Biophys. Acta 1989, 975, 384–394. [Google Scholar] [CrossRef]
- Berger, W.H.; Parker, F.L. Diversity of planktonic foraminifera in deep-sea sediments. Science 1970, 168, 1345–1347. [Google Scholar] [CrossRef] [PubMed]
- Zulkifli, H. Traitement des Eaux Usées par Lagunage à Haut Rendement: Structure et Dynamique des Peuplements Phytoplanctoniques (Zulkifli, H. Wastewater Treatment by High Efficiency Lagooning: Structure and Dynamics of Phytoplankton Populations). Ph.D. Thesis, Université Montpellier I, Montpellier, France, 1992. [Google Scholar]
- Barthel, L.; De Oliveira, P.A.V.; Da Costa, R.H.R. Plankton biomass in secondary ponds treating piggery waste. Braz. Arch. Biol. Technol. 2008, 51, 1287–1298. [Google Scholar] [CrossRef]
- Stevenson, R.J.; Bahls, L.L. Periphyton protocols. In Rapid Bioassessment Protocols for Use in Streams and Wadeable Rivers: Periphyton, Benthic Macroinvertebrates, and Fish, 2nd ed.; Barbour, M.T., Gerritsen, J., Snyder, B.D., Stribling, J.B., Eds.; EPA 841-B-99-002; U.S. Environmental Protection Agency, Office of Water: Washington, DC, USA, 1999. [Google Scholar]
- Spencer, C.; Robertson, A.I.; Curtis, A. Development and testing of a rapid appraisal wetland condition index in south-eastern Australia. J. Environ. Manag. 1998, 54, 143–159. [Google Scholar] [CrossRef]
- Shannon, C.E. A mathematical theory of communication. Bell Syst. Tech. J. 1948, 27, 379–423, 636–656. [Google Scholar] [CrossRef] [Green Version]
- Simpson, E.H. Measurement of diversity. Nature 1949, 163, 688. [Google Scholar] [CrossRef]
- Van den Brink, P.J.; Van Den Brink, N.W.; Ter Braak, J.F. Multivariate analysis of ecotoxicological data using ordination: Demonstrations of utility on the basis of various examples. Australas. J. Ecotoxicol. 2003, 9, 141–156. [Google Scholar]
- Ter Braak, C.J.F.; Smilauer, P. CANOCO Reference Manual and Canodraw for Windows User’s Guide: Software for Canonical Community Ordination; Microcomputer Power: New York, NY, USA, 2002; Version 4.5. [Google Scholar]
- Gerber, A.; Cilliers, C.J.; Van Ginkel, C.; Glen, R. Easy Identification of Aquatic Plants: A Guide for the Identification of Water Plants in and Around South African Impoundments; Department of Water Affairs: Pretoria, South Africa, 2004.
- Niyogi, D.K.; Lewis, W.M., Jr.; McKnight, D.M. Effects of stress from mine drainage on diversity, biomass, and function of primary producers in mountain streams. Ecosystems 2002, 5, 554–567. [Google Scholar]
- Bray, J.P.; Broady, P.A.; Niyogi, D.K.; Harding, J.S. Periphyton communities in New Zealand streams impacted by acid mine drainage. Mar. Freshw. Res. 2008, 59, 1084–1091. [Google Scholar] [CrossRef]
- Lasmers, L.P.M.; Tomassen, H.B.M.; Roelofs, J.G.M. Sulfate-induced eutrophication and phytotoxicity in freshwater wetlands. Environ. Sci. Technol. 1998, 32, 199–205. [Google Scholar] [CrossRef]
- Caraco, N.; Cole, J.; Likens, G. Evidence for sulphate-controlled phosphorus release from sediments of aquatic systems. Nature 1989, 341, 316–318. [Google Scholar] [CrossRef]
- Smolders, A.; Roelofs, J.G.M. Sulphate-mediated iron limitation and eutrophication in aquatic ecosystems. Aquat. Bot. 1993, 46, 247–253. [Google Scholar] [CrossRef]
- Dixit, S.S.; Smol, J.P. Algal assemblages in acid-stressed lakes with particular emphasis on diatoms and chrysophytes. In Acid Stress and Microbial Interactions; Rao, S.S., Ed.; CRC Press: Boca Raton, FL, USA, 1989; pp. 91–134. [Google Scholar]
- Boekken, T.; Kroglund, F.; Lindstrom, E.-A.; Carvalho, L. Acidification of rivers and lakes. In Indicators and Methods for the Ecological Status Assessment under the Water Framework Directive: Linkage between Chemical and Biological Quality of Surface Waters; Solimini, A.G., Cardoso, A.C., Heiskanen, A.-S., Eds.; Institute for Environment and Sustainability; European Communities: Ispra, Italy, 2006. [Google Scholar]
- Muller, P. Effects of artificial acidification on the growth of periphyton. Can. J. Fish. Aquat. Sci. 1980, 37, 355–363. [Google Scholar] [CrossRef]
- Verb, R.G.; Vis, M.L. Periphyton assemblages as bioindicators of mine-drainage in unglaciated Western Allegheny Plateau lotic systems. Water Air Soil Pollut. 2005, 161, 227–265. [Google Scholar] [CrossRef]
- Stokes, W.L. Geology of Utah. Salt Lake City, Utah: Museum of Natural History; Utah Geological and Mineral Survey: Salt Lake City, UT, USA, 1986.
- Anthony, M.K. Ecology of Streams Contaminated by Acid Mine Drainage Near Reefton, South Island. Master’s Thesis, University of Canterbury, Christchurch, New Zealand, 1999. [Google Scholar]


| Sites | Bottom Substrate Characteristics | In-Stream Macrophytes | Average Site Depth (cm) | Source of Impact | Bank Stability | Average Water Column Flow Velocity | Average Benthic chl-a mg m−2 | Average Thickness Layer (mm) of Bottom Hydroxide Precipitates | Turbidity (Nephelometric Unit [NTU]) |
|---|---|---|---|---|---|---|---|---|---|
| Reference site | Sand, silt | Typha capensis | 58 cm | Agriculture activities upstream | Stable | 17 cm S−1 | 13.1 mg m−2 | 0 mm | 6 NTU |
| Inflow (Site 1) | Sand | Typha capensis | 22 cm | Coal mining AMD effluent | Poor | 41 cm S−1 | 37.5 mg m−2 | 0 mm | 2 NTU |
| Site 2 | Silt, clay | Typha capensis; Phragmites australis | 17 cm | Coal mining AMD effluent upstream | Poor | 32 cm S−1 | 16.7 mg m−2 | 3 mm | 13 NTU |
| Site 3 | Typha capensis; Pycreus nitidus; Kyllinga erecta | 14 cm | Coal mining AMD effluent upstream | Stable | 12 cm S−1 | 19.34 mg m−2 | 1 mm | 3 NTU | |
| Site 4 | Clay, sand | Typha capensis; Pycreus nitidus; Fimbristylis complanata | 16 cm | Coal mining effluent upstream | Stable | 11 cm S−1 | 18.2 mg m−2 | 1 mm | 2 NTU |
| Outflow (Site 5) | Clay, silt | Typha capensis; Kyllinga erecta; Fimbristylis complanata | 23 cm | Coal mining effluent upstream | Stable | 23 cm S−1 | 10.6 mg m−2 | 0 mm | 3 NTU |
| Species | Autecology of Dominant Benthic Algae | Reference Site | 2015 Inflow | 2015 Outflow | 2016 Inflow | 2016 Outflow | 2017 Inflow | 2017 Outflow | 2018 Inflow | 2018 Outflow | Frequency |
|---|---|---|---|---|---|---|---|---|---|---|---|
| Bacillariophyta | |||||||||||
| Achnanthidium exiguum | ++ | + | ++ | 33% | |||||||
| Amphora coffeaeformis | + | + | ++ | 33% | |||||||
| Cocconeis pediculus | ++ | + | 22% | ||||||||
| Craticula buderi | Occurs in mine effluent characterized by moderated to elevated electrolyte content [47] | ++ | ++++ | ++++ | ++++ | + | +++ | 66% | |||
| Craticula cuspidate | + | + | + | + | 44% | ||||||
| Ctenophora pulchella | + | ++ | 22% | ||||||||
| Cymbella kappii | + | 11% | |||||||||
| Cymbella neocistula | + | ++ | 22% | ||||||||
| Cymbella tumida | ++ | 11% | |||||||||
| Diatoma vulgaris | ++ | + | + | 33% | |||||||
| Flagilaria ulna | ++ | ++ | 22% | ||||||||
| Frustulia vulgaris | + | + | ++ | 33% | |||||||
| Gomphonema aff. Gracile | This taxon can tolerate extremely polluted conditions and is found in abundance in mining effluent [47]. | ++ | ++++ | ++++ | +++ | + | +++ | 66% | |||
| Gomphonema parvulum | In general, considered to be tolerant of extremely polluted and anthropogenically modified conditions [47]. | ++ | ++++ | ++++ | ++ | + | ++ | 66% | |||
| Gomphonema pseudoaugur | ++ | + | 22% | ||||||||
| Gyrosigma scalproides | + | 11% | |||||||||
| Gyrosigma acuminatum | Species are found in electrolyte-rich water [47]. | +++ | +++ | ++ | + | ++ | 55% | ||||
| Gyrosigma attenuatum | ++ | ++ | ++ | 33% | |||||||
| Gyrosigma rautenbachiae | This taxon is associated with water anthropogenically impacted by industrial pollutants [47]. | + | +++ | +++ | + | + | 55% | ||||
| Melosira variance | This taxon is associated with eutrophic conditions [47]. | ++ | +++ | ++++ | 33% | ||||||
| Navicula cryptotenella | ++ | ++ | 22% | ||||||||
| Navicula microcari | + | + | ++ | 33% | |||||||
| Navicula pupala | ++ | ++ | + | 33% | |||||||
| Navicula tripunctata | +++ | + | 22% | ||||||||
| Nitschia clausii | This taxon is tolerant of strong pollution conditions and associated with industrial effluents [47]. | ++++ | ++++ | +++ | +++ | ++ | +++ | + | 77% | ||
| Nitzschia communis | This taxon is associated with mining effluents [27]. | +++ | + | ++++ | ++ | ++++ | + | + | 77% | ||
| Nitzschia nana | ++ | + | ++ | 33% | |||||||
| Nitzschia sublinearis | ++ | ++ | 22% | ||||||||
| Nitzschiaintermedia | + | + | 22% | ||||||||
| Nitzschia pura | + | ++ | 22% | ||||||||
| Nitzschia reversa | ++ | ++ | ++ | + | + | 55% | |||||
| Nitzschia umbonate | This taxon is a good indicator of eutrophic conditions [47]. | ++ | +++++ | +++ | 33% | ||||||
| Pinnularia viridiformis | ++ | + | + | 33% | |||||||
| Pinnularia viridis | This taxon is known to occur in circumneutral water with electrolyte content levels that are low to moderate [47]. | ++ | + | +++ | 33% | ||||||
| Rhopalodia gibba | ++ | ++ | 22% | ||||||||
| Synedra ulna | +++ | ++ | ++ | + | + | + | + | + | 88% | ||
| Tabellaria flocculosa | This taxon flourishes in circumneutral, oligotrophic, or slightly acidic water [47]. | ++ | +++ | 22% | |||||||
| Chlorophyta | |||||||||||
| Cladophora glomerata | ++ | + | 22% | ||||||||
| Closterium margaritiferum | ++ | + | 22% | ||||||||
| Closterium peracerosum | + | 11% | |||||||||
| Closterium spinosporum | + | + | 22% | ||||||||
| Cosmarium hammeri | ++ | 11% | |||||||||
| Cosmarium pseudopraemorsium | ++ | ++ | 22% | ||||||||
| Microspora quadrata | +++ | + | ++ | + | 44% | ||||||
| Pandorina sp. | This taxon is found in meso to eutrophic types of water [46]. | +++ | + | 22% | |||||||
| Scenedesmus armatus | This taxon is found in meso to eutrophic types of water [46]. | ++++ | ++ | + | 11% | ||||||
| Spirogyra Africana | ++ | + | 11% | ||||||||
| Spirogyra reinhardi | ++ | +++ | 11% | ||||||||
| Staurastrum anatinum | ++ | ++ | + | + | 11% | ||||||
| Streptophyta | |||||||||||
| Klebsormidium acidophilum | This taxon is found in acidic water related to AMD effluent from mining activities [2]. | +++ | + | ++++ | ++ | +++ | + | +++ | 77% | ||
| Klebsormidium rivulare | +++ | ++ | +++ | 33% | |||||||
| Mougeotia cf. laevis | This taxon is associated with mining effluents [60]. | + | ++ | + | ++ | + | +++ | 66% | |||
| Zygnema cf. cylindrospermum | + | + | 22% | ||||||||
| Euglena sociabilis | ++ | + | 22% | ||||||||
| Phacus Pleuronectes | + | 11% | |||||||||
| Trachelomonas intermedia | ++ | ++ | ++ | + | 44% | ||||||
| Cyanophyta | |||||||||||
| Cylindrospermopsis raciborskii | ++ | 11% | |||||||||
| Merismopedia punctata | + | + | 22% | ||||||||
| Oscillatoria princeps | +++ | ++ | ++ | 33% | |||||||
| Oscillatoria tenuis | ++ | 11% | |||||||||
| Rhodophyta | |||||||||||
| Batrachospermum atrum | This taxon is associated with mining effluents [61]. | +++ | + | ++ | + | ++ | 55% |
| Parameter | Unit | Reference Site 2018 | 2015 Inflow | 2015 Outflow | 2016 Inflow | 2016 Outflow | 2017 Inflow | 2017 Outflow | 2018 Inflow | 2018 Outflow |
|---|---|---|---|---|---|---|---|---|---|---|
| Sulfate (SO42−) | mg L−1 | 37 | 1280 | 341 | 1610 | 1580 | 735 | 658 | 1380 | 471 |
| Alkalinity (CaCO3) | mg L−1 | 24 | 8.7 | 141 | 5 | 6 | 3.8 | 5 | 2.5 | 44 |
| Sodium (Na) | mg L−1 | 11 | 32 | 26 | 46 | 43 | 24 | 22 | 35 | 28 |
| Calcium (Ca) | mg L−1 | 9 | 383 | 437 | 419 | 200 | 173 | 371 | 121 | |
| Magnesium (Mg) | mg L−1 | 5.9 | 67 | 41 | 133 | 135 | 63 | 55 | 108 | 39 |
| Dissolved organic carbon (DOC) | mg L−1 | 5.2 | 2.2 | 3.7 | 2.5 | 2.8 | 2.8 | 5.6 | 1.9 | 4.3 |
| Electrical conductivity (EC) | µS/cm | 180 | 2357 | 803 | 2600 | 2450 | 1320 | 1240 | 2500 | 1060 |
| Total phosphorus (TP) | mg L−1 | 0.12 | 0.03 | 0.05 | 0.05 | 1.0 | 0.05 | 0.09 | 0.05 | 0.06 |
| Total nitrogen (TN) | mg L−1 | 1.2 | 0.05 | 0.06 | 0.05 | 0.04 | 0.05 | 0.05 | ||
| Aluminium (Al) | mg L−1 | 0.01 | 3.8 | 0.05 | 10.6 | 10.1 | 10.4 | 7.1 | 5.9 | 0.01 |
| Iron (Fe) | mg L−1 | 0.05 | 7.03 | 0.06 | 9.7 | 8.1 | 2.3 | 1.4 | 1.9 | 0.08 |
| Manganese (Mn) | mg L−1 | 0.04 | 14.5 | 0.09 | 17.0 | 16.5 | 11.7 | 6.3 | 13 | 0.02 |
| Silicon (Si) | mg L−1 | 0.7 | 6.3 | 4.5 | 8.5 | 6.4 | 7.2 | 3.8 | 9.1 | 2.3 |
| pH | 6.9 | 3.17 | 7.03 | 3.6 | 4.0 | 3.8 | 6.9 | 3.4 | 7.5 |
Publisher’s Note: MDPI stays neutral with regard to jurisdictional claims in published maps and institutional affiliations. |
© 2022 by the authors. Licensee MDPI, Basel, Switzerland. This article is an open access article distributed under the terms and conditions of the Creative Commons Attribution (CC BY) license (https://creativecommons.org/licenses/by/4.0/).
Share and Cite
Oberholster, P.J.; Schoeman, Y.; Truter, J.C.; Botha, A.-M. Using Periphyton Assemblage and Water Quality Variables to Assess the Ecological Recovery of an Ecologically Engineered Wetland Affected by Acid Mine Drainage after a Dry Spell. Processes 2022, 10, 877. https://0-doi-org.brum.beds.ac.uk/10.3390/pr10050877
Oberholster PJ, Schoeman Y, Truter JC, Botha A-M. Using Periphyton Assemblage and Water Quality Variables to Assess the Ecological Recovery of an Ecologically Engineered Wetland Affected by Acid Mine Drainage after a Dry Spell. Processes. 2022; 10(5):877. https://0-doi-org.brum.beds.ac.uk/10.3390/pr10050877
Chicago/Turabian StyleOberholster, Paul Johan, Yolandi Schoeman, Johannes Christoff Truter, and Anna-Maria Botha. 2022. "Using Periphyton Assemblage and Water Quality Variables to Assess the Ecological Recovery of an Ecologically Engineered Wetland Affected by Acid Mine Drainage after a Dry Spell" Processes 10, no. 5: 877. https://0-doi-org.brum.beds.ac.uk/10.3390/pr10050877