Article

Circular Economy Indicators for the Assessment of Waste and By-Products from the Palm Oil Sector

by
Pedro-Antonio Cárdenas Bejarano
1,
Juan-Pablo Rodriguez-Miranda
1,
Rayma Ireri Maldonado-Astudillo
2,*,
Yanik Ixchel Maldonado-Astudillo
2,* and
Ricardo Salazar
3,*
1
Facultad del Medio Ambiente y Recursos Naturales, Universidad Distrital Francisco José de Caldas, Bogotá 11021, Colombia
2
Centro de Innovación, Competitividad y Sostenibilidad (CICS), Universidad Autónoma de Guerrero, Acapulco de Juárez 39640, Mexico
3
CONACyT, Universidad Autónoma de Guerrero, Av. Lázaro Cárdenas S/N, Chilpancingo de los Bravo 39086, Mexico
*
Authors to whom correspondence should be addressed.
Submission received: 31 March 2022 / Revised: 15 April 2022 / Accepted: 25 April 2022 / Published: 3 May 2022

Abstract

:
A circular economy (CE) promotes the reuse, reincorporation and valuation of waste and by-products under the framework of sustainable development through models and indicators that evaluate scenarios of second use and reduction in non-incorporated outputs to reduce negative externalities and pressures on the dimensions of development. A CE model applied to the transformation process of RFF in agro-industries is developed, which consists in the identification of the residue coefficients of EFB (22.48% ± 0.8), fiber (15.58% ± 0.49), husk (6.03% ± 0.66) and ash (0.55% ± 1.67). Subsequently, the valuation trends of potential second use were verified through a systematic review, which allowed the construction of the scenario of avoided costs of USD 678,721.5, a product of the total use of the outputs under bioenergy and nutrient source approaches. Finally, the RRSFM indicator was constructed, which can reach the level of 72% and a degree of improvement of 26% by 2026. In parallel, the HCRRS indicator revealed a reduction of 57.1%, 59.6% and 82.8% in emissions of t CO2-eq product in the comparison of scenarios for the use of residues and by-products of palm oil from agro-industries in the Casanare Department.

1. Introduction

The circular economy (CE) is an interdisciplinary approach that promotes the reuse, reincorporation and valuation of waste and by-products in order to reduce the pressures related to the dimensions of development under different strategies that recirculate energy and matter with a focus on second use in source or complementary processes [1,2]. Some authors affirm that the CE contributes to promoting sustainable development spaces [3,4], since it generates a reduction in externalities through the balanced integration of the dimensions through innovation, adaptation and environmental management [5,6,7,8], and addresses the causes that generate the disruption of sustainable development [3].
A CE incorporates different concepts [6,7], methodologies, methods, models and indicators adapted to simple or compound quantitative parameters [5,9], such as material flow, energy flow, land use and cycles of life [10,11], which allow the generation of comparative scenarios of reincorporation of second use. The foregoing is implemented at the micro-, meso- and macroeconomic scales of productive sectors [10,12], which facilitates the correction of shortcomings in the economic dimension and promotes a transition towards sustainable models.
Palm oil agro-industries are the starting point for the analysis to correct the shortcomings generated by the economic dimension, since, by providing different goods and services, negative externalities are generated that affect the dimensions of development. This is due to production failures and a low installed capacity to incorporate waste and by-products [13,14,15], which is aggravated by the absence of strategies that allow evaluating the benefit of incorporating outputs into the development dimensions [9,16].
This context worsens when knowing that around 23% of the waste rate and agro-industrial by-products of palm oil are reincorporated into the production process, and the remainder is abandoned on site [17,18]. This causes the contamination of bodies of water, atmospheric emissions, the alteration of the landscape, the acidification of the soil, produces leachate and affects human health [19,20]. The highlighted problem increases the magnitude and scale by evidencing the trend of the market dependent on vegetable oil products derived from palm oil [21], of which Colombia supplies and markets 4.08% of the world’s production [22]. The foregoing positions Colombia as the first producing country in the Americas (above Ecuador, Honduras, Guatemala, Brazil and other countries in the region) and fourth producer worldwide (behind Indonesia, Malaysia and Thailand) [23].
The circular economy model developed in this research proposes a strategy to correct the previously highlighted deficiencies of the palm oil agro-industrial sector, since it diagnoses the source processes and values the residues and by-products under a second-use approach (use), with the purpose of establishing two quantitative indicators to estimate the incorporation of outputs through the Material Flows approach and the carbon footprint through the Other-life-cycle-based approach, which are based, applied and adjusted to the work ecosystem of the agro-industries of the Casanare Department. Additionally, the strategies developed in the model discourage the use of landfills and discharges that affect the dimensions of development; at the same time, they raise sustainable development scenarios that reduce pressures on the local environment.

2. Materials and Methods

The method of the present investigation was descriptive, since it explains and characterizes the waste and by-products from a specific case to determine the potential of second use under circular economy strategies. Likewise, a deductive method was used, since the paper analyzed data from the specific case under the first principles of approaches to valuate and use waste and by-products to propose circular economy indicators aimed at sustainable development. The methodological development used a mixed approach that was (i) qualitative, in the phases of identification, characterization and evaluation of the residues and by-products of the palm oil sector in the processing plants in the Casanare Department; and (ii) quantitative, in the assessment of exploitation approaches, the estimation of avoided costs and the projection of the model and indicators of circular economy.

2.1. Determination and Characterization of Waste and By-Products

For the construction of circular economy models and indicators, it is pertinent to characterize the source, type of waste and/or by-product, generation rate and current disposal, as developed by authors in international research, such as Rakundo et al. [24], Oliveira et al. [25], Barcelos et al. [26], Moraga et al. [9], Salguero-Puerta et al. [27] and Wang et al. [28]. The information collected can be categorized as:
A.
Determination of the processing rate, measured in tons per year of fresh fruit bunch (FFB) or crude palm oil (CPO).
A.1. Average weight of FFB expressed in kg or t.
A.2. Amount of RFF required to process one ton of CPO.
B.
Characterization of by-products generated in the extraction process.
B.1. Characterization of solid waste equivalent to empty clusters or coarse, fiber, shell and ash.
B.1.1. Estimation of the generation rate of solid waste and by-products, measured in t/year, kg/year, kg/RFF or t/FFB, for EFB, fiber, husk, ash and palm oil mill effluent (POME).
B.1.2. Qualify and quantify the physical and chemical properties of Organic Solid Waste—OSW (properties that can be used according to energy potential and source of nutrients).
B.2. Characterization of wastewater discharges generated in the extraction process, according to reports supported by agro-industries.
B.2.1. Physical and chemical properties of the discharge according to environmental compliance reports presented by agro-industries to the corresponding entities for the remuneration rate permit. The parameters to be measured are physical (pH and temperature) and chemical (BOD, COD, SS, SVT and fats and oil).
C.
Trend analysis of production area and transformation rate.
C.1. Planted area and harvested area in hectare units (regional accumulation).
C.2. Transformation rate CPO/year and CPO/ha.
The information was collected for each agro-industry, in an interval of 5 years prior to the investigation (2015–2019), with the purpose of extracting the most pertinent and current information on the management of and approach for each residue. The information was used to calculate the production coefficients through linear or non-linear regression describing the production rate. Each data grouped in the aforementioned sections were analyzed using descriptive and inferential statistics (Pearson correlation).
Additionally, a systematic review using Google Scholar, Springer Link and ScienceDirect search engines was performed to compare with the information from the Casanare Department. For this reason, a review was performed by consulting material published within the range of 25 years (1994–2019) using the keywords waste, by-product and palm oil, given that the regional, national and international information of the last 25 years is relevant to understand the characterization and mass flow based on the technological change and growth trends of palm oil cultivation.

2.2. Valuation of Waste and By-Products of the Palm Oil Agro-Industry

Agro-industrial waste and by-products constitute a source of renewable biological resource with the potential to be incorporated to obtain bio products with high added value. Industrial development with the scheme of the exploitation and utilization of waste and by-products became a priority for business management working under the framework of green and circular economies, given the interest in them as engines of growth, innovation and job creation. The assessment and evaluation of the outputs constitutes the basis of studies related to the development of the circular economy model [29,30,31].
For this purpose, based on the information collected on the characterization of waste and by-products, the main trends in the valuation of palm oil agro-industrial waste and by-products were investigated. The forthcoming was developed through a systematic literature review of the last 10 years, consulting SpringerLink, ScienceDirect and Google Scholar journals, based on the methodology of Cardenas et al. [32], to identify the approaches, methods, technologies and costs associated with their respective implementation (see Table 1). In the review, the combination of the following keywords was used as the main thematic descriptors: (i) waste; (ii) valorization; and (iii) palm oil. The second phase implemented the keywords to focus on the assessment (or use approach) of waste and by-products, in terms of nutrient source, enzyme activity, biofuel and other interests. Finally, a third phase was used to identify the technological approach by which the waste and by-products are transformed, corresponding to chemical, physical and biological processes.

2.3. Circular Economy Model for the Reincorporation of Waste and By-Products from the Palm-Growing Sector in the Casanare Department

The implementation of environmental indicators (with emphasis on the use of waste and by-products of this research) allowed the creation of tools for the analysis of the current and future state (implementation of the model under assumed use scenarios). The assumptions were evaluated using the RRFSM indicator (Reincorporation of Waste and By-products by Material Flow) and the HCRRS indicator (Carbon Footprint of the Reincorporation of Waste and By-products).

2.3.1. RRSFM Indicator

The alternatives were proposed under a reuse, reincorporation and/or recycling scheme for waste and by-products according to the techniques and methods addressed in the Reference Framework chapter, such as:
A.1. Residual effluent as a fertigation system and an alternative water supply to reduce the capture rate.
A.2. Residual effluent as an affluent for reuse to reduce the rate of water use in the internal processes of the agribusiness.
A.3. Reuse of organic waste as a soil conditioner.
A.4. Reuse organic waste as a source of nutrients.
A.5. Reuse of organic and liquid waste as a source of energy.
After selecting the viable alternatives according to the conditions of waste and by-product production, the information was consolidated by agro-industry (Ag) in relation to: (i) Total Generation (Gt), (ii) Current Use (Ac) and (iii) Potential Use (Ap), based on the palm oil waste and by-product rates of each agro-industry according to the EFB, fiber, husk, ash and POME variables.
It should be noted that (i) the Current Use parameter corresponds to the environmental management practices implemented by agro-industries according to the alternatives investigated, and (ii) the Potential Use parameter corresponds to the total amount of the different residues and/or susceptible by-products to be used according to the current infrastructure (boilers, composting, fertigation irrigation system, among others). The valued waste and/or by-products must have ideal conditions (regulations and physical and chemical characteristics) that do not generate a negative impact due to their use.
To evaluate the RRSFM indicator at different moments (scenarios), Equations (1) to (6) were used. To determine the numerical value of the Current Moment (Ma) parameter, Equation (1) was used (modified equation of [27]), with which the coefficient (dimensionless value) of the current moment with respect to the generation of waste was calculated. This value was input to calculate the current use of each waste and by-product, according to Equation (2). These equations are exemplified through the liquid waste (LW) variable.
L W M a = 1 ( L W G t L W A c L W G t ) .  
R R S F M M a = O S W A c + L W A c + A s A c n
To determine the potential moment of the RRSFM indicator, the Ap variable (Current Use) was added to Equation (1) in the denominator part, as evidenced in Equation (3) (modified equation of [27]) and Equation (4), exemplified through the LW variable:
L W M p = 1 ( L W G t L W A c L W A p L W G t )
R R S F M M p = O S W M p + L W M p + A s M p n
Finally, the Total Use (At) parameter was determined, which defines the difference between the Total Generation (Gt) of waste and the accumulated Use (current and potential), on a scale from 0 to 1 (see Equation (5)). Since the difference is not notable when analyzing the information for each agro-industry or residue, it was necessary to use the normalization of indices (see Equation (6)), where the maximum value corresponds to 1 (assuming a 100% circular economy) and the minimum value to 0 (no circular economy assumption).
R R S F M = 1 ( G t A c A p G t )
R R S F M ( N o r m a l i c i ó n ) = R R S F M 0 1 0
The values obtained in each equation are compiled in Table 2.

2.3.2. HCRRS Indicator

A second indicator was built that estimated thecarbon footprint (CF) of the RRSFM indicator under the Other-life-cycle-based approach, in order to generate composite and articulated indicators in the circular economy model. To determine the HCRRS indicator, it was necessary to carry out a systematic review of the emission factors ( δ C O 2 e q ) according to the type of waste and by-product generated in the RFF transformation process.
For this purpose, journals accessed through SpringerLink, ScienceDirect and Google Scholar were reviewed, based on the methodology of Cardenas et al. [32]. The main descriptors used were (i) carbon footprint and (ii) mill palm oil; RFV (EFB), POME, fiber and shell were used as complementary descriptors; and, as exclusion factors, we used (i) residues and by-products that are generated in other production phases and do not correspond to residues from the FFB processing, mainly those residues and by-products that are generated in the planting phase (see Table 3). The search period was from 2000 to 2020 of international and national publications that precisely quantified processes of the transformation of RFF or CPO in CO2-eq.
After identifying the emission factor ( δ C O 2 e q ) according to the type of alternative analyzed in the RRSFM indicator, three hypothetical scenarios (moments) were constructed with variation in the rates of the reincorporation of waste and by-products to contrast under the current scenario (Ap category of the indicator RRSFM). To determine the emission for each alternative (Ea), Equations (7) and (8) were used. It is pertinent to note that the emission factor must be in units of kg CO2-eq/t RFF.
γ = t   R s   a p r o v e c h a d o t   R s   g e n e r a d o
E a C O 2 e q = γ R F F 2019 δ C O 2 e q 1000
After determining the emission of each residue, the individual data were added to obtain the global emission of the analyzed moment. For this purpose, Equation (9) was implemented, whose result provides values in units of t CO2eq.
H C R R S C O 2   e q = ( ϑ 1 O S W 1 ±   ϑ 2 O S W 2 ± ϑ n O S W n )

3. Results and Discussion

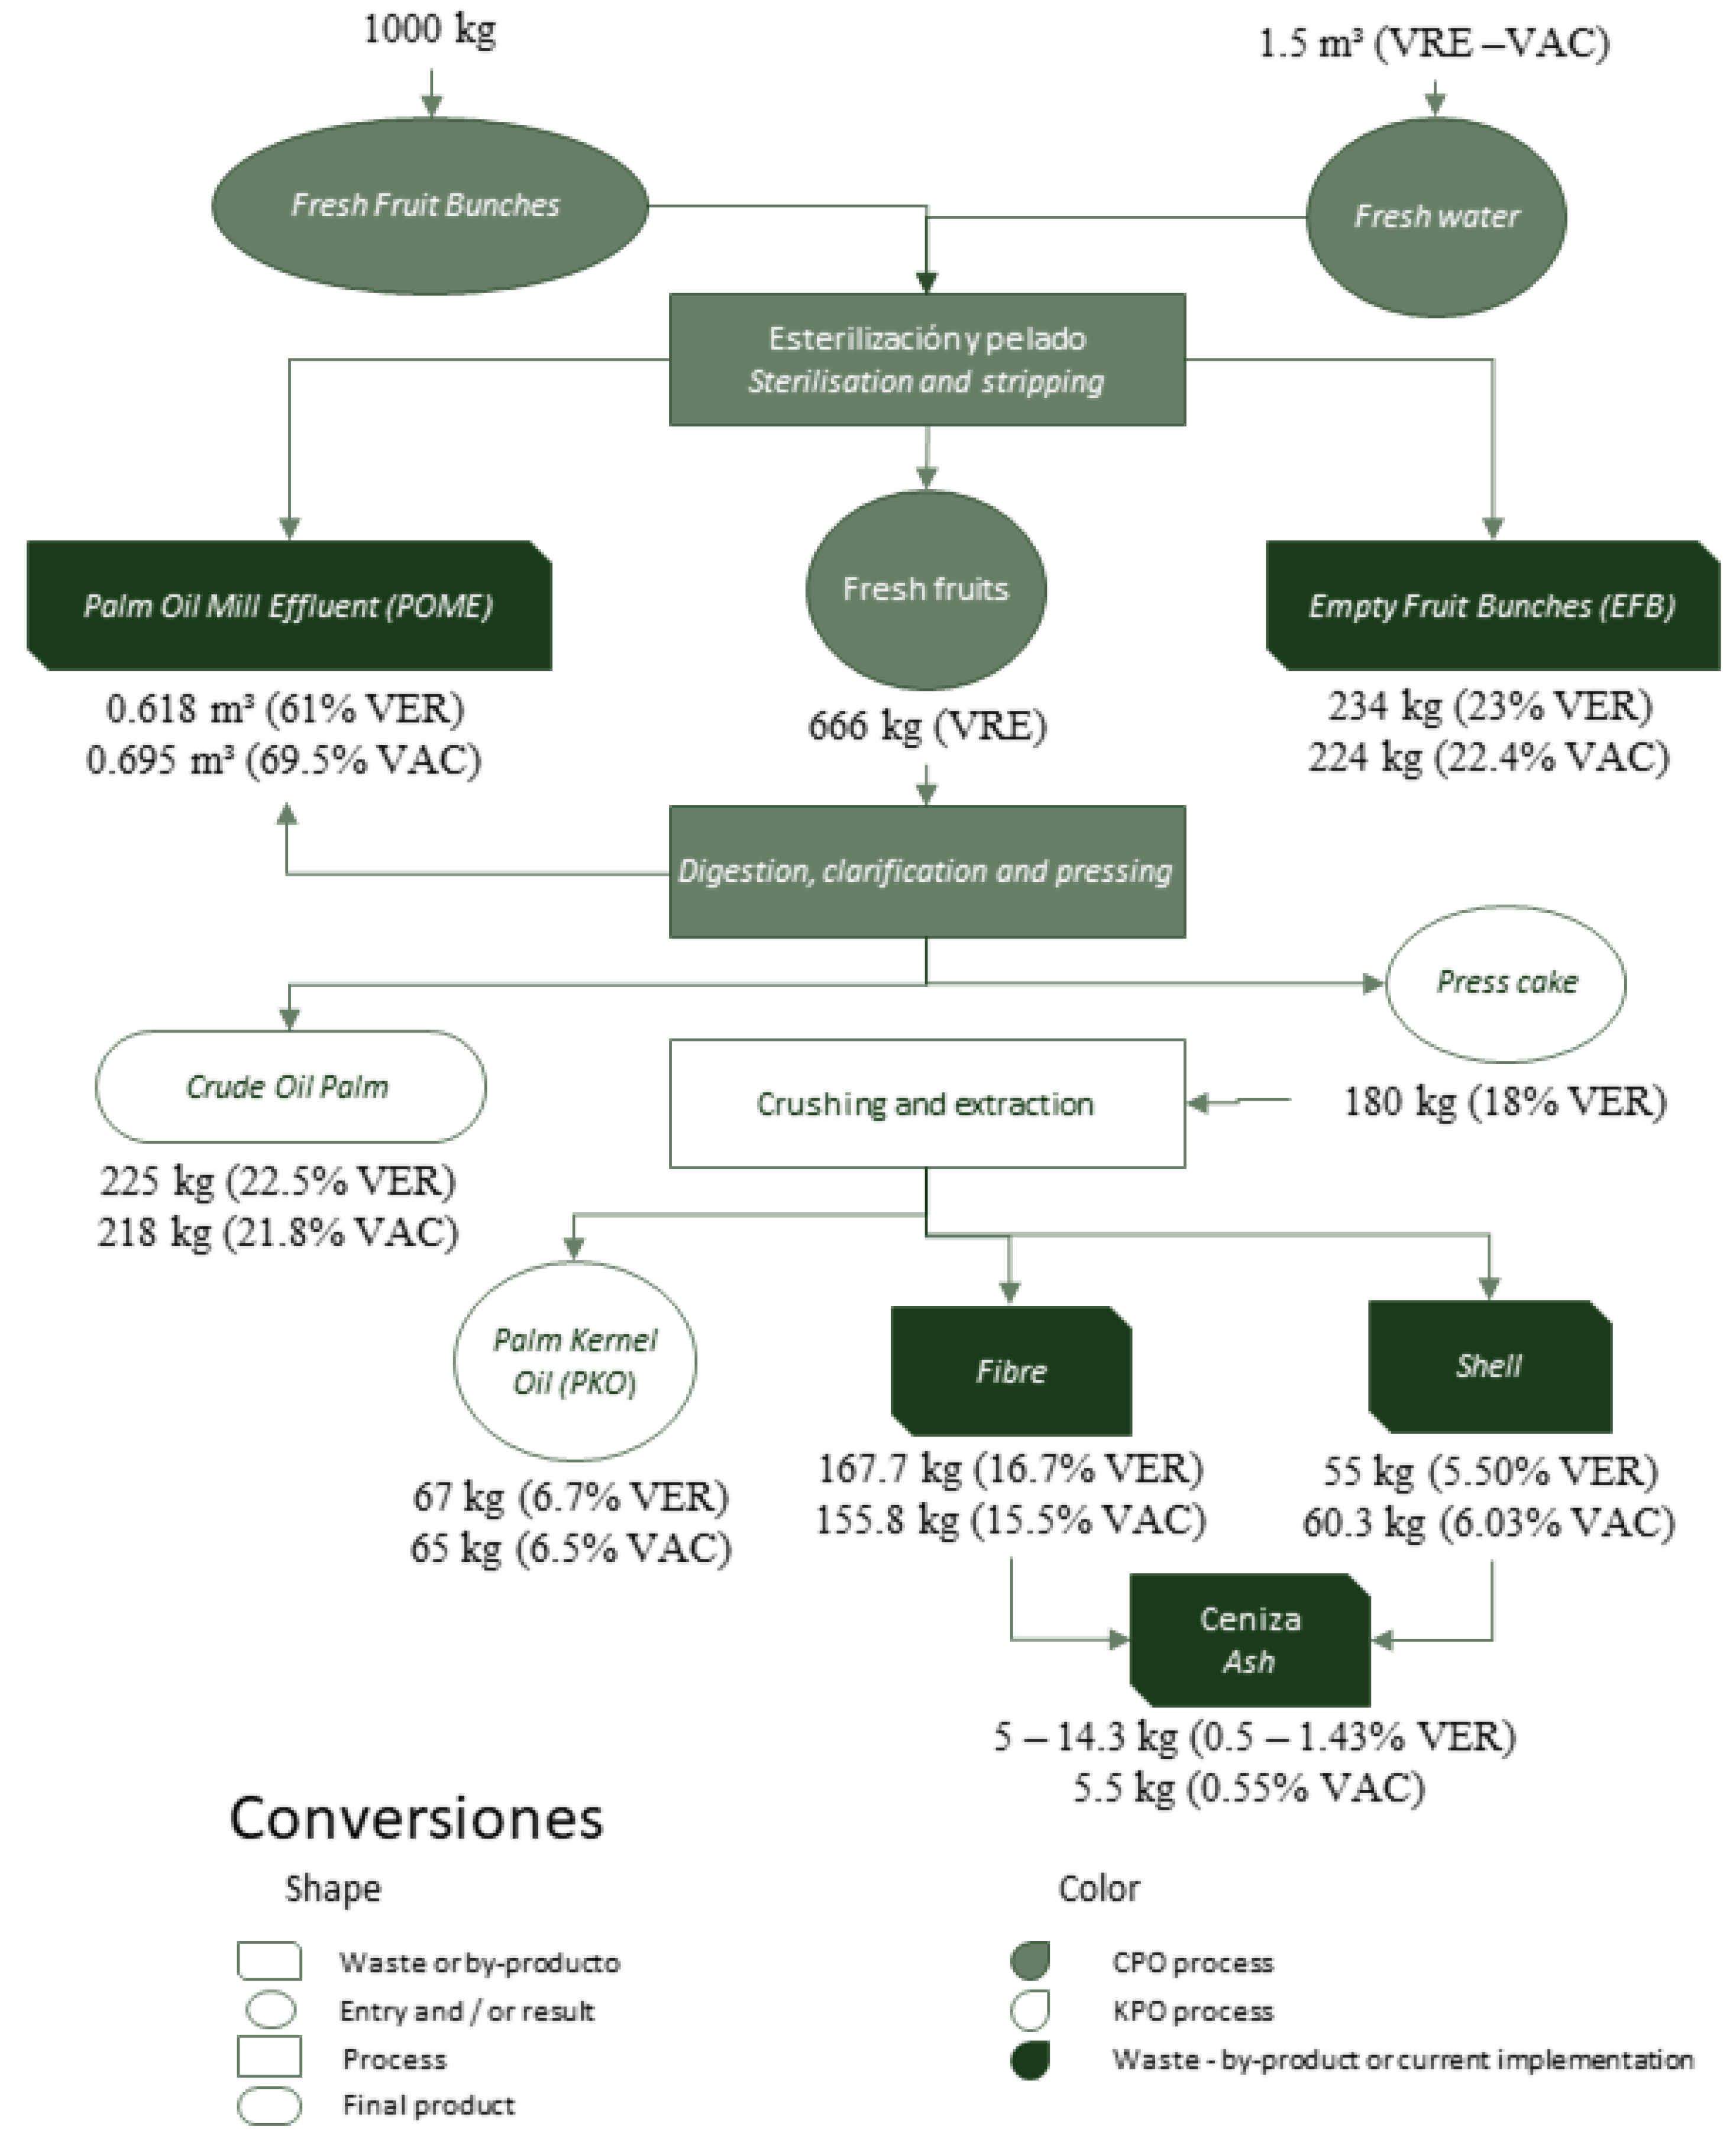
3.1. Characterization of Waste and By-Products of the RFF Process

The production of crude palm oil can be summarized as a closed system in which the fresh fruit bunches (FFB) enter a series of processes that incorporate matter (mainly water) and energy to obtain the desired product. The RFF is selected after the evaluation in the field, which, according to the color of the fruit, is removed and transferred under electrical, mechanical or animal traction systems to the processing plant facilities.
Subsequently, the extraction begins, which separates the nuts from the peduncle or rachis (first by-product in solid state, corresponding to empty fruit bunch (EFB, also called cob or mesocarp)), by means of rotary mechanical processes [33]. The cob is composed of shells and fiber, which are equivalent to approximately 22% of the initial weight of the RFF [34]. When analyzing the information provided by the Casanare Department agro-industries, it is evident that the average weight of the cob oscillates between 20% and 24% of the initial weight of RFF; for this reason, for the present investigation, the reference value of 22% was considered.
Subsequently, the digestion or pressing process is carried out, which compresses the separated fruits to obtain palm kernel oil (PKO) or crude palm oil (CPO). Both products undergo similar processes (clarification, centrifugation, rinsing and storage); however, the thermodynamic and methodological conditions vary. In this process, the second subgroup of by-products is generated in a solid state, equivalent to walnuts, almonds, shells and fiber in a broken or compressed state, which are removed and transferred to a drying area for their respective reuse as an energy source and air conditioner ground. In the developed field review, it was evidenced that all the plants use the separation and reincorporation process as a source of combustion for boilers or soil conditioner; however, the percentages vary according to the needs of each plantation. This process is pertinent to highlight, since it produces two main products (PKO and CPO), which vary according to the source.
The subsequent process corresponds to clarification, which is made up of different threads whose purpose is to separate the liquid mixture resulting from the digestion or pressing process through gravitational processes and immiscibility of substances, mainly water and oil, aided by steam [35,36]. This process generates two relevant by-products, corresponding to liquid waste (containing sludge) and fibrous waste (suspended fibers in pressed solutions), which are treated by sedimentation processes to remove by-products. In relation to liquid waste, residual effluents are generated, and, in relation to fibrous waste, a fiber suitable for animal consumption is obtained.
It should be noted that another important source of liquid waste evidenced in the benefit plants is created through the centrifugation process, since the liquid waste prior to disposal in oxidation lagoons is subjected to mechanical systems to recover a part of the oil suspended in the wastewater. This decreases the load of suspended substances in the effluent, which favors the reincorporation of the oil into the production process and the reduction in contaminants.
It was previously mentioned that the nuts are separated from the residual fiber in the defibration and crushing process, since the interior contains the almond that is viable for obtaining other products. This process is carried out using mechanical dryers that allow the generation of a (i) palm kernel cake, (ii) palm kernel oil and (iii) shells (a by-product with potential for reuse due to its calorific value). Finally, the residue from the incineration of solid organic matter in boilers, coming from the combustion of cobs, fibers and/or husks, called ash, is found, which is equivalent to approximately 5% of the weight of the incinerated organic waste [37,38]. This product is collected in two phases: from the (i) boiler area, where the ashes are deposited, and (ii) the emission control system, which are called hard and soft ashes, respectively [39,40]. When comparing this information with the data obtained in the Casanare Department, it was revealed that the value of ash was in the range of 4.3–8% of the weight of the incinerated waste, whose percentage varies according to the combination with the different types of fuel.
In different investigations focused on the characterization of palm-oil-processing plants, the percentage or wet weight of residues and by-products after transforming 1 ton of RFF or 1 ton of CPO was quantified. Empty fruit bunches (EFB), fiber, husk, ash, POME and methane are the main residues and by-products characterized. In Table 4 and Table 5, the main investigations at a global level are detailed, which quantified the output of matter after the transformation of the ton of RFF or ton of CPO, as well as the values obtained in six agro-industries of the Casanare Department.
When comparing the Reference Values (VRE) with the Values provided by the Agro-industries of the Casanare Department (VAC), a positive correlation between the data is evidenced, since the difference and proportion of waste and by-products is preserved. It is evident that the differences correspond to the type of technology and variety of the crop, which contributes to the efficiency of production and water consumption for the production of one ton of CPO.
The largest source of organic solid waste (OSW) corresponds to EFB (23.04% ± 3.76 VRE and 22.08% ± 0.8 VAC), generated in the sterilization and extraction process; its percentage of moisture content is relatively high, approximately 60% of the weight, which means that it is highly difficult to use for energy purposes. For this reason, agro-industries use dry fiber and husk as an energy source and, on occasion, sun-dried EFB, since its C/N ratio is used for soil conditioner [39].
The second by-product with the highest RSO percentage corresponds to Fiber (16.77% ± 11.23 VRE and 15.58% ± 0.49 VAC), generated in the separation and clarification process. This by-product has a low percentage of moisture and residual CPO, approximately 5% [34], and thus it is favorable to be used in incineration in boilers to obtain energy; its energy contribution corresponds to 18,795–19,060 kJ kg−1 [39,57,58].
The third by-product with the highest RSO contribution corresponds to Cascarilla (6.41% ± 1.87 VRE and 6.03% ± 0.66 VAC), generated in the process of the separation and breaking of the nut. This by-product has a 100% utilization rate in the agro-industries of the Casanare Department, given its calorific value of 19,500–20,750 kJ kg−1, low moisture content and water absorption capacity [39,57,58,59].
On the other hand, the main liquid residue corresponds to the residual effluent (POME), which presents a significant variation depending on the processing plant (61.18% ± 17.92 VRE and 69.50% ± 7.56 VAC). In the literature review, it was identified that, in some processes, around 0.8–1.5 m3 are used to process a ton of FFB, given the technology implemented by the benefit plants, and around 50% of the volume used becomes POME [39,41,49,57,60]. In relation to the Casanare processing plants, from the initial volume of water used to transform one ton of RFF, a retribution rate of 61% was estimated, which corroborates some of the abnormal values above the average reference value (VRE).
Finally, the residue with the lowest contribution corresponds to Ash (1.43% ± 1.67 VRE and 0.55% ± 0.15 VAC), derived from the combustion of organic matter, such as fiber, husk and EFB in boilers, in combination with other fuels, such as coke or coal. The variation between VRE and VAC of ash is due to a difference marked by a record of Loh [39] in dry weight, whose value is abnormal among the other records, since the humidity (remaining records) significantly decreases the concentration of ash [61,62]. In fact, it is pertinent to mention that the processes of the use of residues and organic by-products of the RFF are implemented with relative concentrations of humidity. All the mentioned data are compiled in Figure 1.

Physical and Chemical Characteristics of Palm Oil Waste and By-Products

As highlighted in the previous section, there are two groups of waste and by-products according to their physical state, solids and liquids. Solid waste is made up of EFB, husk, fiber and ash. These residues have different physical and chemical properties, such as calorific value, texture, porosity, rigidity and nutritional composition (see Table 6, which generates a variety of reuse alternatives.
The EFB (also called cob) is a lignocellulose material with a composition of 60–65% moisture, and with 1–2.5% vegetable oil impregnated by the physical separation of the rachis in the process of fruiting the sterilized bunches [63]. The EFB is the second by-product with the best proportion of potassium, manganese, phosphorus, nitrogen and zinc content, which allows visualizing implementations, such as soil conditioning, due to its nutrient contribution. On the other hand, the EFB has a high calorific value (18–19.92 MJ/kg); however, it requires prior drying processes due to its high moisture content (66–69%).
Fiber contains the best proportion of nutrients compared to other organic by-products, such as nitrogen, potassium and phosphorus (see Table 6); however, it has a high content of metals, such as iron (723.2 ± 7.8), copper (24.2 ± 0.05) and aluminum (749.1 ± 14). These characteristics make it difficult for this by-product to be implemented as a soil conditioner, since it can favor the accumulation of salts and metals. For this reason, its utilization approach focuses on incineration, given its calorific value and ignition degree. The ratio to obtain the highest calorific value is from 60:40 to 90:10 in combination with husk [43,64,65,66,67,68,69].
Husk has a high content of carbon and potassium; however, it also has a low content of magnesium, nitrogen and phosphorus. Likewise, it has the best calorific power capacity among the residues and by-products derived from FFB (19.5–20.75 MJ/kg) with a low ash content (3%), which is favorable for its implementation in incineration in boilers with fiber (see Table 6). Likewise, the hull has 37% of porosity, which is beneficial for its the water absorption capacity (21–33%) [59].
Ash is a product of the OWS combustion, such as fiber, husk and mainly EFB. It has a granular and porous structure, most of it fine in size [63,64]. This by-product is not apt for incineration; however, it has a high ratio of nutrients, such as carbon, potassium and magnesium, and a low content of leachable heavy metals (less than 0.2 mg/L of cadmium, lead, copper and nickel) [70], so it is used in combination with OWS in composting processes.
On the other hand, the POME liquid residue from the grinding, centrifugation, sedimentation and other processes contains the lowest degree of carbon content (40.17%); however, it has the best composition of nutrients, such as nitrogen, potassium, phosphorus and zinc compared to other residues and by-products (see Table 6). Additionally, the said waste has a high potential calorific power (16.1–17.65 MJ/kg), derived from the anaerobic transformation of the effluent.
The concentration of BOD, COD, ST, STV and GA in the wastewater varies according to the amount of water used in the RFF transformation processes (see Table 7). The POME of the Casanare Department presents a temperature of 56.5 °C ± 1.7 °C, being a product of the sterilization process that implements the water resource at a temperature of approximately 140 °C; a pH value of 4.4; a flow rate of 22.8 m3 ± 12.2 m3, which varies according to the productive capacity of the processing plant; and BOD5 and COD values above the theoretical reference average (33,225.5 ± 2564 mg/L and 63,385.3 ± 3995.7 mg/L, respectively).
After the treatment of the water from POME, an effluent with dissolved substances is obtained that generates discharge restrictions, given that it exceeds the maximum values of BOD, COD, Cl, TSS and other compounds according to the current national regulations (see Table 7). However, it contains nutrient such as nitrogen, phosphorus, potassium and calcium, which are favorable for reincorporation, since they do not exceed the maximum values established for reuse purposes. When comparing the values registered by the Casanare Department’s agro-industries, little discrepancy is generally reflected in relation to the reference, whose study was carried out in the eastern zone. Total nitrogen, magnesium, chlorides, sulfates and boron are above the benchmark, while total phosphorus, potassium and calcium are below it.

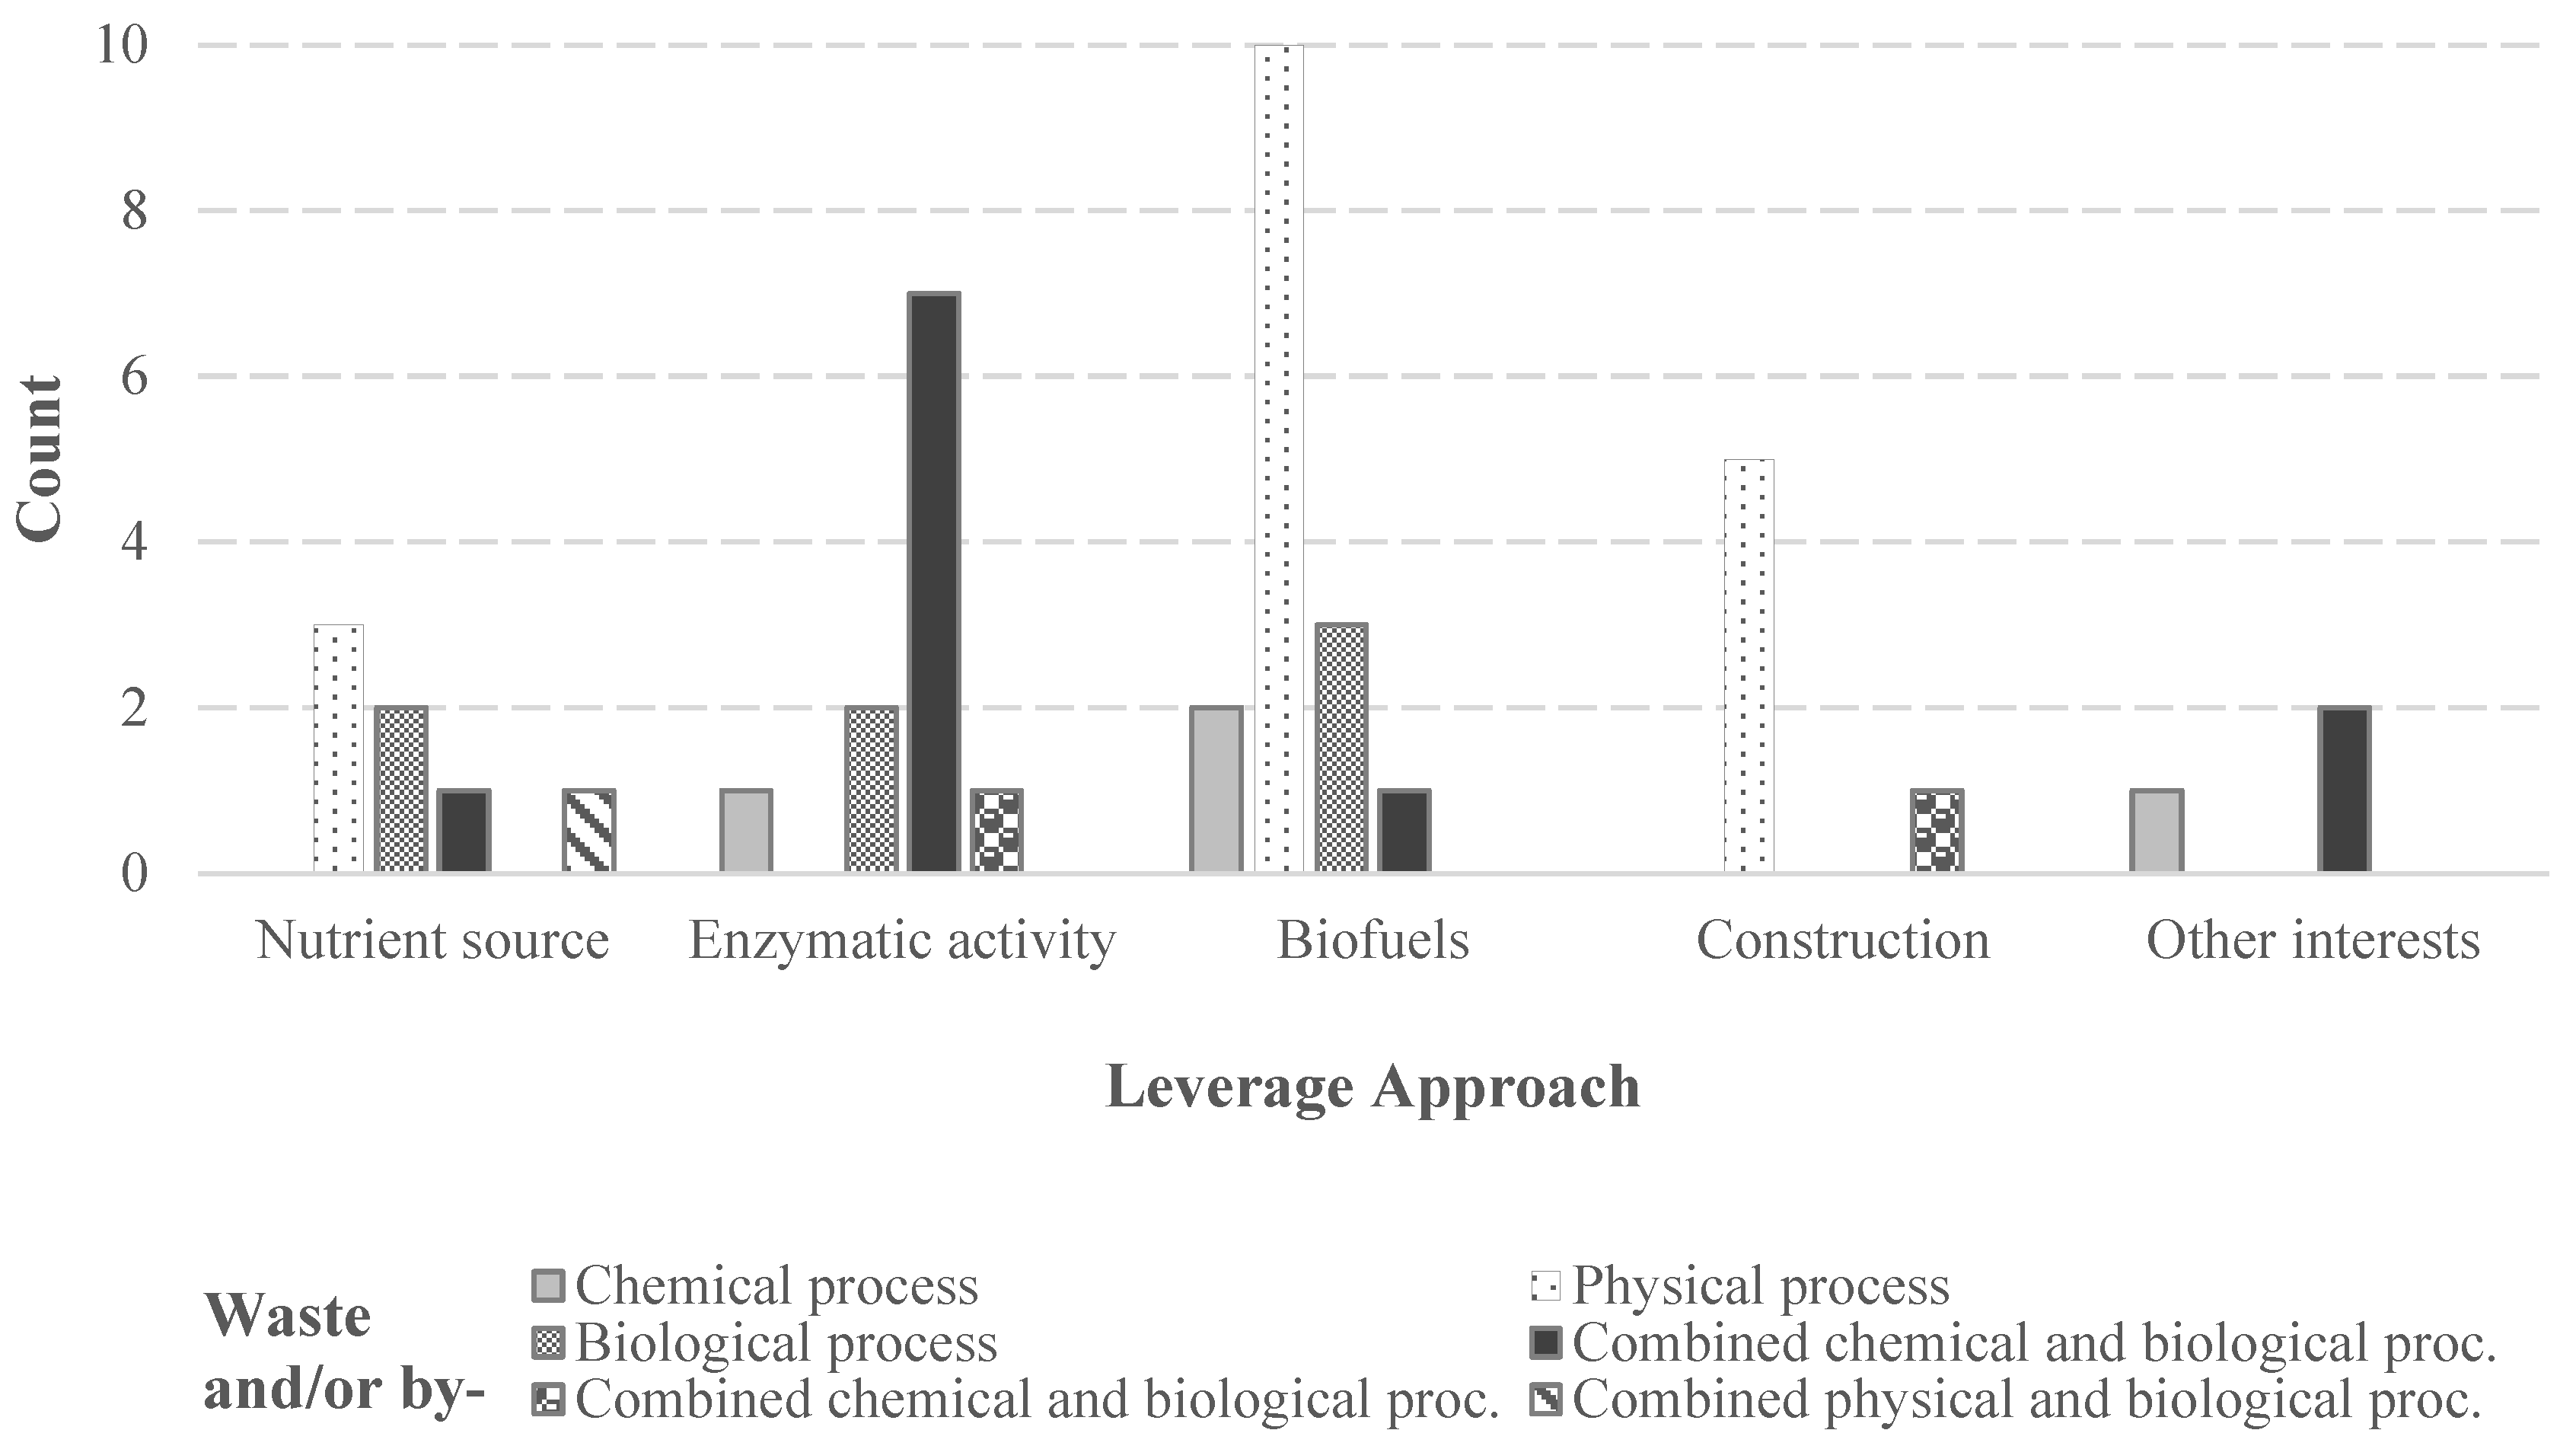
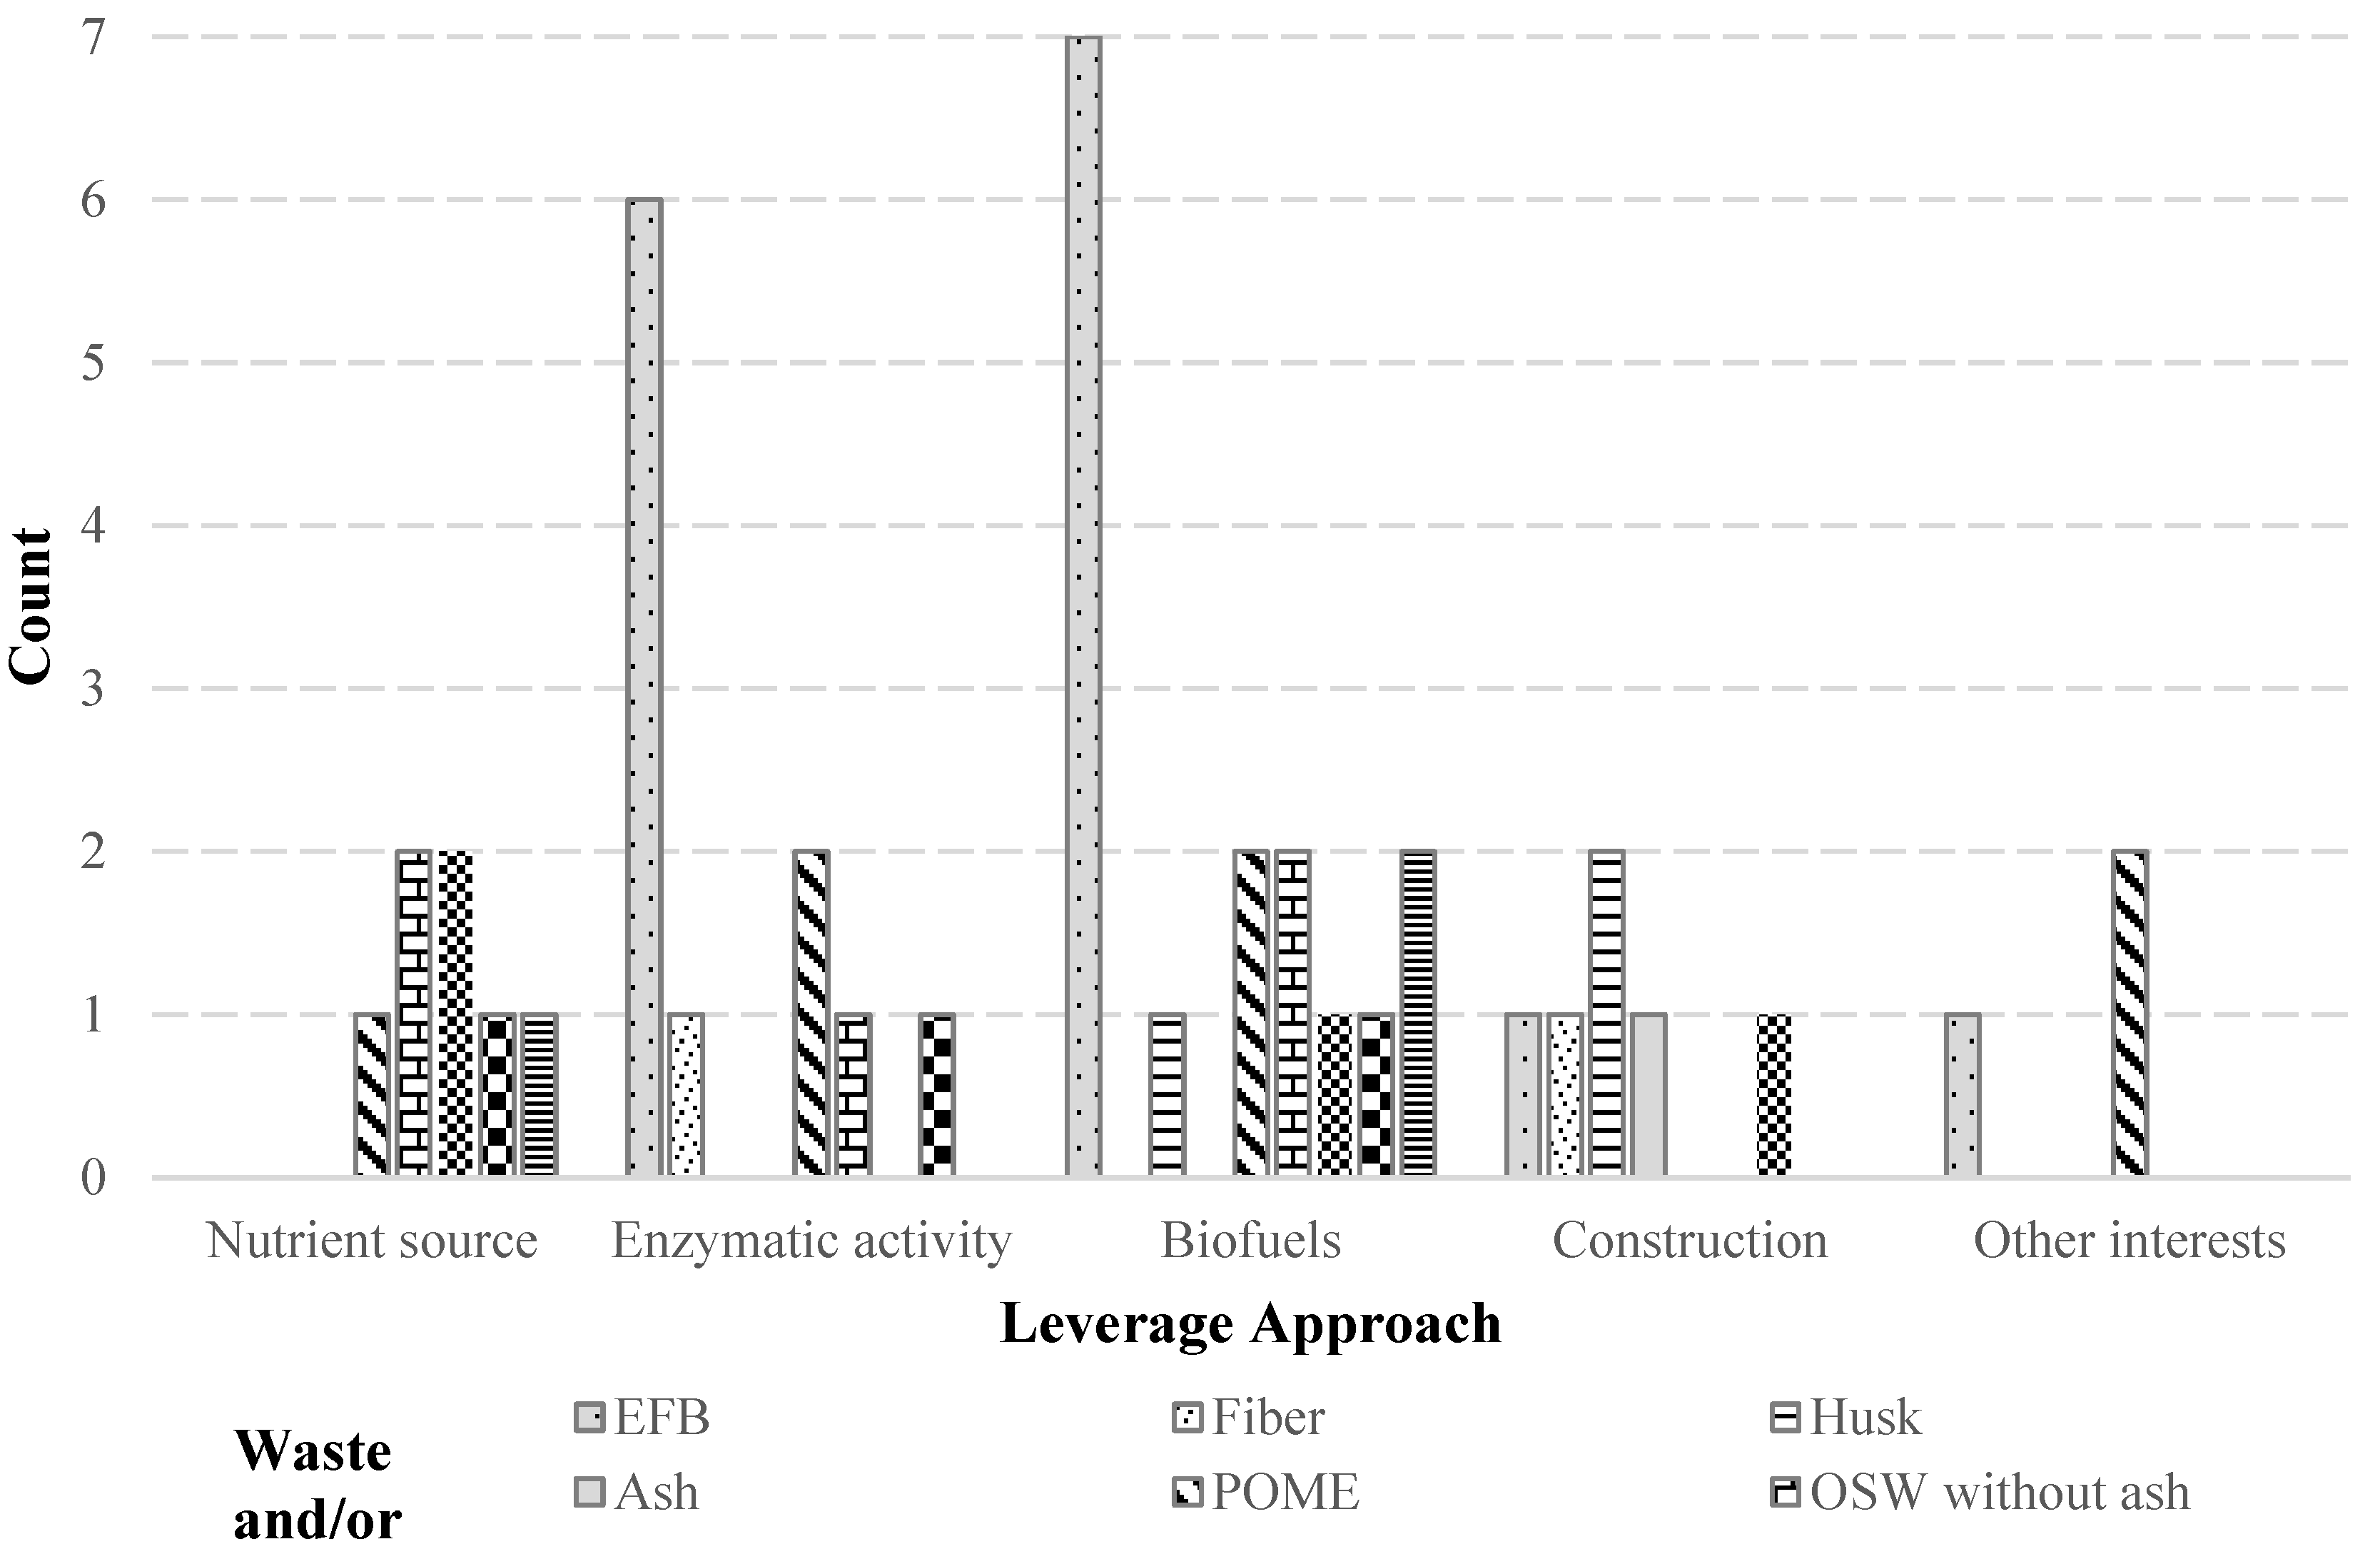
3.2. Approaches and Variables Used in the Valuation of Waste and By-Products of the Palm Sector That Are Generated in the Transformation Process of RFF

In recent years, there has been an increase in the search and development of new activities focused on the conversion of waste and by-products into energy and/or source of materials, with an emphasis on source processes to implement practices that integrate closed cycles [77]. Different academic disciplines have focused their efforts on the research and development of methodologies under closed loop schemes, which allow the incorporation of outputs, visualized as waste and/or by-products, to source processes or complementary processes. Closed loops, processes or cycles are analogies that represent the circular economy, based on material and energy flows that are likely to reincorporate outputs as a source of material or energy (in a degraded state) under valuation methodologies.
The valuation implements different methodologies appropriated by the circular economy, such as recycling, used mainly in Europe, Asia and South America, and reuse or benefit in North America [78]. Nzihou and Lifset [78] highlight that the recovery of waste and by-products refers to the treatment to obtain a benefit as a raw material or complement, or energy, in order to reduce emissions and related environmental impacts (p. 2), whose benefit can be economically estimated. Likewise, by generating closed loops, positive impacts are obtained for the social and economic components of the direct and indirect actors of the productive processes.

Valuation Approaches for Waste and By-Products of Palm Oil

Palm oil waste and by-products have a varied chemical and physical composition, such as moisture, calorific value, nutritional composition, water retention, among others, which generates a range of implementation alternatives according to the requirements of the final process. For this purpose, different methodologies are used, aided by physical, chemical and/or biological processes, to generate products derived from the transformation of waste and by-products, with the feasibility of substituting or complementing other production processes. Table 8 compiles the trends of the last 10 years in relation to the valuation of palm oil waste and by-products, with an emphasis on global trends, exploitation and technological approaches. It is important to highlight that the geographical trend in research was concentrated in Asia (73%), given the current production of CPO, supported mainly in three nations of the Asian continent, corresponding to Indonesia, Malaysia and Thailand, which generate around 66,200 thousand tons of CPO, which is equivalent to 88.16% of the CPO world production ([22], p. 19). Likewise, investigations were evidenced in the continent of America (16%) and Africa (7%), given their participation in the CPO world production, and these continents contribute almost 11.84%, equivalent to 8893 thousand tons ([22], p. 19).
The geographical trends in relation to the exploitation approaches did not present a correlation (Pearson’s chi-square test: 0.813; df: 12), which validates the fact that there is no specific exploitation approach according to the geographical area, but that there is a variety of assessment alternatives of waste and by-products.
Additionally, it was evidenced that there is no correlation between the geographical trend and technological approach (Pearson’s chi-square test: 0.907; df: 15), since there is a variety of investigations with varied methodologies at different geographical scales. On the other hand, it was evidenced that there is a correlation between the exploitation approaches and the type of residue and/or by-product of FFB (Pearson’s chi-square test: 0.001; df: 26), which confirms that each output of the FFB process presents a trend of use according to its physical and chemical composition. However, it was evidenced that there is no correlation between the technological approach and the type of waste and/or by-product of FFB (Pearson’s chi-square test: 0.031; df: 40), since a variety of alternatives are used to transform the outputs of the RFF process according to the final need. However, there is a correlation between the exploitation approach and the technological approach (Pearson’s chi-square test: 0.06; df: 22), which confirmed that there are specific methods according to the exploitation approach.
The exploitation approach is correlated to the type of waste and/or palm oil by-product, which generates trends according to the physical and chemical properties of the outputs of the RFF process. The trends of the exploitation approach are compiled into five categories, corresponding to biofuels, enzymatic activity, nutrients source, construction, and other interests, whose average in the systematic review corresponded to 39%, 35%, 15%, 7% and 4 %, respectively.
Figure 2 shows the trends and approaches that are used according to the variety of waste and/or by-products, which, in some cases, are used individually or together to obtain a complementary or substitute good or service. It is pertinent to note that the main by-product with the greatest relevance is EFB, given the abundance produced after transforming a ton of RFF (in the present investigation, the average EFB after the processing of 1 t of FFB was equivalent to 23.59% of the initial weight), followed by husk and fiber, while the main residue is POME, followed by ash (or complementary processes that use waste and by-products together with ash).
Otherwise, Figure 3 shows the concentration of harvesting approaches for the valuation of palm oil residues and/or by-products. This concentration confirmed the non-correlation between the exploitation and technological approaches, since there is a diversity of transformation methodologies according to the exploitation trend. It is significant to highlight that the main process is the physical process (50%), followed by the biological (43%) and the chemical (39%), which were used individually or together for the transformation of the waste.
  • Biofuels
The main approach for the use of the waste and/or by-product of RFF is biofuels (39% of the total review), in which organic solid waste, such as EFB, fiber, husk and liquid waste POME, is used [36,80]. The biofuels from the highlighted waste are approached from different perspectives, such as (i) complementary or substitute matter for the generation of heat in boilers; (ii) substitute or complementary material for electricity generation; and (iii) substitute material to obtain biodiesel. This is supported by physical processes, such as direct combustion, carbonization, gasification, pyrolysis, torrefaction and thermolysis, and biological processes, such as anaerobic digestion [66,88,121].
Nyakuma [112] evaluated the bioelectricity potential that can be generated by the use of EFB, fiber and husk in different proportions, obtaining a potential of 74.5–119 MWh of electricity per year depending on the efficiency of the conversion process, such as pyrolysis (65 %), gasification (50%) and direct combustion (80%). The investigation determined that, according to the calorific value of organic solid waste, the husk presents the greatest contribution, followed by fiber and EFB. Likewise, the author highlighted the complexity of transforming EFB, given the high moisture content and alkaline content, for which he recommends not implementing it as the only fuel in boilers, but combining it in different proportions with other organic solid waste. However, other authors, such as Aprianti et al. [81], suggest that EFB can be used as the only material for the combustion process, based on gasification processes (350–550 °C), since it has a composition rich in methane (22.64% vol.), carbon monoxide (29.22% vol.) and dihydrogen (3.4% vol.), which produces efficient properties in carbon conversion (95.74%) and cold gas efficiency (81.65%).
Quintero and Torres [36] identified the energy potential of palm oil residues and by-products from the Cesar Department of Colombia through the combination of different proportions of EFB, fiber and husk. In their study, they determined that the combination of fiber and husk, with 30% EFB, presented the best potential for the electrical production of KW and steam; however, it requires a greater capacity in the boiler area. Additionally, they determined that the husk had the highest calorific value among the residues and by-products, and the lowest sulfur and moisture content, which highlights its best use.
Quayson et al. [80] evaluated the production of biofuel from husk (by-product) and POME (residue) in a physical process aided by the enzymatic activity of Aspergillus oryzae. The husk was subjected to a carbonization process (80 °C, 24 h) to generate a structure with micropores capable of retaining impurities, while the POME was used as a source of nutrients to extract the immobilized lipase under the methanolysis method. As a result, they obtained a methyl ester with a cetane index of 48.8 and favorable cold flow properties, which generates a biodiesel suitable for use. A similar process was developed by Vasu et al. [89], for which they used a 50:50 ratio of scale and sludge from POME under pyrolysis processes.
Intasit et al. [86] carried out a similar process to obtain biodiesel from EFB and POME, aided by non-sterile solid state fermentation biological processes with Aspergillus tubingensis TSIP9 (a fungus present in the residual biomass of palm oil) and bioreactors. As a product, they obtained a biodiesel with a low potassium content and a high cellulose content.
Another investigation that focused on POME was carried out by Idris et al. [104], in which they used microalgae Chlorella vulgaris UNMACC 001 in a suspended bed to extract biodiesel. As a result, they obtained a high growth rate (0.29 day−1) equivalent to 0.12 ± 0.02 g liter−1 day−1 of biomass, whose scenario is favorable for the extraction of ester with a content of 69.9% fatty acids. It is important to highlight the two previous authors, since the biological treatment of wastewater with a bioreactor is not used in the department; for this purpose, valuation goals such as these were not considered in the circular economy model.
Contrastingly, the methodology of Lam et al. [88] used EFB in conjunction with a residue from machinery operation (used oil) to generate a solid biofuel from the torrefaction method at the controlled temperature of 250 °C. As a result, they obtained a solid fuel with a high calorific power (28.0 MJ/kg) and medium carbon content (68.3%). The foregoing is pertinent to highlight, since it uses microwave technology for the torrefaction process, which is a low-cost process. Similarly, Gallego et al. [83] investigated heat variation by means of response energy gain techniques as an alternative to variable energy yield to determine the efficiency of the torrefaction process in the generation of solid biofuels. As a result, they obtained a yield of 37 t/day of biochar, a product of the transformation of 100 t/day of EFB, with an electricity potential of 0.36 MW.
  • Enzymatic activity
The second approach for the use of the residues and/or by-products of FFB is the enzymatic activity (35% of the total revision), which uses organic solid residues, such as EFB, and the POME liquid residue , given their high content of carbon, nitrogen, phosphorus, potassium and cellulose. The main chemical method used for the present approach corresponds to hydrolysis, aided by biological processes of fermentation.
Iwuagwu and Ugwuanyi [115] used the POME residue as the only source of carbon and nitrogen, without a prior treatment, with concentrations of 76,000 mgL−1 of total solids, 15,128 mgL−1 of organic carbon, 114,800 mgL−1 of COD, 3.9 pH, among others, to obtain yeasts. For this purpose, they used fermentation at 150 rpm, 28 ± 2 °C, with bacteria typical of the wastewater treatment process, such as Saccharomyces sp. L31. As a result, they obtained a profitable growth of dry yeast, with a concentration of 4.42 gL−1, whose amino acid content was higher than the FAO/OMS standard. It should be noted that this process generated an added value, since it presented a decomposition of 83% of the initial BOD.
A similar investigation for the generation of enzymes that used waste and/or by-products as a carbon source was developed by Silveira et al. [109], who used fiber and crushed husk, with a diameter of 1–2 mm, together with Aspergillus niger C BRMCTAA 82 in a submerged fermentation. As a result, they obtained a favorable yield with fiber and husk residues when compared to lipase production with other residues from other crops, given their natural content of palmitic acid and fatty acids, which represent a greater source of carbon, and consequently, a higher generation of lipase as a substitute product for industrial enzymes.
Nazir et al. [117] developed a methodology with formic acid (20% w/v) and hydrogen peroxide (10% v/v) to extract cellulose from EFB fibers, with a result of 64% (w/w) of cellulose, which registers one of the highest values of the compared benchmarks. Another investigation emphasizing cellulose extraction was carried out by Sinjaroonsak et al. [90], who extracted cellulose and xylanase from Empty Fruit Bunch (EFB) pretreated with aluminum peroxide and aided by Streptomyces strains.
Another relevant investigation was carried out by Zulkarnain et al. [95], who extracted biovanilla from the use of EFB, a by-product rich in lignocellulose. This process was carried out by means of alkaline hydrolysis with a result of 41% vanillic acid and 39% biovanilla.
Although the results obtained in this category are very interesting due to the different applications this method has, this approach does not present technical feasibility according to the technological conditions of the agro-industries of the Casanare Department, and, for this reason, it was not considered for the circular economy model.
  • Nutrient source
The third approach for the use of the residues and/or by-products of RFF is the source of nutrients (15% of the total review), which uses organic solid residues, such as EFB, fiber and ash, and the POME liquid residue. This approach is used to obtain complementary or substitute products, given the nutritional content rich in phosphorus, nitrogen, potassium and magnesium, and low metal content, mainly aided by biological and physical processes, such as composting, bioreactors and pyrolysis. It is noteworthy to emphasize that this approach presents the union of residues and by-products of palm oil or other productive activity to generate stable products with better assimilation capacity by the substrates.
Lim and Wu [108] used POME (specifically the effluent generated in the centrifugation process) since this residue has a high content of nitrogen, phosphorus, potassium, magnesium and suspended oil, with a composition of 76% water, 12 % of residual oil and the rest in cellulose, lignin and other impurities. To generate a compost suitable for the nutritional requirements, they used a 2:1 ratio of POME and rice straw, with a duration of 4 weeks at a controlled temperature of 60 °C. As a result, they obtained a compost of 9.76 C/N, calcium (1.13 ± 0.05 g/kg), potassium (25.47 ± 0.32 g/kg), magnesium (4.87 ± 0, 19 g/kg), sodium (7.40 ± 0.03 g/kg) and phosphorus (3.62 ± 0.27 g/kg).
Hau et al. [84] used a combination of EFB, POME, ashes and residues from other production processes to generate a compost rich in carbon and nitrogen. For this purpose, they used different ratios of residues in 40-day beds with a controlled temperature, whose matter was decomposed by Eisenia Fetida. As a result, they obtained a superior composting performance due to their nutritional composition by combining EFB plus POME with a 1:1 ratio, containing 31.9% C, 1.08% N, 3.8% K and a ratio of 29.45 C/N. The study also generated a compost made up of EFB ash; however, it presented a low yield of carbon, nitrogen and potassium content, but a medium phosphorus content.
A study with similar results was developed by Nahrul et al. [120], in which they used different proportions of EFB with POME. To do this, they used Eisenia Fetida in composting beds with time periods of 40 to 45 days, with initial and final comparison of the C/N ratio. In the different proportions analyzed, they determined a reduction of 1/3 of the initial ratio, with a greater efficiency in the 50:50 ratios of EFB with POME, respectively.
Lemus [87] used the effluent from the POME treatment under facultative processes and maturation, in order to obtain a substitute product for crop fertilization. For this, the analysis of the physical and chemical components that limit or favor the productivity of t RFF/ha was carried out, such as K, Cl, N, P, S, Mg, Ca and heavy metals. Subsequently, soil irrigation was implemented for more than a year to determine the increase in foliar parameters, t RFF/ha, salinization, retention of substances in the substrate and transfer of chemical substances to the water table. As a result, a low-cost substitute product was obtained, which only involves the investment of the sprinkler irrigation system, increases leaf growth and t RFF/ha, and does not generate retention of substances in the water table. Additionally, it obtained a significant reduction in costs associated with the remuneration rate and fertilization.
  • Building
The last exploitation approach corresponds to construction (14% of the total review), which uses fiber, husk and ash for its physical properties of resistance and moisture retention capacity. This approach uses the physical processes of drying at a controlled temperature to guarantee the mechanical properties of the by-product, which favors the generation of complementary products.
Fokam et al. [79] used fibers from the RFF mesocarp obtained during the nut separation process, which were previously subjected to drying (105 °C in 24 h). They used different proportions in combination with industrial cement to determine the stiffness of the mortar. As a result, they obtained a more resistant mortar, whose composition contained 3.5% residual fiber from palm oil. On the other hand, Ong et al. [102] used a comparative study between palm oil residues (husk), steel mills (steel slag) and power plants (coal bottom ash) combined with concrete to determine the stiffness (measured in Mpa). As a result, a mortar strength lower than the one corresponding to 28 days (39.44 MPa) was obtained, but higher than the one corresponding to 90 days (44.08 MPa) when using concrete with palm oil husk.
Although the implementation of palm oil waste and by-products favors the conditions for the generation of new, more resistant products, this approach was not contemplated in the circular economy model, since the installed capacity in the Department does not meet the base conditions for this implementation.

3.3. Circular Economy Model for the Reincorporation of Waste and By-Products from the Palm-Growing Sector in the Casanare Department

The circular economy model reincorporates waste and by-products from the palm oil sector under the quantitative indicators of Material Flow and Other-life-cycle-based approaches, adjusted to the approaches of Moraga et al. [9], Elia et al. [10], Rossi et al. [5] and Salguero-Puerta et al. [27]. The model was adjusted to the circular economy strategies that correspond to (i) preserving the function of products with multifunctional characteristics (strategy 1); (ii) conserving the components of the product through the reuse, recovery and reuse of parts (strategy 5); (iii) conserve embodied energy through the recovery of incineration facilities; and (iv) measure the linear economy as a reference scenario against which the model can be compared under assumptions and/or implementations of circular models (strategy 6).
This model corresponds to a specific type of measurement under the sensu stricto aspect (quantify aspects of quality and quantity), of material flow indicators and other-life-cycle-based approaches, which makes it a model of mixed parameters. When comparing its range of implementation with respect to Moraga et al. [9], the model has indicators of physical properties of technological cycles with an emphasis on reuse, recyclability and recovery (scope 1) and indicators that assess effects (burdens and benefits) with respect to environmental, economic and/or social concerns (scope 2). The range of implementation is adjusted at the micro level, as it focuses on a certain sector and RFF transformation process.

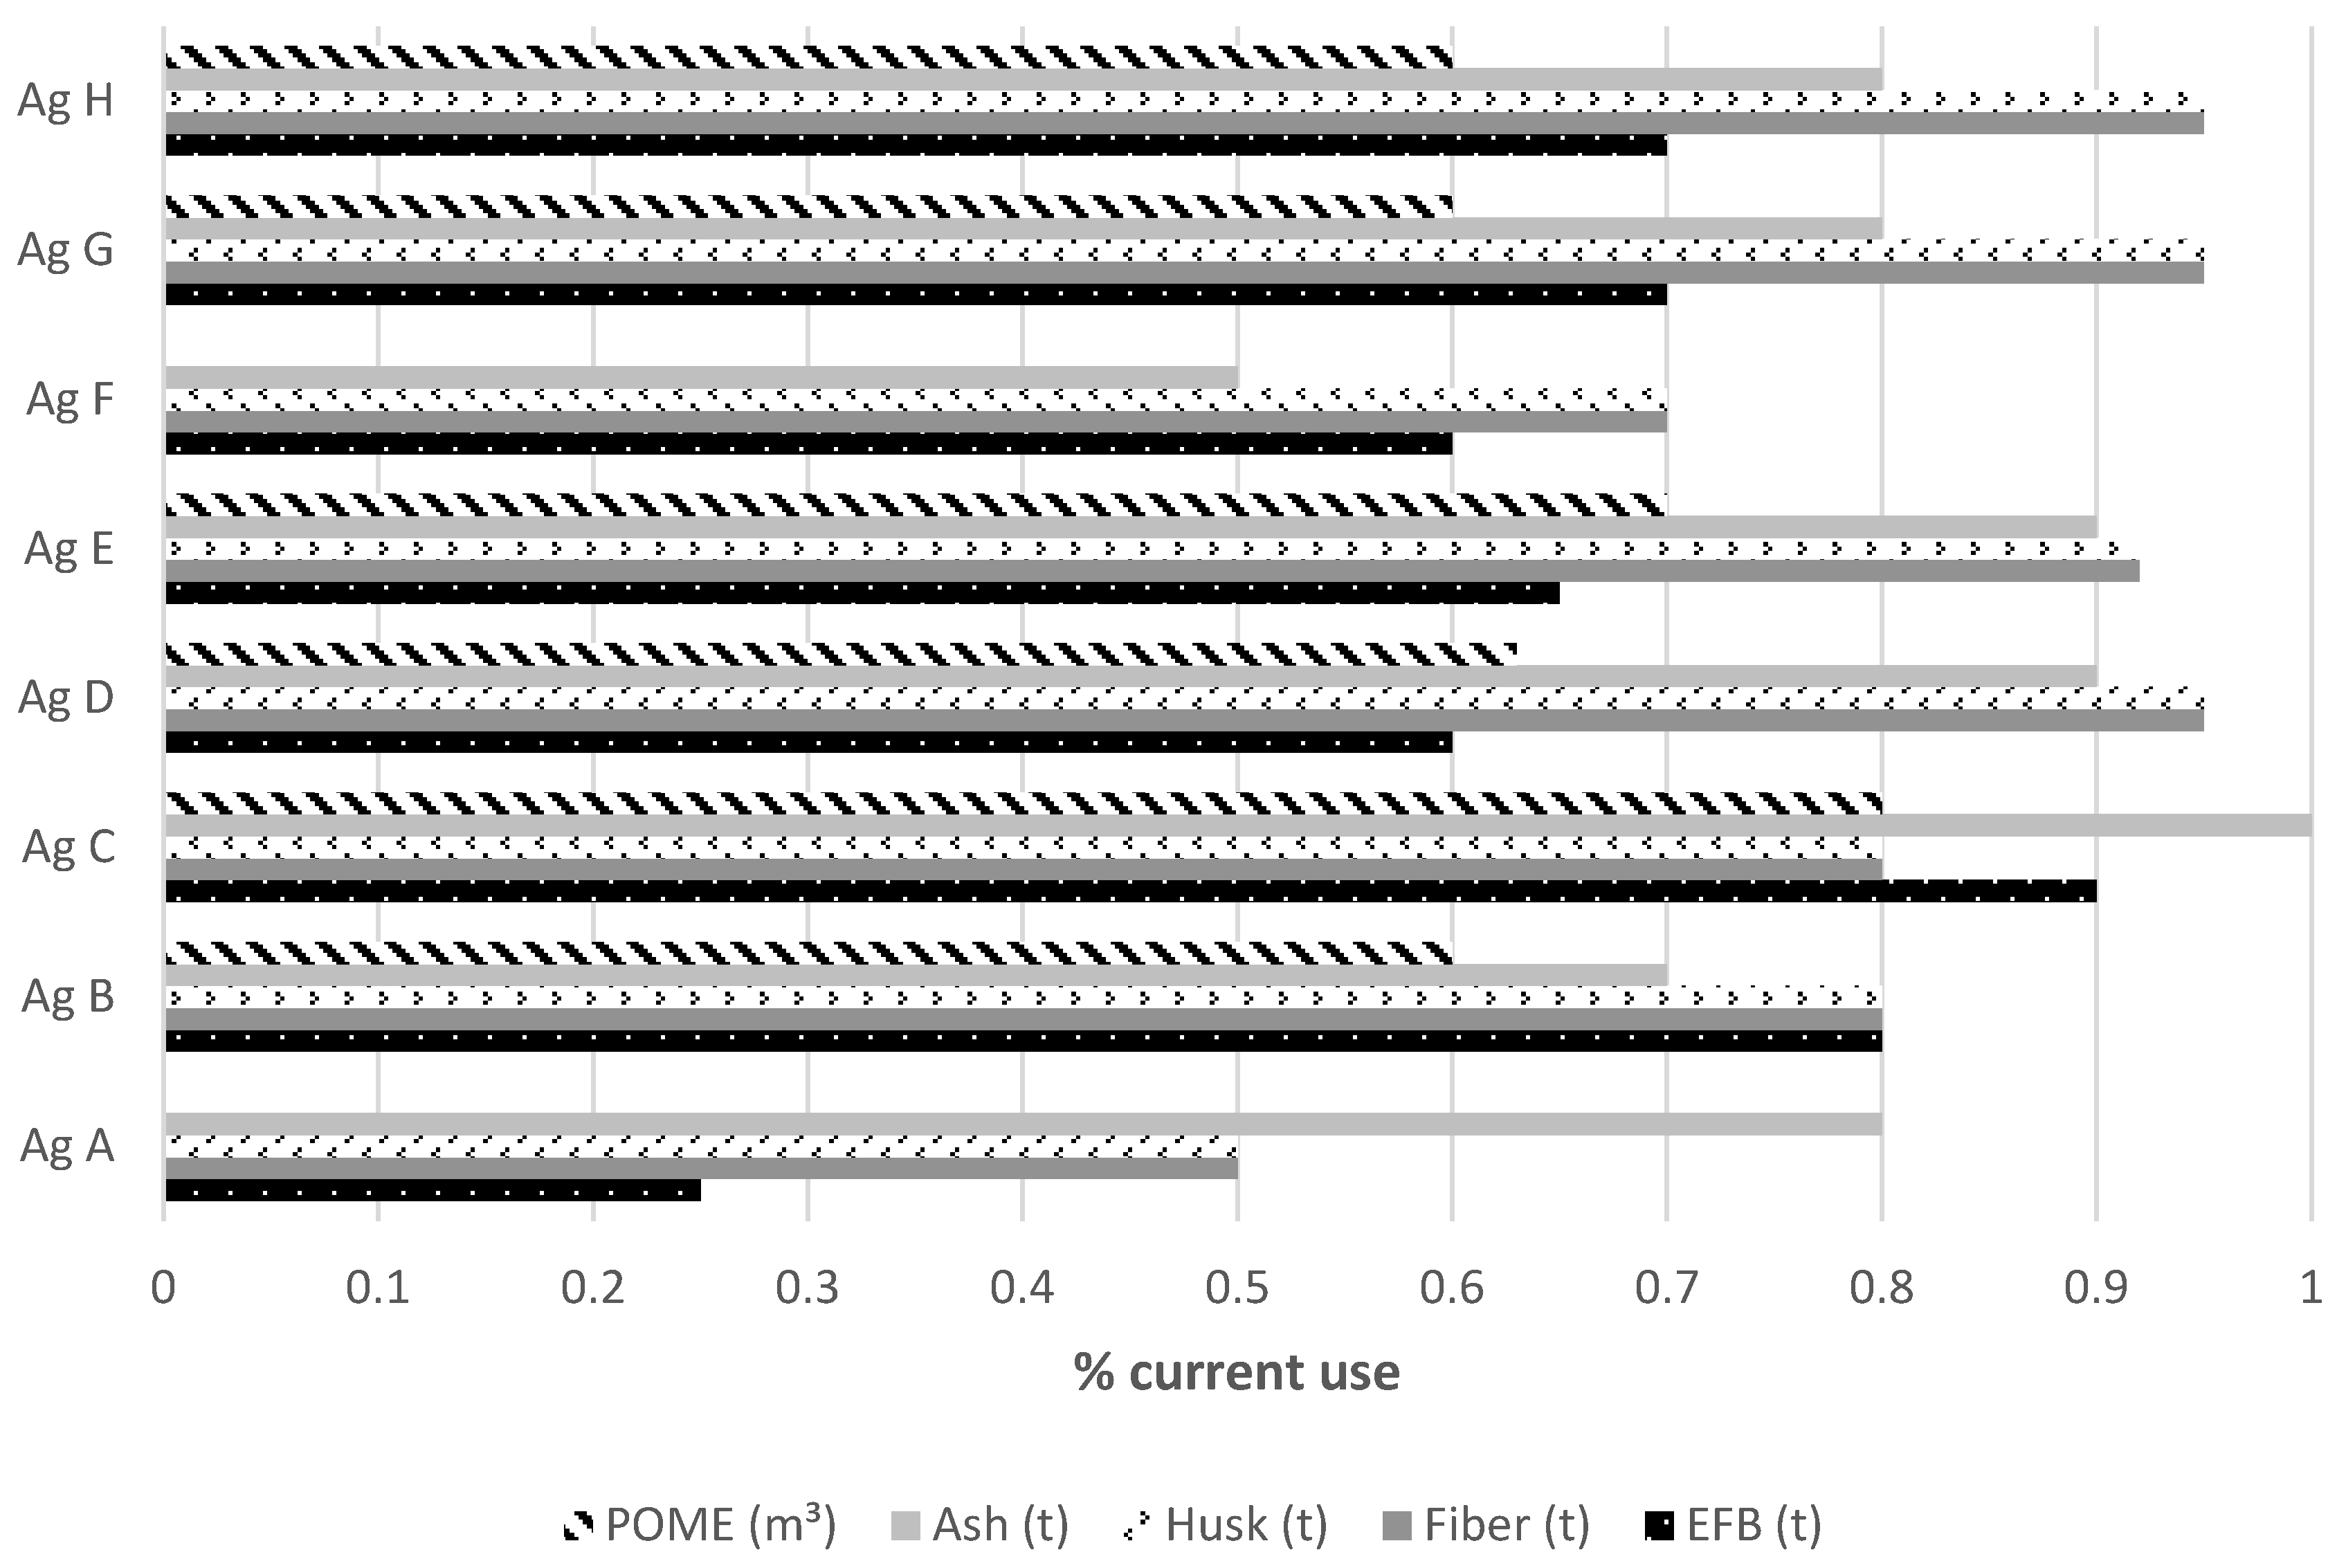
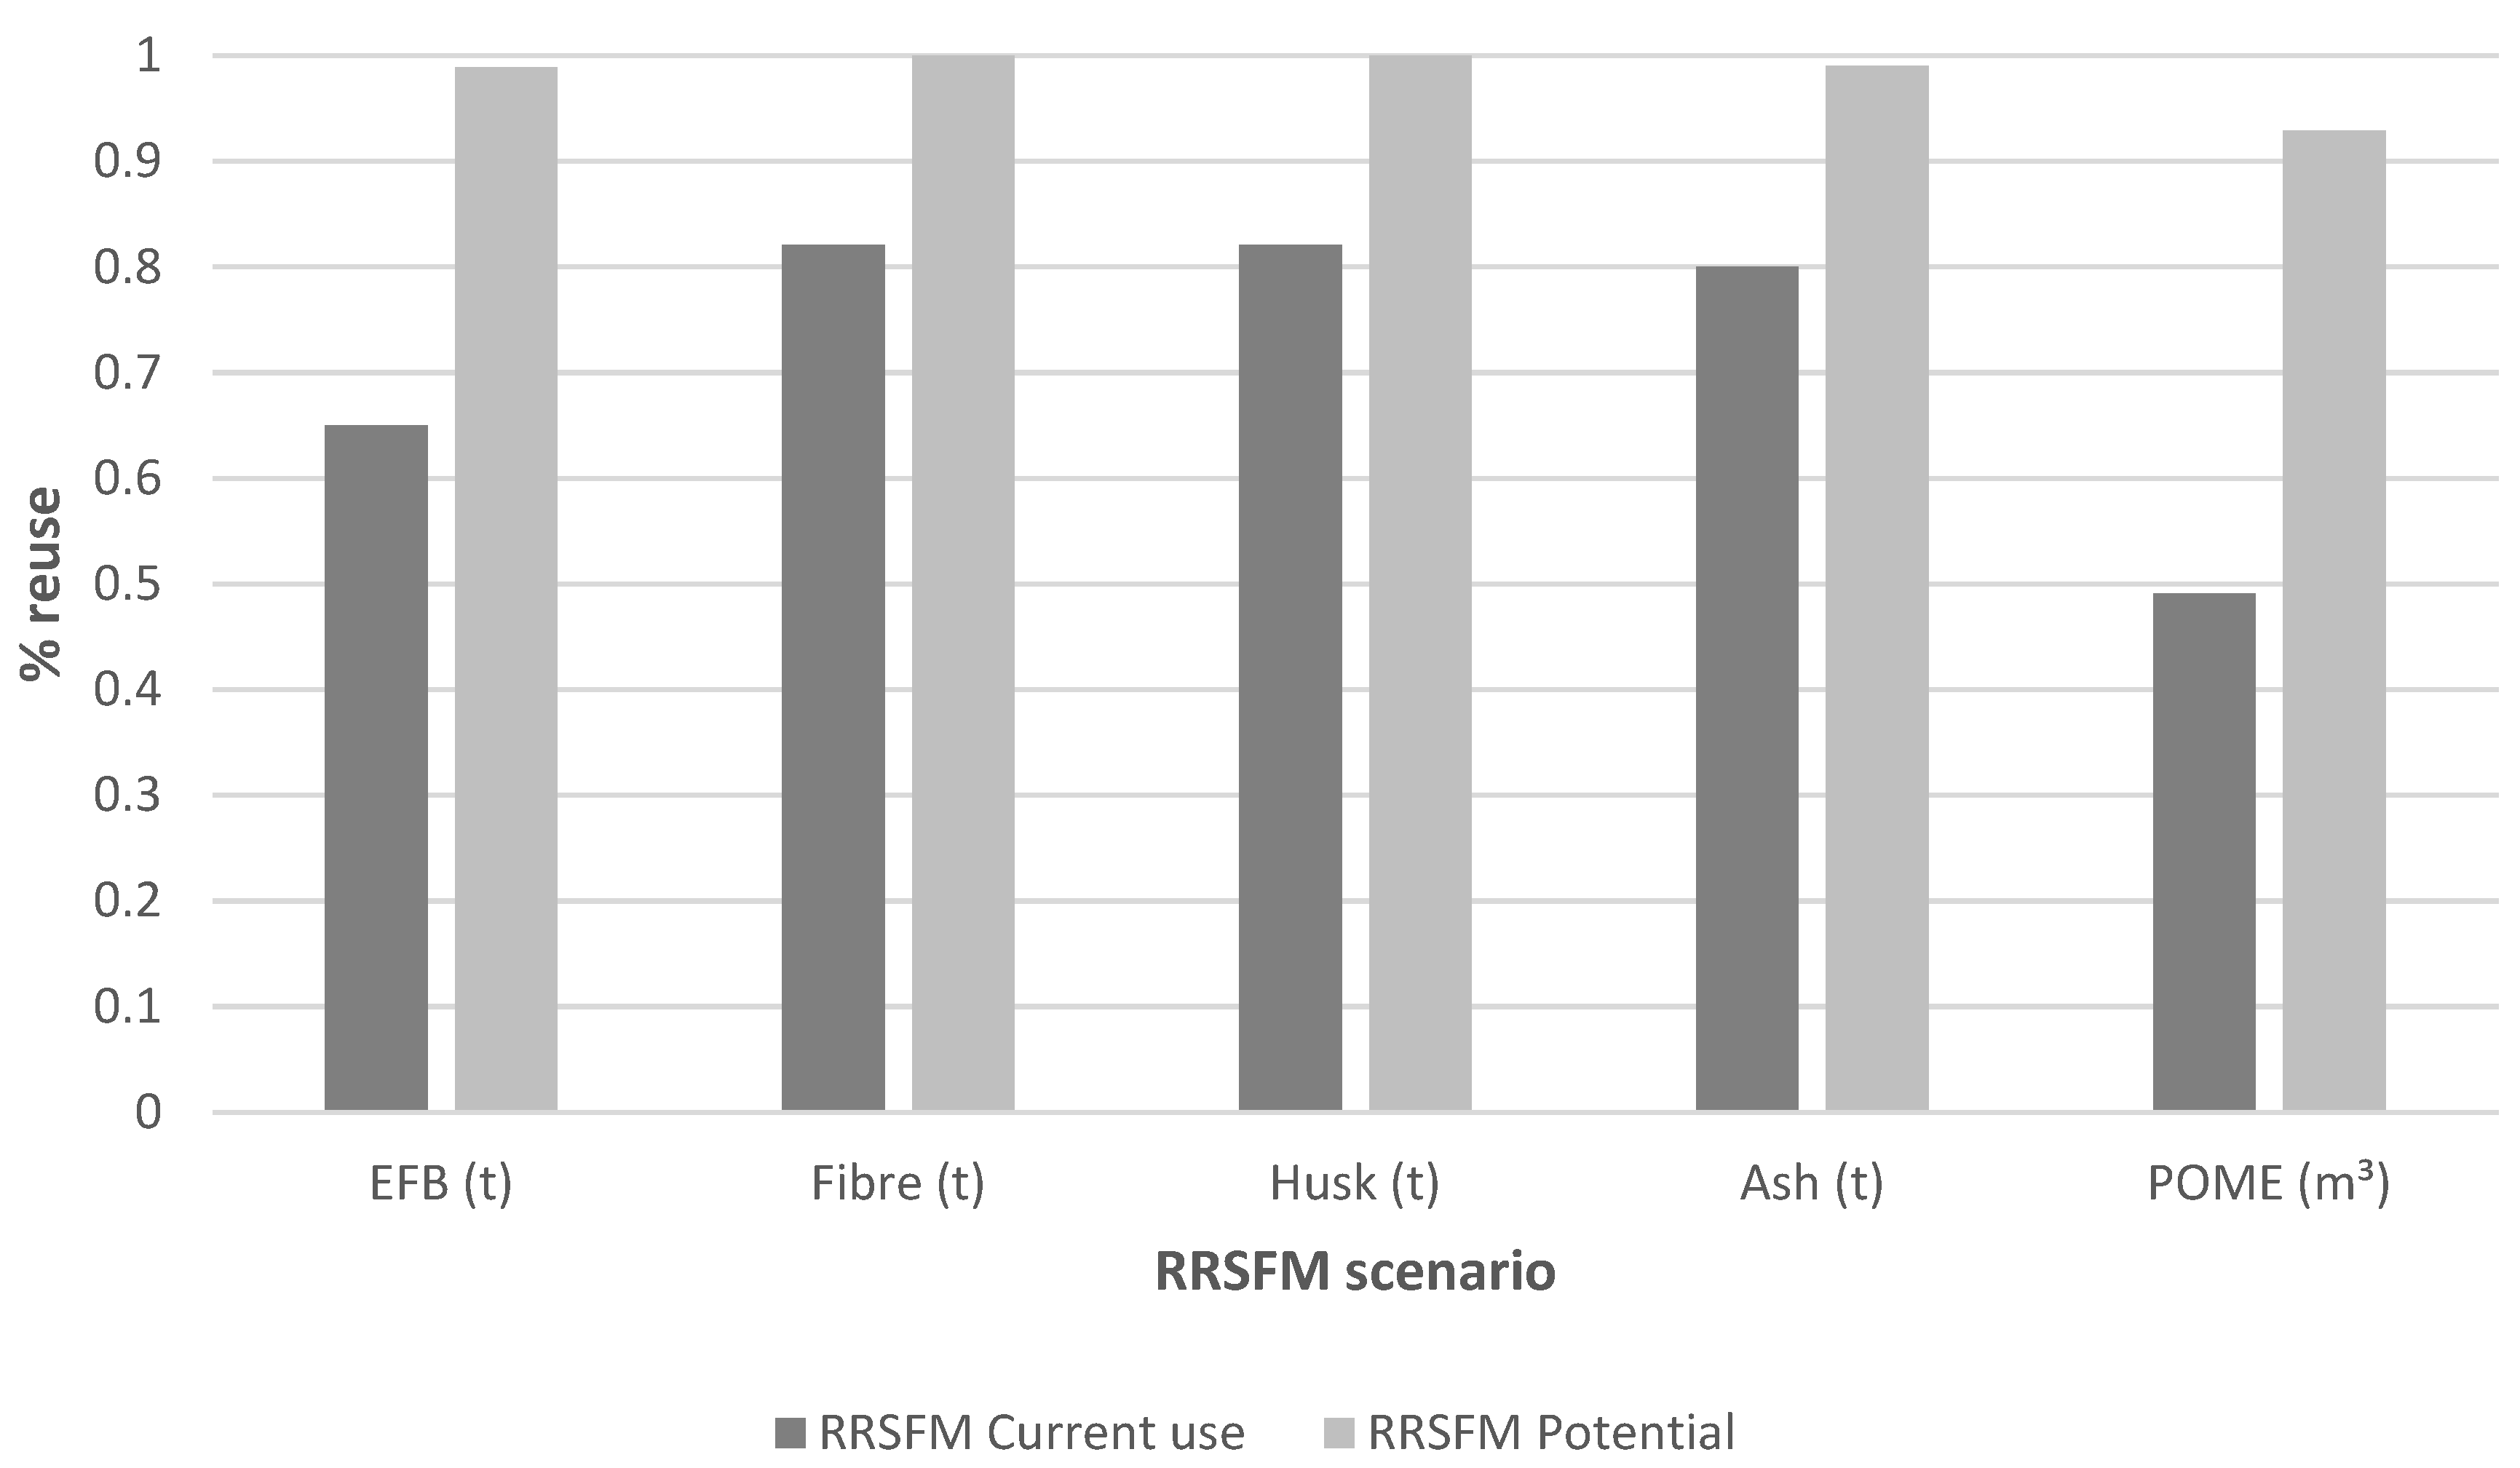
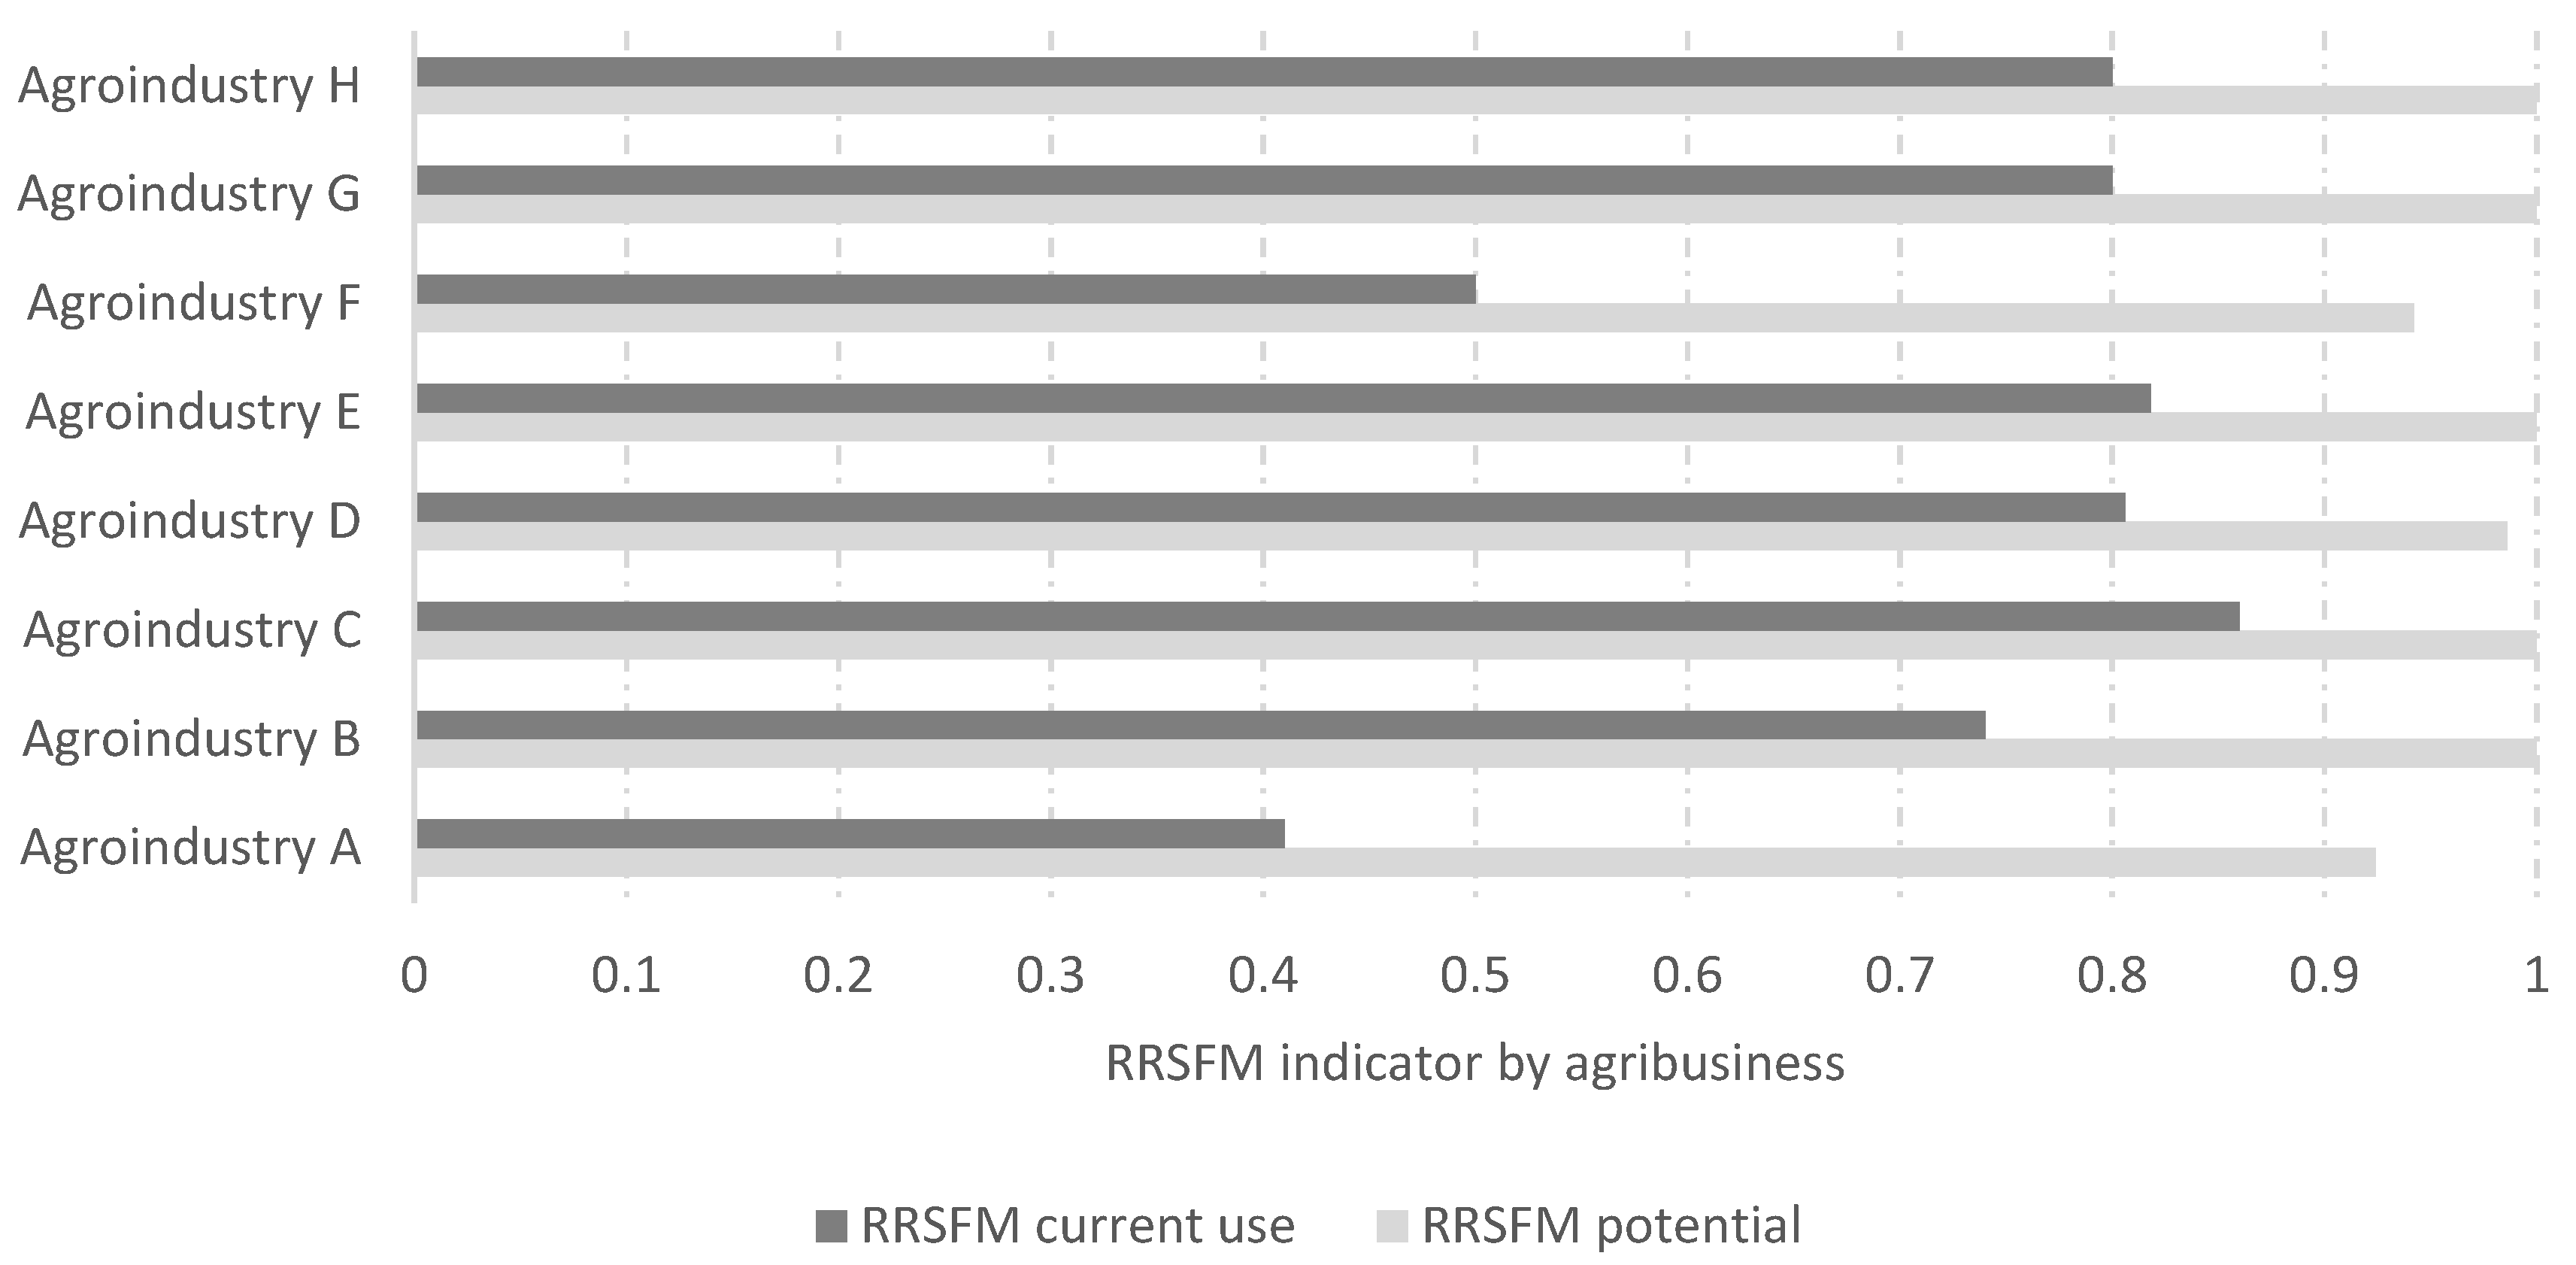
3.3.1. Indicator of Reincorporation of Waste and By-Products by Flow of Materials (RRSMF) of the Palm-Growing Sector of the Casanare Department

In the previous sections, the coefficients or constants for the generation of waste and by-products of palm oil in the Casanare Department were determined, which allowed the construction of the projection of the generation of waste and by-products for the period 2013–2019. The projection of the results of the year 2019 was extracted, which corresponds to the baseline for the formulation of the RRSFM indicator.
Table 9 shows the variables that make up the circular economy RRSFM indicator from the previously investigated baseline in relation to the generation of waste and transformation by-products of the RFF in the agribusinesses of the department by Casanare. The factor corresponds to the individual contribution of each agro-industry with respect to the total production. The Total Generation (Gt) variable of waste and by-products corresponds to the product of the contribution of RFF/h of each agro-industry by the waste or by-product of the year 2019. It is relevant to mention that 75% of the processing of RFF/h or CPO/h concentrates in four of the eight agro-industries or benefit plants reported for the Casanare Department.
The Current Use (Ac) variable of residues and by-products is not the same in all agro-industries; for this reason, the reincorporation rate varies according to each processing plant (see Figure 4). The residues and by-products with the highest average reincorporation as a second-use product are Fiber (84.12%), Scale (80%) and Ash (80%). However, the remaining value is related to the poor management used by two agro-industries, since they use only 60% ± 10% of this waste in incineration or composting processes, which makes these two plants a significant source of negative externalities.
In relation to EFB, it presents an implementation average of 65% in the plantations adjacent to the agro-industries. Agro-industry A is critical, which uses only 25% of the total generation, and the rest is available in the open. In relation to POME, only 49.12% of the total effluent is used in second use, which makes it the waste with the lowest degree of incorporation. It is important to highlight its negative impact on the dimensions of the development, since 50.88% (9199 m3/year) are discharged into surface bodies.
When diagnosing the current state of use for each agro-industry, it is evident that agro-industries A and F show the least degree of progress, given their short time in industrial training. On the other hand, the remaining agro-industries show greater progress given the environmental management policies they currently employ (see Figure 5). However, all processing plants under this characterization have a high potential to improve their degree of incorporation of waste and by-products.
The last variable that influences the quantitative model corresponds to the Potential Use (AP) under the 2026 scenario, whose value was estimated according to the installed capacity and change in territorial prospective associated with the sustainability reports and the conversations held with some environmental professionals from each processing plant. Under this variable, the waste and by-product with the highest potential degree of reuse would correspond to fiber (100%) and husk (100%), given the use in boilers that partially or totally replaces the fuel, and followed by ashes (99%) (implemented jointly with EFB and residual effluent treated for composting and soil conditioner).
It is evident that the waste with the greatest implementation difficulty under the second use framework corresponds to POME (92.87%), whose effluent presents high BOD and COD compositions that require efficient treatment systems to adjust to the maximum allowed values. However, under the methodology proposed by Lemus [87], which is coupled to the nutritional and meteorological conditions of the Casanare Department, fertigation could be carried out at a relatively low cost, and its investment can be recovered by the absence of the payment of a retributive rate and fertilization.
When processing the model under the quantitative variables, two moments of the RRSFM model were identified (see Figure 6). The first moment corresponds to the current scenario of agro-industries, which do not have a 100% use of any type of waste or by-product. This moment generates a landfill or open pit disposal of 2121 t of EFB, 682 t of fiber, 264 t of scale and 32 t of ash, and a dumping of 9199 m3 of the residual effluent.
The second moment corresponds to an optimistic scenario where the agro-industries, according to their environmental forecast for the year 2026, increase the recirculation capacity under the hypothesis of improving the physical conditions to adopt a greater degree of second use of waste and by-products. From this scenario, the reuse of EFB and ash is 99%, of fiber and husk is 100% and of POME is 92%, which is equivalent to a waste of 1.47% of the total generation of waste and by-products, mainly contributed by the low management in the incorporation of POME. However, under a more optimistic scenario, the incorporation could be increased to 100%, since the volume of unincorporated POME would correspond to 537 m3/year, which could satisfy the water and fertilizer demand of 0.53 ha with a ±2 mm layer. ha−1 day−1.
On the other hand, it was shown that, currently, no agro-industry in the Casanare Department has an indicator above 86%. In fact, five are grouped into values in the 80–86% range, one in 51–80% and two in 0–50%. This correlates with the time of the industrial formation in the Department, in which the two agro-industries with the lowest score correspond to new processing plants established in recent years (see Figure 6). Additionally, it is pertinent to mention that the agro-industries with values greater than 80% follow the guidelines of the RSPO (Roundtable on Sustainable Palm Oil) standard of 2018.
In relation to the potential moment, an increase of 26% in the RRSFM indicator was evidenced (see Figure 6), due to the increase in the incorporation of waste and by-products. This translates into a decrease in negative externalities, improvement in environmental management and reduction in negative impacts on the dimensions of sustainable development.

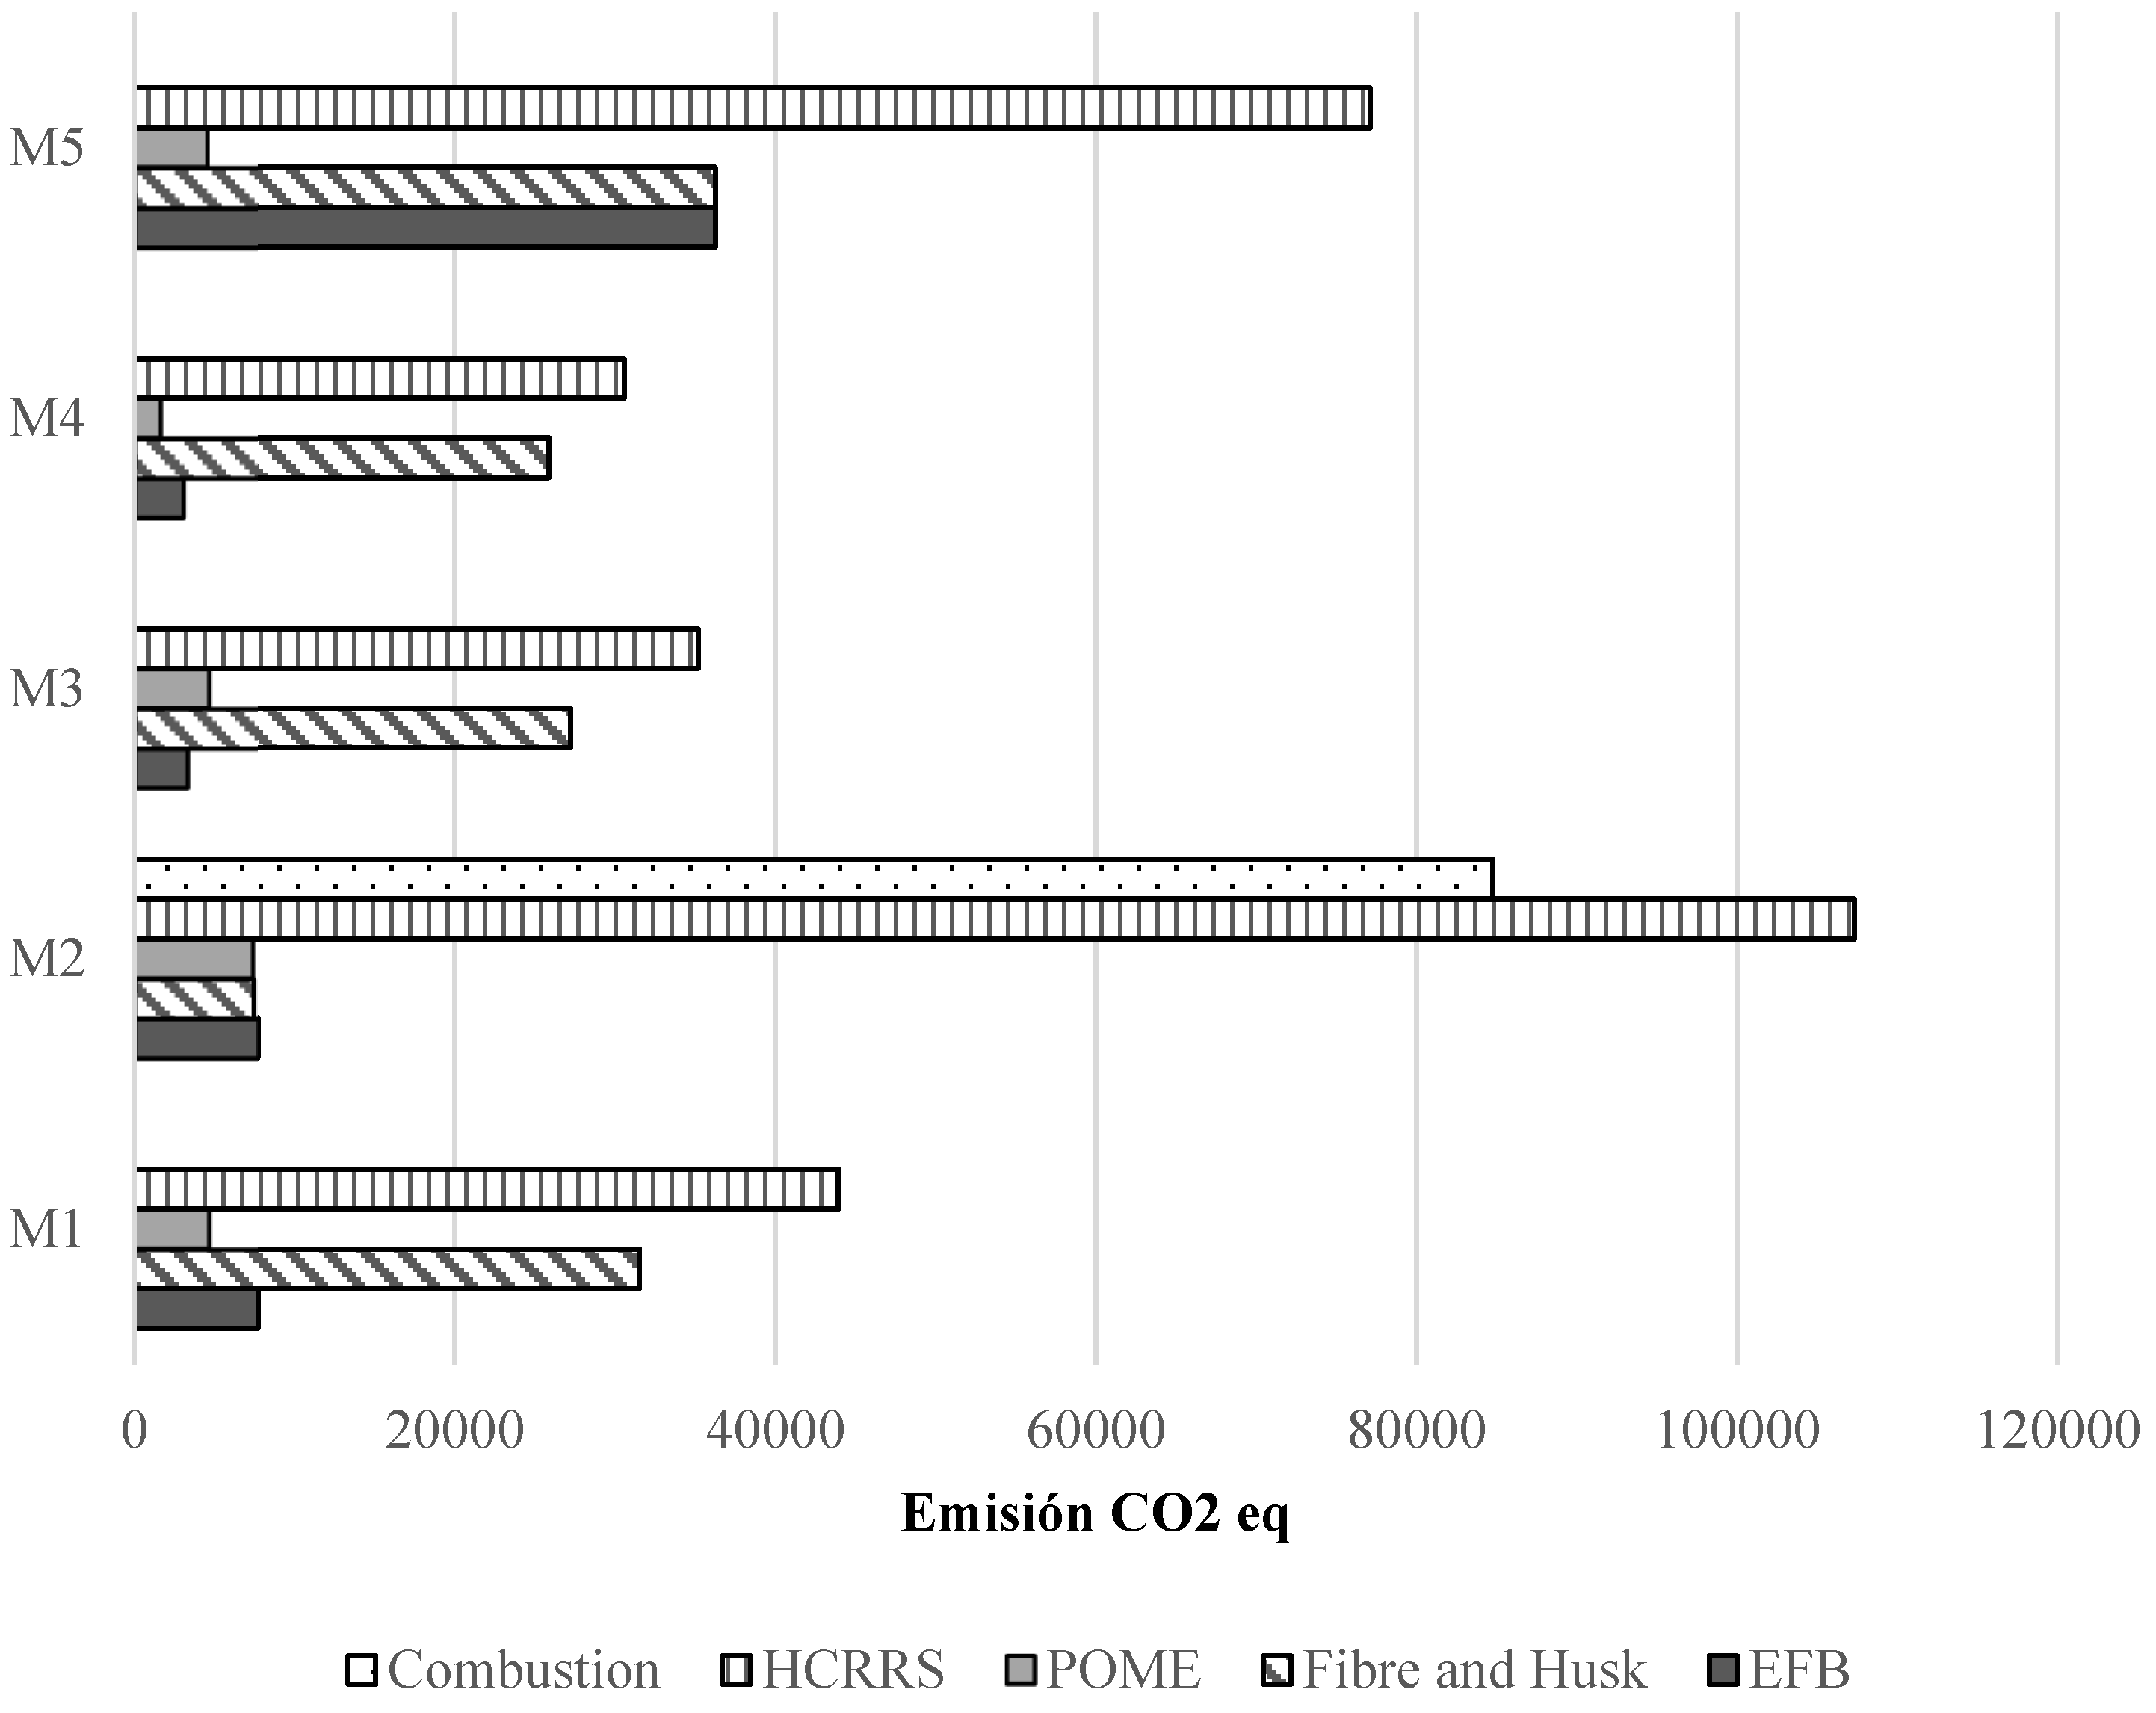
3.3.2. Carbon Footprint Indicator of the Reincorporation of Waste and By-Products (HCRRS) of the Palm-Growing Sector of the Casanare Department

The model established a second indicator related to the incorporation of Material Flows under the Other-life-cycle-based approach, called Carbon Footprint of the Reincorporation of Waste and By-products (HCRRS), which corresponds to a complementary measurement suggested by Elia et al. [10] and Moraga et al. [9]. The foregoing is based on the quantification of CO2-eq/t RFF * year 2019, emitted by the disposal of waste and by-products that emit GHGs (see Table 10).
Moment one (M1) of the RRSFM indicator (see Figure 7) represents the negative scenario of the reuse of process outputs under the current trends corresponding to: (i) EFB disposed entirely in the open sky; (ii) fiber and husk incinerated in its entirety; and (iii) POME placed in open-air sedimentation ponds. The aforementioned scenario would emit 43,925 t CO2eq, where the greatest contribution corresponds to the incineration of the fiber and husk.
Based on M1, a second moment (M2) is extracted with a change in the fuel source, in which fiber and husk incineration is replaced by a non-renewable source, such as carbon. Under this assumption, the equivalent emission would correspond to 104,857 t CO2eq.
The third moment (M3) corresponds to the current scenario of the RRSFM indicator, which corresponds to: (i) the utilization of 65% of the EFB in composting and the rest in the open air; (ii) the implementation of fiber and husk of 82.14% in boilers and the rest in the open air; and (iii) the reuse of 60.4% of the effluent for composting and/or a source of nutrients, with the rest being discharged. The foregoing emits 33,860 t CO2eq, where 77.3% is a product of the incineration of fiber and scale for boilers. However, this value is likely to be reduced with circular economy practices.
On the other hand, the fourth moment (M4) corresponds to the potential RRSFM scenario, whose assumption establishes (i) the total use of EFB as compost, combined in a 2:1 ratio of POME and EFB; (ii) the incorporation of 82% of fiber and husk as fuel and the rest as biochar; and (iii) the utilization of 64.47% of POME in composting and the rest used as fertigation. According to the conditions mentioned, the emissions would correspond to 30,573 t CO2eq.
Finally, the fifth moment (M5) represents the scenario of non-incorporation of waste and by-products, which are incinerated in their entirety. This assumption would generate 77,107 t CO2eq.
When comparing the potential moment of the RRFSM (M4) with the other scenarios, it is evident that there is a reduction of 30.39% with respect to M1; 71.52% in relation to M2; 13.11% compared to M3; and 60.34% in relation to M5. It is prudent to highlight that the reduction would be greater if the technological capacity and business projection were inclined towards the incorporation of biodigesters and biochar.
Finally, based on Law 1819 of 2016, which established the National Carbon Tax (INAC), the cost avoided by implementing circular practices (M4) in relation to the current RRFSM would correspond to USD 18,940, which is equivalent to the other costs avoided under the analyzed circular economy model.

4. Conclusions

The circular economy model, based on the recovery of waste and by-products of the palm oil transformation process, allows visualizing comparative scenarios according to the current and potential uses (adjustable according to the projection) under two quantitative indicators. Although the indicators measure different variables (mass flow and avoided carbon dioxide emission), these two facilitate the symbiotic interpretation of environmental management practices based on sustainable development. Likewise, they illustrate the feasibility of generating different circular economy indicators that measure waste incorporation, elimination and/or prevention processes.

Author Contributions

Conceptualization, R.I.M.-A. and J.-P.R.-M.; methodology, P.-A.C.B.; formal analysis, P.-A.C.B., Y.I.M.-A. and R.S.; research, P.-A.C.B. and J.-P.R.-M.; resources, R.I.M.-A., Y.I.M.-A. and R.S. All authors have read and agreed to the published version of the manuscript.

Funding

This research received no external funding.

Institutional Review Board Statement

Not applicable.

Informed Consent Statement

Not applicable.

Data Availability Statement

Not applicable.

Conflicts of Interest

The authors declare no conflict of interest.

References

  1. Barros, M.V.; Salvador, R.; de Francisco, A.C.; Piekarski, C.M. Mapping of research lines on circular economy practices in agriculture: From waste to energy. Renew. Sustain. Energy Rev. 2020, 131, 109958. [Google Scholar] [CrossRef]
  2. Kirchherr, J.; Reike, D.; Hekkert, M. Conceptualizing the circular economy: An analysis of 114 definitions. Resour. Conserv. Recycl. 2017, 127, 221–232. [Google Scholar] [CrossRef]
  3. Suárez-Eiroa, B.; Fernández, E.; Méndez-Martínez, G.; Soto-Oñate, D. Operational principles of circular economy for sustainable development: Linking theory and practice. J. Clean. Prod. 2019, 214, 952–961. [Google Scholar] [CrossRef]
  4. Schroeder, P.; Anggraeni, K.; Weber, U. The Relevance of Circular Economy Practices to the Sustainable Development Goals. J. Ind. Ecol. 2018, 23, 77–95. [Google Scholar] [CrossRef] [Green Version]
  5. Rossi, E.; Bertassini, A.C.; dos Santos Ferreira, C.; do Amaral, W.A.N.; Ometto, A.R. Circular Economy indicators for organizations considering Sustainability and Business Models: Plastic, textile and electro electronic cases. J. Clean. Prod. 2019, 247, 119–137. [Google Scholar] [CrossRef]
  6. Velenturf, A.P.M.; Purnell, P. Principles for a sustainable circular economy. Sustain. Prod. Consum. 2021, 27, 1437–1457. [Google Scholar] [CrossRef]
  7. Korhonen, J.; Honkasalo, A.; Seppälä, J. Circular Economy: The Concept and its Limitations. Ecol. Econ. 2018, 143, 37–46. [Google Scholar] [CrossRef]
  8. Martínez, A.; Porcelli, M. Estudio sobre la economía circular como una alternativa sustentable frente al ocaso de la economía tradicional (primera parte). Lex Rev. la Fac. Derecho y Cienc. Política la Univ. Alas Peru. 2018, 16, 301–334. [Google Scholar] [CrossRef]
  9. Moraga, G.; Huysveld, S.; Mathieux, F.; Blengini, G.; Alerts, L.; Acker, K.; Meester, S.D.; Dewulf, J. Circular economy indicators: What do they measure? Resour. Conserv. Recycl. 2019, 146, 452–461. [Google Scholar] [CrossRef]
  10. Elia, V.; Grazia, M.; Tornese, F. Measuring circular economy strategies through index methods: A critical analysis. J. Clean. Prod. 2016, 142, 2741–2751. [Google Scholar] [CrossRef]
  11. Prieto-Sandoval, V.; Ormazabal, M.; Jaca, C.; Viles, E. Key elements in assessing circular economy implementation in small and medium-sized enterprises. Bus. Strateg. Environ. 2017, 28, 1525–1534. [Google Scholar] [CrossRef]
  12. de Oliveira, C.T.; Dantas, T.E.T.; Soares, S.R. Nano and micro level circular economy indicators: Assisting decision-makers in circularity assessments. Sustain. Prod. Consum. 2021, 26, 455–468. [Google Scholar] [CrossRef]
  13. Yusuf, M. Agro-industrial Waste Materials and Their Recycled Value-Added Applications: Review. In Handbook of Ecomaterial; Torres, L., Vasilievna, O., Eds.; Springer: Berlin/Heidelberg, Germany, 2017; pp. 2700–2710. [Google Scholar]
  14. Poh, P.E.; Wu, T.Y.; Lam, W.H.; Poon, W.C.; Lim, C.S. Palm Oil Milling Waste. In Waste Management in the Palm Oil Industry; Springer International Publishing: Cham, Swizterland, 2020; pp. 21–44. ISBN 978-3-030-39550-6. [Google Scholar]
  15. Sadh, P.K.; Duhan, S.; Duhan, J.S. Agro-industrial wastes and their utilization using solid state fermentation: A review. Bioresour. Bioprocess. 2018, 5, 1. [Google Scholar] [CrossRef] [Green Version]
  16. Ramos, C.; Zilber, M.A.; Silva, L.F.; Lhama, P.; Davila, F. Economía circular, innovación y sustentabilidad. Brazilian J. Dev. 2019, 5, 21261–21276. [Google Scholar] [CrossRef]
  17. Rubinsin, N.; Daud, W.; Kamarudin, S.; Masdar, M.; Rosli, M.; Samsatli, S.; Tapia, J.; Ghani, W.; Lim, K. Optimization of oil palm empty fruit bunches value chain in peninsular malaysia. Food Bioprod. Process. 2020, 119, 179–194. [Google Scholar] [CrossRef]
  18. Umar, M.; Urmee, T.; Jennings, P. A policy framework and industry roadmap model for sustainable oil palm biomass electricity generation in Malaysia. Renew. Energy 2018, 128, 275–284. [Google Scholar] [CrossRef]
  19. Elias, M.A.; Hadibarata, T.; Sathishkumar, P. Modified oil palm industry solid waste as a potential adsorbent for lead removal. Environ. Chem. Ecotoxicol. 2021, 3, 1–7. [Google Scholar] [CrossRef]
  20. Van Fan, Y.; Lee, C.T.; Lim, J.S.; Klemeš, J.J.; Kim Le, P.T. Cross-disciplinary approaches towards smart, resilient and sustainable circular economy. J. Clean. Prod. 2019, 232, 1482–1491. [Google Scholar] [CrossRef]
  21. Byerlee, D.; Falcon, W.P.; Naylor, R. The Tropical Oil Crop Revolution: Food, Feed, Fuel, and Forests; Press, O.U., Ed.; New York Oxford University Press: New York, NY, USA, 2017. [Google Scholar]
  22. USDA Oilseeds: World Markets and Trade, United States Departament of Agriculture. 2021. Available online: https://apps.fas.usda.gov/psdonline/circulars/oilseeds.pdf (accessed on 29 February 2020).
  23. Ortiz, A. La Palma de Aceite Como Ejemplo Para la Agroindustria en Colombia; Fundación Universitaria de América: Bogotá, Colombia, 2019. [Google Scholar]
  24. Rakundo, R.; Bergeron, S.; Bacoum, I.; Pelletier, N.; Doyon, M. A Methodological Approach to Designing Circular Economy Indicators for Agriculture: An Application to the Egg Sector. Sustainability 2021, 13, 8656. [Google Scholar] [CrossRef]
  25. Oliveira, M.; Cocozza, A.; Zucaro, A.; Santagata, R.; Ulgiati, S. Circular economy in the agro-industry: Integrated environmental assessment of dairy products. Renew. Sustain. Energy Rev. 2021, 148, 111314. [Google Scholar] [CrossRef]
  26. Barcelos, S.M.B.D.; Salvador, R.; Barros, M.V.; de Francisco, A.C.; Guedes, G. Circularity of Brazilian silk: Promoting a circular bioeconomy in the production of silk cocoons. J. Environ. Manag. 2021, 296, 113373. [Google Scholar] [CrossRef] [PubMed]
  27. Salguero-Puerta, L.; Leyva-Díaz, J.C.; Cortés-García, F.; Molina-Moreno, V. Sustainability Indicators Concerning Waste Management for Implementation of the Circular Economy Model on the University of Lome (Togo) Campus. Int. J. Environ. Res. Public Health 2019, 16, 2234. [Google Scholar] [CrossRef] [PubMed] [Green Version]
  28. Wang, N.; Guo, Z.; Meng, F.; Wang, H.; Yin, J.; Liu, Y. The circular economy and carbon footprint: A systematic accounting for typical coal-fuelled power industrial parks. J. Clean. Prod. 2019, 229, 1262–1273. [Google Scholar] [CrossRef]
  29. Callejo, J.; Parra, T.; Manrique, T. Evaluación de la Producción de los Subproductos Agroindustriales en Andalucía; Descripción Los Subproductos: Andalucia, Spain, 2015. [Google Scholar]
  30. Ferronato, N.; Rada, E.; Gorritty, M.; Cioca, L.; Ragazzi, M.; Torretta, V. Introduction of the circular economy within developing regions: A comparative analysis of advantages and opportunities for waste valorization. J. Environ. Manag. 2019, 230, 366–378. [Google Scholar] [CrossRef]
  31. Maina, S.; Kachrimanidou, V.; Koutinas, A. A roadmap towards a circular and sustainable bioeconomy through waste valorization. Curr. Opin. Green Sustain. Chem. 2017, 8, 18–23. [Google Scholar] [CrossRef]
  32. Cardenas, P.; Rodriguez, J.; Castillo, A. Alternatives utilization of waste: Technical and environmental considerations in the agribusiness sector. Int. J. Mech. Prod. Eng. Res. Dev. 2020, 10, 15659–15676. [Google Scholar]
  33. Abdurahman, N.; Rosli, Y.; Azhari, N. Development of a membrane anaerobic system (MAS) for palm oil mill effluent (POME) treatment. Desalination 2011, 226, 208–212. [Google Scholar] [CrossRef]
  34. Abdullah, N.; Sulaiman, F. The Oil Palm Wastes in Malaysia. In Biomass Now-Sustainable Growth and Use; Darko, M., Ed.; IntechOpen: London, UK, 2013; pp. 75–99. [Google Scholar]
  35. Guimaraes, O. Influencia del Estado de la Madurez y Condiciones de Esterilización de Los Frutos, en el Rendimiento y Calidad de Aceite Crudo de Palma Africana (Elaeis guineensis) de la Planta Extractora Oleaginosas Amazónicas S.A; Universidad Nacional de la Amazonia: Iquitos, Peru, 2019. [Google Scholar]
  36. Quintero, L.A.; Torres, C.I. Análisis de residuos sólidos de palma africana, como alternativa de aprovechamiento de energías renovables en el departamento del Cesar. Ing. USBMed 2019, 10, 8–18. [Google Scholar]
  37. Foo, K.Y.; Hameed, B.H. Value-added utilization of oil palm ash: A superior recycling of the industrial agricultural waste. J. Hazard. Mater. 2009, 172, 523–531. [Google Scholar] [CrossRef]
  38. Yeo, J.; How, B.; Teng, S.; Leong, W.; Ng, W.; Lim, C.; Ngan, S.; Sunarso, J.; Lam, H. Synthesis of Sustainable Circular Economy in Palm Oil Industry Using Graph-Theoretic Method. Sustainability 2020, 12, 8081. [Google Scholar] [CrossRef]
  39. Loh, S.K. The potential of the Malaysian oil palm biomass as a renewable energy source. Energy Convers. Manag. 2017, 141, 285–298. [Google Scholar] [CrossRef]
  40. Tay, J.H. Ash from oil-palm waste as concrete material. J. Mater. Civ. Eng. 1990, 2, 94–105. [Google Scholar] [CrossRef]
  41. Singh, R.P.; Ibrahim, M.H.; Esa, N.; Iliyana, M.S. Composting of waste from palm oil mill: A sustainable waste management practice. Rev. Environ. Sci. Bio/Technol. 2010, 9, 331–334. [Google Scholar] [CrossRef]
  42. Lau, H.L.N.; Choo, Y.M.; Ma, A.N.; Chuah, C.H. Quality of residual oil from palm-pressed mesocarp fiber (Elaeis guineensis) using supercritical CO2 with and without ethanol. J. Am. Oil Chem. Soc. 2006, 83, 893–898. [Google Scholar] [CrossRef]
  43. Vijaya, S.; Ma, A.; Choo, Y.; Nik Meriam, N. Life cycle inventory of the production of crude palm oil-A gate to gate case study of 12 palm oil mills. J. Palm Res. 2008, 20, 484–494. [Google Scholar]
  44. Yusoff, S. Renewable energy from palm oil e innovation on effective utilization of waste. J. Clean. Prod. 2006, 14, 87–93. [Google Scholar] [CrossRef]
  45. Zinatizadeh, A.A. Biological Treatment of Palm Oil Mill Effluent (POME) Using an Up-Flow Anaerobic Sludge Fixed Film (UASFF) Bioreactor; University Sains Malaysia (School of Chemical Engineering): Nibong Tebal, Malaysia, 2006. [Google Scholar]
  46. Kong, S.H.; Loh, S.K.; Bachmann, R.T.; Rahim, S.A.; Salimon, J. Biochar from oil palm biomass: A review of its potential and challenges. Renew. Sustain. Energy Rev. 2014, 39, 729–739. [Google Scholar] [CrossRef]
  47. Ali, A.; Othman, M.; Shirai, Y.; Hassan, M. Sustainable and integrated palm oil biorefinery concept with value-addition of biomass and zero emission system. J. Clean. Prod. 2015, 91, 96–99. [Google Scholar] [CrossRef] [Green Version]
  48. Huailuek, N.; Silalertruksa, T.; Gheewala, S. Life cycle assessment and cost-benefit analysis of palm biorefinery in Thailand for different empty fruit bunch (EFB) management scenarios. J. Sustain. Energy Environ. 2019, 10, 65–73. [Google Scholar]
  49. Stichnothe, H.; Schuchardt, F. Comparison of different treatment options for palm oil production waste on a life cycle basis. Int. J. Life Cycle Assess. 2010, 15, 907–915. [Google Scholar] [CrossRef]
  50. Embrandiri, A.; Ibrahim, M.; Singh, R. Palm Oil Mill Wastes Utilization; Sustainability in the Malaysian Context. Int. J. Sci. Res. Publ. 2013, 24, 389–393. [Google Scholar]
  51. Abas, R.; Kamaruddin, M.; Nordin, A.; Simeh, M. A study on the Malaysian Oil Palm biomass sector-Supply and perception of palm oil millers. Oil Palm Ind. Econ. J. 2011, 11, 28–41. [Google Scholar]
  52. Cenipalma. Statistical Data Collected for Benchmarking in Oilmills by Cenipalma; Cenipalma: Bogotá, Colombia, 2005. [Google Scholar]
  53. Bernal, F.N. El cultivo de la Palma de Aceite y su Beneficio: Guía General Para el Nuevo Palmicultor; Fedepalma: Bogotá, Colombia, 2001; ISBN 958-96494-3-2. [Google Scholar]
  54. Ponce, F.; Silva, E.; Yáñez, E.; Castillo, E. Potencial de congeneración de energía eléctrica en la agroindustria colombiana de palma de aceite: Tres estudios de caso. Rev. Palmas 2008, 29, 59–72. [Google Scholar]
  55. García, J.; Cárdenas, M.; Yánez, E. Generación y uso de biomasa en plantas de beneficio de palma de aceite en Colombia. Rev. Palmas 2010, 31, 41–48. [Google Scholar]
  56. Ramírez, N.; Arévalo, A.; García, J. Inventario de la biomasa disponible en plantas de beneficio para su aprovechamiento y caracterización fisicoquímica de la tusa en Colombia. Rev. Palmas 2015, 36, 41–54. [Google Scholar]
  57. Subramaniam, V.; Chow, M.C.; Ma, A. Energy database of the Oil Palm. Palm. Oil Bull. Kuala Lumpur Malays. 2004, 70, 15–22. [Google Scholar]
  58. Loh, S.K. Biocombustibles de segunda generación de la biomasa de palma de aceite. Rev. Palmas 2016, 37, 137–148. [Google Scholar]
  59. Shafigh, P.; Jumaat, M.Z.; Mahmud, H. Mix design and mechanical properties of oil palm shell lightweight aggregate concrete: A review. Int. J. Phys. Sci. 2010, 5, 2127. [Google Scholar]
  60. Cortés, C.; Cayón, D.; Aguirre, V.; Chávez, B. Respuestas de palmas de vivero a la aplicación de residuos de la planta extractora. Rev. Palmas 2006, 27, 23–32. [Google Scholar]
  61. Villegas, J.M.; Avila, H. Quick-scan estimating model of Higher Heating Value of oil palm empty fruit bunches based on ash from proximate analysis data. Rev. Ing. E Investig. 2014, 34, 33–38. [Google Scholar] [CrossRef]
  62. Abdullah, N.; Sulaiman, F.; Gerhauser, H. Characterisation of Oil Palm Empty Fruit Bunches for Fuel Application. J. Phys. Sci. 2011, 22, 1–24. [Google Scholar]
  63. Ramírez, N.; Silva, Á.; Garzón, E.; Yáñez, E. Caracterización y Manejo de Subproductos Del Beneficio Del Fruto de Palma de Aceite; Fedepalma: Bogotá, Columbia, 2011. [Google Scholar]
  64. Nalaya, P.; Wahid, S.; Izuan, H.E.M. Characterization of Empty Fruit Bunch Biochar Pyrolyzed at Different Temperatures with Respect to Activated Carbon and their Sorption Capacities for Pentachlorophenol. J. Water Environ. Technol. 2020, 18, 314–326. [Google Scholar] [CrossRef]
  65. Baharuddin, A.; Wakisaka, M.; Shirai, Y.; Abd-Aziz, S.; Abdul Rahman, N.; Hassan, M. Co-Composting of Empty Fruit Bunches and Partially Treated Palm Oil Mill Effluents in Pilot Scale. Int. J. Agric. Res. 2009, 4, 69–78. [Google Scholar] [CrossRef] [Green Version]
  66. Sukiran, M.A.; Abnisa, F.; Daud, W.M.A.W.; Abu Bakar, N.; Loh, S.K. A review of torrefaction of oil palm solid wastes for biofuel production. Energy Convers. Manag. 2017, 149, 101–120. [Google Scholar] [CrossRef]
  67. Loh, S.K. Oil Palm Biomass Energy Resource Data; Malaysian Palm Oil Board: Bandar Baru Bangi, Malaysia, 2012.
  68. Loh, S.K.; Choo, Y.M. Prospect, challenges and opportunities on biofuels in Malaysia. In Advances in Biofuels; Pokagu, R., Sarbatly, H., Eds.; Springer: Boston, MA, USA, 2013; pp. 3–14. [Google Scholar]
  69. Sundram, S. The effect of Trichoderma in surface mulches supplemented with conidial drenches in the disease development of Ganoderma Basal Stem Rot in oil palm. J. Oil Palm. Res. 2013, 25, 314–339. [Google Scholar]
  70. Yin, C.; Kadir, S.A.S.A.; Lim, Y.P.; Syed-Ariffin, S.N.; Zamzuri, Z. An investigation into physicochemical characteristics of ash produced from combustion of oil palm biomass waste in a boiler. Fuel Process. Technol. 2008, 89, 693–696. [Google Scholar] [CrossRef]
  71. Poh, P.E.; Yong, W.; Chong, M.F. Palm oil mill effluent (POME) characteristics in high crop season and the applicability of high-rate anaerobic bioreactors for the treatment of POME. Ind. Eng. Chem. Res. 2010, 49, 11732–11740. [Google Scholar] [CrossRef]
  72. Ma, A.N.; Ong, A.S.H. Pollution Control in Palm Oil Mills in Malaysia. J. Am. Oil Chem. Soc. 1985, 62, 261–266. [Google Scholar] [CrossRef]
  73. Ahmad, A.L.; Ismail, S.; Bhatia, S. Water Recycling from Palm Oil Mill Effluent (POME) Using Membrane Technology. Desalination 2003, 157, 87–95. [Google Scholar] [CrossRef]
  74. Oswal, N.; Sarma, P.M.; Zinjarde, S.S.; Pant, A. Palm oil mill effluent treatment by a tropical marine yeast. Bioresour. Technol. 2002, 85, 35–37. [Google Scholar] [CrossRef]
  75. Choorit, W.; Wisarnwan, P. Effect of Temperature on the Anaerobic Digestion of Palm Oil Mill Effluent. Electron. J. Biotechnol. 2007, 10, 376–386. [Google Scholar] [CrossRef] [Green Version]
  76. García, J.M. Estado actual del manejo de efluentes en Colombia. Rev. Palmas 1993, 14, 141–148. [Google Scholar]
  77. Kabongo, J.D. Waste Valorization. In Encyclopedia of Corporate Social Responsibility; Idowu, S.O., Capaldi, N., Zu, L., Gupta, A.D., Eds.; Springer: Berlin/Heidelberg, Germany, 2013. [Google Scholar]
  78. Nzihou, A.; Lifset, R. Waste Valorization, Loop-Closing, and Industrial Ecology. J. Ind. Ecol. 2010, 14, 196–199. [Google Scholar] [CrossRef]
  79. Fokam, C.; Toumi, E.; Kenmeugne, B.; Wiryikfu, N.; Mevaa, L. Experimental study of the addition of oil palm mesocarp fiber on the physical and mechanical properties of fiber cement mortar composites. SN Appl. Sci. 2021, 3, 85. [Google Scholar] [CrossRef]
  80. Quayson, E.; Amoah, J.; Rachmadona, N.; Morita, K.; Darkwah, L.; Hama, S.; Yoshida, A.; Kondo, A.; Ogino, C. Valorization of palm biomass waste into carbon matrices for the immobilization of recombinant Fusarium heterosporum lipase towards palm biodiesel synthesis. Biomas Bioenergy 2020, 142, 9. [Google Scholar] [CrossRef]
  81. Aprianti, N.; Faizal, M.; Said, M.; Nasir, S. Valorization of Palm Empty Fruit Bunch Waste for Syngas Production Through Gasification. J. Ecol. Eng. 2020, 21, 17–26. [Google Scholar] [CrossRef]
  82. Foong, S.Y.; Liew, R.K.; Yang, Y.; Cheng, Y.W.; Yuh, P.N.; Wan, W.A.; Yi, X.; Sean, C.; Vo, D.N.; Le, Q.V.; et al. Valorization of biomass waste to engineered activated biochar by microwave pyrolysis: Progress, challenges, and future directions. Chem. Eng. J. 2020, 398, 124401. [Google Scholar] [CrossRef]
  83. Gallego, L.J.; Cardona, S.; Martínez, E.; Rios, L.A. Valorization of Palm-Oil Residues: Integrated Production of a Good Quality Bio-coal and Electricity via Torrefaction. Waste Biomass Valorization 2020, 11, 2273–2284. [Google Scholar] [CrossRef]
  84. Hau, L.; Shamsuddin, R.; Mai, A.K.A.; Saenong, A.; Lazim, A.M.; Narasimha, M.; Low, A. Mixed Composting of Palm Oil Empty Fruit Bunch (EFB) and Palm Oil Mill Effluent (POME) with Various Organics: An Analysis on Final Macronutrient Content and Physical Properties. Waste Biomass Valorization 2020, 11, 5539–5548. [Google Scholar] [CrossRef]
  85. Prasetyo, I.; Mukti, N.I.; Cahyono, R.; Prasetya, A.; Ariyanyo, T. Nanoporous Carbon Prepared from Palm Kernel Shell for CO2/CH4 Separation. Waste Biomass Valorization 2020, 11, 5599–5606. [Google Scholar] [CrossRef]
  86. Intasit, R.; Cheirsilp, B.; Louhasakul, Y.; Boonsawang, P.; Chaiprapat, S.; Yeesang, J. Valorization of Palm Biomass Wastes for Biodiesel Feedstock and Clean Solid Biofuel through Non-sterile Repeated Solid-State Fermentation. Bioresour. Technol. 2019, 298, 122551. [Google Scholar] [CrossRef] [PubMed]
  87. Lemus, E. Determinación del efecto ambiental y agronómico en el suelo y aguas de nivel freático por la aplicación de efluentes tratados, en sistemas de fertirrigación en cultivos de palma de aceite. In Proceedings of the XV Reunión Técnica Nacional de Palma de Aceite, Bucaramanga, Columbia, 25–27 September 2019; p. 22. [Google Scholar]
  88. Lam, S.S.; Tsang, Y.F.; Yek, P.N.Y.; Liew, R.K.; Osman, M.; Peng, W.; Lee, W.H.; Park, Y.-K. Co-processing of oil palm waste and waste oil via microwave co-torrefaction: A waste reduction approach for producing solid fuel product with improved properties. Process Saf. Environ. Prot. 2019, 128, 30–35. [Google Scholar] [CrossRef]
  89. Vasu, H.; Wong, C.; Vijiaretnam, N.; Chong, Y.; Thangalazhy-Gopakumar, S.; Gan, S.; Lee, L.; Ng, H. Insight into Co-pyrolysis of Palm Kernel Shell (PKS) with Palm Oil Sludge (POS): Effect on Bio-oil Yield and Properties. Waste Biomass Valorization 2019, 11, 5877–5889. [Google Scholar] [CrossRef]
  90. Sinjaroonsak, S.; Chaiyaso, T.; Aran, H. Optimization of Cellulase and Xylanase Productions by Streptomyces thermocoprophilus TC13W Using Low Cost Pretreated Oil Palm Empty Fruit Bunch. Waste Biomass Valorization 2019, 189, 76–86. [Google Scholar] [CrossRef]
  91. Chin, K.L.; Nurliyana, M.Y.; H’ng, P.S.; Lee, C.L.; Go, W.Z.; Khoo, P.S.; Raja, R.A.; Ashikin, S.N. Effects of Bacterial Bio-augmentation on the Methane Potential from Facultative Digestion of Palm Oil Mill Effluent and Empty Fruit Bunch. Waste Biomass Valorization 2019, 11, 3407–3418. [Google Scholar] [CrossRef]
  92. Burimsitthigul, T.; Tirapanichayakul, C.; Chantrangsuwan, P.; Prasassarakich, P. Two-Stage Liquefaction of Oil Palm Shell in Alkali Supercritical Ethanol–Water for Enhanced Bio-Oil Production. Waste Biomass Valorization 2019, 11, 2745–2754. [Google Scholar] [CrossRef]
  93. Dias, Y.; Souza, E.; da Costa, H.S.; Azevedo, L.C.; Penido, E.; do Amarante, C.; Marques, O.M.; Rodrigues, A. Biochar produced from Amazonian agro-industrial wastes: Properties and adsorbent potential of Cd2+ and Cu2+. Biochar 2019, 1, 389–400. [Google Scholar] [CrossRef] [Green Version]
  94. Shanmugarajah, B.; Chew, I.M.; Mubarak, N.M.; Choong, T.S.; Yoo, C.; Tan, K. Valorization of palm oil agro-waste into cellulose biosorbents for highly effective textile effluent remediation. J. Clean. Prod. 2018, 210, 697–709. [Google Scholar] [CrossRef]
  95. Zulkarnain, A.; Bahrin, E.; Ramli, N.; Phang, L.; Abd-Aziz, S. Alkaline Hydrolysate of Oil Palm Empty Fruit Bunch as Potential Substrate for Biovanillin Production via Two-Step Bioconversion. Waste Biomass Valorization 2018, 9, 13–23. [Google Scholar] [CrossRef]
  96. Liew, R.K.; Nam, W.L.; Chong, M.Y.; Phang, X.Y.; Su, M.H.; Yek, P.N.Y.; Ma, N.L.; Cheng, C.K.; Chong, C.T.; Lam, S.S. Oil palm waste: An abundant and promising feedstock for microwave pyrolysis conversion into good quality biochar with potential multi-applications. Process Saf. Environ. Prot. 2018, 115, 57–69. [Google Scholar] [CrossRef]
  97. Ahmad, A.F.; Abbas, Z.; Obaiys, S.J.; Zainuddin, M.F. Effect of Untreated Fiber Loading on the Thermal, Mechanical, Dielectric, and Microwave Absorption Properties of Polycaprolactone Reinforced with Oil Palm Empty Fruit Bunch Biocomposites. Polym. Compos. 2018, 39, 1778–1787. [Google Scholar] [CrossRef]
  98. Bukhari, N.; Loh, S.; Nasrin, A.; Jahim, J. Enzymatic Hydrolysate of Palm Oil Mill Effluent as Potential Substrate for Bioflocculant BM-8 Production. Waste Biomass Valorization 2018, 11, 17–29. [Google Scholar] [CrossRef]
  99. Cheah, W.; Show, P.; Juan, J.; Chang, J.; Ling, T. Waste to energy: The effects of Pseudomonas sp. on Chlorella sorokiniana biomass and lipid productions in palm oil mill effluent. Clean Technol. Environ. Policy 2018, 20, 2037–2045. [Google Scholar] [CrossRef]
  100. Misnon, I.I.; Mohd, N.K.; Jose, R. Conversion of Oil Palm Kernel Shell Biomass to Activated Carbon for Supercapacitor Electrode Application. Waste Biomass Valorization 2018, 10, 1731–1740. [Google Scholar] [CrossRef]
  101. Yoo, H.M.; Seo, Y.C.; Park, S.W.; Kang, J.J.; Choi, H.S.; Oh, C.H. Removal Effect of Ash and Metallic Species by Washing from Empty Fruit Bunch Byproducts in Palm Mills on Pyrolytic Characteristics to Produce Bio-Crude Oil. Waste Biomass Valorization 2017, 9, 491–502. [Google Scholar] [CrossRef]
  102. Ong, S.; Mo, K.; Alengaram, U.; Jumaat, M.; Ling, T. Valorization of Wastes from Power Plant, Steel-Making and Palm Oil Industries as Partial Sand Substitute in Concrete. Waste Biomass Valorization 2017, 9, 1645–1654. [Google Scholar] [CrossRef]
  103. Kamsani, N.; Salleh, M.M.; Basri, S.A.; Mohamad, S.E.; Aziz, S.A.; Kamaruddin, K. Effects of Surfactant on the Enzymatic Degradation of Oil Palm Empty Fruit Bunch (OPEFB). Waste Biomass Valorization 2017, 9, 845–852. [Google Scholar] [CrossRef]
  104. Idris, N.A.; Loh, S.K.; Lau, H.L.N.; Mustafa, E.M.; Vello, V.; Tan, C.; Phang, S. Cultivation of microalgae in medium containing palm oil mill effluent and its conversion into biofuel. J. Oil Palm. Res. 2017, 29, 291–299. [Google Scholar] [CrossRef]
  105. Thinagaran, L.; Sudesh, K. Evaluation of Sludge Palm Oil as Feedstock and Development of Efficient Method for its Utilization to Produce Polyhydroxyalkanoate. Waste Biomass Valorization 2017, 10, 709–720. [Google Scholar] [CrossRef]
  106. Junpadit, P.; Suksaroj, T.; Boonsawang, P. Transformation of Palm Oil Mill Effluent to Terpolymer Polyhydroxyalkanoate and Biodiesel Using Rummeliibacillus pycnus Strain TS8. Waste Biomass Valorization 2017, 8, 1247–1256. [Google Scholar] [CrossRef]
  107. Agudelo, B.S.; Rodriguez, D.F.; Rodriguez, A.T. Elaboración de Bloques Estructurales en Mortero Adicionado con Ceniza de Cuesco de la Palma de Aceite Africana, Para la Ciudad de Villavicencio (Meta); Universidad Cooperativa de Colombia: Bogotá, Colombia, 2016. [Google Scholar]
  108. Lim, S.L.; Wu, T.Y. Characterization of matured vermicompost derived from valorization of palm oil mill by-product. J. Agric. Food Chem. 2016, 64, 1761–1769. [Google Scholar] [CrossRef] [PubMed]
  109. Silveira, E.A.; Tardioli, P.W.; Farinas, C.S. Valorization of Palm Oil Industrial Waste as Feedstock for Lipase Production. Biochem Biotechnol 2016, 179, 558–571. [Google Scholar] [CrossRef] [PubMed]
  110. Tsouko, E.; Kachrimanidou, V.; dos Santos, A.; do Nascimento Vitorino Lima, M.; Machado de Castro, A.; Guimarães, D.M.; Koutinas, A. Valorization of By-Products from Palm Oil Mills for the Production of Generic Fermentation Media for Microbial Oil Synthesis. Appl. Microbiol. Biotechnol. 2016, 181, 1241–1256. [Google Scholar] [CrossRef] [PubMed]
  111. Fatriasari, W.; Anita, S.; Risanto, L. Microwave Assisted Acid Pretreatment of Oil Palm Empty Fruit Bunches (EFB) to Enhance Its Fermentable Sugar Production. Waste Biomass Valorization 2016, 8, 379–391. [Google Scholar] [CrossRef]
  112. Nyakuma, B.B. Bioelectricity potential of oil palm waste in Malaysia. In Proceedings of the 3rd International Conference Research & Education in Natural Sciences (HERTSPO 2015); Shkodra BENA: Shkodër, Albania, 2015; p. 6. [Google Scholar]
  113. Louhasakul, Y.; Cheirsilp, B.; Prasertan, P. Valorization of Palm Oil Mill Effluent into Lipid and Cell-Bound Lipase by Marine Yeast Yarrowia lipolytica and Their Application in Biodiesel Production. Waste Biomass Valorization 2015, 7, 417–426. [Google Scholar] [CrossRef]
  114. Neoh, C.; Lam, C.; Yahya, A.; Ware, I.; Ibrahim, Z. Utilization of Agro Industrial Residues from Palm Oil Industry for Production of Lignocellulolytic Enzymes by Curvularia clavata. Waste Biomass Valorization 2015, 6, 385–390. [Google Scholar] [CrossRef] [Green Version]
  115. Iwuagwu, J.; Ugwuanyi, J. Treatment and Valorization of Palm Oil Mill Effluent through Production of Food Grade Yeast Biomass. J. Waste Manag. 2014, 2015, 439071. [Google Scholar] [CrossRef] [Green Version]
  116. Ishola, M.M.; Taherzadeh, M.J. Effect of fungal and phosphoric acid pretreatment on ethanol production from oil palm empty fruit bunches (OPEFB). Bioresour. Technol. 2014, 165, 9–12. [Google Scholar] [CrossRef]
  117. Nazir, M.; Wahjoedi, B.; Yussoff, A.W.; Abdullah, M.A. Eco-friendly extraction and characterization of cellulose from Oil palm Empty Fruit Bunches. Bioresour. Technol. 2013, 8, 2161–2172. [Google Scholar] [CrossRef] [Green Version]
  118. Stemann, J.; Erlach, B.; Ziegler, F. Hydrothermal Carbonisation of Empty Palm Oil Fruit Bunches: Laboratory Trials, Plant Simulation, Carbon Avoidance, and Economic Feasibility. Waste Biomass Valorization 2013, 4, 441–454. [Google Scholar] [CrossRef]
  119. Salema, A.; Ani, F. Pyrolysis of oil palm empty fruit bunch biomass pellets using multimode microwave irradiation. Bioresour. Technol. 2012, 125, 102–107. [Google Scholar] [CrossRef] [PubMed]
  120. Nahrul, Z.; Astimar, A.; Anis, M.; Ibrahim, M.; Khalil, H.P.; Ibrahim, Z. Vermicomposting of empty fruit bunch with addition of palm oil mill efuent solid. J. Oil Palm Res. 2012, 24, 1542–1549. [Google Scholar]
  121. Mekhilef, S.; Saidur, R.; Safari, A.; Mustaffa, W.E.S.B. Biomass energy in Malaysia: Current state and prospects. Renew. Sustain. Energy Rev. 2011, 15, 3360–3370. [Google Scholar] [CrossRef]
  122. Moreno, J.E.; Martínez, L.A.; Belalcázar, L.C.; Rojas, N.Y. Corporate Carbon Footprint of a Palm Oil Mill. Tecciencia 2018, 13, 11–15. [Google Scholar] [CrossRef] [Green Version]
  123. Krishnan, Y.; Bong, C.P.C.; Azman, N.F.; Zakaria, Z.; Othman, N.; Abdullah, N.; Ho, C.S.; Lee, C.T.; Hansen, S.B.; Hara, H. Co-composting of palm empty fruit bunch and palm oil mill effluent: Microbial diversity and potential mitigation of greenhouse gas emission. J. Clean. Prod. 2017, 146, 94–100. [Google Scholar] [CrossRef]
  124. Andarani, P.; Nugraha, W.D. Widdya Energy balances and greenhouse gas emissions of crude palm oil production system in Indonesia (Case study: Mill P, PT X, Sumatera Island). Int. Conf. Chem. Chem. Process Eng. 2017, 1823, 020064. [Google Scholar] [CrossRef] [Green Version]
  125. Subramaniam, V.; Hashim, Z.; Loh, S.K.; Astimar, A.A. Assessing water footprint for the oil palm supply chain- a cradle to gate study. Agric. Water Manag. 2020, 237, 106184. [Google Scholar] [CrossRef]
  126. Rivera-Méndez, Y.; Rodríguez, D.; Romero, H. Carbon footprint of the production of oil palm (Elaeis guineensis) fresh fruit bunches in Colombia. J. Clean. Prod. 2017, 149, 743–750. [Google Scholar] [CrossRef]
  127. Stichnothe, H.; Schuchardt, F. Life cycle assessment of two palm oil production system. Biomass Bioenergy 2011, 35, 3976–3984. [Google Scholar] [CrossRef]
Figure 1. Diagram of the inputs and outputs of matter in the transformation process of 1 ton of RFF. Source: Adapted from Loh [39] and Abdulalla [34].
Processes 10 00903 g001
Figure 2. Concentration of exploitation approaches according to the type of waste and/or palm oil by-product.
Processes 10 00903 g002
Figure 3. Concentration of technological approaches for the valuation of palm oil waste and/or by-product.
Processes 10 00903 g003
Figure 4. Percentage or degree of the current use of palm oil residues and by-products in the agro-industries in the Casanare Department.
Processes 10 00903 g004
Figure 5. Comparison of the circular economy model under the current and potential scenarios of the reincorporation of palm oil waste and by-products in the Casanare Department.
Processes 10 00903 g005
Figure 6. Current and potential RRSFM indicator of the agro-industries of the Casanare Department under the Material Flows approach.
Processes 10 00903 g006
Figure 7. Estimation of the HCRRS indicator: CO2eq emissions of the moments diagnosed by the RRSFM indicator.
Processes 10 00903 g007
Table 1. Order of importance detected in relation to the valuation of palm oil residues and by-products worldwide in the database.
Google ScholarScienceDirectSpringerLink x ¯   Q   b   ΔQ c
PhaseDT fDD dQ eDD dQDDQ
1. DP gPalm oil waste and valorization13,4001 a122317801--
2. Leveraging ApproachBiofuel13,20098.576262.333743.268.1
Q3
Q4-Q3-Q2
Nutrient source12,50093.357847.336146.362.3
Q3
Q4-Q2-Q2
Enzyme activity10,50078.456746.434944.756.4
Q3
Q4-Q2-Q2
Construction833062.241133.620426.240.6
Q2
Q3-Q2-Q2
3. Technological approachTechnological15,1001109417341-
Chemical13,20087.4104795.769995.292.8
Q4
Q4-Q4-Q4
Physical14,50096.074568.148866.576.9
Q4
Q4-Q3-Q3
Biological10,20067.571865.642557.963.7
Q3
Q3-Q3-Q3
a (13,200/13,400) * 100 = 98.5; b Average of quartile; c Variation of the quartile according to the database; d Documents detected; e Citation frequency index; f Thematic descriptors; g Main descriptor.
Table 2. Matrix for the analysis of the RRSFM quantitative variables.
GTACApAtRRSFM
AgOSW aLW bAs cOSWLWAsOSWLWAsOSWLWAs
Ag1OSWt1LWt1Ast1OSWi1LWi1Asi1OSWj1LWj1Asj1OSWAt1LWAt1AsAt1Ʃ
Ag2OSWt2LWt2Ast2OSWi2LWi2Asi2OSWj2LWj2Asj2OSWAt2LWAt2AsAt2Ʃ
AgnOSWtnLWtnAstnOSWinLWinAsinOSWjnLWjnAsjnOSWAtnLWAtnAsAtnƩ
Note: a Organic Solid Waste (OSW) comprises EFB, fiber and husk. b Liquid waste (LW) refers to POME. c Ash (As).
Table 3. Order of importance detected in relation to the carbon footprint in waste and by-products of the transformation of RFF worldwide in the databases.
Google ScholarScienceDirectSpringerLink x ¯   Q ΔQ
PhaseDTDDQDDQDDQ
1. DPCarbon Footprint and Mill palm oil17,0001118415331--
2. Waste and by-productsEFB742043.6513711.57Four. Five8.4421.2Q2-Q1-Q1
Fiber597035.1274562.9229154.6050.9Q3-Q2-Q2
Shell436025.6552344.1718735.0835.0Q2-Q2-Q2
POME16,20095.2918415.545710.6940.5Q4-Q1-Q1
Table 4. Quantification of the Reference Values (VRE) of waste and by-products derived from processing one ton of RFF.
Waste/By-ProductEFBFiberHuskAshPOMEMethane
Author (VRE)
Singh et al. [41] and Lik et al. [42] 23%15%7%---
Abdullah and Sulaiman [34] 22%13.50%5.50%-67%-
Abdullah and Sulaiman [34] *14.60%15.40%10.40%-6.30%-
Loh [39] 22%13.50%5.50%-67%-
Loh [39] *35%60%8.50%4.60%--
Vijaya et al. [43] 22%8–16%9–22%2%58.20%10.57 m3
Yusoff [44] 22%13.50%5.50%-67%-
Zinatizadeh [45] 28.50%30%6%0.50%53.51%-
Zinatizadeh [45] * 14%6%0.50%53.51%-
Kong et al. [46] 22–23%13.5–15%5.5–7%---
Ali. et al. [47] 23%15.70%--70%-
Huailuek et al. [48] 21%12.46%3.95%-58%-
Stichonothe et al. [49] 23%13%5.50%-86%-
Foo and Hameed [37] 23%14–15%6–7%---
Embandiri [50]24%14%6%0.42%63%-
Abas et al. [51] 23%13%5%-60%-
Cenipalma [52] , Bernal [53] and Silva [54] 17.7–26.1%11.6–15%5–7%-70–80%-
Garcia et al. [55] and Ramirez [56] 20%13%5%0.53%69%-
Average23.04%16.77%6.41%1.43%61.18%10.57 m3
Variance3.76%11.23%1.87%1.67%17.92%-
* Dry weight.
Table 5. Quantification of Values provided by the Agro-industries of the Casanare Department (VAC) of the waste and by-products derived from processing one ton of RFF.
Waste/By-ProductEFBFiberHuskAshPOMEMethane
Agribusiness (VAC)
A19–23%13–17%7%0.80%80%-
B21–22%15%6%0.50%67%-
C19–25%15%6.40%0.43%63%-
D23%16%5%0.50%72%-
E20–24%14–18%5–7%-75%-
F22%16%5.80%0.50%60%-
Average22.48%15.58%6.03%0.55%69.50%-
Variance0.80%0.49%0.66%0.15%7.56%-
Table 6. Chemical and physical composition of the waste and by-products generated in the transformation phase of the RFF.
Waste and By-ProductsEFBFiberHuskAshPOMEAuthor
Chemical Composition
Carbon45.9 (%)45.2 (%)49.70 (%)59,583 (%)40.17 (%)Abdullah et al. [62]; Loh [39]; Nalaya et al. [64]
Hydrogen5.70 (%)5.50 (%)5.70 (%)1181 (%)5.81 (%)Abdullah et al. [62]; Loh [39]
Nitrogen0.8 (%)1.10 (%)0.40 (%)0.088 (%)5.26 (%)Abdullah et al. [62]; Loh [39]
Total nitrogen----750 mg/LAbdullah et al. [62]; Singh et al. [41]; Baharuddin et al. [65]
Sulfur0.2 mg/L0.23 mg/L0.19 mg/L--Abdullah et al. [62]; Loh [39]
Oxygen36.7 mg/L--0.981 ± 0.42 (%)-Abdullah et al. [62]; Loh [39]
Potassium2.24 mg/L1.48 mg/L2.20 mg/L26.3–41.0 g/kg22,700 mg/LSingh et al. [41]; Baharuddin et al. [65]; Vijaya et al. [57]; Tay [40]; Loh [39]
Magnesium0.6 ± 0.2 (%)0.49 mg/L0.24 mg/L20.3–22 g/kg615 mg/LSingh et al. [41]; Baharuddin et al. [65]; Vijaya et al. [57]; Tay [40]
Zinc16.6 ± (2.6 mg kg−1)--0.1–0.3 g/kg2.3 mg/LSingh et al. [41]; Baharuddin et al. [65]; Vijaya et al. [57]; Tay [40]
Phosphorus0.6 ± 0.1 (%)0.12 mg/L0.07 mg/L-180 mg/LBaharuddin et al. [65]; Vijaya et al. [57]
Lignin35.3 (%)27.7 (%)50.7 (%)--Sukiran et al. [66]
Hemicellulose35.3 (%)26.1 (%)22.7 (%)--Sukiran et al. [66]
Calorific value (MJ/kg)18–19.9218.8–19.5819.5–20.75-16.1–17.65Soh [58]; Abdullah et al. [62]; Singh et al. [41]; Loh [67]; Loh and Choo [68]
Moisture content (%)66–6935–48--90–95Soh [58]; Abdullah et al. [62]; Singh et al. [41] ; Loh [67]; Loh and Choo [68]
Ash content (%)4.66.13-15.2Soh [58]; Abdullah et al. [62]; Singh et al. [41]; Loh [67]; Loh and Choo [68]
Volatile matter content (%)8784.983.4-77.7Soh [58]; Abdullah et al. [62]; Singh et al. [41]; Loh [67]; Loh and Choo [68]
Biochemical Oxygen Demand----25,000 mg/LSingh et al. [41]; Baharuddin et al. [65]; Poh et al. [14]
Chemical Oxygen Demand----50,000 mg/LSingh et al. [41]; Baharuddin et al. [65]; Poh et al. [14]
Total solids----40,500 mg/LSingh et al. [41]; Baharuddin et al. [65]; Poh et al. [14]
pH6.7 ± 0.2--9.35–9.704.7Singh et al. [41]; Baharuddin et al. [65]; Poh et al. [14]; Tay [40]
Fat and oil----4000 mg/LSingh et al. [41]; Baharuddin et al. [65]; Poh et al. [14]
Note: % This value can also be determined by the difference between the content of C, H, N and S (in%) and the total of 100%, in dry weight.
Table 7. Comparison of the physical and chemical composition of the POME from the Casanare Department’s agro-industries with the theoretical references.
ParameterTemperaturepH aFlow RateBOD5 dCOD eSVT fNKT gGA k
Unit°C-m3/hmg/Lmg/Lmg/Lmg/Lmg/L
Agribusiness A h53–614.3–4.418.831,28764,24225,4525907680
Agribusiness B h584.457.233,25067,80024,5825907500
Agro-industry C h-4.3-33,45866,57024,5005457770
Agro-industry D i51–624.428–3836,45857,50019,2004806800
Agribusiness E h544.43229,50059,70018,5004906850
Agribusiness F i-4.4-35,40064,50024,2005807650
Average56.54.422.833,225.563,385.322,739.0545.87375.0
Standard deviation1.70.112.22564.03995.73049.150.0435.1
Reference authors
Poh et al. [71] b45.8–62.14.4–4.57.8–25.412,520–42,63027,840–85,26712,000–47,667230–7802500–16,100
Poh et al. [71] c54–66.54.18–4.75.4–65.032,100–56,70067,900–87,30041,180–47,060525–135011,004–15,880
Ma and Ong [72]80–904.5-25,000---8000
Ahmad et al. [73]-4.7-25,00050,000--4000
Oswal et al. [74]-5-11,000246,000---
Choorit and Wisarnwan [75]-4.4-65,714102,69672,05813819341
García [76] j535.25-38,64747,66759,970-15,492
Singh et al. [41]-4.7-25,00050,00034,0007504000
Average63.054.6825.9032,792.0090,073.7947,996.30893.389082.14
Standard deviation14.980.3013.1516,635.3371,602.6817,770.37370.194340.44
Note: a No units for pH; b low harvest season; c peak harvest season; d Biochemical Oxygen Demand; e Chemical Oxygen Demand; f Total volatile solids; g Total Kjeldahl Nitrogen; h The values supported by agro-industries correspond to the 2019 period; i The values supported by agro-industries correspond to the 2020 period; j Plant reference values in the eastern zone of Colombia; k Fats and oils.
Table 8. Concentrations of key trends for the valuation of residues and by-products of the palm oil processing plant.
Geographical Area aLeverage Approach bTechnological Focus cWaste and/or By-Product d
AuthorA.MEUASAFDLNSEABFCSOIPQFFPBEFBFICACEPOME
Fokam et al. [79] x x x x
Quayson et al. [80] x x x x x
Aprianti et al. [81] x x x x
Foong et al. [82] xx x x xxx
Gallego et al. [83]x x x x
Hau et al. [84] x x xx xx
Prasetyo et al. [85] x x x x
Intasit et al. [86] x xx x x
Lemus [87]x x x x
Lam et al. [88] x x x x
Vasu et al. [89] x x x x x
Sinjaroonsak et al. [90] x x x xx
Chin et al. [91] x x xx x
Burimsitthigul et al. [92] x x x x x
Dias et al. [93]x x x x xx
Quintero and Torres [36]x x x xxx
Shanmugarajah et al. [94] x xx x
Zulkarnain et al. [95] x x x xx
Liew et al. [96] x x x xxxx
Ahmad et al. [97] x x x x
Bukhari et al. [98] x xx x x x
Cheah et al. [99] x x xx x x
Misnon et al. [100] x x xxx x
Sukira et al. [66] xx x x xxxx
Yoo et al. [101] x x x x
Ong et al. [102] x x x x
Kamsani et al. [103] x x x xx
Idris et al. [104] x x x x
Thinagaran and Sudesh [105] x xx x x
Junpadit et al. [106] x x x x x
Agudelo et al. [107]x x x xx
Lim and Wu [108] x x xx x
Silveira et al. [109]x x x x
Tsouko et al. [110]x xx x x xx
Fatriasari et al. [111] x x x x
Nyakuma [112] x x x xxx
Louhasakul et al. [113] x xx x x
Neoh et al. [114] x x xx x
Iwuagwu and Ugwuanyi [115] x x x x x
Ishola et al. [116] x x x xx
Nazir et al. [117] x x xx x
Stemann et al. [118] x x x x x
Salema & Ani [119] x x x x
Nahrul et al. [120] x x xx x
Average0.1600.730.070.050.270.340.390.140.090.390.50.430.570.20.30.140.32
Standard deviation0.3700.450.250.210.450.480.490.350.290.490.510.50.50.410.460.350.47
Note. a AM = America; EU = Europe; AS = Asia; AF = Africa; DL = Different places. b NS = Source of nutrients; EA = Enzyme activity; BF = Biofuel; CS = Construction; OI = Other interests. c PQ = Chemical process; PF = Physical processes; PB = Biological process. d EFB = Empty Fruit Bunches; FI = Fiber; CA = Husk; CE = Ash; POME = Residual effluent from ground plant (includes sludge).
Table 9. Total generation (Gt), current use (Ac), potential use (Ap) of palm oil residues and by-products in the Casanare Department by agribusiness or processing plant.
Total Generation (Gt)Current Use (Ac)
OSW GtAs GtLW GtOSW AcAs AcLW Ac
Cod Agro-IndustryFactorEFB (t)Fiber (t)Husk (t)Ash (t)POME (m3)EFB (t)Fiber (t)Husk (t)Ash (t)POME (m3)
Agribusiness A0.04300.87208.5280.707.36930.1875.22104.2640.355.890.00
Agribusiness B0.181353.91938.34363.1733.134185.801083.13750.67290.5423.192511.48
Agribusiness C0.171278.69886.21343.0031.293953.261150.82708.97274.4031.293162.61
Agribusiness D0.08601.74417.04161.4114.721860.36361.04396.19153.3413.251172.02
Agribusiness E0.1752.17521.30201.7618.402325.45488.91479.60185.6216.561627.81
Agribusiness F0.03225.65156.3960.535.52697.63135.39109.4742.372.760.00
Agribusiness G0.151128.26781.95302.6427.603488.17789.78742.85287.5122.082092.90
Agribusiness H0.251880.431303.25504.4146.015813.611316.301238.09479.1836.813488.17
Total17521.735213.012017.62184.0323,254.455400.604530.111753.31151.8214,054.99
Potential Use (Ap)RRSFM IndicatorStandardization
(Scaling)
OSW ApAs ApLW Ap
Cod Agro-IndustryFactorEFB (t)Fiber (t)Husk (t)Ash (t)POME (m3)
Agribusiness A0.04210.61104.2640.350.88697.634.620.924
Agribusiness B0.18270.78187.6772.639.941674.3251
Agribusiness C0.17127.87177.2468.600.00790.6551
Agribusiness D0.08240.7020.858.071.47558.114.930.986
Agribusiness E0.1263.2641.7016.141.84697.6351
Agribusiness F0.0381.2346.9218.162.76523.234.710.942
Agribusiness G0.15338.4839.1015.135.521395.2751
Agribusiness H0.25564.1365.1625.229.202325.4551
Total12097.06682.90264.3131.628662.28--
Table 10. Palm oil waste and by-product emission factors according to the type of alternative or disposal.
Waste and By-Productkg CO2 eq/t RFF akgCO2/kg EFBkgCO2/kg Husk + FiberkgCO2/m3 POMEAlternative or Disposal
EFB2301026--Open sky
EFB1083.864838--Incinerated (not energy in boilers)
POME140--0.2014Open sky
EFB + POME0.02312.51 × 10−5--Biochar
EFB + POME1100.119--Composting
Fiber + Husk941.94-4358-Incineration (energy in boiler)
a Adapted from Moreno et al. [122], Krishnan et al. [123], Andarini et al. [124], Subramaniam et al. [125], Rivera-Méndez et al. [126] and Stichnothe and Schuchard [127].
Publisher’s Note: MDPI stays neutral with regard to jurisdictional claims in published maps and institutional affiliations.

