Article

Risk Classification of Shale Gas Gathering and Transportation Pipelines Running through High Consequence Areas

1
School of Safety Engineering, Chongqing University of Science and Technology, Chongqing 401331, China
2
Chongqing Gas District, PetroChina Southwest Oil and Gasfield Company, Chongqing 400021, China
3
School of Chemical Engineering, Anhui University of Science and Technology (AUST), Huainan 232001, China
*
Authors to whom correspondence should be addressed.
Submission received: 12 April 2022 / Revised: 4 May 2022 / Accepted: 4 May 2022 / Published: 6 May 2022

Abstract

:
Shale gas gathering and transportation pipeline poses significant risk due to special geographical conditions and different climatic conditions in high consequence areas such as Sichuan and Chongqing. The risks become critical as gas pipelines run through high consequence areas such as hospital, market, and scenic areas. This study presents a risk classification method for the pipelines running through high consequence areas. The proposed method considers different failure scenarios including third-party damage, corrosion, design and construction defects, mis-operation, and natural disasters. The method uses subjective and objective data from different sources. To minimize the subjectivity and data uncertainty, an improved fuzzy analytic hierarchy process was used to process data. The estimated risk is used to classify different risk zones. After the failure of shale gas pipelines in HCAs, in order to reduce the adverse impact of emergencies, personnel should immediately organize an evacuation to a safe area, focusing on the diagnosis and analysis of risk factors that are more likely to lead to pipeline leakage. The developed classes are verified using field data. The study observes that risk levels classified using the proposed method provide realistic assessments of hazard zoning. Risk zoning will help develop effective risk management strategies.

1. Introduction

China has a high accident rate in oil and gas pipelines compared to European and American countries. According to statistics, there have been over 1000 pipeline safety accidents since 1995 [1]. The pipeline accidents in High Consequence Areas (HCAs) will have severe impact. The pipeline is considered as main mode of transportation. As per 2017 data, oil and gas pipelines reached 133,100 km in China [2]. Adding each kilometer of pipeline increases potential risks, thus a detailed methodology to analyze and characterize the risk of potential pipeline accidents is needed more importantly in high consequence areas.
HCAs are classified based on geographical conditions, population, quality of pipeline ontology, and other factors. The United States was one of the first countries to study HCAs in terms of development [3]. In 1988, Onisawa first proposed to transform Fuzzy Possibility Score (FPS) into Fuzzy Possibility (FP) in order to calculate pipeline risks in HCAs [4]. In 2016, Lam and Zhou studied the distribution of pipeline accidents in the United States based on database, including installation year, regional grade, failure cause, and other parameters, and their research laid a foundation for the quantitative risk assessment of pipeline HCAs [5]. Compared with foreign countries, domestic research on HCAs started late, but it also has made some achievements. In 2010, Zhang Peng et al. proposed a multi-hierarchy grey relational analysis method for oil and gas pipelines for the first time; however, they did not specifically point out HCAs [6]. In 2015, Wang Xiaolin et al. proposed to divide HCAs into three types for the first time [7], namely population density, important facilities, and environmental sensitivity. In recent years, a quantitative evaluation model and scoring index for classification of HCAs were developed. These method attributes include distance, vulnerability of the region, ecological sensitivity, population density, and the number of other sensitive receptors. In 2014, Dong Shaohua et al. conducted a systematic study on upgrading regional grades in China. They started from pipeline risks and learned from the laws and regulations on upgrade management for foreign pipeline companies and proposed measures to be taken after upgrading. However, there was no specific study on upgrade management and risk assessment methods of pipeline regional grades [8]. In 2016, Shan Ke and Shuai Jian applied three-stage process evaluation methods to the upgraded gas transmission pipeline in the region and put forward the risk management measures for regional upgraded gas transmission pipelines from two aspects, including technical transformation and regular maintenance [9]. In 2017, Yao Anlin et al. formulated corresponding management procedures for gas pipelines with different risk levels in combination with the regional grade change conditions of gas transmission pipelines. They established a risk assessment model for natural gas pipelines in upgraded areas. According to the possibility of upgrading gas pipelines, relevant principles for risk control were proposed [10]. Based on relevant domestic research, the study of HCAs has lagged behind that of foreign countries for at least ten years. The formulation of relevant standard and specifications mostly refers to the foreign standard system, which is inconsistent with the domestic current situation, the adoption rate of standards is low, and there are deviations in the actual application process. The above problems have become the key factors restricting pipeline integrity management in China. Therefore, for research on HCAs of shale gas gathering and transmission pipeline, hierarchical management should be carried out under the guidance of national and enterprise standards and specifications combined with regional current situation and geographical characteristics, which are very important for a unified management of HCAs and pipeline integrity management.
China is focusing on the identification and classification of HCAs areas. As a new generation of gas reservoirs is used, there are limited studies on shale gas pipelines running through HCAs. The shale gas gathering and transportation pipelines are prone to accidents due to their complex operation and severe operating conditions. This study presents a risk classification method for the pipelines running through high consequence areas. The study will help risk management and pipeline integrity management in HCAs.

2. Materials and Methodology

An improved fuzzy analytic hierarchy process (IFAHP) introduces the weight coefficient and triangular fuzzy number of experts and extends Analytic Hierarchy Processes (AHP) to the field of group decision-making and fuzzy decision making. The calculation process of IFAHP includes three parts. It establishes the evaluation index set and then determines each index weight to obtain the comprehensive weight. Finally, a fuzzy comprehensive evaluation of pipeline risk grades in HCAs is performed. The specific process of HCAs classification is shown in Figure 1.
(1)
HCAs identification: determine the pipelines running through HCAs to be analyzed;
(2)
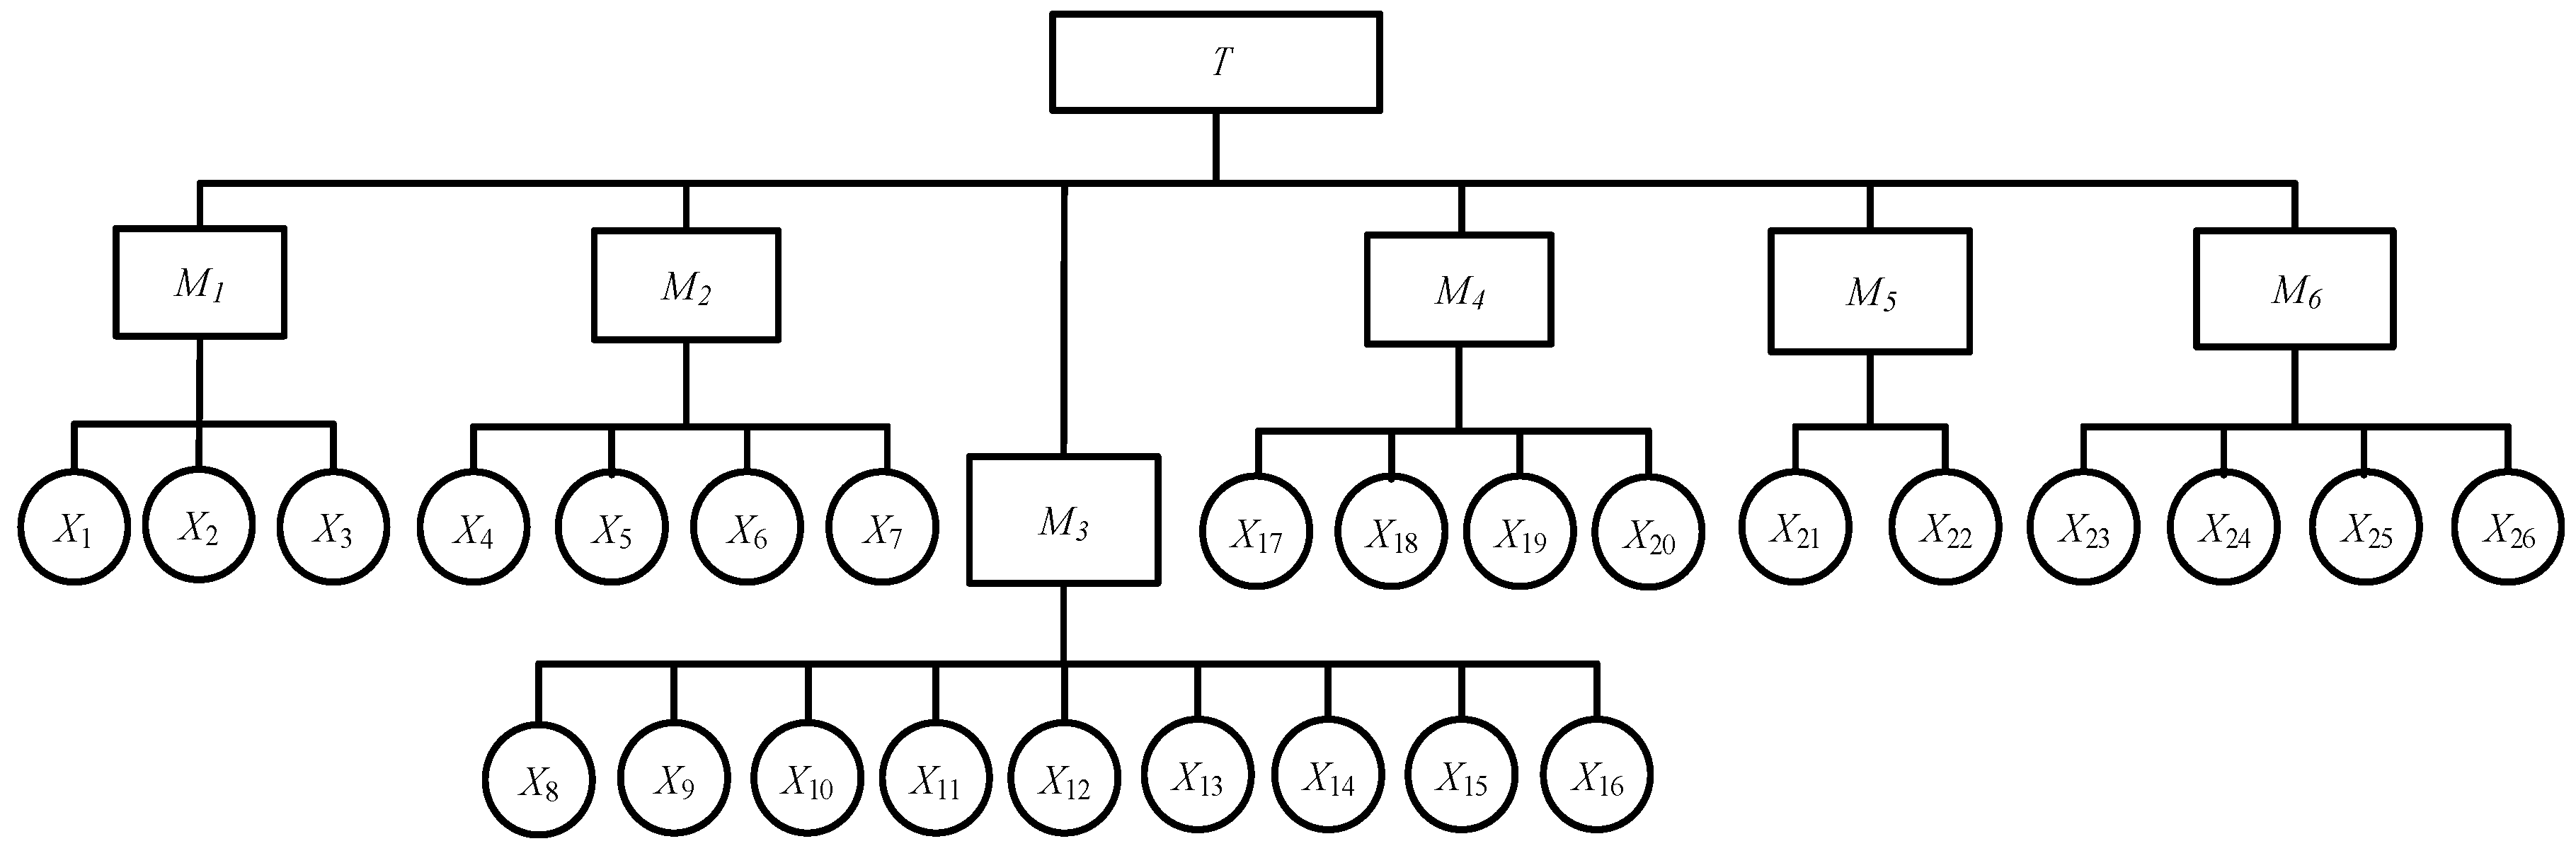
Establish pipelines failure index system: identify different failure scenarios of shale gas gathering and transmission pipelines and record the hierarchical relationship between each failure factor;
(3)
Single factor analysis: according to the secondary index of shale gas pipeline failure factors in HCAs and the principle of failure probability scoring, determine the membership degree of each single factor;
(4)
Determine index objective weight: combine with expert scoring and transform the failure model of shale gas pipelines into Bayesian network. Minimize subjectivity and data uncertainty;
(5)
Fuzzy comprehensive evaluation of HCAs: according to the weight of each index obtained in the above steps to determine the comprehensive weight. It can be used for risk classification and the evaluation of HCAs.

2.1. Establish Evaluation Index Set

The total objective A is divided into m subindex sets, and their relationship meets the following conditions:
A = B 1 , B 2 B m , B i B j , i j
where B is the subindex set, and they are independent of each other; m, i, and j are the number of subindexes.
Use the nine-scale scoring principle combined with the triangular fuzzy number method to conduct fuzzy judgement of the index at all levels; the results are shown in Table 1.
Assuming that B is the parent index and that it has a membership relationship with C1, C2, ⋯, Cn, expert scores according to the index scale, the fuzzy judgement matrix R w is obtained, which is express as follows.
R w = [ r 1 r 2 r n ] 1 × n
In this expression, ri = (li, mi, ui), which is triangular fuzzy number, i = 1, 2, ···, n. In comparison between Ci and superior B, li is the most pessimistic estimate, mi is the most probable estimate, and u i is the most optimistic estimate. R w represents the importance of the sub-indicator, which is a 1 × n triangular fuzzy matrix.

2.2. Determine Each Index Weight

IFAHP is used to determine the importance weight of each index. To calculate the subjective weight of factors, the event statistical objective weight is combined to obtain the comprehensive weight of each factor. This method avoids the problem of traditional AHP that is dependent on the experience of the expert and the difficulty of adjusting the consistency of the judgment matrix. This method reflects the fuzzy decision making of AHP. This method introduces the expert weight coefficient, combines fuzzy triangle number with AHP, and modifies it with a Bayesian network. By minimizing subjectivity and data uncertainty, IFAHP is used to process data and also improves consistency by transforming the possibility of each index into real values to solve weight. This method not only improves practicability, but also solves the problem of judgement matrix inconsistency in AHP.

2.2.1. Determine Expert Scoring Weight

Traditional AHP relies too much on the experience level of experts, and it is difficult to adjust the consistency of the judgment matrix; thus, IAHP is used to calculate the expert rating weight of each factor [11], which is marked as α i . The method extends AHP to the field of expert group strategy and takes full factors into account, such as expert’s personal ability, experience, and level; thus, this minimizes subjectivity. In addition, by converting the probability degree matrix of each index real value, the weight was solved, and the steps of adjusting the consistency of judgment matrix by traditional AHP were optimized. According to the scoring results of several different experts, combined with different expert information, the comprehensive scoring value of each index is calculated and normalized, as is shown in Appendix A. The expression of the expert weight coefficient is as follows.
G k = a k × b k × c k × d k × e k
β k = G k / k = 1 s G k
In the expression, a k is expert popularity, b k is professional title, c k is educational background, d k is problem familiarity, e k is evaluation confidence, and the expert weight coefficient score is shown in Table 2.
In order to compare the proximity of two triangular fuzzy numbers, the possibility degree of a triangular fuzzy number is defined. The probability degree is converted into a real numerical judgement matrix as follows:
V M 2 M 1 = μ M 2 ( d ) = 1 b 2 b 1 0 a 1 c 2 a 1 c 2 / b 2 c 2 b 1 a 1 o t h e r
where M 1 = ( a 1 , b 1 , c 1 ) and M 2 = ( a 2 , b 2 , c 2 ) ; they are two arbitrary triangular fuzzy numbers.
According to formula (5), the possibility value of C 1 , C 2 , C n is calculated. Then, make pairwise comparisons to obtain V , and the expression is as follows:
V = γ i j n × n = 1 V S 1 ˜ S ˜ 2 V S 1 ˜ S ˜ n V S 2 ˜ S ˜ 1 1 V S 2 ˜ S ˜ n V S n ˜ S ˜ 1 V S n ˜ S ˜ 2 1
where V is the possible degree matrix, and S ˜ i is normalized comprehensive judgement matrix.

2.2.2. Determine Each Index Weight

Bayesian network is a graphical model of probability, based on Bayesian formula. By constructing fault tree and then transforming it into a Bayesian network, it makes up for the limitation of quantitative analysis of fault trees [12]. A Bayesian network can use the Bayesian theory and new information about event occurrence to update the failure probability of events, realizing the dynamic analysis of the entire system. BN can be expressed by using B = <N, P>, where N represents a structure graph constructed by the network nodes having causality, and P represents the probability distribution of the nodes [13].
Combined with the pipeline failure index model, the mapping and logic relationship are unchanged by constructing the evaluation factor model and then transforming it into a Bayesian network. On the basis of the prior probability of basic events and the failure probability of shale gas pipelines, probabilistic inference on the prior probability of all remaining non-root nodes in the accidental Bayesian network is performed. The probability of shale gas pipelines leakage accidents in HCAs and the probability of each consequence are obtained. It not only makes up for the shortcomings of fault tree methods, but also makes the establishment of a Bayesian network model simple. It has positive significance for shale gas pipeline hierarchical management and control.

2.2.3. Determine Comprehensive Weight

In order for the comprehensive weight to be as close as possible to both sides and not biased to either sides, the comprehensive weight was obtained by optimizing the model based on the principle of minimum identification information [14,15] and finding the overall weight ω i . The expression is as follows:
ω i = α i ε i n j = 1 α i ε i
where α i is expert scoring weight, and ε i is probability weight. The comprehensive weight vector is W = ω 1 , ω 2 , , ω n T .

2.3. Fuzzy Comprehensive Evaluation of Pipeline Risk Grade in High Consequence Areas

2.3.1. Risk Identification of High Consequence Areas

To distinguish the severity of pipeline accidents in HCAs, the grade of HCAs is divided as the classification Chinese Standard [16] and the characteristics of shale gas development areas (mainly in Sichuan and Chongqing). The principle and grades of HCAs used for shale gas gathering and transportation pipelines are shown in Table 3.

2.3.2. Build Comment Set

When shale gas gathers and is transported in pipelines across HCAs, there are leakage risk factors. The comment set is a set of element evaluation results in factor set U that may leak during the operation of the pipeline, which is usually represented by V . There are two main aspects in the classification of shale gas gathering and transportation pipeline failure risk: First, improve the accuracy of evaluation results; second, the calculation amount should be reasonable. To ensure the objectivity of evaluation, the evaluation principle should be based on reality. Therefore, the commonly used five-grade classification method is adopted in this paper. The risk evaluation set V corresponds to five elements, and the factor grade classification principle is shown in Table 4.
V = {lowest, low, medium, high, highest}

2.3.3. Sub-Factor Evaluation

For a sub-factor that may cause leakage, when shale gas is gathered and the transportation pipeline passes through high consequence areas, according to the principle of the comment set and actual conditions of the pipeline and based on historical data and expert speculation, score each factor. In this manner, the membership degree of the factor to the comment set is determined, and the evaluation membership degree matrix R is established. The sub-factor evaluation fuzzy set R i can be expressed as follows:
R i = r i 1 , r i 2 , , r i 5 ,   i = 1 ,   2 ,     ,   n   ,   j = 1 ,   2 ,     , 5
where u i is single factor, and r i j is the grade evaluation degree of u i .
The sub-factor evaluation fuzzy set of n factors forms R, which can be expressed as follows:
R = R 1 R 2 R n = r 11 r 12 r 15 r 21 r 22 r 25 r n 1 r n 2 r n 5
where R is a comprehensive membership evaluation matrix.

2.3.4. Multi Factor Fuzzy Comprehensive Evaluation

The sub-factor evaluation result can only explain the influence of specific factor on the evaluation index, and only by comprehensively considering the influence of all factors on the evaluation target can a multi-factor fuzzy comprehensive evaluation be obtained; the specific expression is as follows:
B = W T × R = b 1 , b 2 , , b 5
where B is the comprehensive evaluation set, W is index weight factor, and R is a single factor evaluation comprehensive membership matrix.
According to the principle of maximum membership degree and obtained comprehensive evaluation set B , determine the comprehensive result v j corresponding to b j , which is the largest element in B .

3. Application of the Proposed Methodology

Take the shale gas gathering and transportation pipeline of shale gas in a city as an example. The horizontal length of the pipeline is 31,494.4 m, the real length is 31,891.5 m, the pipe diameter is 508 mm, and the design pressure is 8.5 MPa. By comparison to shale gas gathering pipeline HCAs identification principles and levels (Table 3), the pipeline passes through three HCAs, and the basic situation is shown in Table 5. The proposed above method combined IFAHP and Bayesian network updates to evaluate HCAs and to classify the risk.

3.1. Risk Assessment of Shale Gas Gathering and Transportation Pipeline

Shale gas gathering and transportation pipeline is faced with many hazards during their operation. According to the European Gas Pipeline Incident Group (EGIG), the main causes of pipeline failures include corrosion, third-party damage, mis-operation, design and construction defects, and natural disasters [17]. If the pipeline risk management measures are not executed thoroughly, it may cause severe accidents. The failure factors of pipeline are shown in Table 6 based on a comprehensive analysis of the failure factors of shale gas gathering and transmission pipelines, referring to the safety evaluation standards at home and abroad, combining each region management experience of shale gas pipelines, and considering pipe body conditions, transmission mediums, the natural environment condition, and artificial factor.

3.2. Establish the Factors to Monitor Pipeline Failures

Based on the comprehensive analysis of the failure factor of shale gas gathering and transportation pipelines, the evaluation index factor set is established considering the pipeline condition, transportation medium, natural environmental conditions, and human factors. A factor set is the set of evaluation indexes of a decision-making system: U = u 1 , u 2 ,     , u n . In the multilevel evaluation model of shale gas pipeline failures, the hierarchical system is divided into three layers: target layer T, parent factor layer, and sub-factor layer. Layer T, the target layer, demonstrates the final objective of the entire hierarchical structure, which is depicted in pipeline failure. The parent factor layer is divided into six types of factors that affect the failure of pipelines, namely third-party damage, internal corrosion, external corrosion, mis-operation, design and construction defects, and natural disasters, which are denoted as M1, M2, M3, M4, M5, and M6. Sub-factor layer is the 26 s-level indices established in the evaluation model, which are shown in Table 6.
The evaluation factor model is established, as shown in Figure 2.

3.3. Expert Weight Calculation

Based on IFAHP, 10 enterprise experts were invited to score each factor with triangular fuzzy numbers, of which 10 were issued and 10 were recovered (all 10 were valid).
According to those data, the weight and total weight results of each level were obtained. According to the hierarchical data shown in the Figure 1, the judgment matrix of the parent factor layer relative to the target layer is recorded as T, and its eigenvectors are denoted as WT. The sub-factor layer judgment matrices are recorded as M1, M2, M3, M4, M5, and M6, and the corresponding eigenvectors are recorded as W1, W2, W3, W4, W5, and W6. The total weight result is expressed in Wa. According to Equation (1), the probability of each level is converted into a real number judgment matrix, as shown in Table 7, Table 8, Table 9, Table 10, Table 11, Table 12 and Table 13. The calculation results of eigenvectors are as follows:
WT = [0.21, 0.18, 0.18, 0.14, 0.14, 0.15]T;
W1 = [0.36, 0.31, 0.33]T;
W2 = [0.25, 0.23, 0.26, 0.26]T;
W3 = [0.11, 0.11, 0.09, 0.10; 0.10; 0.13; 0.12; 0.12; 0.11]T;
W4 = [0.22, 0.24, 0.23, 0.31]T;
W5 = [0.50, 0.50]T;
W6 = [0.25, 0.25, 0.26, 0.24]T.
According to the calculation results of the eigenvector, the total weight is calculated as follows.
Wa = [0.07, 0.07, 0.07, 0.05, 0.0423, 0.045, 0.05, 0.02, 0.02, 0.02, 0.02, 0.02, 0.02, 0.02, 0.02, 0.02, 0.03, 0.03, 0.03, 0.04, 0.07, 0.07, 0.04, 0.04, 0.04, 0.04] T.

3.3.1. Objective Weight Calculation

Considering that regional characteristics and factors are not unified, the Bayesian network model is used to modify, and the formula is used to normalize the probability weight. The event probability refers to the relevant research literature [18,19,20,21,22], and the probability of an intentional destruction factor refers to the literature [23,24]. The Bayesian network diagram is shown in Figure 3.
The statistical probability of failure events is also an important basis for determining factor weight. According to OREDA [25], relevant statistics, literature [26,27,28,29,30], and empirical data, the basic probability of events affected by the structure of Bayesian model can be concluded. The posterior probability of Bayesian model can be inferenced according to prior probability. Then, normalize the probability according to the posterior probability of each factor in order to obtain an objective weight relative to minimized subjectivity. Prior probability, posterior probability, and objective weight are shown in Table 14.

3.3.2. Modification of FAHP by Bayesian Network

In order to make the analysis result more in line with the actual situation, the FAHP method is modified and determined by a Bayesian network. According to the expert scoring weight Wa calculated by IFAHP and the probability weight converted from statistical probability, it is recorded as Wb, and the comprehensive weight is calculated by Formula (3), which is recorded as Wc.
Wc = [0.05, 0.03, 0.06, 0.05, 0.06, 0.06, 0.06, 0.03, 0.03, 0.02, 0.03, 0.03, 0.04, 0.04, 0.04, 0.04, 0.03, 0.02, 0.02, 0.06, 0.04, 0.04, 0.02, 0.02, 0.03, 0.02]T.

3.4. Fuzzy Comprehensive Evaluation of Risk in High Consequence Areas

3.4.1. High Consequence Areas Recognition

According to the identification criteria for high consequence areas of shale gas gathering and transportation pipelines in Table 1, there are three sections of HCAs identified in this pipeline, as shown in Table 5.

3.4.2. Sub-Factor Evaluation

For the identified three high-consequence pipe sections, five experts are invited to adopt the evaluation principle in Table 2 to evaluate the failure factors of each high-consequence pipe section with a risk grade score between 0 and 1, and the sum of membership degrees of each index corresponding to each evaluation grade is 1. Then, five experts were counted to judge the estimated values, and the average value was taken as the final membership estimated values of each index. The evaluation grade and membership degree are shown in Table 15. Only the evaluation results of HCAs1 are listed here, and HCAs2 and HCAs3 methods are consistent.

3.4.3. Multi-Factor Fuzzy Comprehensive Evaluation

Evaluation matrix R is composed of the membership degrees of X1~X26 in Table 15, which is the comprehensive membership degree matrix of sub-factors. The comprehensive weight is Wc. According to Equation (8), the comprehensive evaluation result WHCAs1 of pipeline failure sub-factors to the target layer is calculated as follows.
WHCAs1 = [0.27, 0.29, 0.32, 0.08, 0.04].
The comprehensive evaluation results obtained by HCAs2 and HCAs3 are as follows.
WHCAs2 = [0.26, 0.32, 0.30, 0.08, 0.04].
WHCAs3 = [0.27, 0.36, 0.24, 0.08, 0.04].

4. Discussion

According to the principle maximum membership, the risk level of HCAs1 is medium; HCAs2 and HCAs3 in HCAs have lower risk levels. This is roughly consistent with the actual situation in HCAs, during pipeline operation, HCAs1 has been leaked, while HCAs2 and HCAs3 in HCAs have relatively low risks.
The main causes of pipeline failure are M1, M2, and M3. Among them, the failure probabilities of X1, X2, X3, X4, X6, and X7 rank within the top six; therefore, we need to focus on them. They are the weak links in the field; it is, thus, necessary to focus on monitoring and preventing them during the pipelines running through HCAs1. Under the condition of limited resources, priority should be given to X1, X2, X3, and X7 when developing prevention and control measures.
Therefore, in the actual operation process in addition to routine inspections, the management for HCAs1 should strengthen and improve its safety precautions.

5. Conclusions

An integrated methodology is used to calculate the expert scoring weight of the factors causing the failure possibility of shale gas pipelines by incorporating improved fuzzy analytic hierarchy process and Bayesian updating technique. The advantage of this method is more prominent, which minimizes the subjectivity of experts’ scoring weight. The purpose of this study is to classify risk levels in HCAs of shale gas pipeline under the condition of uncertain data. Combined with the probability weight calculated by the statistical probability of the failure possibility factors of shale gas pipelines, the comprehensive weight is calculated to evaluate the failure possibility grade of shale gas pipelines. The study observes that places within 200 m on both sides of the pipeline must be considered as HCAs. This includes drinking water sources, large- and medium-sized rivers, lakes, water reservoirs, nature reserves, and ecological sensitive areas.
This study applies an IFAHP and Bayesian network method for safety risk analysis of pipelines running through HCAs. It is found that third-party damage and protective layer failure account for the largest weight, and design and construction defects account for the lowest weight. This result may be caused by the increase in population density or regional development. Protective measures can be strengthened by using technical means. The final result of the situation is retained by conducting a case study, which verified the viability and effectiveness of the proposed methodology and offers an important reference for hierarchical management of HCAs. Using this method, we can focus on the diagnosis and analysis of the risk factors, which are more likely to cause pipeline leakage, in order to prevent the occurrence of pipeline leakage accidents. The improved FAHP and Bayesian Network method also have some limitations. In the terms of BN model construction processes, they rely on domain experts. Our subsequent research will focus on automatic knowledge acquisition and develop a real-time evaluation and decision support system for shale gas gathering and transportation pipeline risk classification.

Author Contributions

Conceptualization and methodology and software and data curation, N.S. and Z.L.; formal analysis, X.C.; resources investigation, X.W.; writing—original draft preparation, N.S. and X.C.; writing—review and editing, K.C. and S.L.; supervision and project administration, K.C. and W.Q.; funding acquisition, K.C. All authors have read and agreed to the published version of the manuscript.

Funding

This research was funded by The Scientific and Technology Research Program of Chongqing Municipal Education Commission, grant number KJZD-K201901501; Research Foundation of Chongqing University of Science & Technology, grant number YKJCX1820705, YKJCX2020716, YKJCX2020717.

Institutional Review Board Statement

Not applicable.

Informed Consent Statement

Not applicable.

Data Availability Statement

The data presented in this study are available upon request from the corresponding author.

Acknowledgments

The authors are grateful for the Chongqing Administration of Work Safety, the Chongqing Municipal Education Commission and Chongqing University of Science & Technology.

Conflicts of Interest

The authors declare that they have no known competing financial interests or personal relationships that could have appeared to influence the work reported in this paper.

Appendix A. Normalization process

According to the scoring results of several different experts combined with different expert information, the comprehensive scoring value of each index is calculated and normalized. The expression is as follows.
R w ¯ = k = 1 S β k R w k = k = 1 S β k r i k 1 × n = k = 1 S β k l i k , k = 1 S β k m i k , k = 1 S β k u i k 1 × n = r ¯ i 1 × n
In the expression, s is the number of experts, k = 1, 2, ···, s, β is normalized expert weight coefficient, and R w ¯ and r i are the triangular fuzzy number matrix set and the triangular fuzzy number after synthesizing the opinion of experts, respectively.
S ˜ i = r ¯ i i = 1 n r ¯ i = l ¯ i i = 1 n l ¯ i , m ¯ i i = 1 n m ¯ i , u ¯ i i = 1 n u ¯ i
In the expression, S ˜ i is the normalized value of index C i , the normalized comprehensive judgement matrix is S w , and the expression is as follows.
S w = S ˜ 1 S ˜ 2 S ˜ n 1 × n

References

  1. Chen, X.; Wu, Z.; Chen, W.; Kang, R.; He, X.; Miao, Y. Selection of key indicators for reputation loss in oil and gas pipeline failure event. Eng. Fail. Anal. 2019, 99, 69–84. [Google Scholar] [CrossRef]
  2. Li, M.; Zheng, H.; Xue, X.; Xue, L.; Ai, M.; Ma, W. Reliability evaluation and management of PetroChina’s large-scale system of natural gas pipeline networks. J. Nat. Gas Geosci. 2019, 4, 287–295. [Google Scholar] [CrossRef]
  3. Stephens, M.; Leewis, K.G.; Moore, D.K. A Model for Sizing High Consequence Areas Associated With Natural Gas Pipelines. In Proceedings of the 2002 4th International Pipeline Conference, Calgary, AB, Canada, 29 September–3 October 2002. [Google Scholar] [CrossRef] [Green Version]
  4. Onisawa, T. An approach to human reliability in man-machine systems using error possibility. Fuzzy Sets Syst. 1988, 27, 87–103. [Google Scholar] [CrossRef]
  5. Lam, C.; Zhou, W. Statistical analyses of incidents on onshore gas transmission pipelines based on PHMSA database. Int. J. Press. Vessel. Pip. 2016, 145, 29–40. [Google Scholar] [CrossRef]
  6. Zhang, P.; Peng, X.; Li, X. Oil and Gas Pipeline Limited Charge Optimum Maintenance Decision-Making Analysis Based on Fuzzy-Gray-Element Theory and Fuzzy Analytical Hierarchy Process. In Proceedings of the International Conference on Fuzzy Information and Engineering South West Petroleum University, Chengdu, China, 13–16 May 2007. [Google Scholar] [CrossRef]
  7. Wang, X.; Shuai, J.; Song, H.; Wang, Y. Identification and hierarchical management of high consequence area for oil pipeline. China Saf. Sci. J. 2015, 25, 149–154. [Google Scholar] [CrossRef]
  8. Dong, S.; Wang, D.; Fei, F.; An, Y.; Dong, Q.; Zhou, Y. Upgrading of pipeline regions and control of public security risks. Chin. J. Oil Gas Storage Transp. 2014, 11, 1164–1170. [Google Scholar] [CrossRef]
  9. Shan, K.; Shuai, J. Study on management of risk in natural gas pipelines after upgrading location class. China Saf. Sci. J. 2016, 26, 145–150. [Google Scholar] [CrossRef]
  10. Yao, A.L.; Zhou, L.G.; Wang, L.; Wang, X.T.; Li, Y.L. Management of and risk evaluation on long-distance gas pipelines related to regional level upgrading. Chin. J. Nat. Gas Ind. 2017, 37, 124–130. [Google Scholar] [CrossRef]
  11. Kim, J.; Lee, J.; Kim, B.C.; Kim, J. Raw material criticality assessment with weighted indicators: An application of fuzzy analytic hierarchy process. Resour. Policy 2019, 60, 225–233. [Google Scholar] [CrossRef]
  12. Guo, C.; Khan, F.; Imtiaz, S. Copula-based Bayesian network model for process system risk assessment. Process Saf. Environ. Prot. 2019, 123, 317–326. [Google Scholar] [CrossRef]
  13. Khakzad, N.; Khan, F.; Amyotte, P. Dynamic safety analysis of process systems by mapping bow-tie into Bayesian network. Process Saf. Environ. Prot. 2013, 91, 46–53. [Google Scholar] [CrossRef]
  14. Lee, Y.; Haberman, S.; Dorans, N. Use of Adjustment by Minimum Discriminant Information in Linking Constructed-Response Test Scores in the Absence of Common Items. J. Educ. Meas. 2019, 56, 452–472. [Google Scholar] [CrossRef]
  15. Haberman, S.; Yao, L. Repeater Analysis for Combining Information from Different Assessments. J. Educ. Meas. 2015, 52, 223–251. [Google Scholar] [CrossRef]
  16. GB 32167; Oil and Gas Pipeline Integrity Management Specification. China National Standardization Administration Committee: Beijing, China, 2015.
  17. Halim, S.; Yu, M.; Escobar, H.; Quddus, N. Towards a causal model from pipeline incident data analysis. Process Saf. Environ. Prot. 2020, 143, 348–360. [Google Scholar] [CrossRef]
  18. Yan, C.; Quddus, N.; Mashuga, C. Bayesian Network and Game Theory Risk Assessment Model for Third-Party Damage to Oil and Gas Pipelines. Process Saf. Environ. Prot. 2019, 134, 178–188. [Google Scholar] [CrossRef]
  19. Guo, Y.; Meng, X.; Wang, D.; Meng, T.; Liu, S.H.; He, R.Y. Comprehensive risk evaluation of long-distance oil and gas transportation pipelines using a fuzzy petri net model. J. Nat. Gas Sci. Eng. 2016, 33, 18–29. [Google Scholar] [CrossRef]
  20. Wang, X.; Duan, Q. Improved AHP–TOPSIS model for the comprehensive risk evaluation of oil and gas pipelines. Pet. Sci. 2019, 16, 245–258. [Google Scholar] [CrossRef] [Green Version]
  21. Li, X.; Chen, G.; Zhu, H. Quantitative risk analysis on leakage failure of submarine oil and gas pipelines using Bayesian network. Process Saf. Environ. Prot. 2016, 103, 163–173. [Google Scholar] [CrossRef]
  22. Badida, P.; Balasulbramaniam, Y.; Jayapraakash, J. Risk evaluation of oil and natural gas pipelines due to natural hazards using fuzzy fault tree analysis. J. Nat. Gas Sci. Eng. 2019, 66, 284–292. [Google Scholar] [CrossRef]
  23. Guo, X.; Zhang, L.; Liang, W.; Haugen, S. Risk identification of third-party damage on oil and gas pipelines through the bayesian network. J. Loss Prev. Process Ind. 2018, 54, 163–178. [Google Scholar] [CrossRef]
  24. Zarei, E.; Yazdi, M.; Abbassi, R.; Khan, F. A hybrid model for human factor analysis in process accidents: Fbn-hfacs. J. Loss Prev. Process Ind. 2019, 57, 142–155. [Google Scholar] [CrossRef]
  25. Sintef, N.T.N.U. Offshore and Onshore Reliability Data Handbook; OREDA Participants: Oslo, Norway, 2015. [Google Scholar]
  26. Wang, T.; Wang, X.; Zairong, L.; Xue, L.; Gao, Z.; Wang, Y. Comparison on failures of long- distance oil & gas pipelines at home and abroad. Oil Gas Storage Transp. 2017, 36, 1258–1264. [Google Scholar] [CrossRef]
  27. Shan, K.; Shuai, J.; Yang, G.; Meng, W.; Zhang, H. Evaluation method for basic failure probability of oil and gas pipeline based on accident statistics in the United States and enlightenments. Chin. J. Integr. Reliab. 2020, 39, 530–535. [Google Scholar] [CrossRef]
  28. Huang, P.; Xu, J.; Lai, Y.; Zhang, Y. Human factors analysis of leakage explosion of oil and gas pipeline based on HFACS and AHP. Saf. Environ. Eng. 2016, 23, 114–118. [Google Scholar] [CrossRef]
  29. Liu, J.; Zhu, Y.; Qin, H.; Liu, W.; Xiao, W. Risk analysis of subsea x-tree system leakage based on bayesian networks. Lubr. Eng. 2018, 43, 109–114. [Google Scholar] [CrossRef]
  30. Hao, Y.; Xing, Z.; Wang, K.; Shao, H.; Wei, J. Quantitative risk analysis of natural gas pipeline failure. Oil Gas Storage Transp. 2011, 30, 263–265. [Google Scholar]
Figure 1. Hierarchical management flow chart of HCAs.
Processes 10 00923 g001
Figure 2. Indicators to monitor pipeline failure.
Processes 10 00923 g002
Figure 3. Bayesian network model for pipeline failure factor.
Processes 10 00923 g003
Table 1. Indicator scale table.
ScaleDefinition
1Very unimportant
3Slightly unimportant
5General important
7Slightly important
9Very important
3, 4, 6, 8Between 1–2 or 3–5 or 5–7 or 7–9
Table 2. Expert weight coefficient score table.
NumberIndicatorExpert CategoryScore
1Expert popularityNational famous scholar, provincial and ministerial scholar, other3, 2, 1
2Professional titleAssociate senior and above, intermediate, other3, 2, 1
3Educational backgroundDoctor, master’s degree, undergraduate3, 2, 1
4Problem familiarityMajor, specialty-related, not related to the major3, 2, 1
5Evaluation confidenceConfident, less confident, general confident3, 2, 1
Table 3. Identification principle and grade of HCAs.
CategoryPipe DiameterPreconditionSubitemsSerial Number
HCAsGreater than 762 mm, and the maximum allowable operating pressure is more than 6.9 MPa (198 m)Radius of
influence area
Particular area 1II
Particular area 2II
Particular area 3II
Less than 273 mm, and the maximum allowable operating pressure is less than 1.6 MPa(35 m)Particular area 1I
Particular area 2I
Particular area 3I
Other pipe diameters200 m inside and outside the pipelineParticular area 1I
Particular area 2I
Particular area 3I
All the pipe diametersLevel 3 areasII
Level 4 areasIII
Table 4. Failure probability scoring principle.
PrincipleRisk DescriptionGrade
The pipeline has experienced similar failures several times a year or is expected to fail within one year.HighestV
Similar failure of pipelines occurs every year or failure is expected to occur within 1–3 years.HighIV
Similar failure of pipelines occurs every year, or failure is expected to occur within 3–5 years.MediumIII
Similar failure has occurred in the enterprise or is expected to occur within 5–10 years.LowII
Similar failures have occurred in the enterprise or are expected to occur after more than 10 years.LowestI
Table 5. Basic situation of HCAs.
Serial NumberFeature DescriptionLength (km)Grade of HCAs
HCAs1Primary school and residential area2.20III
HCAs2Township4.56III
HCAs3Crossing large and medium rivers0.43I
Table 6. The failure factor of pipeline.
No.DescriptionNo.Description
X1Third party constructionX14Protective layer performance failure
X2Serious pipeline pressureX15cathodic protection measures failure
X3Artificially vandalismX16Stray current interference
X4Effusion containing Cl, HCO3 plasmaX17Unreasonable pipeline design
X5Sulfate-bearing reducing bacteria (SRB)X18Manufacture defects
X6Contain erosionX19Material defect
X7Inner protective layer failureX20Construction defect
X8Sulphide in soilX21Operational mis-operation
X8High salinity of soilX22Maintenance mis-operation
X10Low PH of soilX23Flood damage
X11Soil contains corrosive bacteriaX24Debris flow
X12High soil redox potentialX25Landslide
X13High soil moisture contentX26Earthquake disaster
Table 7. Judgment matrix of the parent factor layer to the target layer T.
Parent Factor of TM1M2M3M4M5M6
M1111111
M20.6611111
M30.600.991111
M40.350.350.72110.98
M50.280.620.640.9010.89
M60.360.720.73111
Table 8. Judgment matrix of the parent factor layer to the target layer M1.
Sub-Factors of M1X1X2X3
X1111
X20.7510.92
X30.8111
Table 9. Judgment matrix of the sub-factor layer to the upper factor M2.
Sub-Factors of M2X4X5X6X7
X4110.970.94
X50.8610.840.80
X61110.97
X71111
Table 10. Judgment matrix of the sub-factor layer to the upper factor M3.
Sub-Factors of M3X8X9X10X11X12X13X14X15X16
X8111110.460.880.730.99
X90.9511110.450.840.700.94
X100.780.8210.930.910.260.680.520.77
X110.860.90110.980.340.750.600.85
X120.880.921110.360.770.620.86
X13111111111
X14111110.6310.871
X15111110.77111
X16111110.520.900.761
Table 11. Judgment matrix of the sub-factor layer to the upper factor M4.
Sub-factors of M4X17X18X19X20
X1710.910.950.22
X181110.37
X1910.9610.27
X201111
Table 12. Judgment matrix of the sub-factor layer to the upper factor M5.
Sub-Factors of M5X21X22
X2110.99
X2211
Table 13. Judgment matrix of the sub-factor layer to the upper factor M6.
Sub-Factors of M6X23X24X25X26
X23110.851
X240.9410.771
X251111
X260.910.970.751
Table 14. Pipe failure factors prior probability, posterior probability, and objective weight.
NumberPrior Probability (km·a)Posterior ProbabilityObjective WeightNumberPrior Probability (km·a)Posterior ProbabilityObjective Weight
X13.0 × 10−33.2 × 10−23.0 × 10−2X146.0 × 10−36.4 × 10−26.1 × 10−2
X21.3 × 10−31.4 × 10−21.3 × 10−2X155.6 × 10−36.0 × 10−25.7 × 10−2
X35.0 × 10−35.3 × 10−25.1 × 10−2X166.5 × 10−37.0 × 10−26.6 × 10−2
X44.8 × 10−35.1 × 10−24.9 × 10−2X171.9 × 10−32.0 × 10−21.9 × 10−2
X56.5 × 10−36.9 × 10−26.6 × 10−2X181.1 × 10−31.2 × 10−21.1 × 10−2
X66.6 × 10−37.0 × 10−26.7 × 10−2X191.1 × 10−31.2 × 10−21.1 × 10−2
X76.0 × 10−36.4 × 10−26.1 × 10−2X206.7 × 10−37.2 × 10−26.8 × 10−2
X84.8 × 10−35.1 × 10−24.9 × 10−2X212.4 × 10−32.6 × 10−22.5 × 10−2
X94.5 × 10−34.8 × 10−24.6 × 10−2X221.8 × 10−31.9 × 10−21.8 × 10−2
X103.0 × 10−33.2 × 10−23.1 × 10−2X239.0 × 10−40.96 × 10−29.2 × 10−3
X114.8 × 10−35.1 × 10−24.9 × 10−2X249.0 × 10−40.96 × 10−29.2 × 10−3
X123.5 × 10−33.7 × 10−23.6 × 10−2X252.2 × 10−32.4 × 10−22.3 × 10−2
X136.0 × 10−36.4 × 10−26.1 × 10−2X261.2 × 10−31.3 × 10−21.2 × 10−2
Table 15. Sub-factors comprehensive weight ranking and membership estimation.
FactorWeightJudge Level and Membership
Serial NumberNumerical ValueLow (I)Lower (II)Medium (III)Higher (IV)High (V)
X310.0630.100.380.280.160.08
X620.0620.380.280.220.080.04
X730.0600.340.160.420.080.00
X2040.0590.360.240.200.120.08
X550.0580.440.200.360.000.00
X460.0530.140.280.560.020.00
X170.0510.480.160.260.080.02
X2180.0450.300.380.100.140.08
X1390.0410.280.420.140.100.06
X16100.0410.200.260.360.120.06
X14110.0400.400.300.140.120.04
X15120.0390.300.240.320.100.04
X22130.0390.140.360.380.080.04
X8140.0350.200.380.360.060.00
X9150.0330.180.300.380.100.04
X25160.0330.360.280.320.040.00
X11170.0330.100.420.360.080.04
X2180.0310.300.240.360.100.00
X12190.0280.320.220.360.060.04
X17200.0270.100.300.500.060.04
X10210.0250.180.320.420.060.02
X26220.0230.300.240.280.120.06
X18230.0210.240.400.360.000.00
X19240.0210.300.360.240.060.04
X23250.0210.180.220.460.080.06
X24260.0200.180.560.260.000.00
Publisher’s Note: MDPI stays neutral with regard to jurisdictional claims in published maps and institutional affiliations.

