
The Real-Time Prediction of Product Quality Based on the Equipment Parameters in a Smart Factory

1
School of Mechanical Engineering and Automation, Beihang University, Beijing 100191, China
2
Beige Institute, Weifang 261000, China
3
Jingdezhen Branch of Jiangxi Research Institute, Beihang University, Jingdezhen 333000, China
*
Author to whom correspondence should be addressed.
Processes 2022, 10(5), 967; https://0-doi-org.brum.beds.ac.uk/10.3390/pr10050967
Submission received: 14 March 2022
/
Revised: 9 May 2022
/
Accepted: 9 May 2022
/
Published: 11 May 2022
(This article belongs to the Special Issue Advanced Processes Creating New Technologies in Tomorrow's Industry)
Abstract
:Product quality is an important part of enterprise competitiveness. Product processing is the key process of quality formation. In smart factories, the improvement of data acquisition and processing capability provides a basis for data-based quality control. In order to reduce the occurrence of product quality problems, we abstracted the product processing process as a data processing unit, abstracted the process of changing the product quality state as a process of the processing quality characteristics data, divided the measured value of quality characteristics into three states according to the fluctuation of the measured value of product quality characteristics, and then the classification model of process equipment parameters was established. The experimental results show that the error rate of the real-time dynamic prediction of quality characteristics based on equipment parameters was acceptable, and its prediction could be used as a reference in real production. The research could be applied in product quality prediction, production process simulation, digital twin and other fields.
1. Introduction
Quality is the key factor of enterprise competitiveness [1]. In the existing quality control methods, more attention is paid to the handling of quality questions. By summarizing the mechanism of quality problems, quality problems can be avoided in the subsequent production process. This wastes a lot of time and money in the production process, such as reworking, maintenance, scrap, etc. Product processing is the key stage of product quality formation. Real-time quality prediction of product processing can effectively reduce the probability of product quality problems occurring.
In a smart factory, the ability and role of manufacturing resources (man, machine, material, method, environment) in product processing are different from those in the traditional environment. In particular, the processing equipment realizes real-time acquisition and analysis of its state and no longer needs to rely solely on receiving operation instructions from “man” to change the quality state of products. Therefore, the requirements for equipment management ability in the process of product processing have been improved. In the process of product processing, the equipment realizes the intervention of quality characteristics through the change of its parameters. Monitoring and controlling the parameters of the equipment processing process is an important means to reduce the probability of product quality problems and improve the qualification rate.
At present, the main purpose of equipment management research is predictive maintenance [2,3,4] and fault diagnosis [5,6,7]. Predictive maintenance of equipment refers to collecting operation data and environmental data during equipment operation, and predicting the service life and damage of important equipment parts by using big data and machine learning methods, to avoid excessive maintenance of equipment, reduce equipment failure rate and reduce product manufacturing cost, e.g., YL Chen [2] studied the equipment condition probability distribution and established the equipment residual life model by using the Bayes rule and the hidden Markov model. Based on the above research background, we obtain the optimum maintenance decision criteria by analyzing the equipment maintenance strategy based on equipment reliability and equipment residual life through indirect monitoring. The main way of conducting an equipment fault diagnosis is to establish the mechanism of equipment fault and study the correlation between various fault causes, fault characterization and fault signals in order to quickly diagnose the equipment fault when it occurs, e.g., Zhang Zhao [5] points out that the fault diagnosis of equipment can be carried out through the original input and output signals of the system. The diagnosis performance of an early fault with a specific structure can be improved by analyzing the designed auxiliary signal.
Based on the principle of equipment failure, the existing research improves the utilization rate of the equipment, realizes the predictive management of the equipment and avoids the influence of the bad state of equipment on product quality. At the same time, the existing research also provides research ideas for the analysis of equipment operation data.
In smart factories, the improvement of data collection and analysis methods provides a data basis for quality prediction [8,9,10]. The historical data generated in product manufacturing processes have been used to build models of the relationship between manufacturing process data and product quality [11,12]. The advantages of product quality diagnosis and prediction models have been demonstrated for the applications of various industrial processes. At present, the prediction of quality is mainly based on the Statistical Process Control (SPC) [13,14,15] or artificial intelligence algorithms [16,17,18,19]. In the context of the rapid development of machine learning, the use of learning algorithms to predict quality has produced many research results [20,21,22]. These artificial intelligence methods include the artificial neural network [23,24,25], support vector machine (SVM) [26], fuzzy logic [27], etc. Some studies [1] have proposed that the real-time data of current production time will be further converted into historical data with production. Quality process control knowledge would be obtained from massive historical data through big data mining analysis. Zhao et al. [9] proposed a residual prediction method for quality improvement and demonstrated the practical usefulness of the proposed method through a case study about the coating process of purifier carrier. Cao et al. [11] presented a hybrid improved back propagation neural network/differential evolution (IBPNN/DE) approach to conduct the continuous optimization decision making of process parameters in high-speed gear hobbing. Limited by the effectiveness of the algorithms, manufacturing process quality control research has focused on prediction, prevention or after-the-fact compensation [28].
However, these studies do not address changes in product quality during product processing (i.e., processes in which real-world equipment specifically changes the measured values of quality characteristics) and have not yet realized the real-time prediction of product quality status based on during the processing.
Quality characteristic fluctuation [29,30] refers to the phenomenon that the same quality characteristic value of different products processed by the same batch of manufacturing resources was uneven. In the smart factory, the operation quality of equipment has a direct impact on product quality characteristics [31], and the fluctuation of equipment operation status is an important reason for the fluctuation of quality characteristic value [32]. Wang Ce [32] pointed out in the research that there was a strong correlation between the statistical value of equipment operation parameters and the state of product quality characteristics. Monitoring equipment operation was an important means to meet the quality requirements of the product production process and improve the product qualification rate [33].
Based on the existing research and the theory of quality characteristic fluctuation [30], to realize the real-time prediction of product quality status during product processing, the paper studies the relationship between the fluctuation of quality characteristics and the fluctuation of equipment operating parameters during product processing, SVM was used to convert the prediction of product quality characteristics into the classification process of equipment parameter data, and the real-time prediction of product quality in the process of product processing was realized.
2. Related Theory
2.1. Correlation Study of Quality Characteristic Data and Equipment Data
Product processing is a process by which manufacturing resources change a certain quality characteristic of a product in some way. It is the key stage in the formation of product quality characteristics. In smart plants, product processing equipment is automated and intelligent. Processing equipment exerts a combined effect on product quality characteristics based on changes in their parameters. These processing equipment property parameters are interrelated and influence each other and determine the quality of the product’s processing process [34]. Taking the machining process as an example, these parameters include equipment type, material, life, switch status, etc. In this paper, the parameters of the processing equipment that change the product quality characteristics were called equipment process parameters, and the data that abstractly express the equipment process parameters are called equipment process data.
In the smart factory, the development of data collection technology and the interconnection of equipment have improved the efficiency and types of data collection [8,35]. To facilitate the application of equipment process parameters, this paper divides them into static process data, direct dynamic process data and indirect dynamic process data according to the influence of the equipment process parameters on the quality characteristics of the product to be processed. Among them, static equipment process data refers to equipment process data types that generally do not change during product processing, such as operator name, equipment power-on status, etc. The direct dynamic process data refers to the equipment process data that change dynamically during product processing, and the numerical change directly reflects the product quality characteristics, such as alarm information, tool coordinates, etc. Indirect dynamic process data refers to equipment process data that change dynamically during the processing process, and its changes do not directly reflect the state of product quality characteristics. Table 1 presents an example equipment process data classification result.
Fluctuations in equipment process data have a serious impact on the formation of product quality characteristic fluctuations. Among these three kinds of data, the uncertainty of the direct and indirect dynamic equipment process data was the source of the fluctuation of the equipment process data in the related product processing. Then, the impact of direct dynamic equipment process data on product quality status was more obvious, and the product quality status can be judged by the difference in numbers or status between actual data and planning data. The unobservability of the influence of indirect dynamic equipment process data on the fluctuation of product quality characteristics makes it impossible to judge product quality through its changes, and its dynamic fluctuation was a key factor in the formation of product quality state data fluctuations. Product processing quality can be predicted in real-time through the analysis of indirect dynamic equipment process data. Therefore, the indirect dynamic equipment process data was the focus of this paper. For the convenience of expression, the equipment process data mentioned in the remainder of the paper refers to the indirect dynamic equipment process data.
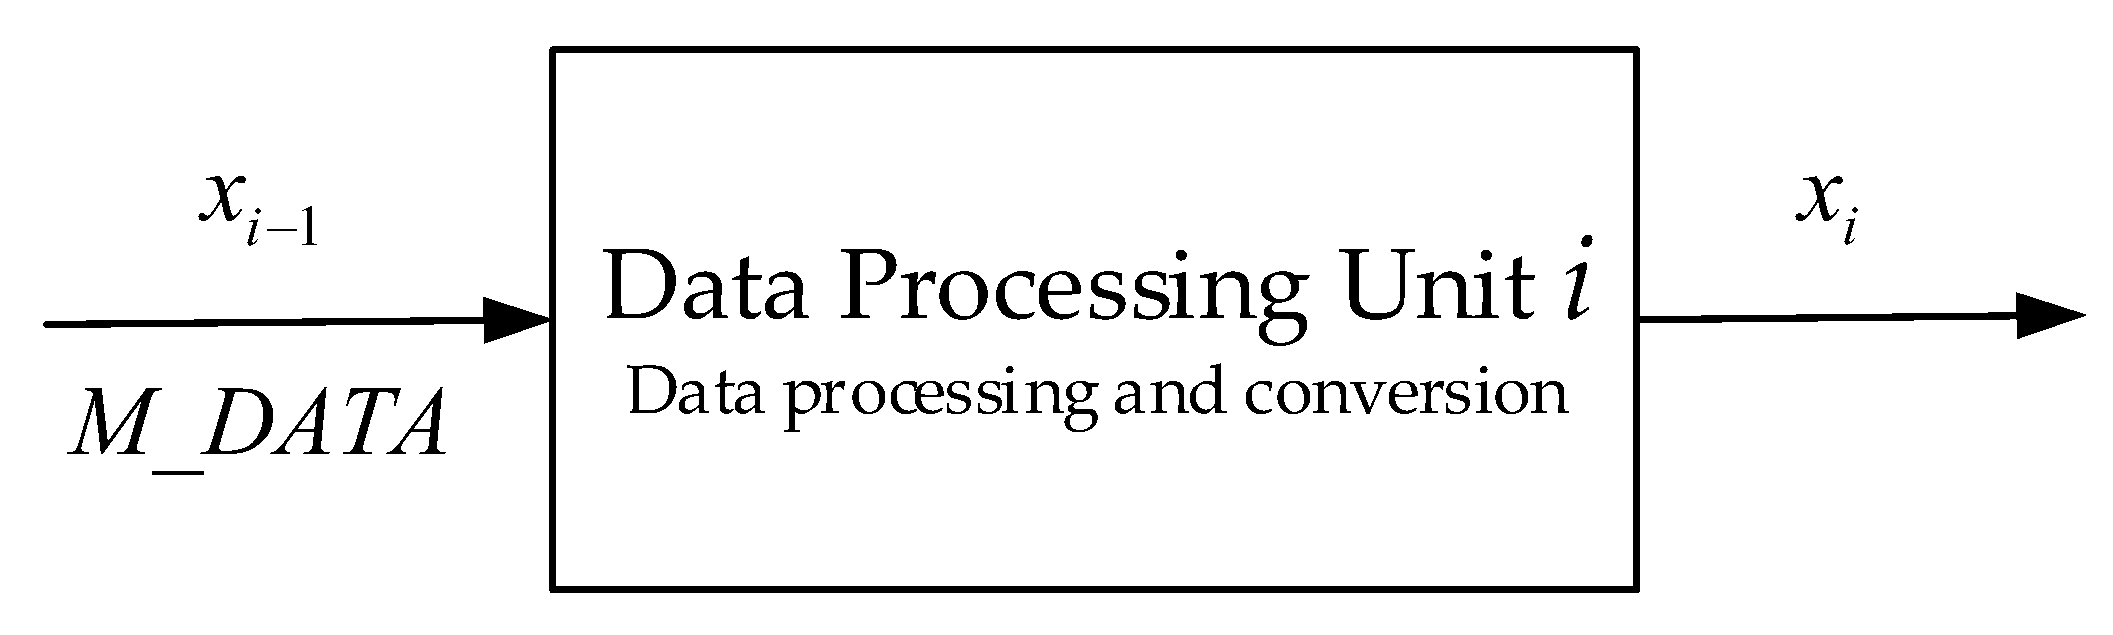
Based on the collection of equipment process data, the paper abstracts the process as a data processing unit, as shown in Figure 1.
In the data processing unit, M_DATA was the resource process data received by the data processing unit; xi−1 was the product quality status data before being processed by the data processing unit; xi was the output product quality status data processed by the data processing unit.
From the perspective of task execution, process i was the process in which a quality characteristic of a product was changed from state xi−1 to xi by a series of processing methods.
From the perspective of quality characteristics, the current quality characteristic xi was the result of the current process equipment treating the quality characteristic xi−1 in the current environment.
From the perspective of quality data, the process of changing the quality characteristic was the process that converts input data into output data through its processing mechanism. The quality characteristic xi was the result of processing the quality characteristic xi−1 by the data processing unit i based on the incoming parameters.
If the input and output of quality characteristic processing activities of the processing process were abstracted into equipment process data, the processing activity of the quality characteristic in the processing process was essentially a process of data acquisition, transmission and processing to get the result.
As the machining process continued, the manufacturing data were collected one by one according to a fixed frequency. Set the parameter type of the collected equipment process data as k. Equipment process data collected at each time were expressed in the form of an array, as shown in Formula (1):
In Formula (1), was an array formed by the equipment process data collected at a certain time, was the ith parameter of .
Over time, more and more equipment process data were acquired in the process. As the process continued, more and more equipment process data were collected, and the matrix of equipment process data was formed, as shown in Formula (2).
Equipment process data was a key factor in the formation of the quality characteristic fluctuation of the product to be processed. The paper divides the fluctuation of a quality characteristic PQCk into three types: low-level fluctuation, medium-level fluctuation and high-level fluctuation according to its degree of fluctuation.
After a certain processing process, the fluctuation degree of the quality characteristic PQCk belongs to a certain type, and the probability was P(PQCk_var), then P(PQCk_var) was related to the equipment process data in terms of data and principal, as shown in Formula (3). Set the last time of processing quality data acquisition in processing i was n. If there was a random moment o in the acquisition process, then Formula (3) was obtained.
The above formula expresses the mapping relationship between quality status data and processing equipment data, measuring equipment data and environment data in processing process quality data processing unit i. Based on this mapping relationship, the possibility of qualified quality characteristics after this processing process can be judged through the analysis of processing process parameters.
2.2. Feature Selection of Prediction Process Parameters
In the process of product processing, equipment process data have a decisive impact on the final measured value of product quality characteristics. However, due to the existence of deviation and disturbance, the measured value of product quality characteristics and quality resource characteristic parameters fluctuate, which leads to the fact that the measured value of product quality characteristics does not completely correspond to the equipment operating parameters. Under the same processing environment of equipment parameters, the measured values of the same quality characteristic of multiple parts were not exactly the same.
Further, in the actual processing process of products, due to the noise of the on-site environment, different working habits of operators and different equipment working conditions, the amount of equipment quality data was also different for the processing time of the same quality characteristics of different parts of the same product. This brings great difficulties to the analysis of the correlation between equipment process data and quality characteristic measurements.
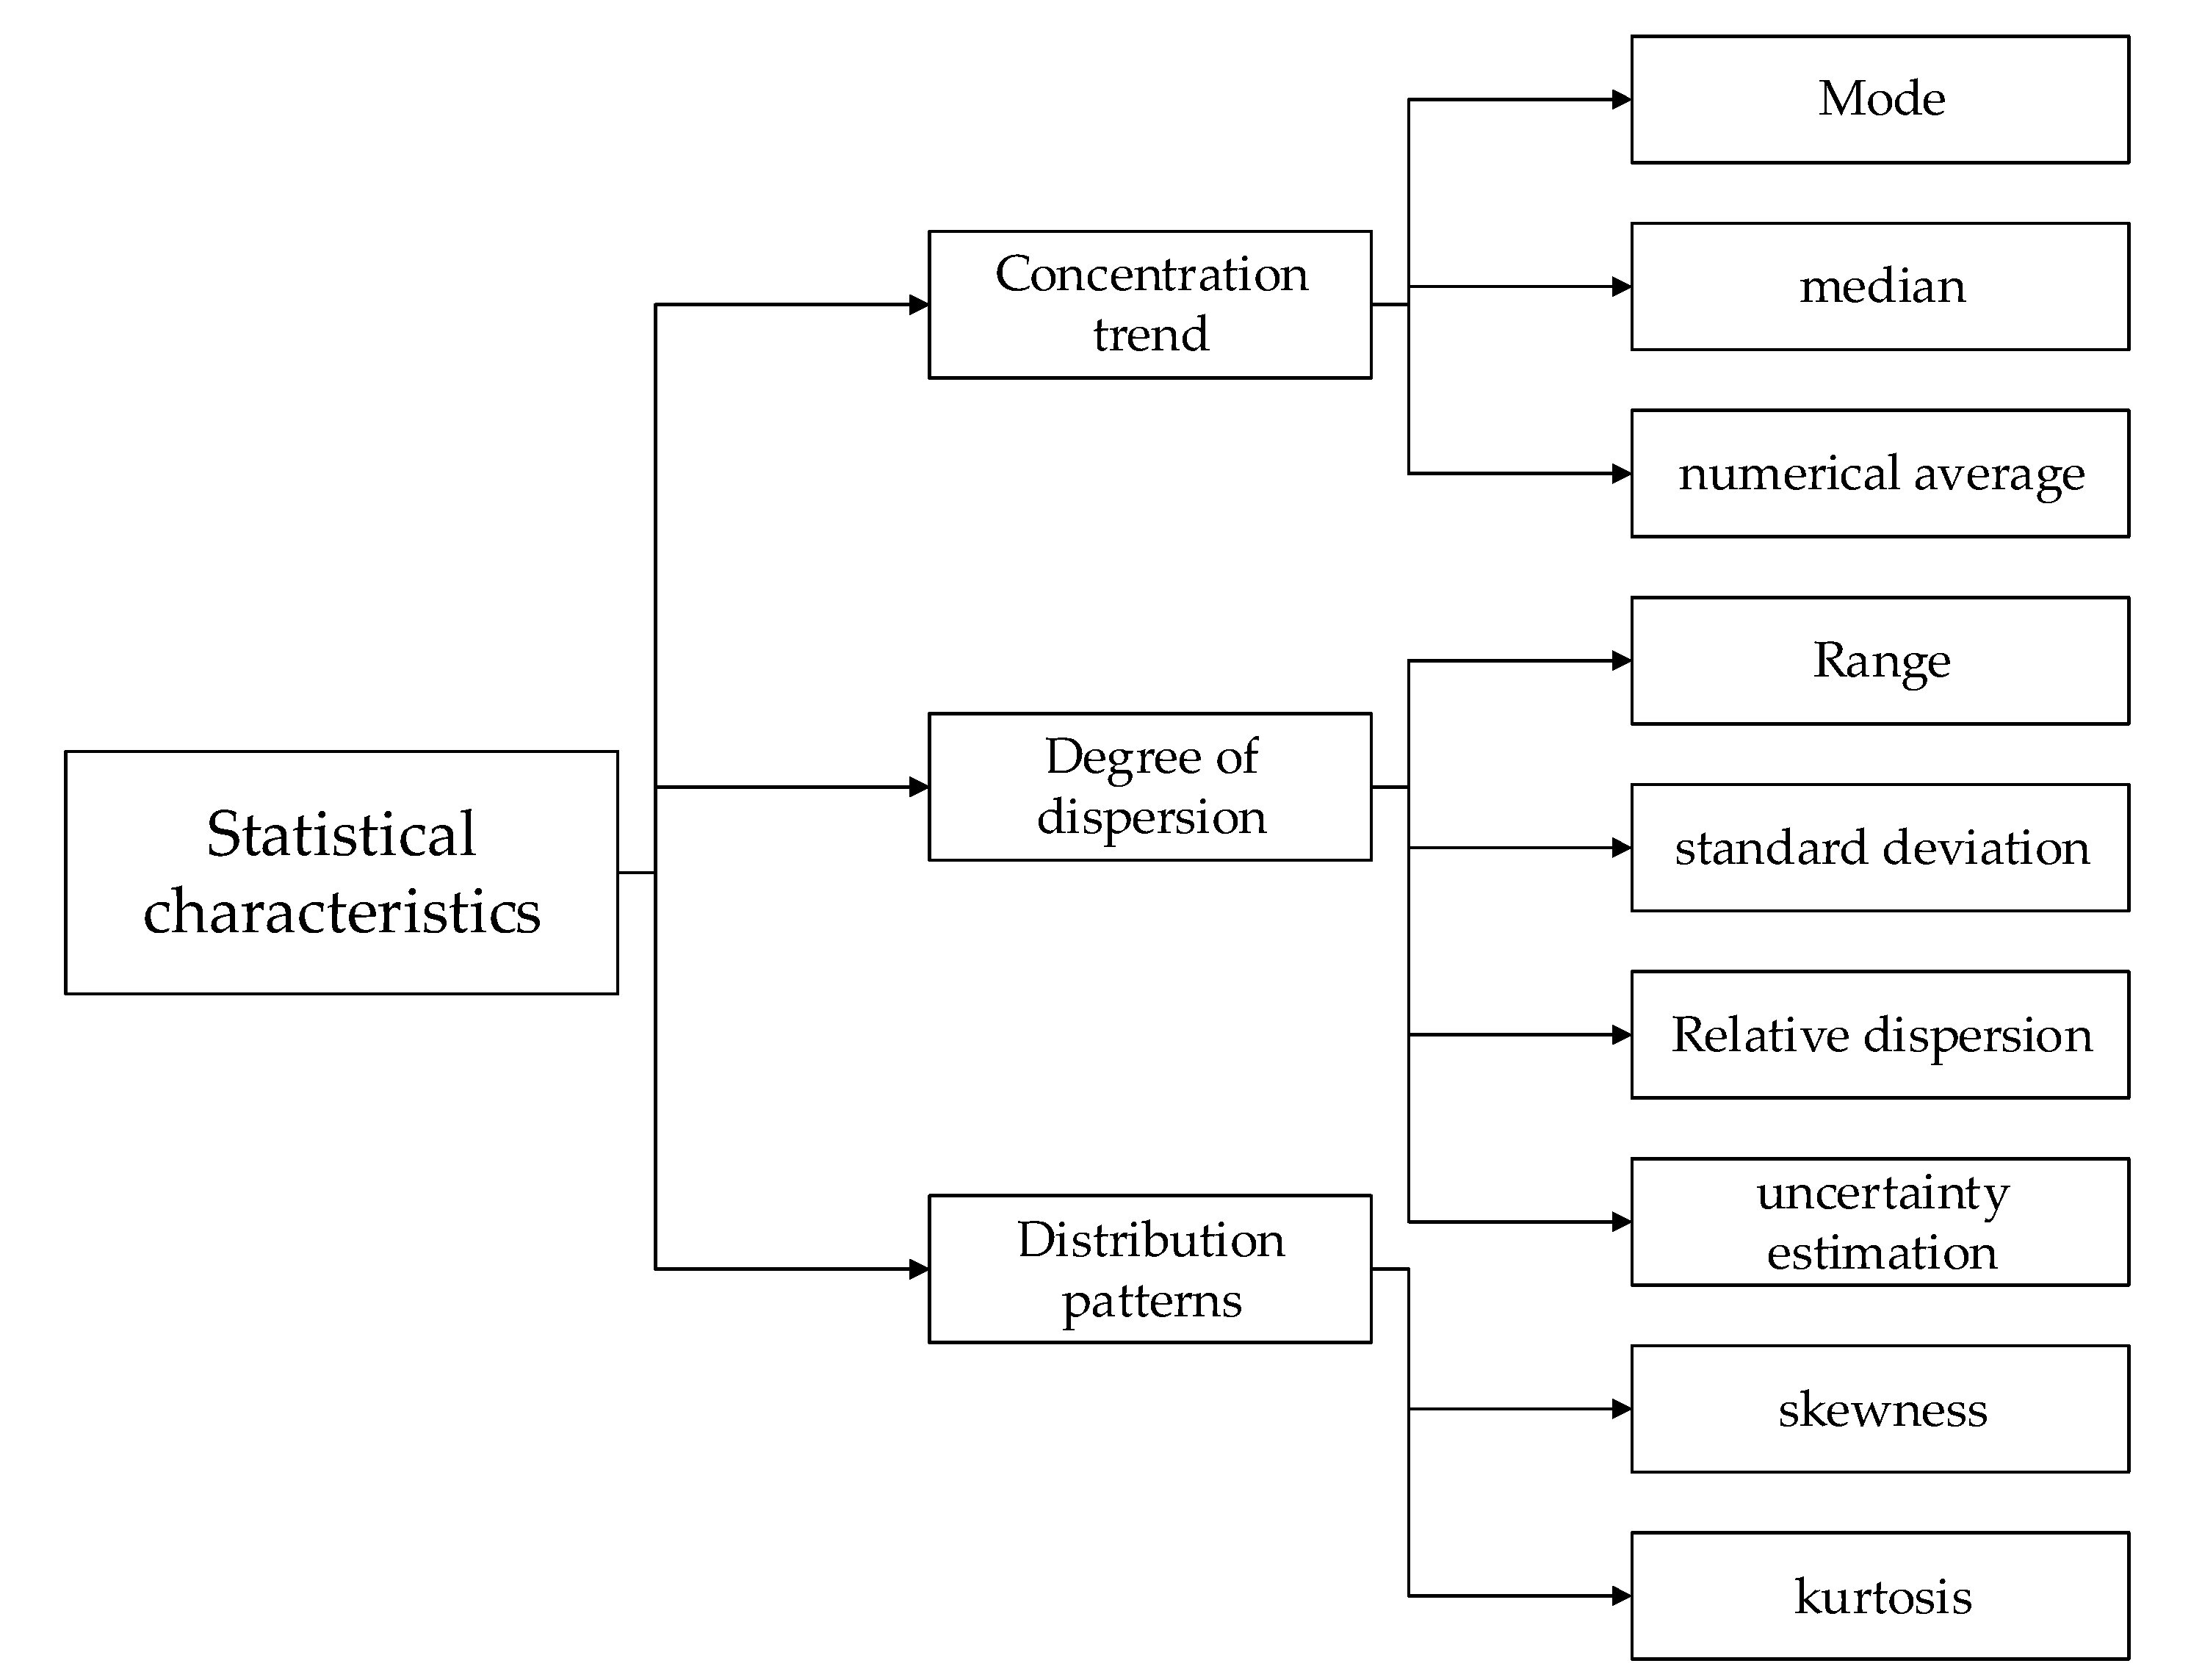
Therefore, in the process of correlation analysis between equipment process data and quality characteristic fluctuation data, it was necessary to preprocess the equipment process data and use its statistical characteristics for analysis. In the process of quality data analysis, its statistical characteristics mainly include concentration trend, dispersion degree and distribution form, as shown in Figure 2.
In the process of quality data preprocessing, to achieve a unified and standardized description of different processing processes with the same quality habit, the paper selects three indicators: numerical average (), standard deviation () and skewness () to express the quality data [32], and records the same kind of quality data formed by the processing process of quality resources on quality characteristics as .
Based on the previous analysis of the paper, the degree of fluctuation of the measured value of product quality characteristics was strongly related to the equipment process data of the processing process, as shown in Formula (5).
Formula (6) was obtained by replacing the equipment process data with its statistical characteristics, taking the spindle speed and feed rate of the machine tool as an example.
where and , respectively, represent the spindle speed and feed speed of the machine tool when processing the kth product.
In the process of processing, the transitivity of product quality leads to the transitivity of this relationship. There was also a correlation between the statistics of equipment process data at any time in the processing process and the measured value of product quality characteristics. We set ko as a random moment during the processing of the kth product, then Formula (7) was obtained.
3. Methods
3.1. Quality Data Collection
The processing process of the quality characteristic with a diameter of 10 mm in a part was selected as an example to introduce the method described in this paper.
Some studies [32,36] have pointed out that the equipment process data obtained from the processing equipment, including spindle power (P), spindle current (I), spindle speed (S) and feed speed (F), were related to the changes of product quality characteristics in the processing process. These data were used in the research. The study used these data and collected them at a frequency of 10 Hz. The data form is shown in Table 2.
3.2. Data Processing
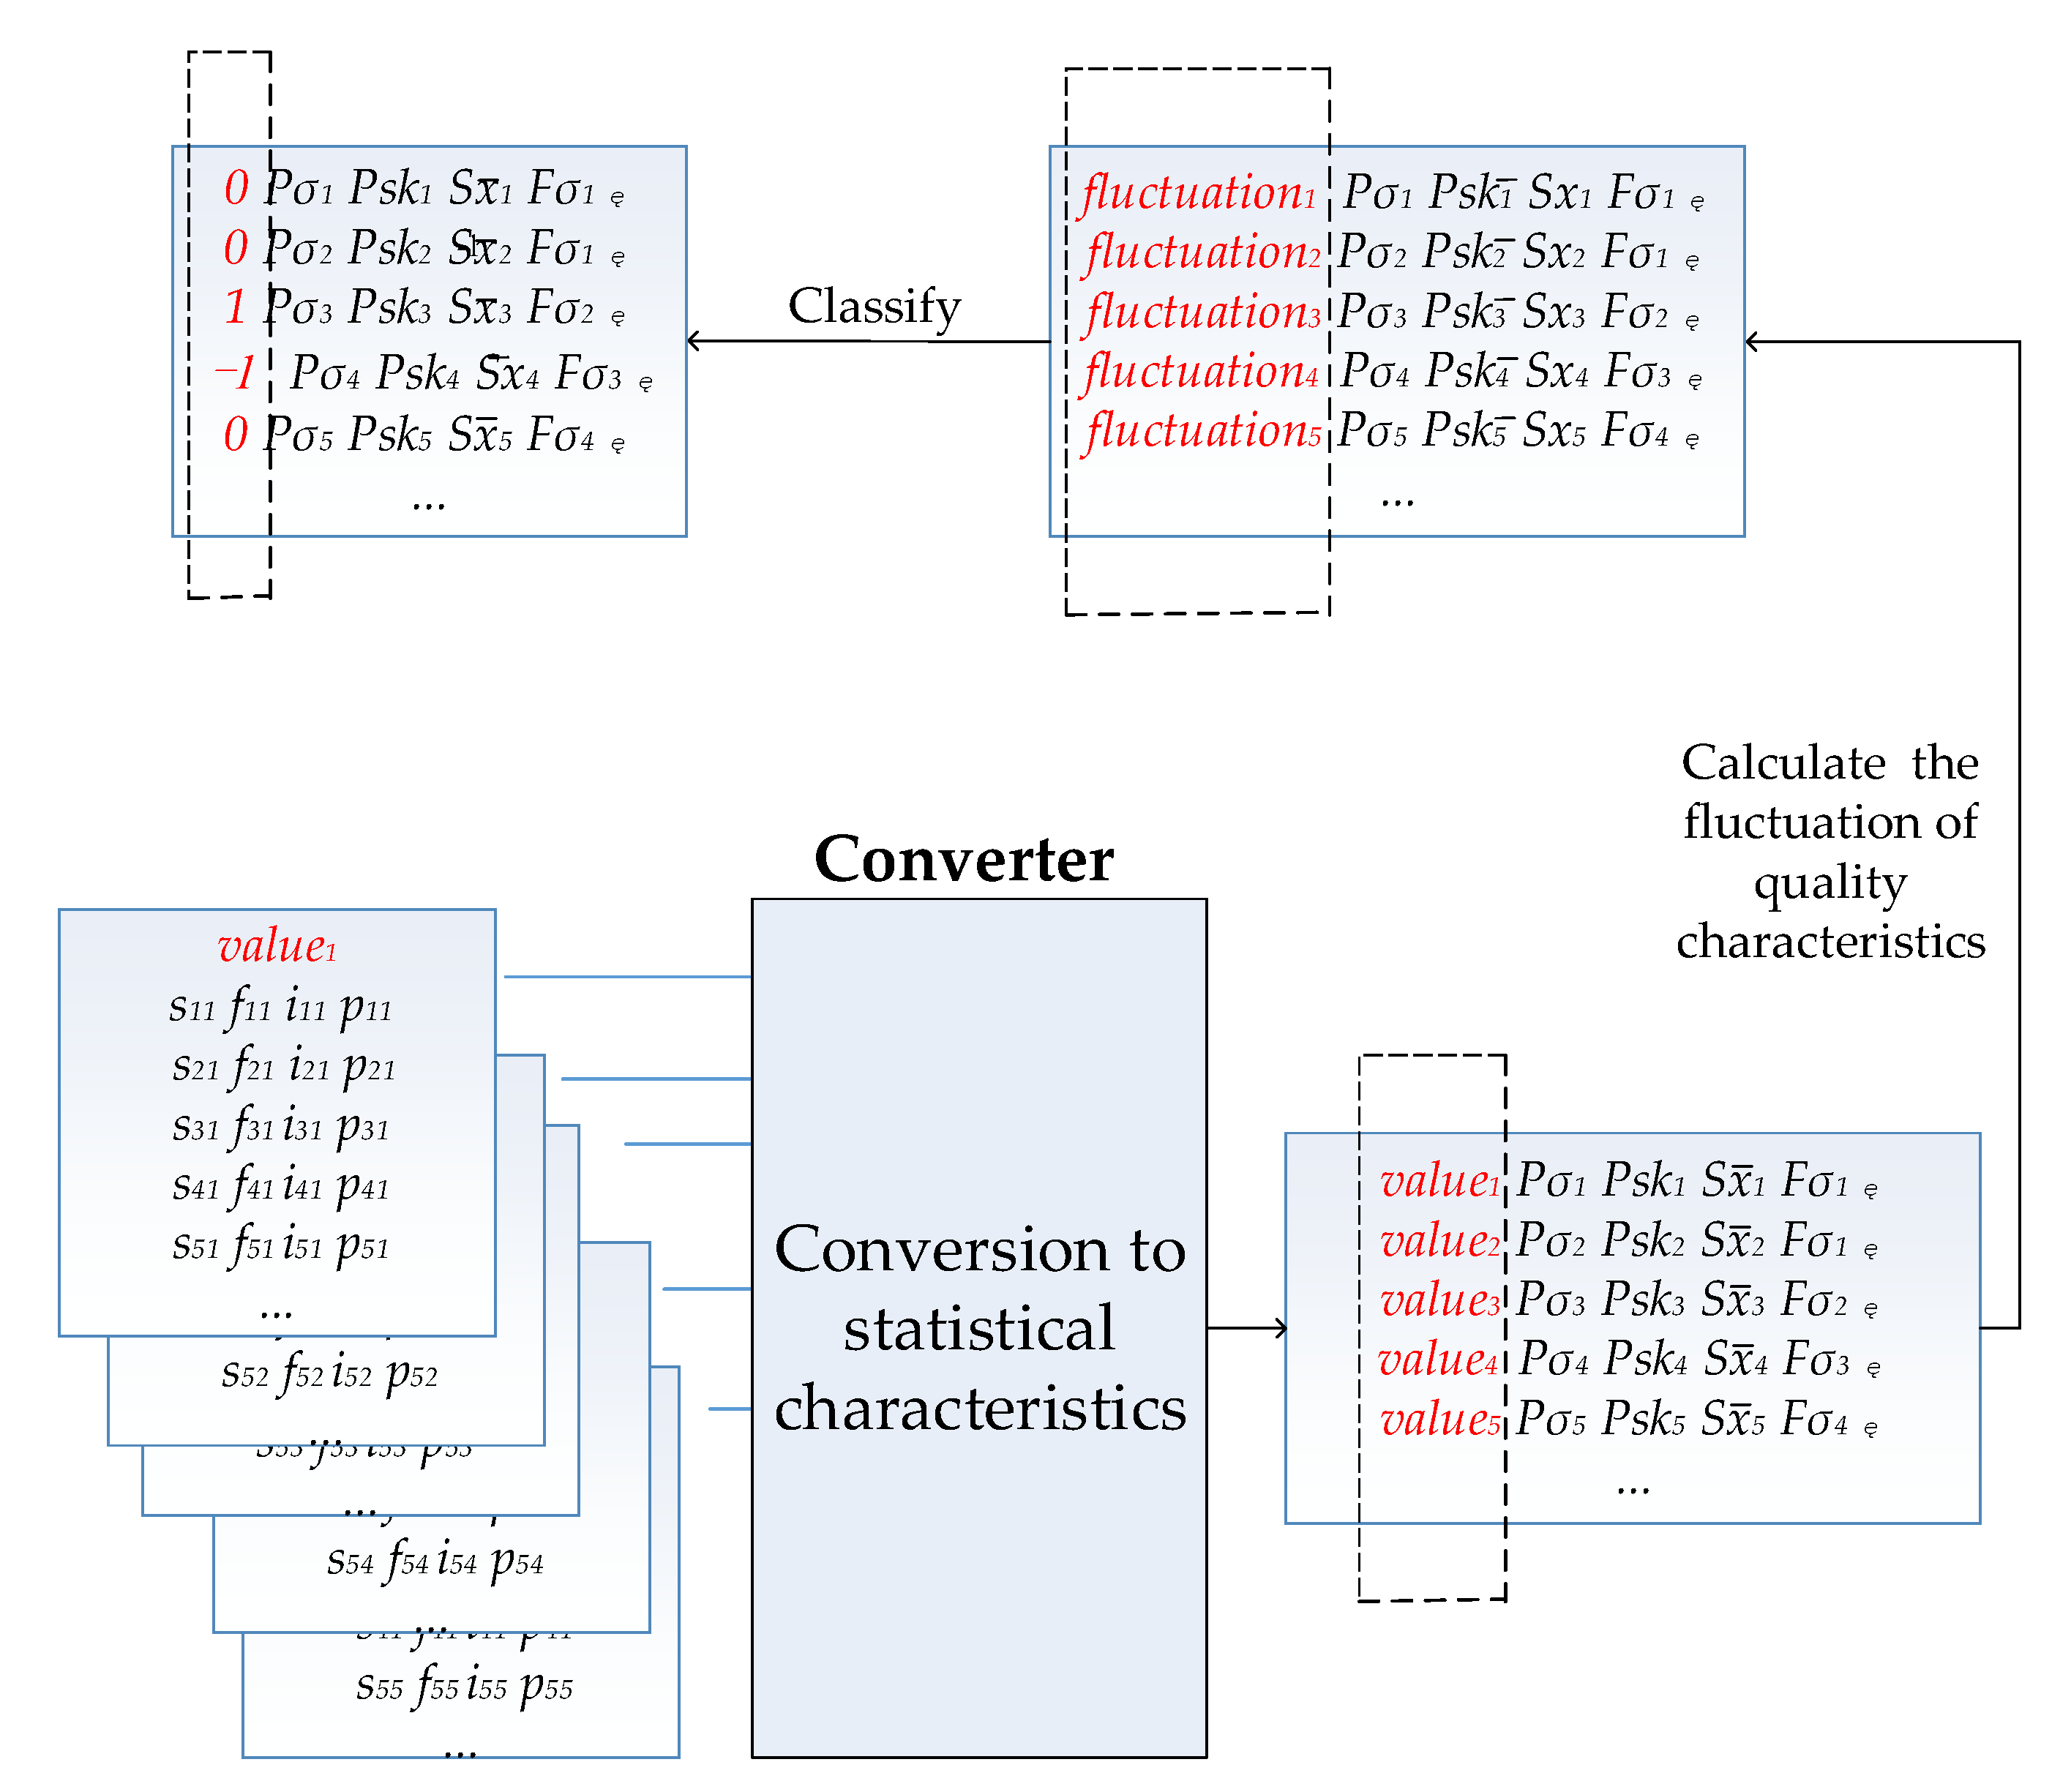
With the process of product processing, to ensure the training speed and prediction accuracy of the product quality control model, the paper preprocesses the equipment parameters and quality characteristics, calculates the numerical average (), standard deviation () and skewness () of various data, and combines the quality characteristics measurement values associated with them. The statistical characteristic value of the equipment process data was expressed in the form of “type + statistical method”. For example, represents the numerical average of the spindle power in the equipment process parameters generated when machining the kth part. The process is shown in Figure 3.
3.2.1. Data Processing of Equipment Parameters
Extract the equipment parameter information collected in the process of product processing, preprocess it and calculate the statistical characteristics of equipment parameters. The quality data obtained are shown in Table 3.
3.2.2. Processing the Measured Values of Product Quality Characteristics
After obtaining the statistical characteristics of the parameter values of the product processing equipment, the measured values of the product quality characteristic were processed.
Firstly, the normal distribution expression of quality data was fitted based on historical empirical quality characteristic measurement data.
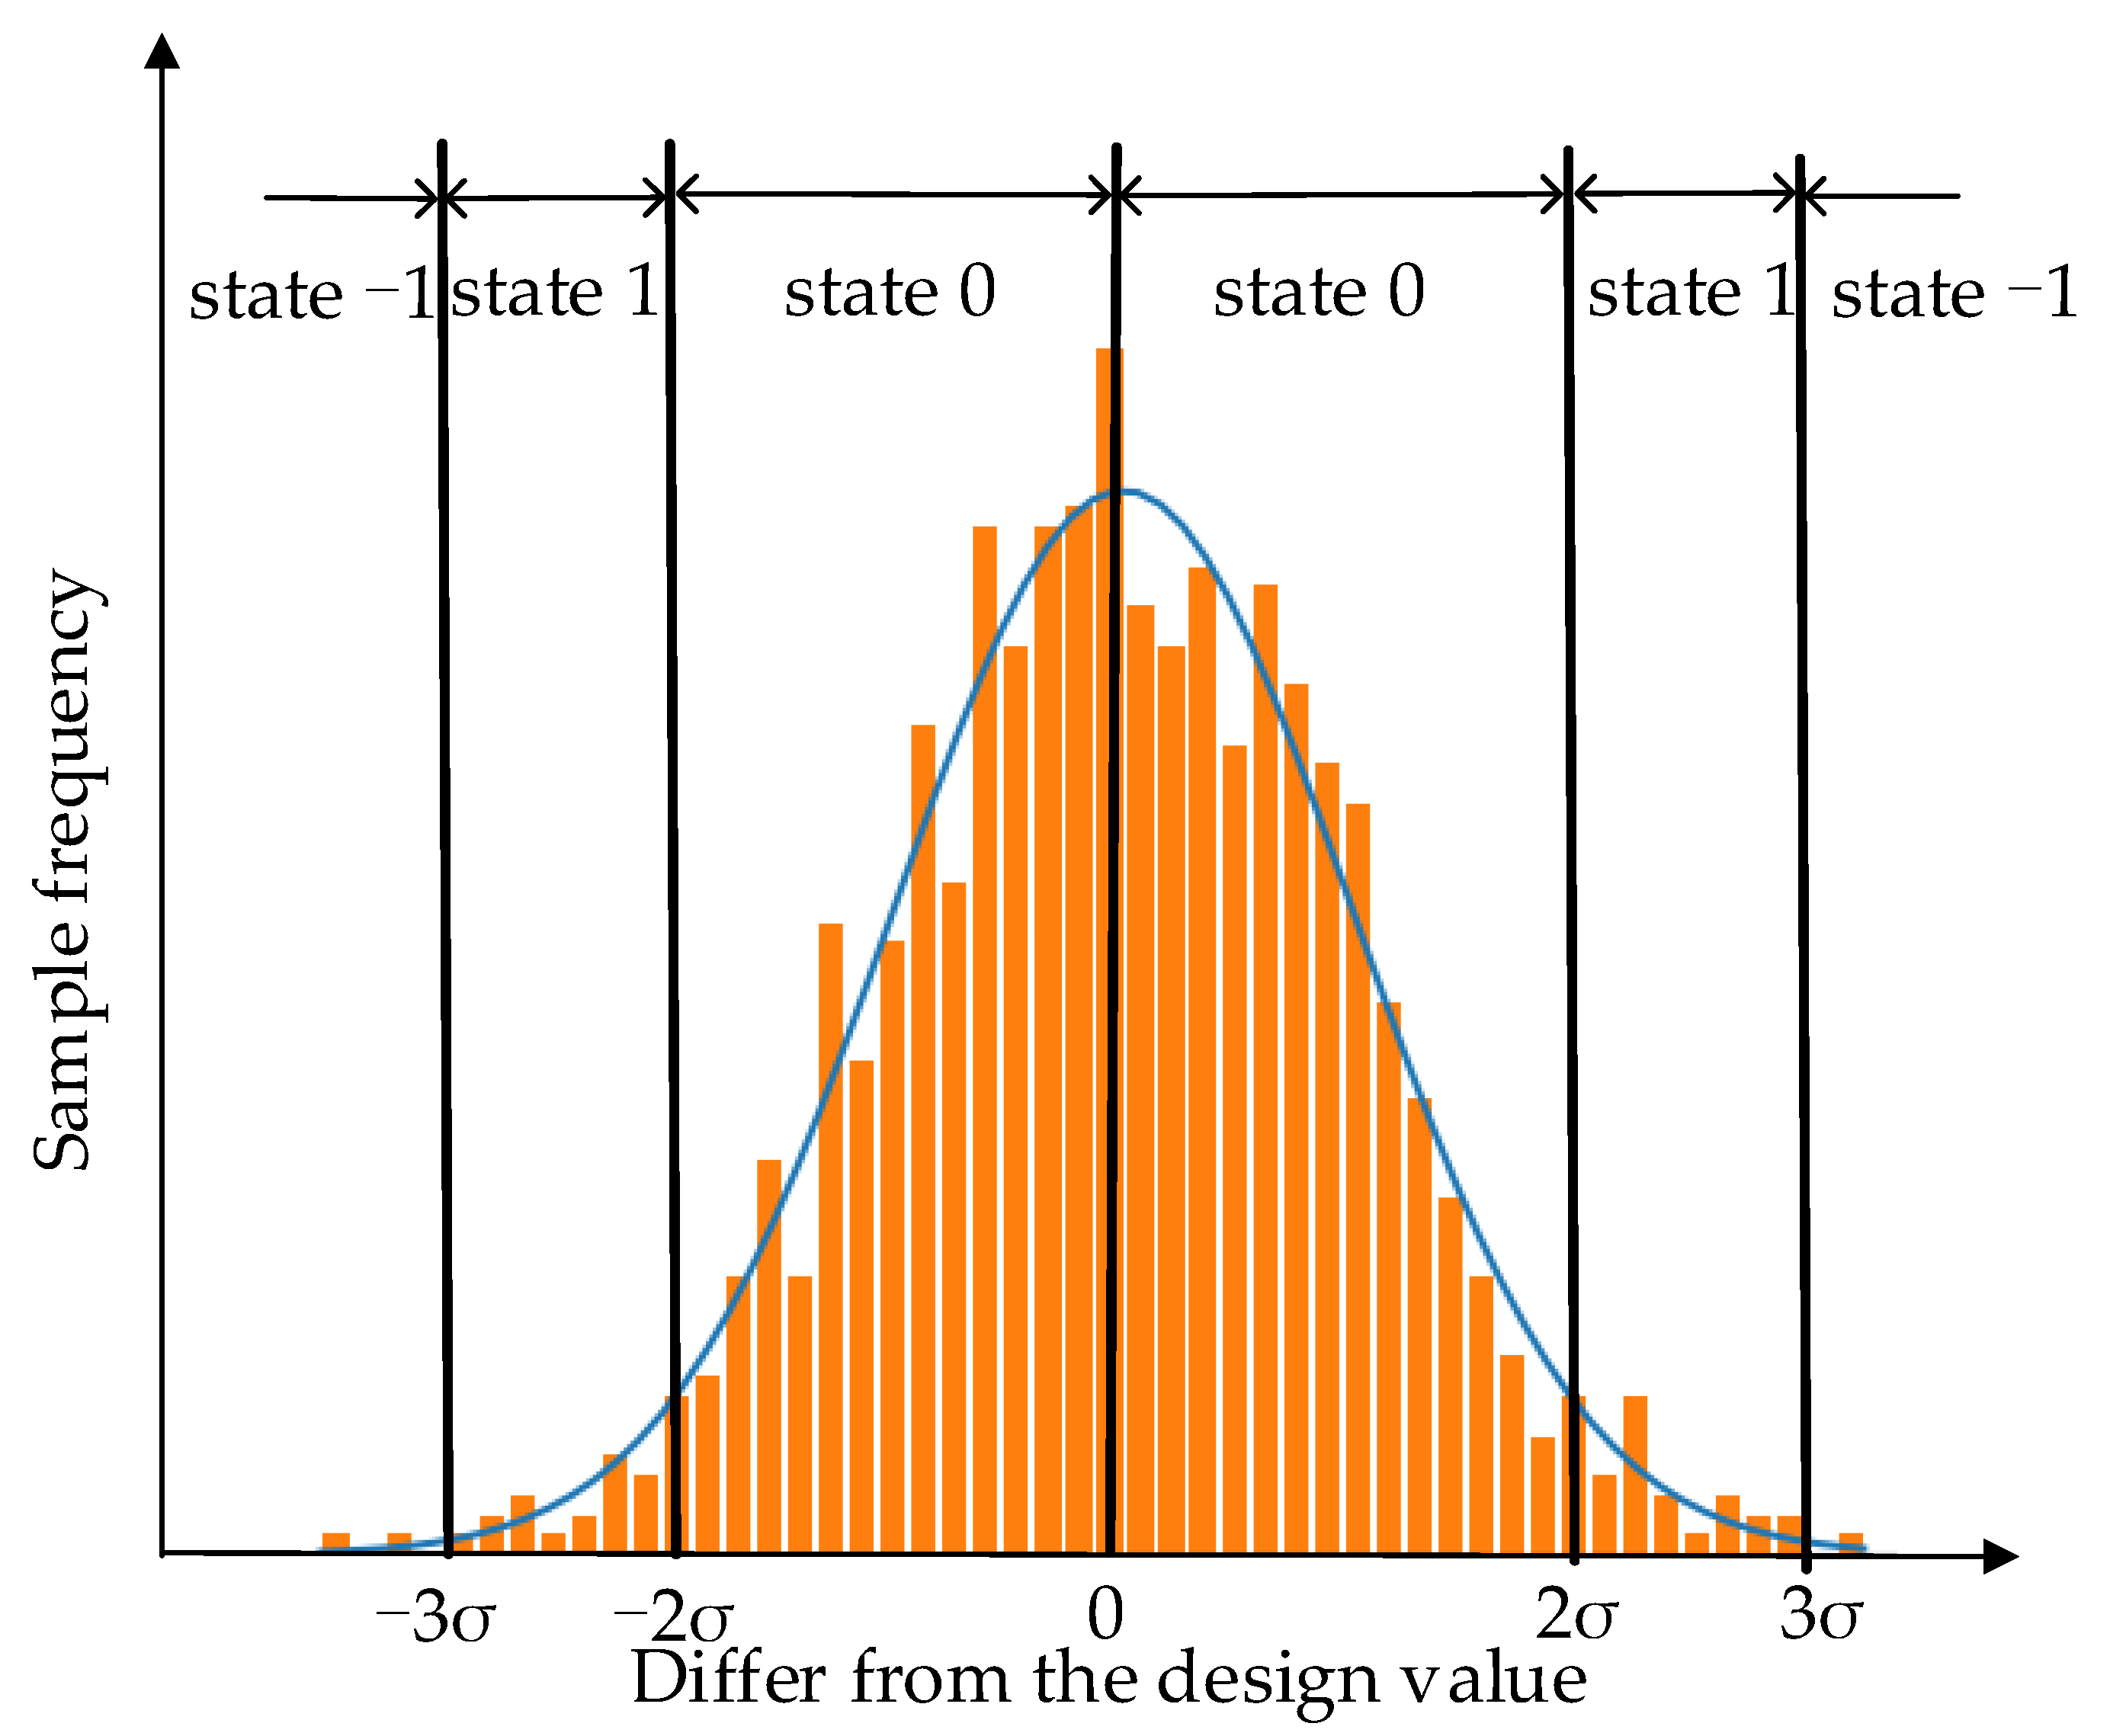
Secondly, according to the difference between the actual measured value and the design value, the measured values of the product quality characteristic were divided into three states: “state 0”, “state 1” and “state −1”. Where measured values that differ from the design value within 2σ were set to state “0”; measured values that differ from the design value between 2σ and 3σ were set to state “1”; and the remaining measured values were set to state “−1”.
The division method is shown in Table 4.
The division results are shown in Figure 4.
3.2.3. Model Training Data Preparation
It was assumed that there were relevant quality data of N products in the historical experience quality data. Take out the labeled quality characteristic measurement data to form an n × 1 matrix as the output of model training, and the rest as the input of model training. The input data and the output data were associated with a data processing unit ID.
3.3. Analysis of the Processing Process Quality Prediction Model
Based on the above analysis, it can be seen that the real-time prediction of product quality state in the processing process was essentially a classification process. To realize the construction of the real-time prediction model of the product processing process quality state, based on the above data, the SVM algorithm was used to analyze the correlation between equipment process data and product quality state fluctuation. SVMs were one of the most powerful and robust classification and regression algorithms in multiple fields of application [37]. SVM was first proposed in 1964. It was a supervised learning data classification algorithm, which has a good classification effect on massive high-dimensional data. Using the “SVM” function in the machine learning algorithm toolkit “sklearn”, this paper takes SVM as the core algorithm of the classification prediction model to complete the training of the real-time prediction model of the quality state of the product processing process.
In the process of model training, the precision and recall of the prediction results were used as the evaluation criteria of model training results. Among them, precision refers to the proportion of data that belongs to a certain category among all predicted data; recall rate refers to the proportion of all data belonging to a certain category that was predicted to be this category.
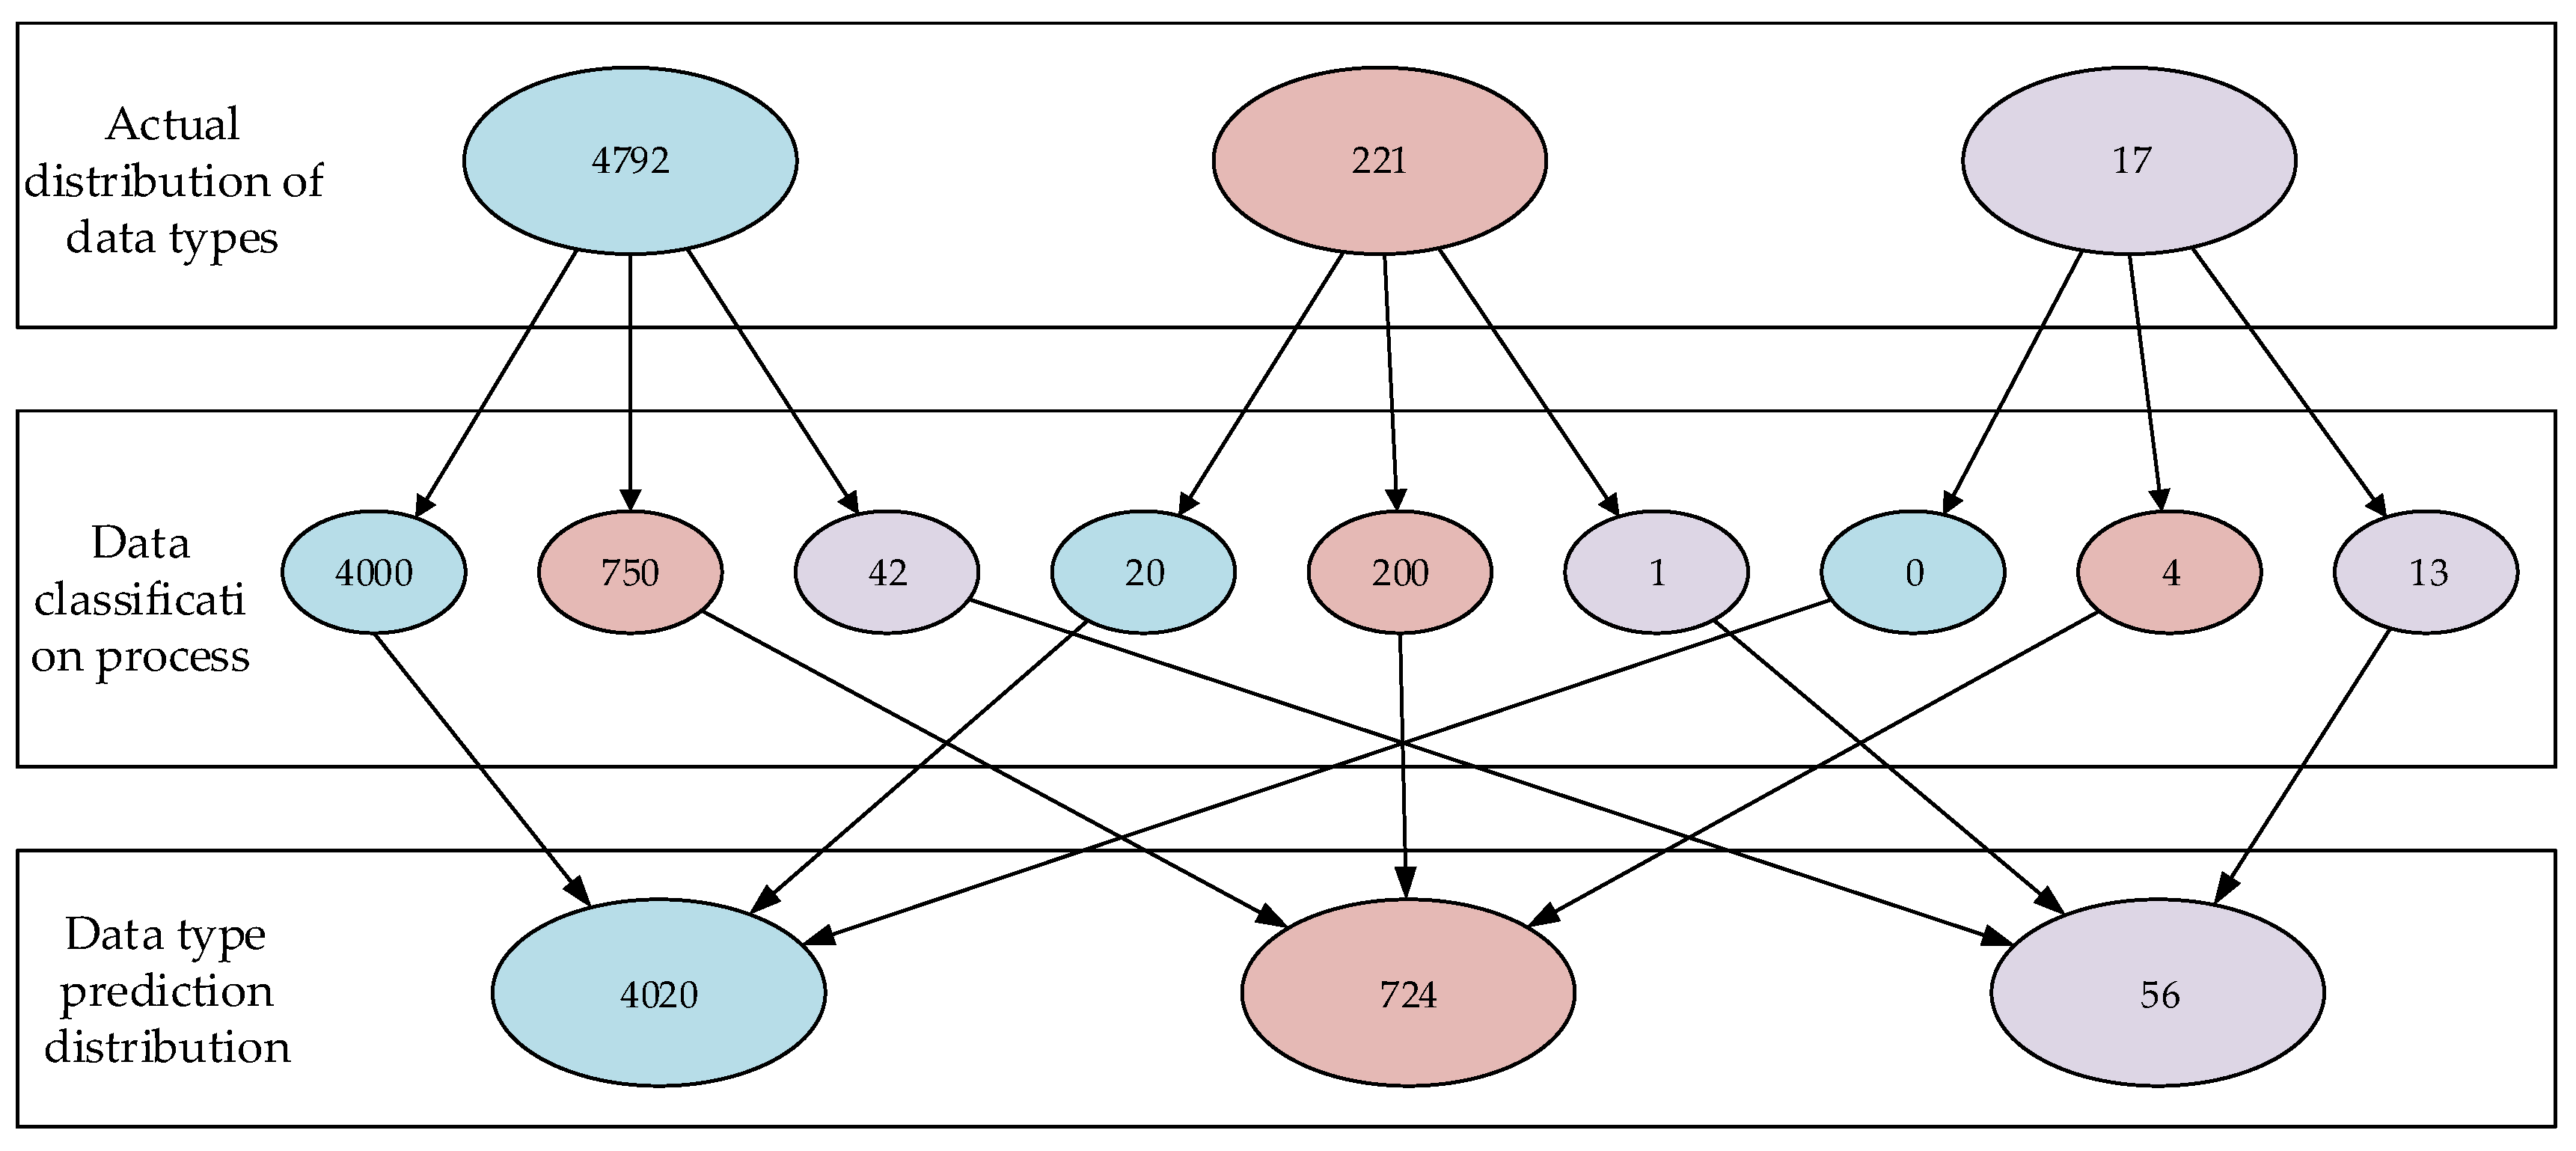
The model was trained with historical experience data. In the historical empirical data, there were 4792 data samples in “state 0”, 221 data samples in “state 2” and 16 data samples in “state 3”. The training results are shown in Table 5.
In the training set, the recall rates predicted by various types of data were 0.83, 0.90 and 0.76, respectively. The precision of the model for data of type state 0 was 0.98, and the accuracy for data of type “state 1” and “state−1” was low, which were 0.28 and 0.23, respectively. To deeply understand the prediction performance of the model, the prediction results of the model were further explored. The distribution of the prediction results of various types of training data is shown in Figure 5.
Through in-depth analysis of the training results, the main reason for the low accuracy rate of the model for the state “1” and the state “2” type data was its low proportion. The prediction error rates for state “1” and state “2” type data were 0.1 and 0.23, respectively.
In the application of the prediction model, the paper divides the error prediction into two types: type I error and type II error. Among them, the type I error refers to the positive sample data giving negative results, which will increase people’s involvement in the processing process; the type II error refers to the negative sample data giving positive prediction results, which will weaken the effect of the model to reduce the probability of quality problems. The probability of type I and type II errors is shown in Table 6.
Based on Table 6, the probability of identifying normal processing as exception processing was acceptable, and it identified exceptions well. The prediction results of the model can be used as a reference for its feedback information.
3.4. Model Application
In the process of product processing, the quality prediction model receives, processes and classifies the equipment process data to complete the real-time prediction of product quality characteristic fluctuation. With the progress of product processing, the paper visualized the predicted results of the model in the form of flow, and the predicted results flow of the fluctuation of quality characteristic was obtained, as shown in Figure 6.
Based on Figure 6, the processing capacity of an instantaneous equipment parameter in the product processing process was called the instantaneous capacity of the processing process in this paper.
The instantaneous capacity of processing process: the ability of each equipment process parameter to affect the product quality characteristic without causing quality problems at a certain time when the equipment processes the product.
In the predicted results flow, each predicted result was displayed as a prediction point. With the progress of the processing process, the prediction points were constantly updated based on the real-time equipment process data. When the position of the prediction point was in the “state 0” area, the instantaneous capacity of processing process of this time was strong. When the position of the prediction point was in the “state 1” area, the instantaneous capacity of processing process of this time was medium; When the position of the prediction point was in the “state −1” area, the instantaneous capacity of processing process of this time was weak.
The instantaneous capability of processing process was a measure of whether the production process can continue. In the process of product processing, the rationality of equipment process parameters can be judged based on the instantaneous capability of processing process. When the instantaneous capacity of processing process was “weak”: firstly, the prediction calculation results should be fed back to the processing equipment to stop the product processing process; secondly, obtain the real-time quality status of the product through suitable measurement methods (on-machine measurement, coordinate measuring, laser scanning, etc.); finally, based on the real-time quality status, a processing program for continuing the process of processing the product was formed, and the product continued to be processed.
Based on the real-time analysis of the instantaneous capacity of processing process, the preventive quality management of the processing process was realized through the above methods, which can reduce the probability of product quality problems and reduce the processing cost of products.
As a basis for future research, the research results can be applied to the adjustment of processing parameters in order to further reduce the probability of quality problems occurring.
4. Conclusions
This paper discusses the relationship between the dynamic changes in equipment parameters and the fluctuation of product quality characteristics during product processing. A prediction mechanism for product quality status during processing was constructed. According to the difference between the actual measured value and the design value, the measured values of the product quality characteristic were divided into three states: “state 0”, “state 1” and “state −1”. The SVM was used to classify the statistical values of equipment parameters in product processing to realize the dynamic prediction of product quality. The probability of identifying positive sample data as negative results and negative sample data as positive results was 0.86% and 0.08%, respectively. It was acceptable in practice. This prediction mechanism could be applied in quality management to promote the real-time improvement of product quality. This study could provide suggestions for equipment parameter adjustment during product processing. It could also play an important role in the construction of smart factory or digital twin. The contribution of this study lies in the following aspects.
Considering practicality, there are still some issues worth further discussion. For example, in this study, only the dynamic data collected from the processing equipment were used in the prediction of the quality characteristic state in the product processing process. The role of dynamic data collected from the other manufacturing resources in the formation of product quality characteristics was not studied. In future research, this should be improved. Furthermore, as the product manufacturing process proceeds, more and more empirical data were accumulated. While the prediction model of the product quality characteristic state became more and more accurate, the prediction speed also decreases. In future research, how to balance the accuracy and speed of the results should be a worthwhile study. Further research is needed.
Author Contributions
Methodology, X.Y.; software, X.Y.; validation, X.Y.; formal analysis, X.Y.; investigation, X.Y.; writing—original draft preparation, X.Y.; writing—review and editing, G.D.; supervision, G.D.; project administration, G.D.; funding acquisition, G.D. All authors have read and agreed to the published version of the manuscript.
Funding
This research was funded by Innovation Foundation of Beige, grant number BG-202009-002, Innovation Foundation of Jingdezhen Institute, grant number IF20210101, and Innovation Foundation of JCKY, grant number 2020205*013.
Institutional Review Board Statement
Not applicable.
Informed Consent Statement
Not applicable.
Data Availability Statement
Not applicable.
Conflicts of Interest
The authors declare no conflict of interest.
References
- Minglun, R.; Yueli, S. Big data: New perspective of process quality control and improvement driven by data. Comput. Integr. Manuf. Syst. 2019, 25, 2731–2742. [Google Scholar]
- Chen, Y.; Ma, Y.; Zhang, D.; Tang, J. Research on Modeling Method for Equipment Maintenance Strategy Based on Reliability and Residual Life. Appl. Mech. Mater. 2012, 215–216, 817–825. [Google Scholar] [CrossRef]
- Meng, Q.; He, C. Overall Design and Quality Control of Equipment Based on Virtual Prototyping; Springer: Berlin/Heidelberg, Germany; pp. 704–711.
- Selcuk, S. Predictive maintenance, its implementation and latest trends. Proc. Inst. Mech. Engineers. Part B J. Eng. Manuf. 2017, 231, 1670–1679. [Google Scholar] [CrossRef]
- Zhang, Z.; He, X. Fault-Structure-Based Active Fault Diagnosis: A Geometric Observer Approach. Energies 2020, 13, 4475. [Google Scholar] [CrossRef]
- Mouzakitis, A. Classification of Fault Diagnosis Methods for Control Systems. Meas. Control. 2013, 46, 303–308. [Google Scholar] [CrossRef]
- Samanta, B.; Al-Balushi, K.R. Artificial Neural Network Based Fault Diagnostics of Rolling Element Bearings Using Time-Domain Features. Mech. Syst. Signal Process. 2003, 17, 317–328. [Google Scholar] [CrossRef]
- Pech, M.; Vrchota, J.; Bednář, J. Predictive Maintenance and Intelligent Sensors in Smart Factory: Review. Sensors 2021, 21, 1470. [Google Scholar] [CrossRef]
- Zhao, Y.; Qian, F.; Gao, Y. Data Driven Die Casting Smart Factory Solution; Springer: Singapore, 2018; pp. 13–21. [Google Scholar]
- Tao, F.; Qi, Q. New IT Driven Service-Oriented Smart Manufacturing Framework and Characteristics. IEEE Trans. Syst. Man Cybern. Syst. 2019, 49, 81–91. [Google Scholar] [CrossRef]
- Liu, Y.; Zhou, H.; Zhang, S. A MSVM Quality Pattern Recognition Model for Dynamic Process. Appl. Mech. Mater. 2013, 433, 555–561. [Google Scholar] [CrossRef]
- Zeng, X.; Li, G. Incremental partial least squares analysis of big streaming data. Pattern Recogn. 2014, 47, 3726–3735. [Google Scholar] [CrossRef] [Green Version]
- Wang, D.; Liu, J.; Srinivasan, R. Data-Driven Soft Sensor Approach for Quality Prediction in a Refining Process. IEEE Trans. Ind. Inform. 2010, 6, 11–17. [Google Scholar] [CrossRef]
- Wardell, D.G.; Moskowitz, H.; Plante, R.D. Control Charts in the Presence of Data Correlation. Manage. Sci. 1992, 38, 1084–1105. [Google Scholar] [CrossRef]
- Zhao, C.; Wang, F.; Mao, Z.; Lu, N.; Jia, M. Improved Batch Process Monitoring and Quality Prediction Based on Multiphase Statistical Analysis. Ind. Eng. Chem. Res. 2008, 47, 835–849. [Google Scholar] [CrossRef]
- Zhao, L.; Diao, G.; Yao, Y. A Dynamic Process Adjustment Method Based on Residual Prediction for Quality Improvement. IEEE Trans. Ind. Inform. 2016, 12, 41–50. [Google Scholar] [CrossRef]
- Venkata Rao, K.; Murthy, P.B.G.S.N. Modeling and optimization of tool vibration and surface roughness in boring of steel using RSM, ANN and SVM. J. Intell. Manuf. 2018, 29, 1533–1543. [Google Scholar] [CrossRef]
- Jamali, A.; Nariman-zadeh, N.; Darvizeh, A.; Masoumi, A.; Hamrang, S. Multi-objective evolutionary optimization of polynomial neural networks for modelling and prediction of explosive cutting process. Eng. Appl. Artif. Intel. 2009, 22, 676–687. [Google Scholar] [CrossRef]
- Liu, T.; Liu, R.; Duan, G. A principle-empirical model based on Bayesian network for quality improvement in mechanical products development. Comput. Ind. Eng. 2020, 149, 106807. [Google Scholar] [CrossRef]
- Yao, L.; Ge, Z. Big data quality prediction in the process industry: A distributed parallel modeling framework. J. Process Contr. 2018, 68, 1–13. [Google Scholar] [CrossRef]
- Petković, D. Prediction of laser welding quality by computational intelligence approaches. Optik 2017, 140, 597–600. [Google Scholar] [CrossRef]
- Shanavas, S.; Dhas, J.E.R. Quality Prediction of Friction Stir Weld Joints on AA 5052 H32 Aluminium Alloy Using Fuzzy Logic Technique. Mater. Today Proc. 2018, 5, 12124–12132. [Google Scholar] [CrossRef]
- Yu, J.; Xi, L. Intelligent monitoring and diagnosis of manufacturing process using an integrated approach of neural network ensemble and genetic algorithm. Int. J. Comput. Appl. Technol. 2008, 33, 489–501. [Google Scholar] [CrossRef]
- Wu, B.; Yu, J. A neural network ensemble model for on-line monitoring of process mean and variance shifts in correlated processes. Expert Syst. Appl. 2010, 37, 4058–4065. [Google Scholar] [CrossRef]
- Zaman, B.; Riaz, M.; Ahmad, S.; Abbasi, S.A. On artificial neural networking-based process monitoring under bootstrapping using runs rules schemes. Int. J. Adv. Manuf. Technol. 2015, 76, 311–327. [Google Scholar] [CrossRef]
- Feng, K.; Lu, J.; Chen, J. Nonlinear model predictive control based on support vector machine and genetic algorithm. Chin. J. Chem. Eng. 2015, 23, 2048–2052. [Google Scholar] [CrossRef]
- Rowlands, H.; Wang, L. An approach of fuzzy logic evaluation and control in SPC. Qual. Reliab. Eng. Int. 2000, 16, 91–98. [Google Scholar] [CrossRef]
- Duan, G.; Yan, X. A Real-Time Quality Control System Based on Manufacturing Process Data. IEEE Access 2020, 8, 208506–208517. [Google Scholar] [CrossRef]
- Duan, G.; Wang, Y. QCs-linkage model based quality problem processing framework: A Chinese experience in complex product development. J. Intell. Manuf. 2013, 26, 239–254. [Google Scholar] [CrossRef]
- Duan, G.; Wang, Y. QCs-linkage model based quality characteristic variation propagation analysis and control in product development. Int. J. Prod. Res. 2013, 51, 6573–6593. [Google Scholar] [CrossRef]
- Lee, G.-Y.; Kim, M.; Quan, Y.-J.; Kim, M.-S.; Kim, T.J.Y.; Yoon, H.-S.; Min, S.; Kim, D.-H.; Mun, J.-W.; Oh, J.W.; et al. Machine health management in smart factory: A review. J. Mech. Sci. Technol. 2018, 32, 987–1009. [Google Scholar] [CrossRef]
- Wang, C.; Duan, G.; Liu, R.; Han, X.; Sung, W.; Han, T. Research on Correlation Analysis between Process Parameters of NC Machining and Quality Data Based on Grey Relational Analysis. MATEC Web Conf. 2018, 175, 3053. [Google Scholar] [CrossRef]
- Jiang, J.; Kong, C.; Zhou, X.; Liu, W.; Niu, Q. Research on Key Technology of CNC Machine Tool Intelligent Monitoring System for Smart Factory. Adv. Manuf. Technol. XXXI 2017, 6, 142–147. [Google Scholar] [CrossRef]
- Zhou, G.; Wang, B.; Xiao, Z.; Jiang, P. An Improving Approach for 6 sigma-based Multi-process Machining Environment. Adv. Manuf. Technol. 2011, 314–316, 2524. [Google Scholar] [CrossRef]
- Park, B.; Jeong, J. A CPS-Based IIoT Architecture Using Level Diagnostics Model for Smart Factory; Springer International Publishing: New York, NY, USA, 2020; pp. 577–587. [Google Scholar]
- Wang, C.; Duan, G.; Sun, W.; Sung, W.; Han, T. Research on Quality Control of Digital Production Lines in Aviation Enterprises. MATEC Web Conf. 2018, 175, 3054. [Google Scholar] [CrossRef]
- Cervantes, J.; Garcia-Lamont, F.; Rodríguez-Mazahua, L.; Lopez, A. A comprehensive survey on support vector machine classification: Applications, challenges and trends. Neurocomputing 2020, 408, 189–215. [Google Scholar] [CrossRef]
Figure 1.
The data processing unit.

Figure 2.
Statistical characteristics of the quality data.

Figure 3.
Acquisition and processing of sample data.

Figure 4.
Status distribution of measured values of the quality characteristic.

Figure 5.
The distribution of prediction results of various types.

Figure 6.
The application of prediction model.


Table 1.
Classification results of equipment process data.
| Type of Equipment Process Data | Equipment Process Parameters |
|---|---|
| static process data | Operator’s technical level, name, gender, age, etc.; equipment type, power-on status, tool number, life, workpiece count, etc. |
| direct dynamic process data | tool coordinate location, fault, etc. |
| indirect dynamic process data | spindle power, spindle current, spindle speed, feed rate, etc. |
Table 2.
Equipment parameters collected during product processing.
| Part | Measurement of the Quality Characteristic (mm) | P (KW) | I (A) | S (r/min) | F (mm/min) |
|---|---|---|---|---|---|
| part1 | 10.00 | 7.34 | 19.21 | 2030.00 | 1015.00 |
| 7.25 | 18.86 | 2013.00 | 1006.00 | ||
| 7.25 | 19.07 | 1991.00 | 995.00 | ||
| 7.32 | 19.25 | 2053.00 | 1026.00 | ||
| … | … | … | … | ||
| 7.3 | 19.32 | 2070.00 | 1035.00 | ||
| 7.29 | 19.19 | 2029.00 | 1014.00 | ||
| 7.17 | 19.07 | 2012.00 | 1006.00 | ||
| part2 | 10.10 | 7.29 | 19.07 | 2053.00 | 1006.00 |
| 7.29 | 19.07 | 2012.00 | 1035.00 | ||
| … | … | … | … | ||
| Part… | … | … | … | … |
Table 3.
Statistical characteristics of processing equipment parameters.
| Measurement of the Quality Characteristic | Pσ | Psk | Iσ | Isk | Sσ | Ssk | Fσ | Fsk | ||||
|---|---|---|---|---|---|---|---|---|---|---|---|---|
| 10.00 | 7.30 | 0.01 | −0.40 | 19.21 | 0.03 | −0.40 | 2030.10 | 5.11 | −0.07 | 1015.05 | 2.55 | −0.07 |
| 10.10 | 7.25 | 0.01 | −0.32 | 19.07 | 0.02 | −0.32 | 2013.55 | 4.92 | −0.35 | 1006.77 | 2.46 | −0.35 |
| 10.20 | 7.17 | 0.03 | −0.34 | 18.86 | 0.08 | −0.34 | 1991.82 | 6.26 | −0.48 | 995.91 | 3.13 | −0.48 |
| 9.90 | 7.32 | 0.02 | −0.46 | 19.25 | 0.05 | −0.46 | 2053.73 | 6.51 | 1.09 | 1026.86 | 3.26 | 1.09 |
| … | … | … | … | … | … | … | … | … | … | … | … | … |
| 9.70 | 7.34 | 0.02 | 0.15 | 19.32 | 0.05 | 0.15 | 2070.27 | 13.06 | 0.04 | 1035.14 | 6.53 | 0.04 |
| 10.20 | 7.29 | 0.02 | −1.26 | 19.19 | 0.05 | −1.26 | 2029.18 | 5.67 | −0.07 | 1014.59 | 2.83 | −0.07 |
| 10.00 | 7.25 | 0.01 | −0.22 | 19.07 | 0.02 | −0.22 | 2012.90 | 4.70 | −0.28 | 1006.45 | 2.35 | −0.28 |
Table 4.
Division method of the measured values of the product quality characteristic.
| State of Measured Value | The Division Method | |
|---|---|---|
| 1 | state 0 | measured values that differ from the design value within 2σ |
| 2 | state 1 | measured values that differ from the design value between 2σ and 3σ |
| 3 | state −1 | measured values that differ by more than 2σ from the design value |
Table 5.
Product quality characteristics predict model performance.
| Quality Characteristic State | Precision | Recall | Support |
|---|---|---|---|
| state 0 | 98% | 83% | 4792 |
| state 1 | 28% | 90% | 221 |
| state −1 | 23% | 76% | 16 |
Table 6.
Probability of type I and type II errors.
| Type | Number of Mispredictions | Probability |
|---|---|---|
| type I error | 43 | 0.86% |
| type II error | 4 | 0.08% |
Publisher’s Note: MDPI stays neutral with regard to jurisdictional claims in published maps and institutional affiliations. |
© 2022 by the authors. Licensee MDPI, Basel, Switzerland. This article is an open access article distributed under the terms and conditions of the Creative Commons Attribution (CC BY) license (https://creativecommons.org/licenses/by/4.0/).
Share and Cite
MDPI and ACS Style
Yan, X.; Duan, G. The Real-Time Prediction of Product Quality Based on the Equipment Parameters in a Smart Factory. Processes 2022, 10, 967. https://0-doi-org.brum.beds.ac.uk/10.3390/pr10050967
AMA Style
Yan X, Duan G. The Real-Time Prediction of Product Quality Based on the Equipment Parameters in a Smart Factory. Processes. 2022; 10(5):967. https://0-doi-org.brum.beds.ac.uk/10.3390/pr10050967
Chicago/Turabian StyleYan, Xin, and Guijiang Duan. 2022. "The Real-Time Prediction of Product Quality Based on the Equipment Parameters in a Smart Factory" Processes 10, no. 5: 967. https://0-doi-org.brum.beds.ac.uk/10.3390/pr10050967
Note that from the first issue of 2016, this journal uses article numbers instead of page numbers. See further details here.