Article

Hydrothermal Pretreatment of Wheat Straw—Evaluating the Effect of Substrate Disintegration on the Digestibility in Anaerobic Digestion

1
Department Biochemical Conversion, DBFZ Deutsches Biomasseforschungszentrum gemeinnützige GmbH, Torgauer Straße 116, D-04347 Leipzig, Germany
2
State Institute of Agricultural Engineering and Bioenergy, University of Hohenheim, Garbenstraße 9, D-70599 Stuttgart, Germany
3
Department Waste and Resource Management, University of Rostock, Justus-von-Liebig Weg 6, D-18057 Rostock, Germany
*
Author to whom correspondence should be addressed.
Submission received: 29 April 2022 / Revised: 19 May 2022 / Accepted: 20 May 2022 / Published: 24 May 2022
(This article belongs to the Special Issue New Frontiers in Anaerobic Digestion (AD) Processes)

Abstract

:
The increasing demand for renewable energy sources and demand-oriented electricity provision makes anaerobic digestion (AD) one of the most promising technologies. In addition to energy crops, the use of lignocellulosic residual and waste materials from agriculture is becoming increasingly important. However, AD of such feedstocks is often associated with difficulties due to the high content of lignocellulose and its microbial persistence. In the present work, the effect of hydrothermal pretreatment (HTP) on the digestibility of wheat straw is investigated and evaluated. Under different HTP temperatures (160–180 °C) and retention times (15–45 min), a significant increase in biomethane potential (BMP) can be observed in all cases. The highest BMP (309.64 mL CH4 g−1 volatile solid (VS) is achieved after pretreatment at 160 °C for 45 min, which corresponds to an increase of 19% of untreated wheat straw. The results of a multiple linear regression model show that the solubilization of organic materials is influenced by temperature and time. Furthermore, using two different first-order kinetic models, an enhancement of AD rate during hydrolysis due to pretreatment is observed. However, the increasing intensity of pretreatment conditions is accompanied by a decreasing trend in the conversion of intermediates to methane.

1. Introduction

Given the change from fossil to renewable energy sources, biomass has a special significance in Germany. According to a recent study, around 26% of primary energy demand in Germany could be covered by biomass in 2050. The largest share comes from cultivated biomass (such as energy crops) and agricultural residues such as straw, slurry and manure. However, only one-third of the disposable potential has currently been exploited [1]. Anaerobic digestion (AD) is a universal technology that provides different options for waste treatment, provision of renewable energy (biogas) and production of an organic fertilizer. Thus, different types of organic materials, such as sewage sludge, manure, municipal organic waste or lignocellulosic agricultural waste can be used for biogas production. Among agricultural residues, cereal straw (e.g., wheat straw) is an interesting feedstock for biogas production due to its high available potential [2].
However, challenges in AD of lignocellulosic feedstocks are due to the inherent structure, conferring the resistances to hydrolysis and further conversion to biogas. The cause is primarily to be found in the crosslinked structure of the lignin polymer, which essentially consists of aromatic bonds, double bonds and phenolic groups. This form of structure gives lignin molecules hydrophobic properties that are difficult to access biochemically. Moreover, both characteristic polysaccharides cellulose and hemicellulose are linked to the lignin molecule by covalent bonds. Consequently, the strong integration of lignin within the lignocellulose complex leads to increased resistance of the two polysaccharides to the biochemical degradation processes [3].
In order to facilitate the AD of lignocellulosic biomasses, studies are focusing on different disintegration procedures. Among them, physical (extrusion, irradiation), chemical (acids, bases, ionic liquids) or biological (fungal, microbial, enzymatic) methods are regularly the subject of research. Moreover, thermal processes (e.g., steam explosion, liquid hot water) or combined process are regarded as a key technology for the rapid and largely complete conversion of lignocellulosic biomasses [4]. However, most technologies have rarely been transferred to large-scale implementations. The reasons can be found in their inherent drawbacks, such as high costs on energy and chemical consumption, partly corrosive properties or possible pollutions [5]. Because hydrothermal pretreatment (HTP) only uses lignocellulosic biomasses and water, it has been widely accepted as a green technology [6]. The process describes a disintegration method, where the recalcitrant structure breaks under elevated process conditions (150–300 °C, initial pressure 0–60 bar, 5–75 min) [7]. Under these conditions, water and organic acids (especially from hemicellulose) accelerate hemicellulose degradation into short chain products, rendering them as a soluble fraction in the AD process [7,8]. In recent years, numerous studies dealt with HTP of lignocellulosic feedstocks and its influence on biogas production. Here, most of these investigations examine the effect of pretreatment temperature [9,10]. Studies focusing on the influence of retention time as an additional process variable are rarely available. Furthermore, some experiments partly provide contradictory results. As an example, Chandra et al. [11] found that the hydrothermal disintegration of wheat straw (200 °C, 15 min) led to an increase of 20% in biomethane potential (BMP) compared to an untreated reference. This was in contrast to the findings of Wang et al. [9], who obtained that BMP was even reduced by 30% when pretreatment was conducted under nearly similar process conditions (210 °C, 15 min). More promising results were achieved at 180 °C, which was associated with an increase in the specific BMP of up to 3%, indicating a slight improvement in feedstock digestibility [9]. Similar findings were provided by Shang et al. [12], who investigated the effect of pretreatment temperature and duration on wheat straw within a range of 150–225 °C and 5–60 min, respectively. The maximum increase in methane yield (62.9%) was achieved, when pretreatment was conducted for 30 min at 175 °C. In contrast, substrate disintegration at 200 and 225 °C revealed a decreasing trend, which was particularly pronounced with increasing retention times. The authors explained this effect by means of dissolved lignin, which was deposited on the surface of the straw particles during the cooling process. The formation of the so-called pseudo-lignin resulted in a deterioration of the enzymatic accessibility and thus the anaerobic degradability. Furthermore, formation of by-products from lignocellulose that inhibit microbiological activity is suspected [12]. The most frequently mentioned inhibitors are furfurals and 5-Hydroxymethylfurfural (5-HMF), whose influence is assumed by the inhibition of cell growth, DNA damage and an enzymatic inhibition of the glycolysis pathway [13,14].
Moreover, HTP processes are often associated with the formation of phenolic compounds (e.g., vanillin or syringaldehyde), which originate from thermal lignin-degradation. In contrast to furanic compounds, microbial cell damages are assumed to be changes in membrane permeability, which are associated with the leakage of intracellular components and the inactivation of essential enzymatic systems [14,15,16,17]. In order to minimize the risk of microbiological inhibition, more attention was attributed to the AD of the solid phase but studies dealing with the total slurry are still limited.
However, such an approach is associated with the loss of easily degradable organic matter, such as monomeric sugars (e.g., glucose or xylose) or organic acids (e.g., acetic acid or formic acid), which consequently leads to a loss in biogas and methane production.
The present study examines the influence of different pretreatment temperatures and retention times on the performance of AD in terms of BMP. The focus is on the anaerobic conversion of the total slurry, which has been rarely investigated in previous studies. Furthermore, the influence of the most important pretreatment parameters (temperature and time) on the composition of processed water samples, with respect to easily degradable components and potential inhibitors, is statistically examined and evaluated in more detail. Such an approach represents an important aspect for determining the most appropriate pretreatment parameters but, to our knowledge, has not yet been investigated. In addition, reaction kinetics were analyzed by, among other things, an extended model structure that has not been used in the context of HTP. The model provides information on the formation and degradation of intermediates (such as sum VFA) and differs from the investigations of most other authors [9,10,12].

2. Materials and Methods

2.1. Origin of Wheat Straw and Sample Preparation

Wheat straw was collected from a farm near Leipzig, Germany (51°17′26.5″ N 12°46′09.7″ E) and chopped by a hammer mill “CHM 230” (Erich Netzsch GmbH & Co. KG, Selb, Germany) to a particle size of 10 mm. A first visual assessment of the samples showed an inhomogeneous distribution of fiber lengths. In order to minimize the influence of different particle sizes, mechanically chopped wheat straw samples were further sieved using a vibrating sieve machine “AS control” (Retsch GmbH, Haan, Germany) at an amplitude setting of 0.65 mm. Individual disintegration steps and BMP tests were carried out using the fiber fractions that settled on the screen with a mesh size between 3.15 and 2.00 mm.

2.2. Hydrothermal Pretreatment and Process Conditions

The HTP was performed in a 500 mL stainless, batch reactor “BR 500” (Berghof Products + Instruments GmbH, Eningen unter Achalm, Germany), which was heated with a synthetic thermal oil at the desired temperature range (160–180 °C) with a heating rate of 2 K min−1 for 15, 30 or 45 min. The individual pretreatment conditions were based on a partial factorial experimental design, which was created with “Design-Expert” (Version 12, Stat-Ease Inc., Minneapolis, MN, USA) (Table 1).
To estimate the variability of the results and to increase the accuracy of estimation, every pretreatment, with the exception of HTP-170-30, was conducted in duplicate. Hydrothermal process conditions according to HTP-170-30 represented the center point (CP) and had to be performed six times to increase the information content of the design space and estimate the repetition error.
In order to avoid combustion or coking reactions [18], a similar mass ratio of wheat straw and tap water (1:17) was chosen, as shown in Tian et al. [19]. For each pretreatment, 25 g wheat straw (on fresh matter (FM) basis) was filled into the reactor and mixed with 424 g tap water.
Once preparation was completed, the sealed reactor was positioned in the heating jacket and the process was initiated when target temperature was reached. After the pretreatment time was obtained, the reactor stopped immediately, and samples were automatically cooled down to a temperature of 30 °C.
The reactor was opened on the next day after 24 h and the liquid phase of each batch was separated from the solid phase by means of a stainless juice press and a commercially available filter fleece (pore size < 100 µm). In order to achieve consistent separation results, the juice press was attached to a laboratory scale and downforce was increased until the scale displayed a mass of 300 kg. Considering the piston diameter of 11.5 cm, a pressure of 2.83 × 10⁵ Pa was applied for each separation. To cover the whole period from HTP to the BMP tests, HTP factions (liquid and solid) were immediately stored in a freezer (−20 °C) after masses of both fractions were determined. Furthermore, untreated wheat straw samples were stored under identical conditions. Thus, potential effects of freezing or thawing should be considered for all samples.

2.3. Biomethane Potential Test

BMP tests were performed using the Hohenheim Biogas Yield Test (HBT) according to VDI 4630. The system consists of a continuously rotating drum (1.2 rpm), placed in an incubator. The drum is loaded with syringes, each with a total volume of 100 mL [20]. The experimental setup is shown in Figure 1. The liquid and solid phases of the hydrothermally pretreated wheat straw samples were mixed and loaded to AD. For this purpose, syringes were filled with 30 g FM of inoculum and sample material. The inoculum was taken from a 400 L laboratory scale reactor, that was fed with maize silage, shredded wheat, soybean meal, rapeseed oil and digestate from biogas plants in Baden-Württemberg, Germany [19]. Here, both the inoculum to substrate ratio of 2.5 (g VS of substrate/g VS of inoculum) as well as the mass ratio between separated solid and liquid phase were considered to calculate the required amount of pretreated substrate materials. After completion of sample preparation, the syringes were transferred to rotating drum and AD process was conducted under mesophilic conditions (37 °C) for 35 days.
Determination of methane content was based on dry gas measurement. For this purpose, the biogas volume was first measured by manually reading the scale on the syringes (Figure 1). As soon as measuring volume (20 mL) was reached, the valve was opened and biogas passed through a flexible pipe (not shown) containing an adsorbent (“SICAPENT®”, Merck, Darmstadt, Germany) for gas drying. The determination of methane concentration was subsequently carried out by means of infrared-spectrometric methane sensor “Advanced Gasmitter” (Pronova Analysetechnik, Berlin, Germany) and cumulated methane production of dry gas under standard conditions (273.15 K, 1013.25 hPa) was calculated according to guideline given in VDI 4630 (2016) [23].
BMP tests of every HTP approach were performed in the context of a six-fold determination. Moreover, two test series using cellulose and untreated wheat straw were conducted as positive control and reference, respectively. A blank group without any substrate addition was set to exclude biogas and methane produced by the inoculum in the net volume calculation of the samples.

2.4. Analytical Methods

The total and volatile solid content (TS and VS) of the solid and liquid fraction were analyzed according to the standard methods given under DIN EN 15934 [24] and 15935 [25], respectively. Moreover, the soluble chemical oxidation demand (COD), concentration of organic acids and carbohydrates and the concentration of potential inhibitory compounds (e.g., Furfural, 5-HMF, phenols) from liquid have also been determined.
The analysis of individual volatile fatty acids (VFA) was conducted according to Schumacher et al. [26]. The determination of the COD for liquid samples was based on the use of the cuvette quick test “LCK 014” (Hach Lange GmbH, Düsseldorf, Germany) and the analysis was performed according to the manufacturer’s specifications.
The analysis of phenolic compounds was performed on a gas chromatograph with mass spectrometry coupling (GC-MS) “Trace 1310-ISQ LT Single Quadropul Mass Spectrometer” (Thermo Fisher Scientific Inc., Waltham, MA, USA). The injection mode of the gas chromatograph was split 10:1 and injection temperature was kept at 250 °C. For separation, a “ZB-5HT-Inferno” column (30 m × 0.25 mm × 0.25 µm) (Phenomenex, Torrance, CA, USA) and helium 5.0 with a flow rate of 1.2 mL min−1 were used as carrier gas. The column was operating with two linear ramps at programmed temperature-mode as follows: heating from an initial temperature (50 °C) with 5 °C min−1 till 225 °C; heating with 3 °C min−1 till 300 °C and hold for 5 min. The ionization took place by means of ionization module EI. The temperature of the ion source was 250 °C and the MS transfer line was 310 °C. For the determination of phenol compounds, 300 µL of an internal standard (4-tert-butylphenol c = 117 mg L−1) and 400 µL toluene were added to 700 µL of the liquid aqueous sample in a 2 mL vial and extracted by intensive mixing. After 20 min, the organic phase was carefully transferred to a vial and analyzed by GC-MS.
The analysis of soluble sugars (C5-C6) and detection of furfural and 5-HMF were done on a high performance liquid chromatograph (HPLC) using a “Security Guard Carbo Pb” column (4 × 3.00 mm) (Phenomenex Torrance, CA, USA) for sample purification and a second column “MetaCarb 87P” (300 mm × 7.8 mm) (Aligent Technologies, Inc., Santa Clara, CA, USA) for separation with temperature setting at 75 °C. Ultra-pure water with an injection volume of 15 µL and a flow rate of 0.35 mL min−1 was used as eluent for every measurement where total run time was set at 80 min. The measurement of sugars (e.g., glucose, xylose, arabinose, mannose, fructose) was performed using a refractive index detector (RID) at a temperature of 40 °C. Depending on its concentrations, determination of furfural and 5-HMF was performed in two different ways. For concentrations ≥ 200 mg L−1, the RID detector was used, whereas lower concentrations required the use of a diode array detector (DAD) measuring at 254 nm. For analysis, aqueous sample was centrifuged at room temperature and 3900 rpm for 5 min. Then, the supernatant was transferred to a filter vial (0.45 µm) and centrifuged at 10 °C and 10,000 rpm for 10 min. The supernatant was diluted 1:10 with ultrapure water and analyzed by the HPLC.

2.5. Kinetic Modelling

Based on characteristic first-order reactions summarized by Brulé et al. [27], different kinetic model structures were chosen to evaluate the effect of HTP on the anaerobic degradation kinetics in BMP tests. Because hydrolysis is often considered to be the rate-limiting step during AD of lignocellulosic biomass [28], data sets were analyzed by a simple first-order reaction model (first-order one-step). Furthermore, an extended model (first-order two-step) was used to evaluate the formation and degradation of additional intermediates (such as sum of VFA). Cumulated methane production over time of both model structures can be described according to Equations (1) and (2), respectively [29].
S   t =   S max × 1   e k × t
S t =   S max × 1 + k H ×   e k VFA t   k VFA ×   e k H × t k VFA k H
where Smax (mL g−1 VS) is the maximum specific methane potential and k (d−1) represents the first-order rate constant. Additionally, kH (d−1) is the first-order rate constant of substrate degradation into intermediates (first step), whereas kVFA describes first-order kinetics of VFA degradation into methane (second step).
Individual equations and related procedures for parameter estimation were implemented in the software environment “Matlab” (The Mathworks, Inc., Natick, MA, USA). The non-linear trust region reflective algorithm implemented in the lsqcurvefit function was applied for constrained least-squares estimation of unknown model parameter [29,30].

2.6. Experimental Design and Statistical Analysis

For statistical analyses, a two level (2k) factorial design arrangement was used to evaluate the effect of pretreatment temperature (X1) and retention time (X2) at two different levels each one (160 and 180 °C and 15 and 45 min, respectively) in 14 runs were randomly generated. The experimental data were analyzed by a linear model (Equation (3)) using the commercial software environment “Design-Expert” (Version 12, Stat-Ease, Inc., USA). The statistical significance of the regression terms was examined by analyses of variance (ANOVA) for each response, according to Equation (3).
y =   β 0 +   β 1 ×   X 1 +   β 2 × X 2 +   β 12 × X 1 × X 2
where y is the variable response, X1 and X2 are the independent variables and β1, β2 and β12 represent the regression coefficients of the model. Moreover, a direct comparison between untreated and pretreated wheat straw samples was carried out by the software “SPSS statistics” (Version 20, IBM, Chicago, IL, USA). In order to determine whether there was a significant difference between the BMP of untreated and pretreated samples, experimental data were evaluated using a Welch’s ANOVA with a confidence level of 95%. If differences existed, a post-hoc test according to Games–Howell (α = 0.05) was applied [31].

3. Results and Discussion

3.1. Effect of Hydrothermal Pretreatment on Process Water Composition

In order to evaluate the effect of pretreatment temperature and retention time on HTP of wheat straw, process water samples were analyzed with respect to the concentration of easily degradable components, such as monomeric sugars (glucose, xylose, arabinose) and organic acids (acetic acid, formic acid), which may be beneficial for AD. Furthermore, the influence of both pretreatment parameters on the content of potential inhibitors (mainly phenolic and furanic compounds) was evaluated. Table 2 shows mean concentrations of the most represented organic soluble fractions in the process water, depending on individual pretreatment conditions.
The highest acetic acid concentration (1626.8 mg L−1) was achieved at HTP-180-45, which resulted in an increase of 159.3% compared to the lowest severe pretreatment conditions given under HTP-160-15. Similar effects were observed for formic acid, where an increase in pretreatment temperature and/or time led to higher concentration of saturated carbonic acid. Acetic acid represents degradation products formed by hydrolysis of acetyl groups of hemicellulose, whose thermal decomposition usually starts at temperatures above 150 °C [7]. Formic acid refers to a by-product whose formation is mainly due to the thermal decomposition of furanic compounds (furfural and 5-HMF) and whose origin in turn is the dehydration of pentoses and hexoses [32]. Thus, increasing acid concentrations could indicate an accelerated hydrolysis of hemicelluloses depending on the pretreatment conditions [12,33]. For monosaccharides, glucose, arabinose and xylose were the main monosaccharides in the process water. Among them, an increase in concentration, depending on pretreatment conditions, was especially observed for arabinose. The highest concentration (543.0 mg L−1) related to the longest pretreatment time and highest temperature (180 °C, 45 min). These findings were in line with results from Ilanidis et al. [34], who described an increasing trend when pretreating wheat straw within a temperature range from 160 °C to 190 °C [34]. Here, the tendency of lower arabinose concentrations could be attributed to a higher liquid-to-solid-ratio (LSR) during the HTP.
For example, Ilanidis et al. [34] (LSR = 7:1) found a concentration of 400 mg L−1 whereas the detected concentration in the present work (LSR = 17:1) was 171.5 mg L−1 despite the same pretreatment conditions (160 °C, 15 min) [34]. A similar trend was also reported by Chen et al. [35], who published an increasing concentration of hemicellulose derived arabinose with rising temperature up to 180 °C. More severe pretreatment temperatures (e.g., 200 °C) led to a decrease, which indicated thermal degradation of the monosaccharide compound [35]. In contrast, the results for glucose showed a downward trend throughout the whole range of HTP severities. The highest concentration of 132.5 mg L−1 was attributed to the HTP-160-15, whereas rising temperatures or longer pretreatment times led to a concentration of 41.3 mg L−1. Because thermal decomposition of cellulose usually starts at a temperature above 200 °C [36,37], it was unlikely that glucose was originated from the polysaccharide under comparatively mild pretreatment conditions. According to similar results of Chen et al. [35], it was more likely that the monosaccharide compounds, found in the process water samples, were probably hemicellulose derived degradation products or β-glcucan [35,38].
Table 3 shows the resulting regression coefficients estimated by multiple linear regression. Individual coefficients are applied to identify the relative impact of influencing factors (temperature and time) when changing the input variables by one level.
It is interesting to notice that the pretreatment temperature showed a significant influence (p < 0.05) on almost all output parameters, whereas the temporal influence was discernible but could only be statistically proven in the case of organic acids, arabinose and chemical oxygen demand (COD).
Based on estimated regression coefficients, it can be proven that changes in output variables are primarily influenced by pretreatment temperature. As an example, in the case of acetic acid, the effect of temperature (356.34) on its concentration was more than twice as high as the pretreatment time (143.37). Moreover, only a small but also significant interaction between temperature and time has been observed for organic acids and sugar compounds.
Besides organic acids, similar trends have been found for the number of potential inhibitors, shown in Table 4. Although the influence of increasing pretreatment severity was mainly reflected in the furfural concentration (368.3 ± 11.1 mg/L), an increase in concentration was observed for almost all components. Because the reaction mechanisms were not investigated in detail, the cause of the increase in furfural concentration can only be suspected. In general, furfural is a reaction product formed by the thermal pentose sugars (e.g., D-xylose or L-arabinose).
As xylose could only be detected at most severe experimental conditions (HTP-180-45), it is more likely that the amount of furfural under less severe conditions (HTP-160-15 to HTP-180-15) could be attributed to the thermal decomposition of arabinose [34]. The larger increase from HTP-180-15 to HTP-180-45 might be explained by the longer pretreatment time, which had a comparatively smaller but nevertheless significant influence on the furfural concentration (Table 5). Moreover, it is well known that the formation of acetic acid, as a by-product, is capable of facilitating the dehydration of hemicellulose to pentose sugars [34,39]. Because there was a sharp increase in acetic acid concentration between these pretreatment conditions, the higher furfural concentration may also be attributed to an acid catalyzed degradation effect. In comparison to furfural, only a minor amount of 5-HMF (12.6 mg L−1), originated from the dehydration of hexose (e.g., glucose and mannose), was detected in the liquid phase obtained at HTP 5. These findings were in line with other authors [32,35], who also found minor amounts, especially at high temperatures or time ranges.
The concentration of phenolics in total ranged from 3.18 to 40.42 mg L−1 and also showed an upward trend with rising pretreatment severities. For each compound, a significant effect of both pretreatment time and temperature was found, with the latter having a greater effect on the change in concentration (Table 5). Among these, vanillin and syringaldehyde were the most represented fractions in process water. Both compounds are typical by-products, whose origin can be explained by the depolymerization of guaiacyl and syringyl units of lignin polymers [40].

3.2. Evaluation of Biochemical Methane Potential (BMP)

The influence of pretreatment temperature and time on the measured BMP was examined based on a linear regression model (Equation (3)). The statistical analysis showed very poor accuracy of fit, which was confirmed by most model-relevant parameters. The F-value of 1.14 implied that the model was not significant relative to the noise. In addition, the low adjusted R2 (0.0361) and negative predicted R2 (−0.7263) values also indicated insignificance and the overall mean might be a better predictor for the BMP than the current model.
Table 6 illustrates the different temperature and time combinations and the measured BMP for untreated and pretreated wheat straw samples after 35 days. Moreover, both the statistical results of the Games–Howell post-hoc test and the percentage changes due to the pretreatment are shown.
AD of untreated wheat straw resulted in a specific BMP of 261 mL g−1 VS, which was in approximate agreement with the investigation of Ferreira et al. [41]. Other publications report specific methane yields ranging from 125 to 276 mL g−1 VS [10,12,42]. The difference in yield can be attributed to sample fractionation (mesh size 2 mm) prior to AD. An increase in biogas yield can usually be observed with decreasing fiber or particle size due to the larger surface and improved microbial accessibility [43,44]. The statistical evaluation of the BMP, using Games–Howell post hoc test, revealed a significant difference (p < 0.05) between the untreated sample and every single temperature–time combination. However, there were no significant differences between the individual parameter combinations (HTP-160-15–HTP-180-45).
Thus, an upward trend was observed especially under mild pretreatment conditions, where the highest increase (19%) in BMP was attributed to the parameter combination HTP-160-45.
In contrast, more intense conditions (HTP-170-30, HTP-180-15, HTP-180-45) seemed to result in a decline in methane production. A decreasing BMP is often attributed to the formation of inhibitory substances [12]. However, based on low concentrations (Table 4), inhibition of furfural, 5-HMF or phenolic compounds can probably be ruled out in the current experimental findings.
Sugar derived degradation products, especially furfural at low concentrations (1 g L−1), was often found to have a beneficial effect on the biogas process [40,45]. However, an inhibitory effect of methanogenic microorganisms due to furfural or 5-HMF had been observed only at higher concentrations (2 g L−1) [46]. Regarding lignin-derived degradations products, an inhibition due phenolic compounds can occur even at low thresholds [47]. Nevertheless, recent literature reports anaerobic degradation or adaption to a certain degree [40,48,49].
Barakat et al. [40] added degradation products such vanillin and syringaldehyde at concentrations of 1 g L−1 to AD of C5-sugar and found no reduction in final BMP. Chapleur et al. [48] investigated the influence of different phenol concentrations on AD of cellulose, whereby inhibitory effects only occurred at maximum values of 1.5 g L−1 and 2.0 g L−1, respectively. Wirth [49] found an adaption of anaerobic microbial community and complete degradation by using phenol (2 g L−1) as the sole carbon source. A complete inhibition was only detected at a concentration of 5 g L−1.

3.3. Evaluation of Kinetic Parameters

In order to evaluate the influence of HTP on anaerobic degradation kinetics, two different model structures based on first-order reactions (one- and two-step) were applied to depict experimental data. 
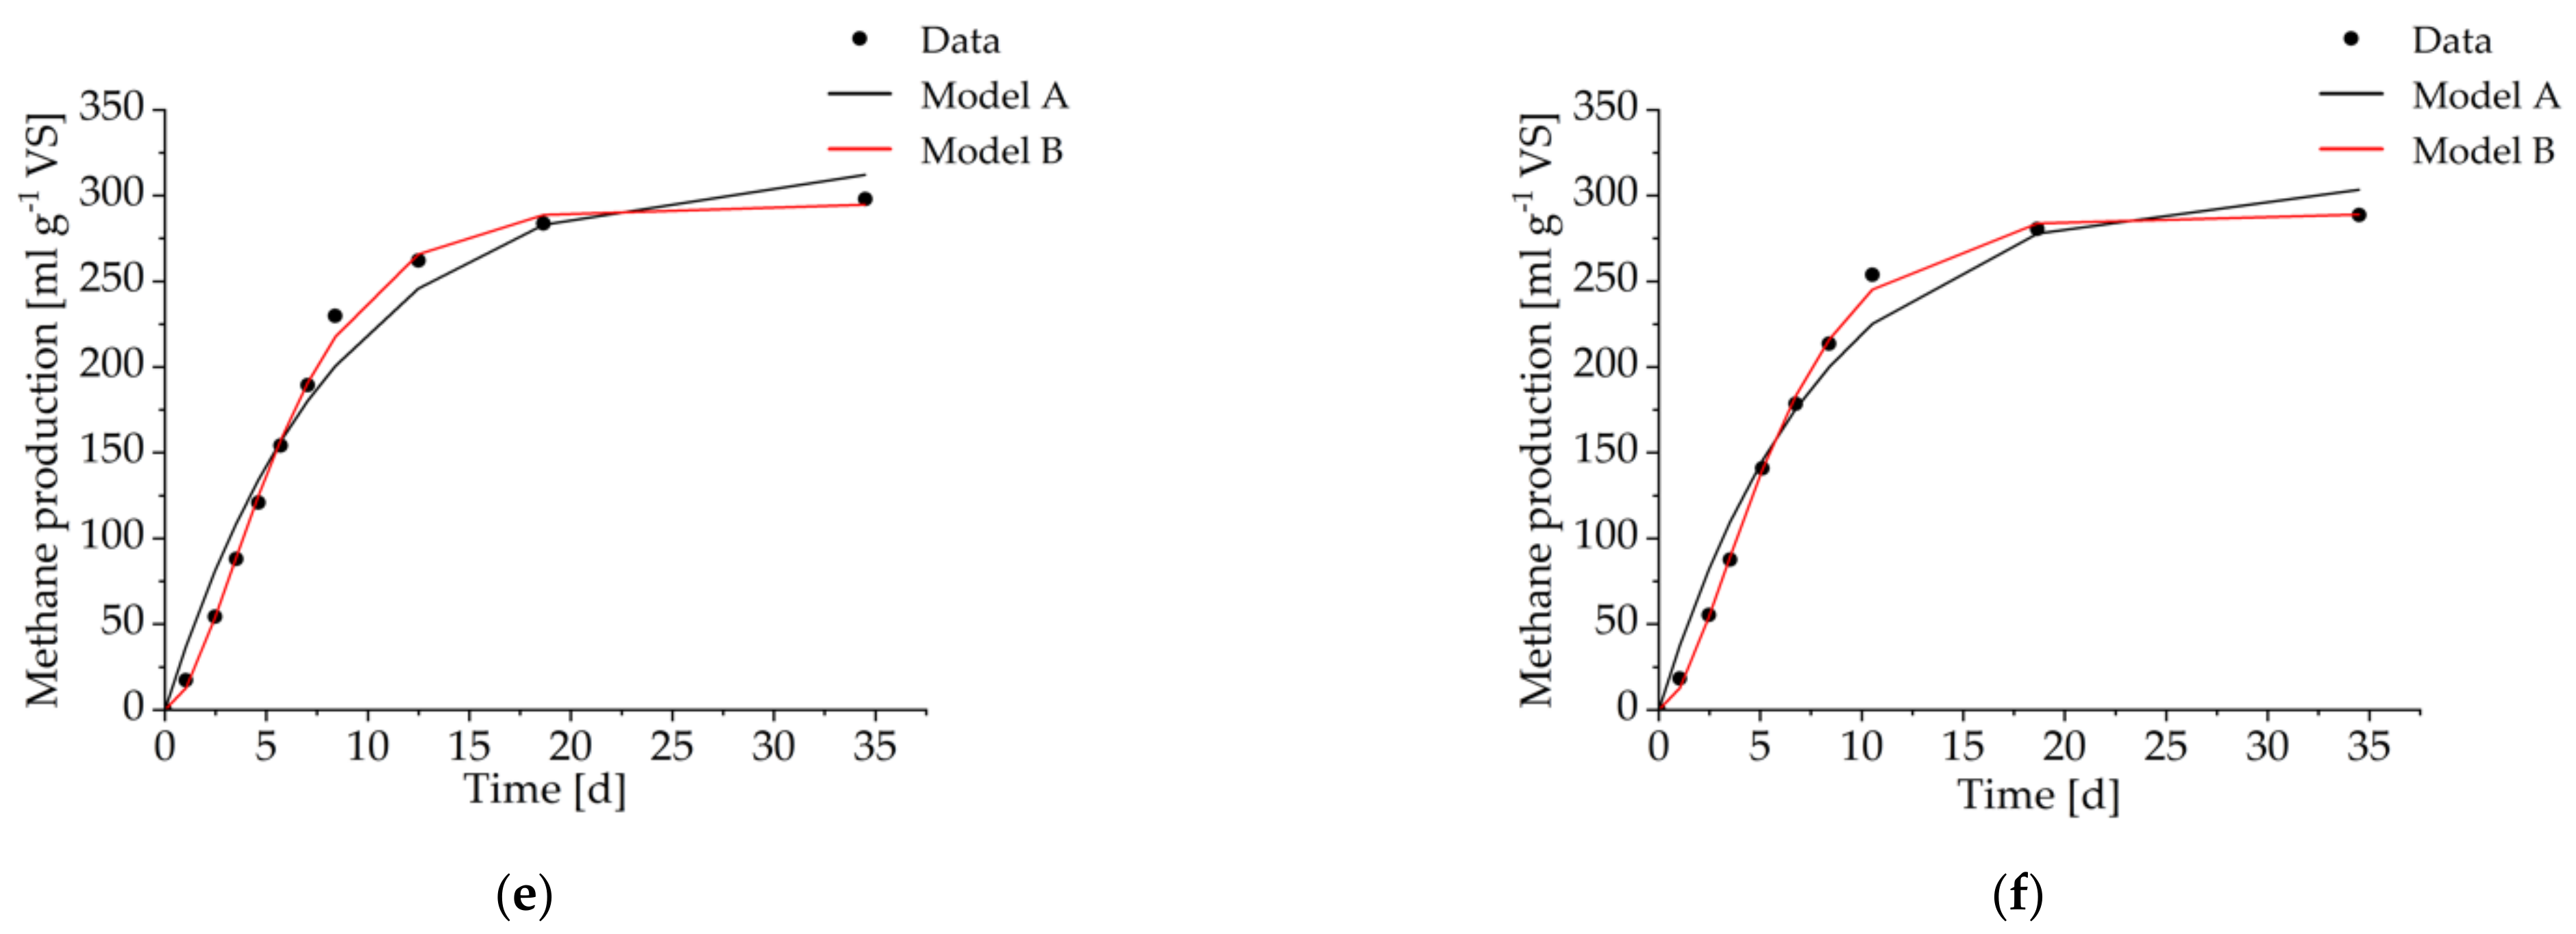
Figure 2 shows the progression of individual measurements and both model results of cumulative methane production in individual BMP tests.
It can be observed that both models were capable of predicting the experimental measurements with high precision. Furthermore, determination coefficients (R2) of 0.98 and 1.00 indicate that the first-order one-step (Model A) and the first-order two-step model (Model B) were able to explain between 98% and 100% of the observed data, respectively.
Based on the single first-order rate constant of Model A (Table 7), it can clearly be observed that HTP had a positive effect on the hydrolysis rate. With increasing pretreatment severity, an increase in the first-order rate constant was observed, which could be explained by an increasing release of organic content and the improvement of substrate accessibility due to an increase in pretreatment severity.
The highest values were assigned to the highest temperature (180 °C), which seems to be a typical observation, especially for the considered temperature range [12,41]. Because the degradation constant of untreated wheat straw was comparably low (k = 0.08 d−1), its increase may also indicate that HTP helps to facilitate the rate limiting step of the biogas process.
The positive effect of substrate disintegration on degradation kinetics is partly reflected in Model B. In the first stage, an increase in the degradation constant (kH) was also observed, which indicates a faster formation of intermediates and consequently an acceleration in hydrolysis. In contrast, the second stage shows a deterioration in the degradation kinetics. As shown in Table 7, kVFA decreases from 0.65 d−1 to 0.32 d−1, when pretreatment severity increases from HTP-160-15 to HTP-180-45. A decreasing trend of kVFA indicates a slowed degradation of intermediates (e.g., VFA) originated from the first step and consequently a negative influence on methane formation. This observation is supported by declining BMP predicted by the model.
Because Model B is not widely used in the context of substrate disintegration, a direct comparison with other sources is rather difficult. Most authors refer to the modified Gompertz model, in which negative effects on methane or biogas formation due to more severe pretreatment conditions are often shown by prolonging lag phases or reduction in the maximum biogas production rates [10,12,50,51]. As already mentioned in Section 3.2, the low concentrations of the most commonly known compounds (Table 4) did not suggest an inhibitory effect on microbiology. Thus, no clear lag phase was observed in the current experiments and the application of the modified Gompertz model does not yield additional information [29].
However, the negative effect on degradation kinetics and/or methane production may strongly be affected by the source and adaptability of the applied inoculum. For example, in direct comparison of two different inocula, anaerobically digested waste activated sludge (ADWAS) and anaerobically digested cattle manure (ADCM), Phuttaro et al. [52] found significantly better biodegradability of hydrothermally pretreated Napier grass (200 °C, 15 min) by ADWAS, suggesting that ADCM was more sensitive to inhibitory compounds. Because the ADWAS inoculum was frequently exposed to toxic substances (e.g., household chemicals), the authors suspected a better adaption of the microbial consortium to inhibitory compounds [46,52,53,54].
As the inoculum used in our study was taken from a 400 L laboratory reactor, only fed with maize silage, shredded wheat, soybean meal, rapeseed oil and digestate from biogas plants, the slowed degradation kinetic (kVFA) as well as the decreasing BMP might be explained by an insufficient adaption to furanic and phenolic compounds.
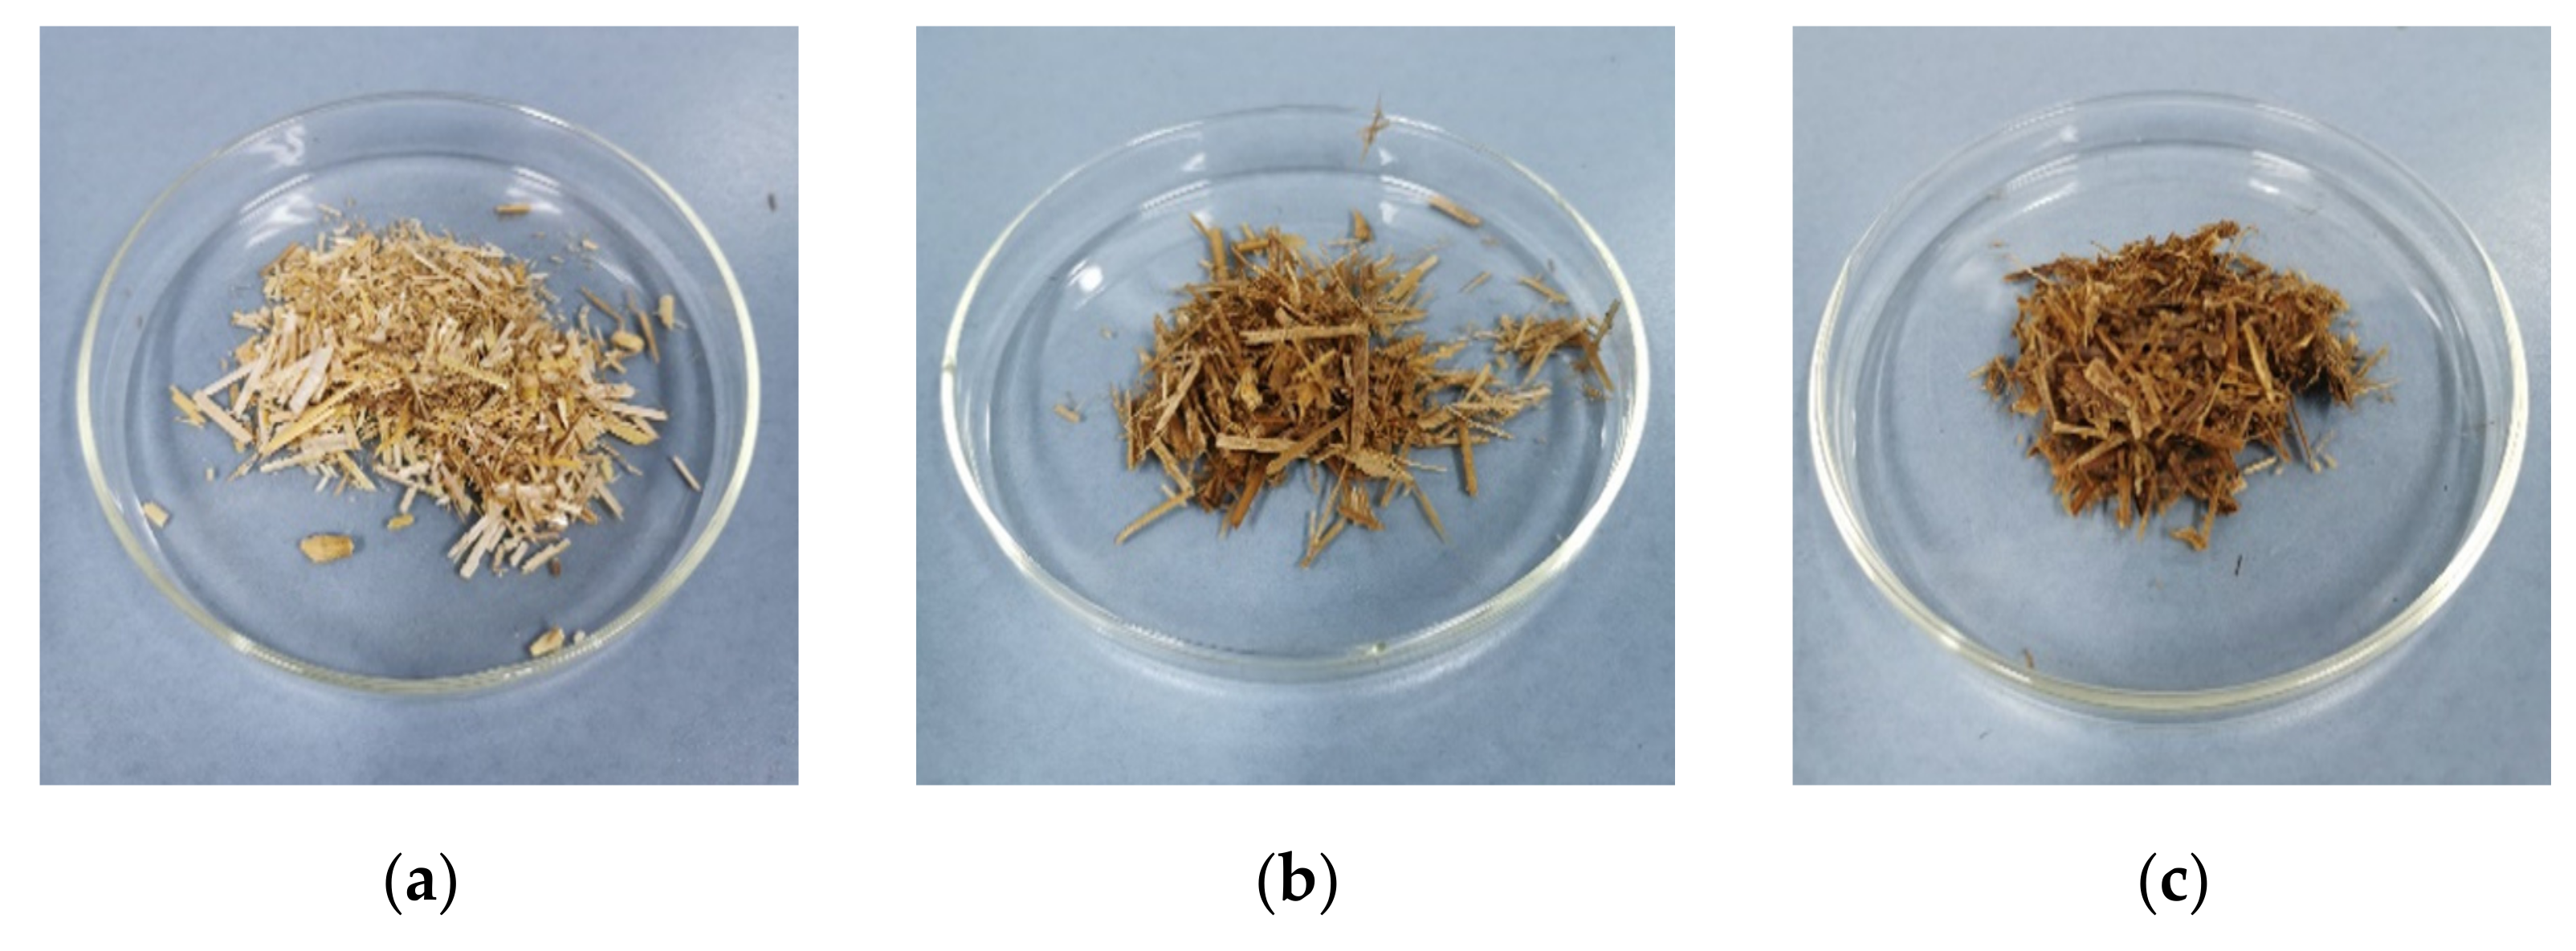
Furthermore, it is well known that hydrothermal pretreatment may lead to reactions between proteins and carbohydrates, which starts to occur at temperatures higher than 150 °C or longer pretreatment times [55]. The so-called Maillard reaction—often indicated by a light to dark brown substrate discoloration—is accompanied by the formation of melanoidines which are less biodegradable due to their complex structure [55,56]. A lesser biodegradability in turn means lower biogas production, which also could explain the decrease in specific BMP (Table 6). In addition, a few studies revealed a negative effect on acidogenesis [56] which resulted in a delayed production of VFA and consequently a reduced BMP [57]. Wang et al. [57] suspected a certain degree of toxicity and a competitive effect for electrons within the microbiological community [57]. With regard to the results illustrated in Figure 3, the darkening of the wheat straw samples clearly increases with increasing pretreatment intensity from HTP-160-15 to HTP-180-45.
An increasing change in color from light to dark brown may indicate an increasing concentration of maillard products (melanoidines), which could explain the decreasing trend in substrate degradation (kVFA), as illustrated by first-order two-step kinetic model.
According to the two different model approaches, all pretreatment conditions led to an increase in degradation constants (k, kH), indicating that hydrothermal substrate disintegration was capable of accelerating hydrolysis as a rate-limiting step and that it helps to overcome the recalcitrant structure of lignocellulosic biogas substrates (such as wheat straw). However, more severe pretreatment conditions seem to have a negative impact on the degradation kinetics of consecutive process phases (kVFA). Thus, higher temperatures (>180 °C) and longer pretreatment times should be avoided.

4. Conclusions and Outlook

In this study, the effect of HTP on the digestibility of wheat straw was investigated. The results showed that the solubilization of organic matter was a consequence of both pretreatment parameters (temperature and time), where the effect was primary influenced by temperature.
Here, the effect was primarily manifested by an increasing concentration of VFA (e.g., acetic and formic acid) and individual monosaccharides (e.g., arabinose) indicating that HTP was capable of accelerating hydrolysis of hemicellulose, depending on its pretreatment intensity. Furthermore, an increase in furanic and phenolic compounds (e.g., furfural, vanillin, syringaldehyde) was observed, but an inhibitory effect was not to be assumed due to comparatively low concentrations.
Taking the BMP results into account, a significant increase in specific BMP was found for all parameter combinations compared to untreated wheat straw, with the highest increase of 16 to 19% at the pretreatment temperature of 160 °C, where the optimum appeared after 45 min. Moreover, first-order models showed that HTP at all conditions increased the degradation rate, indicating that the disintegrations method helps to facilitate the rate-limiting step of the biogas process. However, because the first-order two-step model revealed a negative influence on consecutive conversion steps (AD of VFA), as indicated by a decreasing rate constant of the second step (kVFA), more severe pretreatment conditions—temperatures (>180 °C) and longer pretreatment times (>45 min)—should be avoided.
A specific application aspect of HTP might be the ReBi (ReBi—dispatchable biogas plant) configuration [58] for dynamic biogas production and demand-oriented electricity provision [58,59]. The ReBi configuration is based on a multistage system, where hydrolysis and acidogenesis as well as acetogenesis and methanogenesis proceed in two separated steps. The effluent formed in the first stage is separated into a liquid and solid fraction by a screw press. The solid fraction is fed into a conventional stirred tank reactor (CSTR), whereas the liquid fraction, containing rapidly degradable substrates, is stored in a tank and fed to a fixed-bed reactor for demand-oriented biogas production [58]. To cover time-dependent biogas demand, rapidly degradable substrates with high BMP and suitable reactors systems are required [59,60]. For a specific application in the ReBi concept, the HTP-reactor might replace the first step. Thus, process water, with its high content of easily digestible organics, might be used to feed a fixed-bed reactor, whereas the fermentation of hydrothermally pretreated wheat straw occurs in a conventional stirred tank reactor.
However, because BMP results only serve a first assessment of substrate digestibility, further research should focus on the AD of hydrothermally pretreated wheat straw under continuous conditions. This allows a long-term evaluation of the effects of substrate disintegration and an assessment of its feasibility in practical applications. In addition, such test procedures can be used to determine the optimal conditions, such as the organic loading rate or the hydraulic retention time, in the biogas process. Furthermore, a techno-economic assessment of the lab-scale results is mandatory to evaluate the applicability of hydrothermal substrate disintegration under full-scale conditions [61,62].

Author Contributions

Conceptualization, T.Z. and B.S.; methodology, T.Z., B.S. and S.W.; software, T.Z. and S.W.; validation, T.Z., B.S. and S.W.; formal analysis, T.Z.; investigation, T.Z. and B.H.; writing—original draft preparation, T.Z.; writing—review and editing, B.S., S.W. and B.H.; visualization, T.Z.; supervision, M.N. All authors have read and agreed to the published version of the manuscript.

Funding

The authors gratefully acknowledge the German Federal Ministry for Digital and Transport for financial support for the project “Pilot-SBG-Bioresources and hydrogen as raw materials for methane as a fuel—conceptual design and realization of a pilot plant” and the German Federal Ministry of Food and Agriculture for the institutional funding of DBFZ.

Data Availability Statement

The data presented in this study are part of a market project and are consequently not available.

Acknowledgments

The authors express their appreciation to colleagues from DBFZ-laboratory as well as the State Institute of Agricultural Engineering and Bioenergy for technical support and conducting the Hohenheim Biogas Yield Test. The authors would also like to thank the company Uwe & Olaf Kuper GbR for providing the wheat straw free of charge.

Conflicts of Interest

The authors declare no conflict of interest. The funders had no role in the design of the study; in the collection, analyses, or interpretation of data; in the writing of the manuscript; or in the decision to publish the results.

References

  1. FNR. Bioenergy in Germany—Facts and Figures 2020; Agency for Renewable Resources: Gülzow, Germany, 2019. [Google Scholar]
  2. Brosowski, A.; Bill, R.; Thrän, D. Temporal and spatial availability of cereal straw in Germany—Case study: Biomethane for the transport sector. Energy Sustain. Soc. 2020, 10, 42. [Google Scholar] [CrossRef]
  3. Zoghlami, A.; Paës, G. Lignocellulosic Biomass: Understanding Recalcitrance and Predicting Hydrolysis. Front. Chem. 2019, 7, 874. [Google Scholar] [CrossRef] [PubMed] [Green Version]
  4. Mahmood, H.; Moniruzzaman, M.; Iqbal, T.; Khan, M.J. Recent advances in the pretreatment of lignocellulosic biomass for biofuels and value-added products. Curr. Opin. Green Sustain. Chem. 2019, 20, 18–24. [Google Scholar] [CrossRef]
  5. Hendriks, A.T.W.M.; Zeeman, G. Pretreatments to enhance the digestibility of lignocellulosic biomass. Bioresour. Technol. 2009, 100, 10–18. [Google Scholar] [CrossRef]
  6. Saha, B.C.; Yoshida, T.; Cotta, M.A.; Sonomoto, K. Hydrothermal pretreatment and enzymatic saccharification of corn stover for efficient ethanol production. Ind. Crops Prod. 2013, 44, 367–372. [Google Scholar] [CrossRef]
  7. Ahmed, B.; Aboudi, K.; Tyagi, V.K.; Álvarez-Gallego, C.J.; Fernández-Güelfo, L.A.; Romero-García, L.I.; Kazmi, A.A. Improvement of Anaerobic Digestion of Lignocellulosic Biomass by Hydrothermal Pretreatment. Appl. Sci. 2019, 9, 3853. [Google Scholar] [CrossRef] [Green Version]
  8. Rezania, S.; Oryani, B.; Cho, J.; Talaiekhozani, A.; Sabbagh, F.; Hashemi, B.; Rupani, P.F.; Mohammadi, A.A. Different pretreatment technologies of lignocellulosic biomass for bioethanol production: An overview. Energy 2020, 199, 117457. [Google Scholar] [CrossRef]
  9. Wang, D.; Shen, F.; Yang, G.; Zhang, Y.; Deng, S.; Zhang, J.; Zeng, Y.; Luo, T.; Mei, Z. Can hydrothermal pretreatment improve anaerobic digestion for biogas from lignocellulosic biomass? Bioresour. Technol. 2018, 249, 117–124. [Google Scholar] [CrossRef]
  10. Rajput, A.A.; Ayub Zeshan, S.; Visvanathan, C. Effect of thermal pretreatment on chemical composition, physical structure and biogas production kinetics of wheat straw. J. Environ. Manag. 2018, 221, 45–52. [Google Scholar] [CrossRef]
  11. Chandra, R.; Takeuchi, H.; Hasegawa, T.; Kumar, R. Improving biodegradability and biogas production of wheat straw substrates using sodium hydroxide and hydrothermal pretreatments. Energy 2012, 43, 273–283. [Google Scholar] [CrossRef]
  12. Shang, G.; Zhang, C.; Wang, F.; Qiu, L.; Guo, X.; Xu, F. Liquid hot water pretreatment to enhance the anaerobic digestion of wheat straw—Effects of temperature and retention time. Environ. Sci. Pollut. Res. 2019, 26, 29424–29434. [Google Scholar] [CrossRef] [PubMed]
  13. Almeida, J.R.; Bertilsson, M.; Gorwa-Grauslund, M.F.; Gorsich, S.; Liden, G. Metabolic effects of furaldehydes and impacts on biotechnological processes. Appl. Microbiol. Biotechnol. 2009, 82, 625–638. [Google Scholar] [CrossRef] [PubMed]
  14. Palmqvist, E.A.; Hahn-Hägerdal, B. Fermentation of lignocellulosic hydrolysates. II: Inhibitors and mechanisms of inhibition. Bioresour. Technol. 2000, 74, 25–33. [Google Scholar] [CrossRef]
  15. Campos, F.M.; Couto, J.A.; Figueiredo, A.R.; Toth, I.V.; Rangel, A.O.S.S.; Hogg, T.A. Cell membrane damage induced by phenolic acids on wine lactic acid bacteria. Int. J. Food Microbiol. 2009, 135, 144–151. [Google Scholar] [CrossRef]
  16. Heipieper, H.J.; Weber, F.; Sikkema, J.; Keweloh, H.; de Bont, J.A.M. Mechanisms of resistance of whole cells to toxic organic solvents. Trends Biotechnol. 1994, 12, 409–415. [Google Scholar] [CrossRef]
  17. Hierholtzer, A.; Chatellard, L.; Kierans, M.; Akunna, J.C. The impact and mode of action of phenolic compounds extracted from brown seaweed on mixed anaerobic microbial cultures. J. Appl. Microbiol. 2012, 114, 964–973. [Google Scholar] [CrossRef]
  18. Ibrahim, B. Investigation of the Applicability of Wetland Biomass for Producing Hydrochar by Hydrothermal Carbonization and Its Effectiveness for the Adsorption of Ammonia. Ph.D. Thesis, University of Rostock, Rostock, Germany, 2018. [Google Scholar]
  19. Tian, W.; Chen, Y.; Shen, Y.; Zhong, C.; Gao, M.; Shi, D.; He, Q.; Gu, L. Effects of hydrothermal pretreatment on the mono- and co-digestion of waste activated sludge and wheat straw. Sci. Total Environ. 2020, 732, 139312. [Google Scholar] [CrossRef]
  20. Helffrich, D.; Oechsner, H. The Hohenheim biogas yield test. Landtechnik 2003, 58, 148–149. [Google Scholar]
  21. Hülsemann, B.; Zhou, L.; Merkle, W.; Hassa, J.; Müller, J.; Oechsner, H. Biomethane Potential Test: Influence of Inoculum and the Digestion System. Appl. Sci. 2020, 10, 2589. [Google Scholar] [CrossRef] [Green Version]
  22. Bavarian State Research Center for Agriculture (LfL). Available online: https://www.lfl.bayern.de/mam/cms07/ipz/dateien/aggf_2008_nussbaum_3.pdf (accessed on 20 December 2021).
  23. VDI 4630. Fermentation of Organic Materials—Characterisation of the Substrate, Sampling, Collection of Material Data, Fermentation Tests; Beuth Verlag GmbH: Berlin, Germany, 2016. [Google Scholar]
  24. DIN. EN 15934; Characterization of Sludges—Determination of Dry Residue and Water Content; DIN Deutsches Institut für Normung e.V.: Berlin, Germany, 2012. [Google Scholar]
  25. DIN. EN 15935; Characterization of Sludges—Determination of the Loss on Ignition of Dry Masses; DIN Deutsches Institut für Normung e.V.: Berlin, Germany, 2012. [Google Scholar]
  26. Schumacher, B.; Wedwitschka, H.; Weinrich, S.; Mühlenberg, J.; Gallegos, D.; Oehmichen, K.; Liebetrau, J. The influence of pressure swing conditioning pre-treatment of chicken manure on nitrogen content and methane yield. Renew. Energy 2019, 143, 1554–1565. [Google Scholar] [CrossRef]
  27. Brulé, M.; Oechsner, H.; Jungbluth, T. Exponential model describing methane production kinetics in batch anaerobic digestion: A tool for evaluation of biochemical methane potential assays. Bioprocess Biosyst. Eng. 2014, 37, 1759–1770. [Google Scholar] [CrossRef] [PubMed]
  28. Noike, T.; Endo, G.; Chang, J.-E.; Yaguchi, J.-I.; Matsumoto, J.-I. Characteristics of carbohydrate degradation and the rate-limiting step in anaerobic digestion. Biotechnol. Bioeng. 1985, 27, 1482–1489. [Google Scholar] [CrossRef] [PubMed]
  29. Weinrich, S.; Astals, S.; Hafner, S.D.; Koch, K. Kinetic modelling of anaerobic batch tests. In Collection of Methods for Biogas—Methods to Determine Parameters for Analysis Purposes and Parameters that Describe Processes in the Biogas Sector, 2nd ed.; Liebetrau, J., Pfeiffer, D., Eds.; DBFZ: Leipzig, Germany, 2020; Volume 7, pp. 349–369. [Google Scholar]
  30. Hofmann, J.; Müller, L.; Weinrich, S.; Deeber, S.; Schumacher, B.; Velghe, F.; Liebetrau, J. Assessing the Effects of Substrate Disintegration on Methane Yield. Chem. Eng. Technol. 2020, 43, 47–58. [Google Scholar] [CrossRef] [Green Version]
  31. Field, A. Discovering Statistics Using SPSS, 3rd ed.; SAGE Publications: London, UK, 2009; p. 821. [Google Scholar]
  32. Nitsos, C.K.; Matis, K.A.; Triantafyllidis, K.S. Optimization of Hydrothermal Pretreatment of Lignocellulosic Biomass in the Bioethanol Production Process. ChemSusChem 2013, 6, 110–122. [Google Scholar] [CrossRef] [PubMed]
  33. Gao, Y.; Wang, H.; Guo, J.; Peng, P.; Zhai, M.; She, D. Hydrothermal degradation of hemicelluloses from triploid poplar in hot compressed water at 180–340 °C. Polym. Degrad. Stab. 2016, 126, 179–187. [Google Scholar] [CrossRef]
  34. Ilanidis, D.; Stagge, S.; Jönsson, L.J.; Medina, C.M. Hydrothermal Pretreatment of Wheat Straw: Effects of Temperature and Acidity on Byproduct Formation and Inhibition of Enzymatic Hydrolysis and Ethanolic Fermentation. Agronomy 2021, 11, 487. [Google Scholar] [CrossRef]
  35. Chen, X.; Li, H.; Sun, S.; Cao, X.; Sun, R. Co-production of oligosaccharides and fermentable sugar from wheat straw by hydrothermal pretreatment combined with alkaline ethanol extraction. Ind. Crops Prod. 2018, 111, 78–85. [Google Scholar] [CrossRef]
  36. Sakaki, T.; Shibata, M.; Yasuda, S. Saccharification of cellulose using hot-compressed water-flowreactor. Ind. Eng. Chem. Res. 2002, 41, 661–665. [Google Scholar] [CrossRef]
  37. Jin, F.M.; Zhou, Z.Y.; Enomoto, H.; Moriya, T.; Higashijima, H. Conversion mechanism of cellulosic biomass to lactic acid in subcritical water and acidbase catalytic effect of subcritical water. Chem. Lett. 2004, 33, 126–127. [Google Scholar] [CrossRef]
  38. Cara, C.; Ruiz, E.; Carvalheiro, F.; Moura, P.; Ballesteros, I.; Castro, E.; Girio, F. Production, purification and characterisation of oligosaccharides from olive tree pruning autohydrolysis. Ind. Crops Prod. 2012, 40, 225–231. [Google Scholar] [CrossRef] [Green Version]
  39. Delbecq, F.; Wang, Y.; Muralidhara, A.; Ouardi, K.E.; Marlair, G.; Len, C. Hydrolysis of Hemicellulose and Derivates—A Review of Recent Advances in the Production of Furfural. Front. Chem. 2018, 6, 146. [Google Scholar] [CrossRef] [PubMed]
  40. Barakat, A.; Monlau, F.; Steyer, J.-P.; Carrere, H. Effect of lignin-derived and furan compounds found in lignocellulosic hydrolysates on biomethane production. Bioresour. Technol. 2012, 104, 90–99. [Google Scholar] [CrossRef] [PubMed]
  41. Ferreira, L.C.; Donoso-Bravo, A.; Nilsen, P.J.; Fdz-Polanco, F.; Pérez-Elvira, S.I. Influence of thermal pretreatment on the biochemical methane potential of wheat straw. Bioresour. Technol. 2013, 143, 251–257. [Google Scholar] [CrossRef] [PubMed]
  42. Theuretzbacher, F.; Lizasoain, J.; Lefever, C.; Saylor, M.K.; Enguidanos, R.; Weran, N.; Gronauer, A.; Bauer, A. Steam explosion pretreatment of wheat straw to improve methane yields: Investigation of the degradation kinetics of structural compounds during anaerobic digestion. Bioresour. Technol. 2015, 179, 299–305. [Google Scholar] [CrossRef]
  43. Menardo, S.; Airoldi, G.; Balsari, P. The effect of particle size and thermal pre-treatment on the methane yield of four agricultural by-products. Bioresour. Technol. 2012, 104, 708–714. [Google Scholar] [CrossRef]
  44. Surendra, K.C.; Khanal, S.K. Effects of crop maturity and size reduction on digestibility and methane yield of dedicated energy crops. Bioresour. Technol. 2015, 178, 178–193. [Google Scholar] [CrossRef]
  45. Pekařová, S.; Dvořáčková, M.; Stloukal, P.; Ingr, M.; Šerá, J.; Koutny, M. Quantitation of the Inhibition Effect of Model Compounds Representing Plant Biomass Degradation Products on Methane Production. Bioresources 2017, 12, 2421–2432. [Google Scholar] [CrossRef] [Green Version]
  46. Ghasimi, D.S.M.; Aboudi, K.; de Kreuk, M.; Zandvoort, M.H.; van Lier, J.B. Impact of lignocellulosic-waste intermediates on hydrolysis and methanogenesis under thermophilic and mesophilic conditions. Chem. Eng. J. 2016, 295, 181–191. [Google Scholar] [CrossRef]
  47. Chen, Y.; Cheng, J.J.; Creamer, K.S. Inhibition of anaerobic digestion process: A review. Bioresour. Technol. 2008, 99, 4044–4064. [Google Scholar] [CrossRef]
  48. Chapleur, O.; Civade, R.; Hoyos-Hernandez, C.F.; Mazéas, L.; Bouchez, T. Growing concentrations of phenols increasingly modify microbial communities’ dynamics and perfomances’ stability of anerobic digesters. In Proceedings of the 13th World Congress on Anaerobic Digestion: Recovering (bio) Resources for the World, Santiago de Compostella, Spain, 25–28 June 2013; Available online: https://hal.archives-ouvertes.fr/hal-01118701 (accessed on 20 April 2022).
  49. Wirth, B. Anaerobic Treatment of Liquid By-Products from Hydrothermal Carbonization of Biomass. Ph.D. Thesis, Technische Universität Berlin, Berlin, UK, 2020. [Google Scholar]
  50. Myszograj, S. Biogas and Methane Potential of Pre-Thermally Disintegrated Bio-Waste. Energies 2019, 12, 3880. [Google Scholar] [CrossRef] [Green Version]
  51. Şenol, H.; Açikel, Ü.; Demir, S.; Oda, V. Anaerobic digestion of cattle manure, corn silage and sugar beet pulp mixtures after thermal pretreatment and kinetic modeling study. Fuel 2020, 263, 116651. [Google Scholar] [CrossRef]
  52. Phuttaro, C.; Sawatdeenarunat, C.; Surendra, K.C.; Boonsawang, P.; Chaiprapat, S.; Khanal, S.K. Anaerobic digestion of hydrothermally-pretreated lignocellulosic biomass: Influence of pretreatment temperatures, inhibitors and soluble organics on methane yield. Bioresour. Technol. 2019, 284, 128–138. [Google Scholar] [CrossRef] [PubMed]
  53. Boopathy, R. Anaerobic biotransformation of furfural to furfuryl alcohol by a methanogenic archaebacterium. Int. Biodeterior. Biodegrad. 2009, 63, 1070–1072. [Google Scholar] [CrossRef]
  54. Meyer, T.; Edwards, E.A. Anaerobic digestion of pulp and paper mill wastewater and sludge. Water Res. 2014, 65, 321–349. [Google Scholar] [CrossRef] [PubMed]
  55. McVoitte, W.P.A.; Clark, O.G. The effects of temperature and duration of thermal pretreatment on the solid-state anaerobic digestion of dairy cow manure. Heliyon 2019, 5, e02140. [Google Scholar] [CrossRef] [Green Version]
  56. Yin, J.; Liu, J.; Chen, T.; Long, Y.; Shen, D. Influence of melanoidins on acidogenic fermentation of food waste to produce volatility fatty acids. Bioresour. Technol. 2019, 284, 121–127. [Google Scholar] [CrossRef]
  57. Wang, S.; Hu, Z.Y.; Geng, Z.Q.; Tian, Y.C.; Ji, W.X.; Li, W.T.; Dai, K.; Zeng, R.J.; Zhang, F. Elucidating the production and inhibition of melanoidins products on anaerobic digestion after thermal-alkaline pretreatment. J. Hazard. Mater. 2021, 424, 127377. [Google Scholar] [CrossRef]
  58. Hahn, H.; Krautkremer, B.; Hartmann, K.; Wachendorf, M. Review of concepts for a demand-driven biogas supply for flexible power generation. Renew. Sustain. Energy Rev. 2014, 29, 383–393. [Google Scholar] [CrossRef]
  59. Szarka, N.; Scholwin, F.; Trommler, M.; Jacobi, H.F.; Eichhorn, M.; Ortwein, A.; Thrän, D. A novel role for bioenergy: A flexible, demand-oriented power supply. Energy 2013, 61, 18–26. [Google Scholar] [CrossRef]
  60. Peters, L.; Uhlenhut, F.; Biernacki, P.; Steinigeweg, S. Status of demand-driven biogas concepts to cover residual load rises. ChemBioEng Rev. 2018, 5, 163–172. [Google Scholar] [CrossRef]
  61. Scherzinger, M.; Kaltschmitt, M. Techno-economic assessment of common reed and sewage suldge co-fermentation improved by vapothermal pre-treatment. Clean Technol. Environ. Policy 2021, 23, 2741–2755. [Google Scholar] [CrossRef]
  62. Mainardis, M.; Buttazzoni, M.; Gievers, F.; Vance, C.; Magnolo, F.; Murphy, F.; Goi, D. Life cycle assessment of sewage sludge pretreatment for biogas production: From laboratory test to full-scale applicability. J. Clean. Prod. 2021, 322, 129056. [Google Scholar] [CrossRef]
Figure 1. Experimental setup of Hohenheim Biogas Yield Test (HBT) with syringe (a) and rotational drum (b) placed in the incubator [21,22].
Processes 10 01048 g001
Figure 2. First order model fits illustrated by experimental data (black points) and predicted values by the first-order model (black line) and the first-order two-step model (red line) for untreated wheat straw (a) and hydrothermally pretreated wheat straw samples (b) HTP-160-15; (c) HTP-160-45; (d) HTP-170-30; (e) HTP-180-15; (f) HTP-180-45.
Processes 10 01048 g002aProcesses 10 01048 g002b
Figure 3. Photographs of untreated wheat straw (a) and hydrothermally pretreated wheat straw samples with different pretreatment severity (b) HTP-160-15; (c) HTP-160-45; (d) HTP-170-30; (e) HTP-180-15; (f) HTP-180-45.
Processes 10 01048 g003aProcesses 10 01048 g003b
Table 1. Pretreatment conditions for hydrothermal wheat straw disintegration based on 2k-factorial design.
Temperature [°C]Retention Time [min]
153045
160HTP-160–15 HTP-160-45
170 HTP-170-30
180HTP-180-15 HTP-180-45
Table 2. Content of soluble organic fractions in process water under different hydrothermal pretreatment conditions considering acids, sugars and COD.
ExperimentAcetic Acid aFormic Acid aGlucose aXylose aArabinose aCOD a
[mg L−1l][mg L−1][mg L−1][mg L−1][mg L−1][gO2 L−1]
HTP-160-15627.4 ± 11.784.7 ± 1.2132.5 ± 32.5n. d. b171.5 ± 29.58.6 ± 0.1
HTP-160-45826.4 ± 22.8113.9 ± 3.249.6 ± 6.6n. d. b343.0 ± 3.011.6 ± 0.1
HTP-170-301078.5 ± 17.6161.3 ± 11.633.4 ± 7.7n. d. b372.6 ± 16.016.1 ± 0.8
HTP-180-151252.3 ± 20.9210.4 ± 4.331.3n. d. b374.5 ± 12.518.6 ± 0.1
HTP-180-451626.8 ± 15.8368.0 ± 3.241.3 ± 3.7346.5 ± 7.5543.0 ± 76.021.2 ± 0.3
a Data in table are exhibited in form of “Mean ± standard deviation”, b Component not detected (n. d.).
Table 3. Coefficients estimated by multiple linear regression of the physicochemical characterization of process water samples of wheat straw considering acids, sugars and COD.
Fitted Model [2FI]Responses
CoefficientsAcetic AcidFormic AcidGlucoseArabinoseCOD
Intercept1081.76 *179.88 *53.26 *370.14 *15.49 *
X1356.34 *94.94 *−29.46 *100.75 *4.89 *
X2143.37 *46.69 *−16.1185.00 *1.41 *
X1X243.87 *32.09 *25.31 *−0.7500−0.0850
R20.99790.99920.66790.85640.9632
p of F model<0.0001 *<0.0001 *0.0155 *0.0002 *<0.0001 *
X1: Temperature, X2: Time, X1X2: Interaction between temperature and time. * Indicates estimates of significant parameters (p < 0.05).
Table 4. Content of soluble organic fractions in process water under different hydrothermal pretreatment conditions considering furanic and phenolic compounds.
ExperimentFurfural a5-HMF aGuaiacol aSyringol aVanillin aSyringaldehyde a
[mg L−1][mg L−1][mg L−1][mg L−1][mg L−1][mg L−1]
HTP-160-1513.8 ± 2.0n. d. b2.6 ± 0.01.6 ± 0.08.6 ± 0.03.0 ± 0.0
HTP-160-4541.2 ± 9.0n. d. b3.2 ± 0.22.0 ± 0.111.9 ± 0.04.2 ± 0.1
HTP-170-3065.7 ± 5.7n. d. b3.5 ± 0.22.4 ± 0.115.2 ± 0.45.5 ± 0.2
HTP-180-1588.1 ± 4.7n. d. b4.7 ± 1.23.3 ± 0.817.1 ± 0.16.3 ± 0.0
HTP-180-45368.3 ± 11.112.6 ± 0.84.9 ± 0.34.5 ± 0.022.0 ± 1.29.1 ± 0.2
a Data in table are exhibited in form of “Mean ± standard deviation”, b Component not detected (n. d.).
Table 5. Coefficients estimated by multiple linear regression of the physicochemical characterization of process water samples of wheat straw considering furanic and phenolic compounds.
Fitted Model (2FI)Responses
CoefficientsFurfuralGuaiacolSyringolVanilinSyringaldehyde
Intercept101.53 *3.69 *2.69 *15.12 *5.48 *
X1100.35 *0.9387 *1.04 *4.65 *2.04 *
X276.93 *0.1787 *0.4075 *2.07 *1.01 *
X1X263.20 *−0.09370.1700 *0.40000.4038 *
R20.92160.64800.83880.97080.9617
p of F model<0.0001 *<0.0123<0.0003<0.0001<0.0001
X1: Temperature, X2: Time, X1X2: Interaction between temperature and time. * Indicates estimates of significant parameters (p < 0.05).
Table 6. Finale methane yields of untreated and hydrothermally pretreated (HTP) wheat straw samples, including increase in BMP, significance (Games–Howell post-hoc) and confidence level of 95%.
ExperimentBMP Confidence Level of 95%
IncreaseSignificanceDowner LimitUpper Limit
[mL g−1 VS][%][-][-][-]
Untreated261 ± 15----
HTP-160-15302 * ± 17160.013−79.40−7.64
HTP-160-45310 * ± 14190.004−72.50−12.72
HTP-170-30299 * ± 14150.002−74.96−18.56
HTP-180-15298 * ± 9140.013−66.95−6.94
HTP-180-45289 * ± 9110.043−58.40−0.80
* Indicates significant differences (p < 0.05) in BMP between untreated and pretreated wheat straw samples (confidence level 95%).
Table 7. Results of kinetic parameter determination.
Model AModel B
ExperimentSmaxkR2SmaxkHkVFAR2
[mL g−1 VS][d−1][-][mL g−1 VS][d−1][d−1][-]
Untreated279 ± 10.270.08 ± 0.010.99266 ± 11.430.10 ± 0.011.02 ± 0.231.00
HTP-160-15324 ± 31.130.10 ± 0.000.98306 ± 27.300.15 ± 0.020.65 ± 0.231.00
HTP-160-45317 ± 12.900.11 ± 0.000.98301 ± 13.840.17 ± 0.010.62 ± 0.071.00
HTP-170-30318 ± 22.680.12 ± 0.000.98300 ± 19.500.23 ± 0.040.49 ± 0.101.00
HTP-180-15311 ± 24.010.13 ± 0.010.98293 ± 19.980.29 ± 0.030.39 ± 0.071.00
HTP-180-45308 ± 16.490.13 ± 0.000.97291 ± 15.800.32 ± 0.010.32 ± 0.011.00
Publisher’s Note: MDPI stays neutral with regard to jurisdictional claims in published maps and institutional affiliations.

