
Potential for Biomethanisation of CO2 from Anaerobic Digestion of Organic Wastes in the United Kingdom


Water and Environmental Engineering Group, University of Southampton, Southampton SO16 7QF, UK
*
Authors to whom correspondence should be addressed.
Processes 2022, 10(6), 1202; https://0-doi-org.brum.beds.ac.uk/10.3390/pr10061202
Submission received: 31 May 2022
/
Revised: 13 June 2022
/
Accepted: 14 June 2022
/
Published: 16 June 2022
(This article belongs to the Special Issue New Frontiers in Anaerobic Digestion (AD) Processes)
Abstract
:The United Kingdom (UK) has a decarbonisation strategy that includes energy from both hydrogen and biomethane. The latter comes from the growing anaerobic digestion (AD) market, which in 2020 produced 23.3 TWh of energy in the form of biogas. According to the strategy, this must be upgraded to biomethane by removal of carbon dioxide (CO2): a goal that could also be fulfilled through CO2 biomethanisation, alleviating the need for carbon capture and storage. Results are presented from a survey of publicly available datasets coupled with modelling to identify potential scale and knowledge gaps. Literature data were used to estimate maximum biomethane concentrations by feedstock type: these ranged from 79% for food wastes to 93% for livestock manures. Data from various government sources were used to estimate the overall potential for CO2 biomethanisation with current AD infrastructure. Values for the uplift in biomethane production ranged from 57% to 61%, but the need for more consistent data collection methodologies was highlighted. On average, however, if CO2 biomethanisation was applied in all currently operating UK AD plants an energy production uplift of 12,954 GWh could be achieved based on 2020 figures. This is sufficient to justify the inclusion of CO2 biomethanisation in decarbonisation strategies, in the UK and worldwide.

1. Introduction
CO2 biomethanisation is the microbially mediated transformation of carbon dioxide (CO2) to methane (CH4) via the addition of exogenous hydrogen (H2), according to the overall reaction shown in Equation (1):
4 H2 + CO2 → CH4 + 2 H2O
The process has clear potential applications in the anaerobic digestion (AD) industry, which utilises microbial communities to transform a wide variety of organic materials into biogas, a mixture of biomethane and CO2 [1]. These mixed communities already contain the hydrogenotrophic methanogens which catalyse the direct CO2 biomethanisation route shown in Equation (1), as well as syntrophic organisms able to mediate indirect routes, e.g., via homoacetogenesis and acetoclastic methanogenesis [2,3]. The combination of AD with H2 addition to promote CO2 biomethanisation can thus improve the methane productivity of digesters fed on organic feedstocks [4], increasing the energy output (and therefore, viability) [5,6] and enhancing the carbon utilisation efficiency [7].
The United Kingdom (UK) has a well-established AD market, with initial incentives for distributed small-scale (<5 MWe) electricity production introduced in the 2002 Renewables Obligation (RO) and the 2010 Feed-In Tariff (FIT). It is, however, becoming increasingly common practice in many countries to upgrade biogas to biomethane by removal of CO2 and other impurities [4,8]. This is because biomethane is valuable as a low carbon fuel that can be utilised locally or upgraded to share existing natural gas storage and distribution networks for use in heating, transport and the centralised generation of electricity [4].
Biomethane production in the UK has been promoted by the Renewable Heat Incentive (RHI), which accepted applicants between 2011 and 2021. This was followed by the Green Gas Support Scheme (GGSS), introduced in late 2021 and designed to encourage the production of biomethane for gas grid injection, with a minimum of 50% of the gas coming from wastes. The GGSS reflects the UK Government’s ongoing commitment to increasing the growth of biomethane production through AD, based on the advice and projections of the Climate Change Committee (CCC) in its Sixth Carbon Budget [9]. The CCC calculates that biomethane/biogas could displace up to 10% of UK demand for natural gas and predicts that by 2030, biomethane production could more than treble from 2020 levels. Furthermore, by 2035, it could abate the equivalent of 1.5 million tonnes year−1 of CO2 through fossil gas displacement [9].
Hydrogen also plays an important part in the UK’s decarbonisation scenario, with plans to kick-start a mass market for hydrogen by reformation of fossil gas accompanied by carbon capture and storage (CCS). In addition, electrolytic hydrogen production from excess renewables will also be developed in a ‘Balanced Pathway’ scenario, in which reformed hydrogen will provide 60% of the requirement by 2035, after which, this proportion will decrease in favour of electrolytic hydrogen production, which will make up almost 50% of the rising target for production by 2050 [9].
The current UK strategy proposes that biomethane targets are met through refining biogas to remove the biogenic CO2, which will subsequently require permanent storage, i.e., through carbon capture and storage (CCS) solutions. As biomethane and electrolytic hydrogen production are already part of the UK’s energy strategy, however, it also makes sense to consider the potential role of CO2 biomethanisation of organic wastes. This could address the upgrading requirement, utilising existing AD assets at a relatively low capital cost [5,10] with the added bonus of increasing overall methane yields, and the prospect that the process may be more energetically efficient and cheaper than CCS with its as-yet-unknown costs. CO2 biomethanisation thus offers both a means to support the transition from carbon-based fuels to hydrogen, and a rational long-term solution to maximise the energetic value of biomass carbon-based renewable fuels in their own right.
Nevertheless, future policy which considers this option cannot be formulated and then prescribed without the necessary data for modelling and assessment. CO2 biomethanisation is still in its early stages as a commercial process, with only a few examples of plants operating at scale [7], almost all of which are based on the use of separate dedicated bioreactors fed on gaseous inputs in ex situ processes [3,5]. There is, however, a growing body of research on in situ and hybrid processes in which H2 alone or with additional CO2 is injected directly into a digester, with a variety of organic feedstocks, equipment configurations and operating conditions. There is thus a need to assess the available data with regard to anticipated improvements in process performance, and to the scale of existing AD resources in the UK. The outcomes can then be considered in the context of dynamic economic, technology and infrastructure developments in renewable power and hydrogen production, and use.
As a first step in this complex journey, the current work has carried out a high-level review of the potential scale of application in the UK, supported by an assessment of reported data on in-situ CO2 biomethanisation performance according to feedstock type. This provides an essential starting point for identifying research and policy needs for the integration of CO2 biomethanisation as a contributor to the UK future energy mix and for assessment of its potential role in the transition from a fossil-based energy system.
2. Materials and Methods
2.1. Performance of CO2 Biomethanisation of Organic Feedstocks
The objective of this part of the work was to establish values for the increases in methane production and biogas methane content that could be achieved through CO2 biomethanisation of a range of organic feedstocks. To achieve this, experimental results were collated from relevant studies, focusing primarily on addition of exogenous H2: a small number of studies examining approaches such as syngas addition were also considered, but bioelectrochemical systems were not included as, although promising, the technology is some way from large-scale application [4,11].
Parameters taken from the literature included substrate type, operating temperature (°C), digester configuration and characteristics, organic loading rate (OLR) expressed as g volatile solids (VS) L−1 day−1 or g Chemical Oxygen Demand (COD) L−1 day−1, hydraulic retention time (HRT, days) and operating pH. Reported and/or calculated values for specific methane potential (SMP: L CH4 g−1 VS or L CH4 g−1 COD), volumetric methane production (VMP: L CH4 L−1 digester day−1), H2 input (L H2 L−1 day−1) and output gas composition (% volume) were used to calculate the change in SMP and VMP due to CO2 biomethanisation. Note that the term SMP is used here to refer to the total volume of methane produced, from both anaerobic degradation of organic material and biomethanisation of CO2 where applicable, per unit of organic feed added. Similarly, the VMP is based on the total volume of methane produced from both sources, per unit working volume of reactor per unit time. The difference between VMP with and without addition of H2 (or H2 and exogenous CO2) is assumed to be methane produced from CO2 biomethanisation and is referred to as the Methane Evolution Rate (MER: L CH4 L−1 day−1). The CO2 removal rate (CRR) is similarly defined as the difference between volumetric CO2 output (L CO2 L−1 day−1) with and without H2 addition, adjusted for any additional exogenous CO2 input. The terms volumetric biogas production and volumetric gas production (VBP and VGP, L L−1 day−1) were used to distinguish between the sum of methane and carbon dioxide outputs, and the total gas output including any residual H2, respectively. More detailed nomenclature and definitions are provided in Supplementary Materials S1.
A number of other parameters based on the above data were also evaluated. The H2 transfer efficiency E (%) refers to the proportion of H2 successfully transferred into the system, i.e., not leaving in gaseous form in the output gas; and is calculated from (H2 input-H2 output)/H2 input, with inputs and outputs in L H2 L−1 day−1. The expected MER is the amount of H2 transferred divided by 4, based on reaction stoichiometry, and is equal to the expected CRR; these values can then be compared with the actual observed MER and CRR. The ratios between actual MER and actual CRR; actual MER and original volumetric CO2 output (without CO2 biomethanisation); VBP with and without CO2 biomethanisation; H2 transferred to actual MER and actual CRR; and H2 input to original volumetric CO2 output (without CO2 biomethanisation) were also determined.
Where control reactors without H2 addition were operated, the change in SMP or VMP due to CO2 biomethanisation was taken as the difference between control and experimental values during the same period; in trials without controls, experimental values were compared with those of a baseline period without H2 addition. Where multiple sets of conditions were tested, the best performance in terms of SMP and/or biogas methane content under apparently stable conditions is shown. As far as possible, calculations were carried out in a standard manner. In some cases, this means values differ slightly from those reported in the original paper. Wherever possible, the consistency of results was checked by comparing reported and calculated values: e.g., under steady state conditions SMP × OLR = VMP. If some aspect appeared unclear or inconsistent, the authors were contacted to request additional information. More details of calculation methods are provided in the Supplementary Materials.
Digestion systems operating in the temperature range 35–40 °C are referred to as mesophilic, and between 50–60 °C as thermophilic. Unless specified, standard temperature and pressure (STP) values of 0 °C and 101.325 kPa were assumed and applied throughout this work.
To provide indicative values for modelling, outputs from individual studies were grouped into the following feedstock types: livestock manures, crop materials and agro-wastes, food wastes, the organic fraction of municipal solid waste (OFMSW) and sewage sludges. In some cases, there was no single study that directly demonstrated the maximum achievable SMP and biogas methane content for a given feedstock type. Where possible, this was estimated from baseline pH and biogas CO2 concentrations (i.e., without CO2 biomethanisation) and observed or assumed maximum pH values for stable operation with CO2 biomethanisation, using an equation derived and tested for this purpose [12].
2.2. AD Feedstock/Energy Production Data and Calculations
Several potential sources of data on AD feedstock quantities and energy production are available and were assessed for use in the current work. Those selected for use were derived from freely available public sources. The most detailed is the dataset which accompanies the Renewable Obligation’s Annual Report (2019–20) [13], produced by the Office of Gas and Electricity Markets (Ofgem), the regulator for the electricity and natural gas markets in Great Britain. All RO biomass electricity generators over 50 kWe are required to report on feedstock sustainability criteria in two areas: greenhouse gas (GHG) criteria for national emissions data collection; and land criteria, to assess land use and potential change [14]. The resulting data are expressed as volume of biogas produced for each of 10 feedstock categories aggregated from the RO feedstock consignment sustainability data (RO-SUS) [15]. In order to derive fresh feedstock tonnages, biomethane content and the energetic value of the biomethane from the biogas data, these feedstock categories were characterised using data from the University of Southampton’s Anaerobic Digestion Assessment Tool (ADAT) [16], and from the literature review.
A similar feedstock characterisation and energy calculation exercise was carried out on AD feedstock volume data provided by the UK Government’s Department for Environment, Food and Rural Affairs (Defra) [17]. Results were compared with the RO data where possible.
Values used in the RO/Defra feedstock calculations were applied to the energy production data in the 2021 UK Digest of UK Energy Statistics (DUKES) [18] for anaerobic digestion and sewage gas. The DUKES data, which are produced by the UK Government’s Department for Business, Energy and Industrial Strategy (BEIS) from a wide array of other sources, were also used to provide a wider overview.
3. Results and Discussion
3.1. Performance of CO2 Biomethanisation by Feedstock Type
Several excellent reviews on CO2 biomethanisation have recently been published, from the wider perspective of biogas upgrading [4,19] to those more specifically focused on the biological process [3,11] and ranging from technical assessment to fundamental biochemical aspects [2,5,6]. This part of the current work considered the same data from the viewpoint of assessing the achievable performance according to feedstock type. An ideal study for this purpose accurately simulates large-scale operation, but in practice, this can be challenging: common issues include the fact that laboratory-scale reactors may be fed only once per day and/or 5 days per week, while feeding of commercial digesters is usually more frequent. Arrangements for the supply and recirculation of external and headspace gases are also different at large and small scale, with laboratory experiments relying on a variety of approaches from continuous or intermittent input with or without recycling to daily injection under pressure. These affect the availability of exogenous gases over time, and further interact with different modes organic waste feeding which in turn influence the in-situ gas composition. Perhaps most importantly, reactor mixing and mass transfer parameters can vary considerably with scale. All of these factors may affect the biochemical environment, microbial community and metabolic pathways which determine the achievable methane yields and concentrations. In addition, experiments are designed for a range of different purposes and do not necessarily provide data on the maximum stable methane yield or concentration; nonetheless, these studies provide an indication of the potential performance and what is known to date.
In some cases, issues were encountered when attempting to put data from different sources into a comparable format. Some studies include residual H2 in the reported biogas production, while others do not: not all specify this. Most studies indicate that reported gas volumes have been normalised to STP, but not all state which STP conditions are used. When gas compositions are reported, the main components (CH4, CO2, H2) do not always sum to 100%: authors do not always state whether they are reporting dry and/or normalised gas volumes, or whether any discrepancies are due, e.g., to variability in experimental measurement or to the inclusion of water vapour and other trace gases. A range of different terms are used to describe the proportion of input H2 that is consumed, and the resulting increase or decrease in CH4 and CO2 produced. There is a clear need for more consistent reporting, and a comprehensive set of standards for this purpose has been proposed [20].
3.1.1. Livestock Manures
Starting with the earliest work on in situ CO2 biomethanisation of waste feedstocks [1], several studies have been conducted using cattle manure (CM) as the sole or main substrate. Luo et al. [1] ran duplicate CSTR digesters for 3 HRT at an OLR of around 6 g VS L−1 day−1 using sieved CM diluted by a factor of 2 for ease of small-scale operation. H2 was added continuously to one digester via two ceramic diffusers at around four times CO2 production (H2/CO2 ratio 4:1 v/v), while the other digester continued operating as a control. The experiment aimed to demonstrate the principle rather than to optimise the system: specific methane production per unit of organic feed (SMP) rose from 60 to 73 L CH4 kg−1 VS but the biogas methane concentration only increased from 62% to 65% due to unconverted H2 in the output gas.
Two-stage systems in which the first digester was fed twice daily on CM were tested by Bassani et al. [21]. The second digester received biogas and digestate from the first, with exogenous H2 added at four times the initial CO2 volume. One system was operated under mesophilic and one under thermophilic conditions. As expected, the thermophilic system gave higher specific and volumetric methane yields than the mesophilic. Both systems had higher specific methane yields than those obtained by Luo et al. [1], probably at least in part due to the longer overall HRT; but VMP in the mesophilic system was lower than in Luo et al. [1] because of the requirement for a second reactor. The methane concentration was 88.9% in the mesophilic system and 85.1% for the thermophilic, reflecting a higher residual H2 content in the thermophilic system. The same system configuration and operating conditions were used to investigate changes in performance and microbial community over an extended period [22]. Results for the early stages of stable operation were similar to those of Bassani et al. [21]; but after two years of operation, biogas methane content was increased to around 99%, with an associated rise in both pH and volatile fatty acid (VFA) concentration. The VFA was primarily acetate, and was attributed to enhanced homoacetogenesis accompanied by changes in the microbial population.
Wahid and Horn [23] used a 2-stage system with two 6-L CSTRs operating in series at 55 °C. The first reactor was fed on CM at an HRT of 15 days, while the second received biogas and digestate from the first at an HRT of 20 days. After 120 days of stable operation, H2 was added initially at a 2/1 H2/CO2 ratio, and subsequently at 4/1. Mixing speeds and gas recirculation rates were varied. There are some inconsistencies between reported values for OLR, SMP and VMP but the highest observed increase in SMP was 90%, similar to the value found by Treu et al. [22], though H2 transfer efficiency was lower, resulting in a higher residual H2 content.
Lebranchu et al. [24] operated a 142-L CSTR with a working volume of 100 L at 40 °C. The digester was fed continuously on CM with a VS content of 11% at an HRT of 28 days; the source of inoculum is not stated. H2 was added continuously via a silicone tube diffuser without gas recirculation, and digester contents were mixed by helical and Archimedes screw mixers. The trial ran for 2.5 HRT with H2 addition rates increasing from zero to 0.17, 0.29 and 0.45 L H2 L−1 day−1. This was followed by trials at different mixing speeds, then additional exogenous CO2 was injected at 0.05 L CO2 L−1 day−1 with a matching stoichiometric increase in H2. SMP rose from 0.186 to 0.221 L CH4 g−1 VS with H2 addition, and to 0.236 L CH4 g−1 VS with exogenous CO2 and H2. The relatively large scale, simple configuration and operating mode of this study make these results particularly useful in estimating the possible performance of conventional commercial systems.
Diluted pig manure was digested at mesophilic and thermophilic temperatures under different mixing conditions in CSTRs operating at an OLR of 2 g VS L−1 day−1 and an HRT of 25 days [25,26,27]. Under the same operating conditions, thermophilic digestion gave higher specific and volumetric methane yields than mesophilic. The highest SMP was observed in thermophilic conditions with continuous mixing and addition of H2 and sodium formate [25], although the biogas methane concentration was lower than without the H2 addition due to the presence of residual H2 in the output gas. The greatest increase in SMP was under mesophilic conditions with H2 addition and intermittent mixing [26]; in this case, methane production decreased with continuous stirring. The different response of the two systems to a change from intermittent to continuous stirring was attributed to different effects on alkalinity, TAN, VFA concentration and pH associated with CO2 dissolution in the liquid phase.
No studies appear to have used other livestock manures as a mono-substrate, although digestate from a 2-stage system fed on chicken manure was used to inoculate reactors receiving exogenous H2 and CO2 and to replenish buffering capacity during the enrichment stage [28].
Systems with CM as a major feedstock component have been studied by several researchers. Whey has been used as an acidogenic co-substrate to counteract the pH increase associated with in situ CO2 conversion [29]. An increase of 80% in SMP was achieved in a single-stage thermophilic CSTR with ceramic diffuser and magnetic stirring [30]; the highest stirring speed led to a small reduction in methane production. The best results were achieved using a hollow fibre membrane (HFM) for H2 transfer, with an increase in SMP from 0.288 to 0.516 L CH4 g−1 VS, a biogas methane content of 96.1%, and no residual H2 detected. A two-stage thermophilic system previously operated with CM as a mono-substrate [23] was also used to test CM + whey at different feedstock ratios, feeding frequencies and stirring speeds [31]: SMP increased by up to 23% with H2 addition but residual CO2 and H2 contents were high, indicating poor mass transfer and leading to a rather low biogas methane concentration.
CM and potato starch were used as co-substrates in a 2-stage system consisting of a CSTR followed by an upflow anaerobic sludge blanket (UASB) reactor, with H2 added to the first stage and gas recirculated between the stages [32]. H2 transfer efficiencies were around 98.5% but VFA accumulation occurred, and stable operation with H2 addition was not achieved: the results are therefore not shown in Table S1.
Mesophilic digestion of CM and vegetable wastes was carried out in a 2-stage reactor at a reported OLR of 3.5 g VS L−1 day−1 and HRT of 10 days, under a range of gas recirculation and H2 addition rates [33]. H2 addition gave increases in SMP of around 67% and 157% with and without optimised gas recirculation, respectively. The 2-stage system appeared capable of eliminating residual H2 and was able to achieve biogas methane concentrations of 92% without and 99% with recirculation, respectively.
For studies using other co-substrates with CM as the minor component, see the sections on crops and agro-wastes and on food wastes below.
Several other studies not shown in Table S1 have used manure or manure-based digestates and feedstocks and/or inoculum. Batch experiments with CM as substrate were carried out to investigate the effect of H2 addition at different ammonia concentrations [34,35]. Garcia-Robledo et al. [36] used micro-sensors to study the dynamics of H2 and CO2 conversion in fresh CM and CM digestate, but the experiment was not designed to establish likely yields in a typical commercial process. Lab-scale breeder reactors inoculated from CM digesters and fed on digestate from these were used to generate material for batch testing with H2 addition [37]. The work was part of a study investigating the effect of inoculum source on metabolic pathway, and also tested wastewater biosolids digestate; but again, the aim was not to simulate performance in a full-scale process.
The results in Table S1 confirm that useful increases in SMP can be achieved by biomethanisation of CO2 in CM digestion: this is of particular interest for this substrate, which is known for its low energy potential, making small-scale on-farm digestion economically challenging [38]. High rates of H2 transfer and conversion were demonstrated in several of the studies. Membrane systems (ceramic and HFM) generally achieved good transfer without gas recirculation, while digester mixing also had an effect, although high mixing rates did not always improve methane yields [26,29,31]. Mixing and mass transfer performance are strongly affected by scale: effective mixing is more difficult to achieve in a full-scale plant, while depth and pressure effects may contribute to improved gas transfer [39,40,41]. Understanding of these effects and how they interact with system biology is still in its early stages, and more research at pilot and full scale is clearly needed if industry is to have confidence in adopting these technologies [3,4].
As can be seen from Table S1, the change in biogas methane content brought about by CO2 biomethanisation is highly dependent on the applied H2 loading and the effectiveness of the transfer method, as well as requiring the presence of an appropriate microbial population. Residual unconverted H2 reduces the methane concentration in the output gas. Depending on the intended end-use, this may be a significant issue, while low transfer and conversion rates arguably represent a waste of H2. Two-stage systems were able to achieve a high methane content, but provision of a second digester is expensive, especially if heating and mixing are applied. In the systems described here, the primary digester generally received both organic feed and H2, with biogas and digestate then passed to the secondary digester to improve the H2 conversion with or without further gas recirculation. This approach is already a step towards ex-situ biomethanisation, in which case, a reactor type with more efficient gas transfer may be preferred. Many manure digesters have unheated static tanks for digestate storage, however, so there may also be scope for research on whether and how these could be adapted to fulfil a similar role in increasing H2 conversion.
Values for VMP and MER varied considerably between the studies in Table S1, reflecting differences in substrate properties and concentration/dilution, as well as the presence of residual unconverted H2 and CO2. These parameters are commercially significant, however, and care is therefore needed when interpreting or reporting them. Co-digestion of Whey + CM may be attractive as a means of increasing the volumetric and specific methane productivity as well as reducing the pH, while both substrates may be locally available in dairy areas.
Conclusions for pig manure were broadly similar to those for CM, despite some differences in the typical characteristics for these substrates [16].
Most of the studies reported in Table S1 were carried out under thermophilic conditions, which generally give a higher SMP at a shorter HRT than mesophilic manure digestion [21]. Thermophilic digestion of CM is not widely practiced in the UK, however; and in combination with the different conditions applied in different studies, this makes it difficult to choose appropriate values for use in the current modelling. It was therefore decided to take typical baseline values for mesophilic CM digestion of SMP 0.190 L CH4 g−1 VS, biogas composition 60:40% CH4: CO2 and pH 7.5 [16,24], and apply the pH/pCO2 relationship developed in Tao et al. [12]. Assuming stable mesophilic operation with H2 addition is possible at pH 8.2 (Table S1, [21]), this equates to a biogas methane content of 95% and SMP around 0.300 L CH4 g−1 VS with CO2 biomethanisation. These values are summarised in Table 1 for application in the modelling stage of this work.
3.1.2. Crops and Agro-Wastes
Relatively few CO2 biomethanisation studies to date have focused on these substrates. A comparison of different possible scenarios for in-situ and ex-situ CO2 biomethanisation was carried out based on experimental data for grass silage [42]. Only in-situ results are included in Table S1, although ex-situ systems may correspond to the second stage of a two-stage process in some operating configurations. In this part of the study, the grass silage was digested thermophilically in a single-stage CSTR at an OLR of 4 g VS L−1 day−1 and HRT of 46 days using two types of diffuser. The findings demonstrated once again the importance of effective mass transfer, with the ceramic diffuser achieving a 68% increase in SMP compared to 19% for the low-capacity diffuser, and quite creditable VMP and MER values, although still with a significant residual H2 content.
130-L anaerobic filters (AF) fed on maize silage hydrolysate were trialled at two H2/CO2 ratios, using a venturi nozzle for gas injection and with both liquid and gas recirculation [43]. The AF acted as the methanogenic reactors in a 2-stage system, in which the first stage was a continuously stirred acidification reactor fed on maize silage with a small component of sugar beet silage effluent. The fixed bed in the AF consisted of high-density polyethylene bio-media with a specific surface area of 312 m2 m−3. The AF configuration offers potential advantages in biomass retention and gas transfer, but previous studies have focused on ex-situ biomethanisation. It should be noted that some values presented in Table S1 differ from those reported in the paper due to differences in definition and calculation methods. Maize silage was also the feedstock in a 2-phase thermophilic system consisting of hydrolysis and fixed-bed methanogenic reactors [44]. The authors trialled a range of hydrolysis conditions, with H2 added to the methanogenic reactor in some runs. Specific methane production is only reported for the whole system, and the control and experimental methanogenic reactors were, respectively, 145 and 180 L, making it difficult to compare performance on a volumetric basis; but methane concentrations were successfully increased to over 90%.
Digestate from an AD plant processing mixed agro-wastes was used as inoculum and feed in a single-stage mesophilic CSTR trial at different H2 loadings [45]. The feedstock of the main AD plant is not described in detail, but is believed to include pig manure, deep litter, slaughterhouse residues and some high-lipid wastes [46]. H2 was added to the headspace for up to 5 consecutive days, followed by a pause of 10–21 days, in a process described as pulsed injection. While the use of digestate in this way may be viewed as replenishing an inoculum rather than adding a substrate, the slow anaerobic biodegradation rates of some of the original feedstock components mean there is likely to be residual methane potential even after conventional digestion: in this case, the control reactor without H2 addition had an SMP of 0.293 L CH4 g−1 VS, higher than typical values for CM. This increased to 0.571 L CH4 g−1 VS at the best-performing H2/CO2 ratio tested. Although the experimental method did not simulate a conventional AD process, it confirmed the potential for CO2 biomethanisation to raise methane yields for this material, and provided some insights on process and microbial community parameters. The same set-up was used to explore the effect of H2 additions at higher and lower headspace CO2 concentrations across a range of OLR [47], with the results also showing acclimatisation over successive pulsed injection cycles (Table S2).
Two important studies using a similar mixed-agrowaste feedstock containing manure, straw, deep litter, grass and maize silage were carried out in a 1110 m3 CSTR operating at 52 °C with a HRT of 13 days [39,40]. Some details of the substrate components, which varied over the experimental period, are provided in the papers. H2 was injected using a venturi system over relatively short periods in order to allow evaluation of the mass transfer potential at different flow rates and with/without gas recirculation. These studies are not included in Table S2 as they represent short-term tests without equilibration and acclimatisation of the system; but the very large size supported by detailed analyses of performance provides valuable reassurance on the potential for full-scale application.
A full-scale thermophilic digester fed on a mixture of pig and cattle manure, maize silage and deep litter was used to provide inoculum for batch reactors. These were fed once only on maize leaf then periodically supplemented with H2, in an experiment designed to investigate metabolic pathways and microbial community structure [48]. Fed batch operation was also employed in a serum-bottle trial using inoculum from a mesophilic AD plant fed on maize and sweet sorghum silage and pig manure, with cellulose as the trial feedstock [49]. Sarker et al. [50] operated a 5-L CSTR at 39 °C, using inoculum from a food waste digester with a 0.55% w/w admixture of CM. From day 39–71 the digester was fed intermittently on CM without digestate removal. Increasing volumes of H2 were injected sequentially between days 40 and 71 into the headspace without gas recirculation. VFA concentrations increased and effective CO2 biomethanisation was not achieved, which the authors attributed to mass transfer limitations. Although these studies provide insights on the respective feedstocks and inoculums, they did not attempt to simulate conventional digestion and thus do not appear in Table S2.
Details for the two types of crop material investigated are summarised in Table S2. Digestion of grass silage in a conventional CSTR with H2 addition via a ceramic diffuser was an effective means of increasing SMP [42]: values for VMP and MER were also relatively high, thanks to the good baseline SMP and applied OLR for this substrate. The output gas contained a significant percentage of residual unconverted H2; but ratios between H2 consumed and methane produced were close to stoichiometric, giving confidence in the experimental results. In situ CO2 biomethanisation in fixed bed reactors processing maize hydrolysates was also effective at increasing SMP [43,44], though here too, there was relatively little improvement in biogas methane content under the operating modes tested. CH4 production and CO2 consumption ratios in Illi et al. [43] were lower than would be expected based on H2 transferred, possibly indicating dissolution in the liquid phase; no detailed analysis was possible for Schönberg and Busch [44] as results for the two stages could not be disaggregated.
Studies on CO2 biomethanisation of digestates from mixed agro-wastes clearly demonstrated the potential for increasing methane yields towards those typical of commercially-interesting substrates (Table S2, [45,47]). The high biogas methane concentrations achieved here reflected the pulsed addition mode of H2 operation, however, and cannot be transferred directly to conventionally operated full-scale digestion.
3.1.3. Food Wastes
Mixed food waste from a commercial AD plant, including wastes from food processing, catering, dairy production and selected abattoir waste fractions, was the substrate for a mesophilic trial with biomethanisation of both endogenous and exogenous CO2 [12]. Conversion of the internally produced CO2 increased the SMP from 0.561 to 0.776 L CH4 g−1 VS with a methane concentration of around 90% and no residual H2. Attempts to further increase the methane content led to VFA accumulation, and it was concluded that stable operation was possible up to pH 8.5. Addition of exogenous CO2 with H2 enabled a further increase in SMP to 1.215 L CH4 g−1 VS with the same biogas composition. The system achieved an impressive VMP of 5 L CH4 L−1 day−1, and the authors commented that the maximum exogenous CO2 addition was determined by the capacity of the experimental equipment rather than by any biological limitation in this case.
Source-separated domestic food waste has been widely studied because of its rising popularity as an AD feedstock. A mesophilic trial carried out using FW from a source characterised in previous work [51,52] demonstrated an increase in SMP from 0.446 to 0.719 L CH4 g−1 VS and stable operation at pH 8.1. Around 45% of CO2 was converted, but the methane content of the output gas was only around 74% due to the presence of residual H2 [53]. A combination of H2 addition and auto-generated pressure was tested as a means of increasing biogas methane concentration using a synthetic FW composed of tinned pork and beans with white bread [54]. In the example in Table S3, the quantity of H2 added was only sufficient to convert around 9% of the endogenous CO2 on a stoichiometric basis; but when combined with additional dissolution of CO2 caused by the 5-bar operating pressure, the biogas methane concentration increased to 90.6%.
Food waste from a University cafeteria was the organic substrate in a trial involving injection of a synthetic syngas consisting of H2 and carbon monoxide (CO) at a 5:4 v/v ratio [55]. Both mesophilic and thermophilic conditions were tested and the digestates were also pyrolysed to determine the properties of the resulting syngas, with a view to creating an integrated process. The authors noted that methane productivity was higher than expected from stochiometric conversion of syngas, and attributed this to synergistic effects; although the difference decreased as the trial progressed. There is some inconsistency, however, between the reported feedstock properties, OLR and HRT: a feedstock VS of 25.1 g L−1 would give an HRT of 7 days at the reported OLR. A value of 251 g VS L−1 is more typical for FW, and without dilution, would correspond to an HRT of around 71 days: the reported HRT is 20 days, however, so feedstock dilution may have been carried out to facilitate thermophilic operation without ammonia inhibition [56]. Digesters typically require around 3 HRT to approach steady-state conditions with regard to organic loading, and this washout process might offer an additional explanation for observed changes in VS and COD content if the HRT was set at 20 days. In any case, stable operation was achieved with high syngas utilisation, a methane concentration of around 64%, and an increase in SMP of around 31% and 33% in mesophilic and thermophilic conditions, respectively.
CO2 biomethanisation of thermally-treated FW digestate from a laboratory-scale digester was carried out in a trickle-bed reactor operating at 37 °C with a 10-day HRT, at different H2 loadings and recirculation rates [57]. The SMP increased from 0.248 to 0.450 L CH4 g−1 VS under the best conditions trialled, but biogas methane content was limited by the presence of residual H2, and dosing with HCl was introduced after the pH reached 8.45.
Batch experiments using food waste from a university dining hall were conducted to investigate the effect of acclimatisation and other parameters [58,59,60]. The trials used headspace injection over consecutive periods and were not designed to simulate conventional AD. There were some errors in the mass balance calculations and the H2 addition proposed is far from stochiometric needs or typical literature values (Tables S1–S4) [59]; but inoculum acclimatisation was clearly demonstrated.
Other CO2 biomethanisation studies have used specific waste streams from food processing industries. Cheese whey and related dairy wastes were used as the sole or main substrate by several researchers. Treu et al. [61] attempted to digest whey at mesophilic and thermophilic temperatures with and without CO2 biomethanisation, but were unable to achieve stable operation in thermophilic conditions. NaHCO3 was added to provide buffering during mesophilic digestion without H2 addition; and consumption of accumulated VFA may have affected methane production values in some periods. A feedstock of cheese whey permeate and cheese powder was successfully digested at 54 °C using NaOH for pH control [62]. In both studies, SMP increased with biomethanisation, but residual H2 reduced the biogas methane concentration. Co-digestion of cheese whey with CM was successful as a means of improving process stability in thermophilic conditions [61,63], though increases in methane content and SMP were relatively small under the conditions applied. The co-digestion trial begun in Treu et al. [61] was continued in a study focusing on the effects of bioaugmentation [64]: no control digester without H2 addition was run and the results are therefore not presented in Table S3.
Other food industry substrates trialled include potato starch wastewaters [65] and bioethanol distillery effluents [66]. The former was tested in a thermophilic UASB reactor with different diffuser types and gas and liquid recirculation rates. As can be seen from the results in Table S3, H2 transfer efficiency was higher with a ceramic diffuser and gas recirculation but some residual H2 was still present in the output gas. The latter study used a 148-L mesophilic anaerobic membrane bioreactor, and achieved a biogas methane content around 98% with minimal residual CO2 or H2. Both studies contained minor inconsistencies between reported values for some parameters, but clearly demonstrated that CO2 biomethanisation could successfully enhance SMP from organic wastes in these systems.
A synthetic feed containing yeast extract, sucrose and a range of nutrients was used in trials to assess the influence of OLR [67] and of total ammonia nitrogen (TAN) concentration [12] on CO2 biomethanisation performance. Mesophilic digesters at OLR of 2 and 3 g COD L−1 day−1 also received additional exogenous CO2 and H2, increasing the original SMP by more than 2-fold and giving biogas methane contents of around 90%. The limiting pH for this substrate and inoculum appeared to be around 7.9 at lower TAN concentrations, and 8.2 at higher TAN. The authors noted that further studies are needed to identify the factors determining maximum operating pH in different systems [12].
Glucose was used as a model feedstock in mesophilic reactors in a trial investigating the effect of different H2 loadings [68]. H2 was injected once per day into the headspace, which was sealed and allowed to pressurise until venting before the next injection. The inoculum used came from a digester fed primarily on cattle manure, and nutrients were provided by occasional dosing with diluted inoculum. The applied OLR was very low and pH control was required, but the mode of operation enabled a reported increase in biogas methane content from 66% to 94%. A two-stage mesophilic UASB system with glucose as the sole carbon source was tested at different OLR, H2 loadings and gas recirculation rates [69], and achieved H2 transfer efficiencies of up to 98.8% with biogas methane contents between 92–94%. Glucose was also used as the organic substrate in the trial of CO injection into a mesophilic UASB reactor [70]. The SMP increased from 0.312 to 0.536 L CH4 g−1 COD added but biogas methane content fell due to additional CO2 production, as indicated by the stoichiometric relationship shown in Equation (2):
4CO + 2 H2O → CH4 + 3CO2
Synthetic substrates are generally adopted to provide controlled conditions for laboratory studies. Where the substrate is chemically defined, the theoretical SMP and expected biogas methane content are known or can be estimated; while parameters such as operating pH may be determined by the substrate composition or be controlled for experimental purposes. In any case these materials are rarely encountered as real-world feedstocks, and thus, values for modelling purposes were not required.
The characteristics of individual waste streams from food processing industries vary widely and it is clearly not possible to choose representative values; but information on baseline digestion conditions is often available from other studies. The minimum CO2 and corresponding maximum achievable methane content for stable operation is more difficult to determine, and may depend in part on reactor type and operating conditions. In CO2 biomethanisation trials with potato starch wastewater in UASB reactors (Bassani et al., 2016), stable operation was reported at a pH 8.38 with a CO2 content 10% in the output gas. For ethanol distillery wastewater treated in an anaerobic membrane bioreactor (AnMBR) [66], the pH had reached 7.9 at a biogas methane content of 97.9% CH4 and 1.4% CO2, with a corresponding increase in SMP from 0.297 to 0.389 L CH4 g−1 VS: values close to these can therefore be taken as the maximum for this substrate for modelling purposes.
For post-consumer domestic food wastes in Europe, the SMP value is typically around 0.450 L CH4 g−1 VS [71] with a methane content of around 54%. There are no published studies to confirm the minimum biogas CO2 content or maximum pH for stable operation, so for the purposes of modelling, a maximum pH of 8.2 was conservatively assumed [53], corresponding to a biogas methane content of 79% (Table 1).
3.1.4. OFMSW
Very little work has been done on CO2 biomethanisation of OFMSW. When H2 and CO2 were batch-fed to samples from real and simulated landfill wastes, methane production was observed but homoacetogenesis was found to be the dominant pathway under the conditions used [72]. Mixtures of CM and synthetic OFMSW (composed of paper, bread and fruit and vegetable wastes) were batch digested at 55 °C at five CM:OFMSW ratios from 100:0 to 50:50 on a mass basis [73]. A nutrient medium containing glucose was added but the only source of inoculum was the fresh CM. After 24 h of fermentation, H2 and CO2 were injected continuously at a 4/1 v/v ratio for 20 days. The results confirmed that increases in VMP could be achieved using this approach, with biogas methane contents up to 97%; the values are not included in Table S2 as the study was not designed to simulate a conventional AD process. In the absence of suitable experimental findings, a baseline SMP of 0.35 L CH4 g−1 VS with a biogas methane content of 60% was adopted [16] for the purposes of modelling, with assumed baseline and maximum pH values of 7.5 and 8.2, respectively, giving a maximum methane content of 92% [53].
3.1.5. Sewage Sludges
AD is a well-established treatment technology for sewage sludges, with existing infrastructure across the water industry, making CO2 biomethanisation of these substrates an interesting prospect. Alfaro et al. [74] carried out an extended trial using two 20-L mesophilic CSTRs fed on thickened primary and secondary wastewater biosolids from a full-scale wastewater treatment plant (WWTP). H2 was injected via a HFM and the system was tested at different gas recirculation rates. The baseline SMP varied slightly with different batches of feedstock, but SMP was increased by more than 40% with a biogas methane content of 70–73% and good H2 utilisation at higher recirculation rates. A study in a mesophilic fermenter with H2 addition via bubbling and gas recirculation produced a similar improvement in SMP, and demonstrated stable operation at a biogas methane content of 90% with a maximum pH in the range 7.9–8.0 [12]. A trial using the same equipment and a similar sludge from a different wastewater treatment plant achieved a biogas methane content of 85% at pH 7.9. Addition of exogenous CO2 and H2 enabled a four-fold increase in the original SMP, but the biogas methane content fell due to the presence of residual CO2 and H2 [53].
An enrichment trial was carried out in three mesophilic CSTR digesters fed on mixed primary and secondary sludge [75]. The low feedstock solids content led to a relatively low OLR of around 1 g VS L−1 day−1 at an HRT of 15 days. Batchwise addition of H2 to the headspace produced a maximum biogas methane content of 80% with a near-stoichiometric ratio between H2 consumption and CH4 production. Another trial using sewage sludge from the same source and continuous H2 addition achieved a biogas methane content of 90% at a H2/CO2 ratio of 7/1 without any adverse effect on VS degradation or significant VFA accumulation [76].
A study combining H2 addition and pressurisation was carried out in a 35-L mesophilic digester treating mixed wastewater biosolids under a range of operating pressures and at two H2 loadings [77]. The experimental design did not include a control without H2 addition, but the best performance was achieved at the highest pressure and H2 loading tested, with a SMP of 0.418 L CH4 g−1 VS and a biogas methane content of 92.9%. Based on VS removal, it was estimated that around 0.37 L CH4 g−1 VS of the SMP was due to organic load and 0.13 L CH4 g−1 VS to CO2 biomethanisation. Digester pH remained below 7.2 presumably due to CO2 dissolution, and there were no signs of process instability or VFA accumulation. Pressurisation is likely to require more extensive modifications to reactor design and operation than H2 addition under ambient pressures, but the authors noted that process efficiency in terms of VS removal was unaffected by the changing conditions and that a pressure increase could be an effective way to enhance H2 mass transfer without incurring high energy costs.
Addition of CO was trialled in a thermophilic digester fed on mixed primary and secondary wastewater biosolids [78]. The highest SMP achieved was more than twice the value without CO addition, but the biogas methane content was low (<20%) due to the presence of both residual CO and additional CO2 generated in accordance with Equation (2). The highest SMP without residual CO was around 1.7 times the baseline value with a biogas methane content of around 30%. The CO was added via a HFM module, ensuring good dissolution despite its rather low solubility, and no signs of process inhibition were observed. A HFM module was also used to inject simulated coke-oven gas (SCOG) consisting of 92% H2 and 8% CO into a mesophilic CSTR digester fed on mixed primary and secondary sludge [79]. The maximum SMP achieved was 0.604 L CH4 g−1 VS, compared to a baseline value of 0.256 L CH4 g−1 VS without SCOG addition. Maximum biogas methane content was 98.8% with 0.3% CO2, and pH controlled to 8.0.
In other work with wastewater biosolids, Hu et al. [80] carried out batch tests using nano-scale zero-valent iron and waste iron scraps as a means of generating H2, with waste activated sludge (WAS) as an organic substrate in some set-ups. Vechi et al. [37] used lab-scale reactors inoculated with sewage sludge digestate and fed on primary and secondary sewage sludge to produce material for batch testing of H2 additions, for comparison with inoculum from CM digestion. Inoculum from a range of sources including digestion of sewage sludge, paper mill sludge, cattle and poultry manures and FW, plus aerobic wastewater sludge, was tested to investigate the immediate response of different microbial communities to exposure to high H2 partial pressures [81]. These studies did not attempt to simulate typical operating regimes but provide a variety of insights on microbial populations and metabolic pathways.
Apart from one study of with CO addition [78], all of the work presented in Table S4 was carried out under mesophilic conditions, reflecting the current widespread use of this temperature range by the water industry. CO2 biomethanisation gave useful increases of 40–50% in SMP. VMP remained low, reflecting the dilute nature of this substrate, but high values were achieved when additional CO2 and H2 were added [53], reinforcing the observation that at sites with multiple digesters a single digester retrofitted for H2 injection should be capable of processing biogas from several others [12]. Good H2 transfer was achieved at the scales tested even without membrane diffusers, and ratios between H2 consumed and methane produced were close to stoichiometric values. The results indicate that CO2 biomethanisation of this type of substrate can operate stably in a pH range of 7.9–8 [12,74] corresponding to a max biogas methane content around 90% [12]. Baseline SMP values without CO2 biomethanisation vary depending on factors such as HRT, OLR and the proportion of primary and secondary wastewater biosolids: for the conventional CSTR trials reported here, they ranged from 0.21 to 0.3 L CH4 g−1 VS with a biogas methane content of 60–65%. These correspond well to typical values of 0.260 L CH4 g−1 VS and 60% CH4 given by ADAT [16], and were therefore taken forward into Table 1.
3.1.6. Conclusions from Performance Analysis for CO2 Biomethanisation of Organic Feedstocks
Consideration of the literature shows a wide range of study types, though there are also obviously many gaps. Table 1 contains a group of parameters for each feedstock type, selected specifically for the purposes of the current modelling work. In Tables S1–S4, a wider selection of parameters and indices to facilitate comparison between results is presented: the significance of these is briefly discussed in the Supplementary Materials. Tables S1–S4 focus on the most successful outcomes in which stable operation was apparently achieved: the studies considered cover many other sets of operating conditions, including some where failure occurred as evidenced, e.g., by irreversible VFA accumulation. Many studies also now include analysis of microbial populations, which when combined with operational data contributes to a growing understanding of the links between community structure, functionality and performance. The majority of studies reported are still at laboratory scale, however, and more work is needed on the effects of scale-up and the interaction of system biology and engineering parameters such as mixing and mass transfer behaviour. For industry to be able to adopt this technology with confidence, a better understanding of the mechanisms affecting performance is needed, together with the development of simple and robust control strategies to avoid instability or suboptimal conditions.
While there are issues in attempting to compare data from different studies, Tables S1–S4 provide some useful insights and parameter values. VMP, MER and H2 transfer efficiency are important for techno-economic assessment, although values are likely to vary considerably with operating scale and system configuration. SMP is an indicator of the efficiency of conversion for a particular feedstock, while CH4 and H2 content of the output gas affect potential end uses.
In many studies, though not all, the ratio of H2 transferred to CH4 produced and to CO2 removed settled at close to the stoichiometric value of 4. Values diverging from this can be explained by utilisation of transferred H2 for other purposes such as VFA production or biomass growth. Most studies that calculate ratios of this type also choose to ignore the very small amount of dissolved H2 leaving in the digestate [1,77,82]. Intriguingly, in several cases, the introduction of CO2 biomethanisation is associated with an increase in VBP [21,22,24,27,29,33,43,45,47,57,61,66,68,74], meaning a larger amount of CH4 is being produced and/or there is more CO2 to biomethanise, per unit of organic feed.
It is difficult to assess the significance of this as other factors can also vary: since these studies use real organic feedstocks, there may be minor changes in feedstock properties both day-to-day and between batches in longer studies. HRT are relatively long and not all reported values are from periods where stable steady state operation (often defined as 3 HRT under the same conditions) has been achieved. Accurate determination of H2 concentrations can also be problematic and as noted, there are different ways of dealing with variability in experimental measurements, with some studies normalising gas composition to 100% and others not. In some cases, however, the observed MER is greater than the volumetric CO2 production without CO2 biomethanisation [21,30,33,45,66,68], strongly supporting an increase in VBP. A similar phenomenon of increases in VBP or VMP has been observed in other work on gas recirculation [83], though no clear mechanisms have been confirmed. Many studies are not designed to separate the impacts of gas recirculation and H2 addition: but Khan et al. [33] found that the increase from H2 addition and recirculation was greater than from recirculation only. The simple method adopted in the current work, of calculating the MER and the increase in SMP from the difference between experimental and control or baseline values, conflates these effects as well as other factors; but several authors have suggested that addition of H2 or syngas may have synergistic effects beyond stoichiometric CO2 conversion [25,33], and more research is clearly needed in this area.
3.2. UK Feedstock Data Extraction and Analysis of CO2 Biomethanisation Potential
Several data sources, in addition to those used, were considered as a basis for assessing the potential for CO2 biomethanisation from organic wastes in the UK. This included three UK government sources based on specific incentive schemes and expressed in terms of energy generation capacity: the FIT, RHI and Renewable Transport Fuel Obligation (RTFO). In addition, several other organisations collate data on AD plant operations, including the Anaerobic Digestion and Bioresources Association (ADBA), the Renewable Energy Foundation (REF) and the National Non-Food Crops Centre (NNFCC). The different datasets are collected for different purposes, do not cover all materials and use different reporting formats and assumptions, making comparison and generalisation difficult. Brief details on these sources and their advantages and disadvantages are presented in Section S2 of Supplementary Materials.
3.2.1. Estimation of CO2 Biomethanisation Based on Ofgem RO Data
Although only a proportion of UK AD plants generating electricity are covered by the RO, the RO dataset on feedstock and biogas production is arguably the most detailed freely available. The Ofgem 2019–2020 RO Annual Report [13] aggregates the feedstock consignment data provided by 157 AD plants operating under the RO scheme into 10 broad feedstock categories: Silage; Food, garden and plant waste; Manures and slurries; Distillery waste; DAF sludge/wastewater; Crops; Glycerol; Dairy waste; Municipal waste; and Other. For this part of the study, it was decided to use the aggregated categories and not the original RO-SUS data [15] because it was not clear how the consignment data had been mapped to the categories and because some of the individual RO-SUS consignment data were coded, so the organic source could not be ascertained. The Ofgem feedstock categories also did not map precisely onto those used in the literature survey. The following assumptions were therefore made and confirmed where possible by cross-checking with uncoded RO-SUS data.
Tables S1–S4 demonstrate that, under suitable conditions, biogas methane contents of 90% and above can be achieved for a range of feedstocks commonly used in commercial AD plants. Where possible, expected values for methane content after CO2 biomethanisation of the Ofgem feedstock categories were therefore taken from Table 1; where no values were available (i.e., Distillery waste, Glycerol, Dairy waste and Other, detailed below), a methane content of 90% was assumed.
The majority of biogas in the ‘Silage’ category derives from maize, although RO-SUS data also shows the presence of grass silage, and crop silages such as those from rye and wheat. This category was therefore assumed to map onto ‘Crop and agro-wastes’ in Table 1 and to have the TS and VS content of maize silage in the ADAT database [16].
‘Food, garden and plant waste’ likely included post-consumer food waste (e.g., from households and restaurants), as well as food production and processing wastes such as reject potatoes, fruit and vegetable waste. It could also include garden and plant materials such as ‘Food/garden waste’, bulbs, grass and sugar beet pulp. The majority of named plant materials were high energy (e.g., sweetcorn and beet), however, and consignments mentioning ‘Food/garden waste’ only appeared to make up around 5% of the total for this category. ‘Post-consumer food waste’ values from Table 1 and source separated food waste from ADAT [16] were therefore adopted for this category.
The ‘Manures and slurries’ category was conservatively assumed to have the characteristics of cattle slurry, since no indication was given of the proportion of manure to slurry, or of different slurry types. Data for ‘Livestock manures’ from Table 1 were used, with feedstock characteristics for ‘Cattle Slurry’ from ADAT [16].
‘Distillery waste’ may include feedstocks such as draff, pot ale syrup and malt effluent. Again, a conservative approach was taken and, as aggregates, these were assumed to be low TS wastes. There was no directly applicable category in Table 1, so a default methane content of 90% was used. Feedstock characteristics were not available from ADAT [16], so data from the literature were used [84].
The ‘DAF sludge/wastewater’ category was assumed to equate to the feedstock characterisation for ‘Sewage sludge’ in Table 1 and in ADAT [16].
The definition used by Ofgem [13] for the ‘Crop’ category is unclear, but might include feedstocks such as whole crop and maize meal. For these, the maximum methane content was taken from ‘Crop and agro-wastes’ in Table 1 with TS and VS values based on an average for maize silage and maize corn in the ADAT database [16].
‘Glycerol’ could be clearly identified in the RO-SUS data [15] and was characterised using standard ADAT values [16], with a default maximum methane content of 90%, as Table 1 had no direct equivalent.
The ‘Dairy waste’ category could include RO-SUS data for milk whey, dairy waste, liquid food/dairy waste, AD whey permeate and dairy sludge, and was assigned the characteristics of ‘Whey’ in the ADAT database [16]. With no direct equivalent in Table 1, a default maximum methane content of 90% was assumed.
‘Municipal waste’ was characterised as ‘OFMSW’ as this category appears in both Table 1 and ADAT [16].
The narrative in the Ofgem annual report identified ‘Other’ consignments as including blood, viscera, tallow, fishery waste and plant oils [13] which are all high-strength wastes, and were assumed to have the same properties as the Ofgem ‘Food, garden and plant waste’ category.
The dataset accompanying the Ofgem report [13] lists ‘Quantity [of biogas] burnt (million m3)’. Biogas volumes for individual feedstocks in the dataset are reported in million m3, to a numerical total of 525,191,780. This does not match the report narrative, which notes production of 525 million m3; and is also three orders of magnitude larger than the 364.06 million m3 biogas in the 2018–2019 Annual Report and dataset [85]. The units in the database were therefore corrected from ‘million m3’ to ‘m3’.
To calculate the gross energetic value of the biogas, biogas volume was multiplied by the estimated methane content and the calorific value (lower heating value) of methane, taken as 35.82 MJ m−3 CH4 at STP, and converted to GWh as shown in Table 2. The gross energetic value with CO2 biomethanisation was then calculated by multiplying the original gross energetic value by the ratio of biogas methane contents with and without CO2 biomethanisation for the given feedstock, i.e., assuming no change in biogas volume. Table 2 shows the resulting improvement in gross energetic values through the increased methane production due to the addition of H2. This equates to a 57% uplift in the overall energy value of the biogas. While this assumes CO2 biomethanisation could be applied in every participating AD plant, which is clearly an over-optimistic scenario, it nevertheless represents a very significant potential uplift that warrants further investigation.
In order to estimate the tonnages of fresh feedstock giving rise to the produced biogas, typical values for the SMP, total solids (TS) and volatile solids (as a percentage of TS) for each feedstock were taken from Table 1 and from the ADAT database [16]. Tonnages for each feedstock category were then calculated from these values as shown in Table 2. The assumptions used to derive the feedstock parameters are provided in Table 2, and result in a total estimated tonnage of 6.8 million tonnes of FM, of which 1.3 million tonnes consists of silage and crops. Together, silage (18.1%), food/garden/plant waste (31.5%) and manures/slurries (12.3%) produce 85.6% of the biogas shown in Table 2.
3.2.2. Estimation of CO2 Biomethanisation Uplift Based on Defra’s UK AD Feedstock Data
The 2019–2020 Defra feedstock data for anaerobic digestion [17] are derived from the (paywalled) NNFCC report on Anaerobic Digestion Deployment in the UK [86] which records annual feedstock usage in AD plants operating under a range of AD incentives. It therefore covers a wider range than the Ofgem data [13], which only include plants covered by the Renewables Obligation, in which the biogas produced is burned to generate electricity for on-site use and/or feeding into the national electricity grid. The values exclude feedstock data from the wastewater sector (i.e., sludges from WWTP).
The Defra data [17] are presented as percentages of a total tonnage across five feedstock categories: Crops, Food waste, Manures and slurries, Crop wastes and Others. These were mapped using the same assumptions on feedstock characteristics as in Table 2. Specifically, it was assumed that ‘Crops’ were likely to be silage so this category was treated as maize silage, even though there will be a proportion of other silages and crops. As with the Ofgem data [13], ‘Manures and slurries’ were conservatively characterised as slurry, as the proportions were unknown. TS, VS and methane production values for ‘Crop waste’ were aligned with those for ‘Crops’ in Table 2. Feedstock tonnages shown in bold in Table 3 were taken directly from the Defra report [17].
Table 3 shows the estimated gross energy value with and without CO2 biomethanisation. The results indicate an overall energy uplift of 61% for this set of feedstocks-further indicating that CO2 biomethanisation has the potential to significantly increase the energy value of existing feedstocks, as well as the viability of the digesters that produce the gas.
The overall gross energetic value is significantly larger than that derived from the Ofgem RO data as the Defra data covers more than twice the total tonnage of feedstock (Table 3). Additionally, the derived uplift value of 61% differs slightly from the Ofgem RO value of 57% due to differences in the relative proportion of feedstocks.
To estimate the potential biomethane increase from CO2 biomethanisation, analysis of the available feedstock data in conjunction with data from the scientific literature is a logical approach. It is also possible to apply the overall feedstock-derived energy uplift to generation data when the feedstock underlying it is unknown.
The 2021 DUKES data [18] show energy production from UK AD plants for the year 2020 of 953, 68 and 490 thousand tonnes of oil equivalent (ktoe) for electricity generation, heat generation and grid injection of methane, respectively; no figures are specifically reported for use of biomethane as a vehicle fuel. Applying the DUKES data conversion factor of 11.63 GWh ktoe−1 to this total of 1511 ktoe gives a total gross energy production from anaerobic digestion of 17,572 GWh. This is considerably more than the 11,576 GWh shown in Table 3, reflecting the degree of uncertainty associated even with official data. Timing differences could account for some part of this, e.g., the reporting year for incentives tends to run from 1 April to 31 March whereas DUKES [18] reports by calendar year. Further differences could be due to the conservative feedstock assumptions made above; to DUKES load factor (LF) assumptions when deriving gross energy values from net electricity/heat generation; and/or to variations in data sources and rounding errors. Differences on this scale, however, strongly support the need for more unified and consistent data collection.
3.2.3. Potential for CO2 Biomethanisation Using Generation Derived from Wastewater Treatment
Neither the Ofgem/RO [13] nor the Defra [17] feedstock data shown above include the energy contribution from the AD of sludges from municipal wastewater treatment.
This approach could be used to ascertain improved energy production from DUKES data on sewage gas [18] which show electricity, heat and gas grid injection energy figures of 350, 90 and 54 ktoe, respectively, equating to a total of 5744 GWh. If the maximum methane content from Table 1 is applied, equating to a 38% uplift in gross energy output, generation of 7953 GWh could potentially be achieved if CO2 biomethanisation were introduced across the wastewater sector.
In the UK, 93% of sewage sludge is treated by AD or advanced AD [87] at approximately 170 AD plants [88]. Unlike commercial and industrial plants where feedstocks are often mixed, and thus, characteristics can be variable, sewage sludge is a relatively consistent material. Additionally, the water industry has ambitious decarbonisation plans [89], as its energy use is considerable (e.g., in 2009 this sector accounted for up to 3% of total energy use in the UK [90]). A relatively small number of AD plants treating a large quantity of a minimally variable feedstock in a sector that has high energy use, relevant technical expertise and ambitious decarbonisation plans makes it relatively feasible to introduce this technology and achieve a significant proportion of the theoretical uplift.
3.3. Advantages of CO2 Biomethanisation at Scale
Despite some variability between sources, the existing feedstock and energy data, supported by the scientific literature, indicate that CO2 biomethanisation has significant potential to increase the energy contribution of AD to the UK’s energy mix, while also increasing the efficiency of utilisation of carbon from organic feedstocks. Applying biomethanisation technology to current DUKES [18] figures of 23,316 GWh (sewage gas and AD) could produce 36,270 GWh, an uplift of 55%. AD and sewage gas currently account for 15% of the UK’s bioenergy contribution and this could increase to ~22%. This potential uplift of 12,954 GWh is equivalent to the annual energy use of 858,000 households [91], e.g., the domestic properties in a city the size of Leeds.
To effect a similar increase in current gas grid injection alone would require the growth of another 251,000 ha of maize (~4.4% of UK arable land), more than double the 121,000 ha used for all UK bioenergy and more than three times the 75,000 ha used for AD maize in 2020 [92]. Maximizing the carbon utilisation efficiency from existing feedstocks thus makes sense in terms of land use and the food/energy/climate nexus.
Although not explicitly included in the 2021 DUKES [18] figures, the role of biomethane for transport also is growing, particularly in the heavy goods vehicle (HGV) sector where it is currently the only commercial decarbonisation option, until suitable fuel current battery and hydrogen technologies can be developed. Transport is difficult to decarbonise: as energy systems have become less carbon-intensive, transport became the UK’s largest emitting sector of GHG emissions in 2016 [93]. If the uplift were used for transport, it could replace nearly 1.1 million litres of diesel, with a fossil CO2 equivalent of 3.4 million tonnes [94].
This approach could eliminate the energy and capital expenditure required to retrofit CO2 carbon capture and storage (CCS), allowing more effective utilisation of short-cycle carbon rather than, for example, pumping it into permanent underground storage. This would have the added advantage of displacing its equivalent in fossil gas and associated imports: the Sixth Carbon Budget accounts for abatement from the additional use of biomethane to displace fossil gas [9] and CO2 biomethanisation could offer an effective way to achieve this.
The longer-term value of incorporating CO2 biomethanisation into AD systems is further strengthened by the CCC’s projected growth in the hydrogen economy, in particular, green hydrogen from water electrolysis powered by renewables, since equipment and installation costs tend to fall as deployment increases. As noted earlier, achieving the benefits of CO2 biomethanisation requires the use of renewables-based H2, and this may be seen as a barrier in the short term since competition for H2 from grid-based resources is likely to intensify [95]. AD is used at a wide range of scales, however, from on-site slurry treatment at a single dairy farm to processing the municipal wastes of a city. It is therefore flexible in its needs and could be coupled with electrolytic H2 production across a similar range. In their simplest form, small-scale AD applications can provide an opportunity for hybridisation of on-site renewable power with waste processing, to provide short carbon-cycle biomethane for local or on-site use in locations where export of electricity to grid is technically challenging or economically unattractive. Larger AD installations could be used, with relatively low capital expenditure [2,5,10], to transform excess intermittent power production from large-scale renewable facilities into biomethane for gas grid injection, hence providing buffer storage and allowing a more rapid expansion in the renewables sector. By taking electricity from multiple sources and across different time spans, the technology could thus make a major contribution in supporting the energy transition from carbon-based to non-carbon-based gaseous fuels [7,20].
Given the potential contribution of CO2 biomethanisation, it is surprising that it does not appear to be mentioned in policy documents and remains under the policy radar, even where other technologies-some with technology readiness levels that are similar or lower-are actively discussed. For example, the BEIS November 2021 Biomass Policy Statement [96] which ‘provides a strategic view on the role of biomass across the economy in the medium- to long-term’ mentions the ‘clear opportunity’ for ‘material processing of biomass into high value products’; but does not consider CO2 biomethanisation as either an interim or long-term strategy. Indeed, although it identifies AD as ‘the only commercially scalable technology currently available for greening the gas grid’, the sole approach for AD’s biogenic carbon is Bioenergy Carbon Capture and Storage (BECCs), which will require the development of an effective market for greenhouse gas removals. The UK market for biomethane-to-grid is already well-developed and growing, so maximizing the carbon utilisation in such plants instead of permanently storing it underground could potentially be a better option in the decarbonisation pathway. This, of course, would need to happen alongside the increase in hydrogen production outlined by the CCC.
4. Conclusions
Biomethane has an important role to play in the UK’s energy decarbonisation plans, due to its flexible use in transport, heat and electricity production. A considerable amount of work has been conducted at laboratory scale on CO2 biomethanisation of organic wastes. The results show clearly that significant improvements can be achieved in methane yield per unit of organic feed and in biogas methane content. Interestingly, the overall survey also appears to indicate that underlying biogas productivity can be increased in some systems. Many scientific and technical questions remain to be addressed, particularly those associated with the effects of scale-up and of differences in operating practice, which need to be resolved if industry is to adopt this technology with confidence. While approaches such as ex-situ CO2 biomethanisation may be more suitable in some applications, however, it appears there is clear potential for in situ or hybrid conversion of CO2 generated by anaerobic digestion of organic materials.
Data on existing UK AD feedstocks are highly fragmented, and it is not always clear how values in different sources have been arrived at or how they relate to one another. In the absence of coherent information, it is difficult for government bodies to reach conclusions on overall policy, especially when individual sectors and technologies are lobbying for their own interests. The availability of better and more consistent data sources as a basis for evaluation and policy making is thus a clear priority. Based on the available UK data, however, significant increases in biomethane productivity could potentially be achieved, ranging from 38–68% for different feedstock types and equivalent to an overall uplift in the contribution of AD to UK bioenergy from 15 to 22%. Again, there are many issues to consider: the current survey only looked at data on the highest level, and for realistic assessments of the potential scale and impact of technology application it will be necessary to take into account both the end-uses of biomethane and techno-economic viability on individual sites. The potential contribution from CO2 biomethanisation of organic wastes is large enough, however, to warrant consideration in both short and long-term planning. There is thus a clear need for more work looking at both the research issues and the policy needs to optimise the contribution of this approach and integrate it with national energy and sustainability strategies.
Supplementary Materials
The following supporting information can be downloaded at: https://0-www-mdpi-com.brum.beds.ac.uk/article/10.3390/pr10061202/s1. Text S1: Assessment of performance data for CO2 biomethanisation of organic feedstocks (including nomenclature); Table S1: Performance data for CO2 biomethanisation of livestock manures; Table S2: Performance data for CO2 biomethanisation of crops and agro-wastes; Table S3: Performance data for CO2 biomethanisation of food wastes; Table S4: Performance data for CO2 biomethanisation of sewage sludges; Text S2: Sources of Anaerobic digestion and Feedstock data.
Author Contributions
Conceptualization, A.B. and S.H.; methodology, A.B. and S.H.; validation, A.B., S.H., Y.Z. and C.J.B.; formal analysis, A.B., S.H. and Y.Z.; investigation, A.B., S.H. and Y.Z.; data curation, A.B. and S.H.; writing—original draft preparation, A.B.; writing—review and editing, A.B., S.H., C.J.B. and Y.Z.; funding acquisition: C.J.B., S.H. and Y.Z. All authors have read and agreed to the published version of the manuscript.
Funding
This research was supported by the IBCat H2AD project (EP/M028208/1) funded by the Engineering and Physical Sciences Research Council (EPSRC), by a grant from the Carbon Recycling Network (POC-02-ZHANG-CCnet) funded by the Biotechnology and Biological Sciences Research Council (BBSRC), and by in-kind support from the Environmental Biotechnology Network (BB/S009795/1) funded by BBSRC and EPSRC.
Institutional Review Board Statement
Not applicable.
Informed Consent Statement
Not applicable.
Data Availability Statement
Data supporting this study are openly available from the University of Southampton repository at http://0-doi-org.brum.beds.ac.uk/10.5258/SOTON/D2241 (accessed on 30 May 2022).
Acknowledgments
The authors wish to acknowledge the help of Alam Khan of the Sustainable Bioenergy and Biorefinery Laboratory, Department of Microbiology, Quaid-i-Azam University, Pakistan for provision of additional information on his work, and Bing Tao, formerly of the University of Southampton, for additional data. Thanks are also due to the AD Working Group of the Environmental Biotechnology Network (BB/S009795/1) for comments on the text.
Conflicts of Interest
The authors declare no conflict of interest. The funders had no role in the design of the study; in the collection, analyses, or interpretation of data; in the writing of the manuscript, or in the decision to publish the results.
References
- Luo, G.; Angelidaki, I. Integrated biogas upgrading and hydrogen utilization in an anaerobic reactor containing enriched hydrogenotrophic methanogenic culture. Biotechnol. Bioeng. 2012, 109, 2729–2736. [Google Scholar] [CrossRef] [PubMed]
- Fu, S.; Angelidaki, I.; Zhang, Y. In situ biogas upgrading by CO2-to-CH4 bioconversion. Trends Biotechnol. 2020, 39, 336–347. [Google Scholar] [CrossRef] [PubMed]
- Rafrafi, Y.; Laguillaumie, L.; Dumas, C. Biological Methanation of H2 and CO2 with Mixed Cultures: Current Advances, Hurdles and Challenges. Waste Biomass Valorization 2020, 12, 5259–5282. [Google Scholar] [CrossRef]
- Angelidaki, I.; Treu, L.; Tsapekos, P.; Luo, G.; Campanaro, S.; Wenzel, H.; Kougias, P.G. Biogas upgrading and utilization: Current status and perspectives. Biotechnol. Adv. 2018, 36, 452–466. [Google Scholar] [CrossRef] [PubMed] [Green Version]
- Aryal, N.; Kvist, T.; Ammam, F.; Pant, D.; Ottosen, L.D. An overview of microbial biogas enrichment. Bioresour. Technol. 2018, 264, 359–369. [Google Scholar] [CrossRef]
- Lecker, B.; Illi, L.; Lemmer, A.; Oechsner, H. Biological hydrogen methanation—A review. Bioresour. Technol. 2017, 245, 1220–1228. [Google Scholar] [CrossRef]
- Zavarkó, M.; Imre, A.R.; Pörzse, G.; Csedő, Z. Past, Present and Near Future: An Overview of Closed, Running and Planned Biomethanation Facilities in Europe. Energies 2021, 14, 5591. [Google Scholar] [CrossRef]
- Sarker, S.; Lamb, J.J.; Hjelme, D.R.; Lien, K.M. Overview of recent progress towards in-situ biogas upgradation techniques. Fuel 2018, 226, 686–697. [Google Scholar] [CrossRef]
- CCC. The Sixth Carbon Budget; Committee on Climate Change: London, UK, 2020. [Google Scholar]
- D’Silva, T.C.; Isha, A.; Chandra, R.; Vijay, V.K.; Subbarao, P.M.V.; Kumar, R.; Chaudhary, V.P.; Singh, H.; Khan, A.A.; Tyagi, V.K. Enhancing methane production in anaerobic digestion through hydrogen assisted pathways–A state-of-the-art review. Renew. Sustain. Energy Rev. 2021, 151, 111536. [Google Scholar] [CrossRef]
- Zhao, J.; Li, Y.; Dong, R. Recent progress towards in-situ biogas upgrading technologies. Sci. Total Environ. 2021, 800, 149667. [Google Scholar] [CrossRef]
- Tao, B.; Zhang, Y.; Heaven, S.; Banks, C.J. Predicting pH rise as a control measure for integration of CO2 biomethanisation with anaerobic digestion. Appl. Energy 2020, 277, 115535. [Google Scholar] [CrossRef]
- Ofgem. Renewables Obligation (RO) Annual Report 2019-20; Office of Gas and Electricity Markets: London, UK, 2021.
- BEIS. Sustainability Standards for Electricity Generation from Biomass; Department for Business, Energy & Industrial Strategy: London, UK, 2013; Volume 2022.
- Ofgem. Biomass Sustainability; Office of Gas and Electricity Markets: London, UK, 2021.
- ADAT. Anaerobic Digestion Assessment Tool: User Manual; University of Southampton: Southampton, UK, 2017. [Google Scholar]
- Defra. Official Statistics Section 3: Anaerobic Digestion; Department for Environment Food & Rural Affairs: London, UK, 2021.
- BEIS. Digest of UK Energy Statistics (DUKES); Department for Business, Energy & Industrial Strategy: London, UK, 2021.
- Khan, M.U.; Lee, J.T.E.; Bashir, M.A.; Dissanayake, P.D.; Ok, Y.S.; Tong, Y.W.; Shariati, M.A.; Wu, S.; Ahring, B.K. Current status of biogas upgrading for direct biomethane use: A review. Renew. Sustain. Energy Rev. 2021, 149, 111343. [Google Scholar] [CrossRef]
- Thema, M.; Weidlich, T.; Hörl, M.; Bellack, A.; Mörs, F.; Hackl, F.; Kohlmayer, M.; Gleich, J.; Stabenau, C.; Trabold, T. Biological CO2-methanation: An approach to standardization. Energies 2019, 12, 1670. [Google Scholar] [CrossRef] [Green Version]
- Bassani, I.; Kougias, P.G.; Treu, L.; Angelidaki, I. Biogas upgrading via hydrogenotrophic methanogenesis in two-stage continuous stirred tank reactors at mesophilic and thermophilic conditions. Environ. Sci. Technol. 2015, 49, 12585–12593. [Google Scholar] [CrossRef]
- Treu, L.; Kougias, P.; de Diego-Díaz, B.; Campanaro, S.; Bassani, I.; Fernández-Rodríguez, J.; Angelidaki, I. Two-year microbial adaptation during hydrogen-mediated biogas upgrading process in a serial reactor configuration. Bioresour. Technol. 2018, 264, 140–147. [Google Scholar] [CrossRef]
- Wahid, R.; Horn, S.J. The effect of mixing rate and gas recirculation on biological CO2 methanation in two-stage CSTR systems. Biomass Bioenergy 2021, 144, 105918. [Google Scholar] [CrossRef]
- Lebranchu, A.; Blanchard, F.; Fick, M.; Pacaud, S.; Olmos, E.; Delaunay, S. Pilot-scale biomethanation of cattle manure using dense membranes. Bioresour. Technol. 2019, 284, 430–436. [Google Scholar] [CrossRef]
- Zhu, X.; Cao, Q.; Chen, Y.; Sun, X.; Liu, X.; Li, D. Effects of mixing and sodium formate on thermophilic in-situ biogas upgrading by H2 addition. J. Clean. Prod. 2019, 216, 373–381. [Google Scholar] [CrossRef]
- Zhu, X.; Chen, L.; Chen, Y.; Cao, Q.; Liu, X.; Li, D. Differences of methanogenesis between mesophilic and thermophilic in situ biogas-upgrading systems by hydrogen addition. J. Ind. Microbiol. Biotechnol. 2019, 46, 1569–1581. [Google Scholar] [CrossRef]
- Zhu, X.; Chen, L.; Chen, Y.; Cao, Q.; Liu, X.; Li, D. Effect of H2 addition on the microbial community structure of a mesophilic anaerobic digestion system. Energy 2020, 198, 117368. [Google Scholar] [CrossRef]
- Jiang, H.; Wu, F.; Wang, Y.; Feng, L.; Zhou, H.; Li, Y. Characteristics of in-situ hydrogen biomethanation at mesophilic and thermophilic temperatures. Bioresour. Technol. 2021, 337, 125455. [Google Scholar] [CrossRef] [PubMed]
- Luo, G.; Angelidaki, I. Co-digestion of manure and whey for in situ biogas upgrading by the addition of H2: Process performance and microbial insights. Appl. Microbiol. Biotechnol. 2013, 97, 1373–1381. [Google Scholar] [CrossRef] [PubMed]
- Luo, G.; Angelidaki, I. Hollow fiber membrane based H2 diffusion for efficient in situ biogas upgrading in an anaerobic reactor. Appl. Microbiol. Biotechnol. 2013, 97, 3739–3744. [Google Scholar] [CrossRef] [PubMed]
- Wahid, R.; Horn, S.J. Impact of operational conditions on methane yield and microbial community composition during biological methanation in in situ and hybrid reactor systems. Biotechnol. Biofuels 2021, 14, 170. [Google Scholar] [CrossRef] [PubMed]
- Corbellini, V.; Kougias, P.G.; Treu, L.; Bassani, I.; Malpei, F.; Angelidaki, I. Hybrid biogas upgrading in a two-stage thermophilic reactor. Energy Convers. Manag. 2018, 168, 1–10. [Google Scholar] [CrossRef]
- Khan, A.; Akbar, S.; Okonkwo, V.; Smith, C.; Khan, S.; Shah, A.A.; Adnan, F.; Ijaz, U.Z.; Ahmed, S.; Badshah, M. Enrichment of the hydrogenotrophic methanogens for, in-situ biogas up-gradation by recirculation of gases and supply of hydrogen in methanogenic reactor. Bioresour. Technol. 2022, 345, 126219. [Google Scholar] [CrossRef]
- Wang, H.; Zhang, Y.; Angelidaki, I. Ammonia inhibition on hydrogen enriched anaerobic digestion of manure under mesophilic and thermophilic conditions. Water Res. 2016, 105, 314–319. [Google Scholar] [CrossRef] [Green Version]
- Wang, H.; Zhu, X.; Yan, Q.; Zhang, Y.; Angelidaki, I. Microbial community response to ammonia levels in hydrogen assisted biogas production and upgrading process. Bioresour. Technol. 2020, 296, 122276. [Google Scholar] [CrossRef]
- Garcia-Robledo, E.; Ottosen, L.D.; Voigt, N.V.; Kofoed, M.; Revsbech, N.P. Micro-scale H2–CO2 dynamics in a hydrogenotrophic methanogenic membrane reactor. Front. Microbiol. 2016, 7, 1276. [Google Scholar] [CrossRef] [Green Version]
- Vechi, N.T.; Agneessens, L.M.; Feilberg, A.; Ottosen, L.D.M.; Kofoed, M.V.W. In situ biomethanation: Inoculum origin influences acetate consumption rate during hydrogen addition. Bioresour. Technol. Rep. 2021, 14, 100656. [Google Scholar] [CrossRef]
- Lukehurst, C.; Bywater, A. Exploring the Viability of Small Scale Anaerobic Digesters in Livestock Farming; IEA Bioenergy: Paris, France, 2015. [Google Scholar]
- Jensen, M.B.; Jensen, B.; Ottosen, L.D.M.; Kofoed, M.V.W. Integrating H2 injection and reactor mixing for low-cost H2 gas-liquid mass transfer in full-scale in situ biomethanation. Biochem. Eng. J. 2021, 166, 107869. [Google Scholar] [CrossRef]
- Jensen, M.B.; Kofoed, M.V.W.; Fischer, K.; Voigt, N.V.; Agneessens, L.M.; Batstone, D.J.; Ottosen, L.D.M. Venturi-type injection system as a potential H2 mass transfer technology for full-scale in situ biomethanation. Appl. Energy 2018, 222, 840–846. [Google Scholar] [CrossRef]
- Nock, W.J.; Serna-Maza, A.; Heaven, S.; Banks, C.J. Evaluation of microporous hollow fibre membranes for mass transfer of H2 into anaerobic digesters for biomethanization. J. Chem. Technol. Biotechnol. 2019, 94, 2693–2701. [Google Scholar] [CrossRef] [Green Version]
- Voelklein, M.; Rusmanis, D.; Murphy, J. Biological methanation: Strategies for in-situ and ex-situ upgrading in anaerobic digestion. Appl. Energy 2019, 235, 1061–1071. [Google Scholar] [CrossRef]
- Illi, L.; Lecker, B.; Lemmer, A.; Müller, J.; Oechsner, H. Biological methanation of injected hydrogen in a two-stage anaerobic digestion process. Bioresour. Technol. 2021, 333, 125126. [Google Scholar] [CrossRef]
- Schönberg, V.; Busch, G. Steigerung des Methangehaltes durch biologische Wasserstoffumsetzung. Bornim Agrar. Ber 2012, 79, 66–75. [Google Scholar]
- Agneessens, L.M.; Ottosen, L.D.M.; Voigt, N.V.; Nielsen, J.L.; de Jonge, N.; Fischer, C.H.; Kofoed, M.V.W. In-situ biogas upgrading with pulse H2 additions: The relevance of methanogen adaption and inorganic carbon level. Bioresour. Technol. 2017, 233, 256–263. [Google Scholar] [CrossRef]
- Frydendal-Nielsen, S.; Jørgensen, U.; Hjorth, M.; Felby, C.; Gislum, R. Comparing methods for measuring the digestibility of miscanthus in bioethanol or biogas processing. GCB Bioenergy 2017, 9, 168–175. [Google Scholar] [CrossRef] [Green Version]
- Agneessens, L.M.; Ottosen, L.D.M.; Andersen, M.; Olesen, C.B.; Feilberg, A.; Kofoed, M.V.W. Parameters affecting acetate concentrations during in-situ biological hydrogen methanation. Bioresour. Technol. 2018, 258, 33–40. [Google Scholar] [CrossRef]
- Mulat, D.G.; Mosbæk, F.; Ward, A.J.; Polag, D.; Greule, M.; Keppler, F.; Nielsen, J.L.; Feilberg, A. Exogenous addition of H2 for an in situ biogas upgrading through biological reduction of carbon dioxide into methane. Waste Manag. 2017, 68, 146–156. [Google Scholar] [CrossRef]
- Szuhaj, M.; Ács, N.; Tengölics, R.; Bodor, A.; Rákhely, G.; Kovács, K.L.; Bagi, Z. Conversion of H2 and CO2 to CH4 and acetate in fed-batch biogas reactors by mixed biogas community: A novel route for the power-to-gas concept. Biotechnol. Biofuels 2016, 9, 102. [Google Scholar] [CrossRef] [PubMed] [Green Version]
- Sarker, S.; Wijnsma, S.N.; Lien, K.M. Lessons Learned from an Experimental Campaign on Promoting Energy Content of Renewable Biogas by Injecting H2 during Anaerobic Digestion. Energies 2020, 13, 3542. [Google Scholar] [CrossRef]
- Song, H.; Zhang, Y.; Kusch-Brandt, S.; Banks, C.J. Comparison of variable and constant loading for mesophilic food waste digestion in a long-term experiment. Energies 2020, 13, 1279. [Google Scholar] [CrossRef] [Green Version]
- Zhang, W.; Alessi, A.M.; Heaven, S.; Chong, J.P.; Banks, C.J. Dynamic changes in anaerobic digester metabolic pathways and microbial populations during acclimatisation to increasing ammonium concentrations. Waste Manag. 2021, 135, 409–419. [Google Scholar] [CrossRef]
- Zhang, Y. Unpublished Work on CO2 Biomethanisation of Organic Feedstocks; Univerity of Southampton: Southampton, UK, 2022. [Google Scholar]
- Kim, S.; Mostafa, A.; Im, S.; Lee, M.-K.; Kang, S.; Na, J.-G.; Kim, D.-H. Production of high-calorific biogas from food waste by integrating two approaches: Autogenerative high-pressure and hydrogen injection. Water Res. 2021, 194, 116920. [Google Scholar] [CrossRef]
- Yang, Z.; Liu, Y.; Zhang, J.; Mao, K.; Kurbonova, M.; Liu, G.; Zhang, R.; Wang, W. Improvement of biofuel recovery from food waste by integration of anaerobic digestion, digestate pyrolysis and syngas biomethanation under mesophilic and thermophilic conditions. J. Clean. Prod. 2020, 256, 120594. [Google Scholar] [CrossRef]
- Zhang, W.; Heaven, S.; Banks, C.J. Thermophilic digestion of food waste by dilution: Ammonia limit values and energy considerations. Energy Fuels 2017, 31, 10890–10900. [Google Scholar] [CrossRef]
- Thapa, A.; Park, J.-G.; Yang, H.-M.; Jun, H.-B. In-situ biogas upgrading in an anaerobic trickling filter bed reactor treating a thermal post-treated digestate. J. Environ. Chem. Eng. 2021, 9, 106780. [Google Scholar] [CrossRef]
- Okoro-Shekwaga, C.K.; Ross, A.B.; Camargo-Valero, M.A. Improving the biomethane yield from food waste by boosting hydrogenotrophic methanogenesis. Appl. Energy 2019, 254, 113629. [Google Scholar] [CrossRef]
- Okoro-Shekwaga, C.K.; Ross, A.B.; Camargo-Valero, M.A. Enhanced in-situ biomethanation of food waste by sequential inoculum acclimation: Energy efficiency and carbon savings analysis. Waste Manag. 2021, 130, 12–22. [Google Scholar] [CrossRef]
- Okoro-Shekwaga, C.K.; Ross, A.; Camargo-Valero, M.A. Enhancing bioenergy production from food waste by in situ biomethanation: Effect of the hydrogen injection point. Food Energy Secur. 2021, 10, e288. [Google Scholar] [CrossRef]
- Treu, L.; Tsapekos, P.; Peprah, M.; Campanaro, S.; Giacomini, A.; Corich, V.; Kougias, P.G.; Angelidaki, I. Microbial profiling during anaerobic digestion of cheese whey in reactors operated at different conditions. Bioresour. Technol. 2019, 275, 375–385. [Google Scholar] [CrossRef] [PubMed]
- Fontana, A.; Kougias, P.G.; Treu, L.; Kovalovszki, A.; Valle, G.; Cappa, F.; Morelli, L.; Angelidaki, I.; Campanaro, S. Microbial activity response to hydrogen injection in thermophilic anaerobic digesters revealed by genome-centric metatranscriptomics. Microbiome 2018, 6, 194. [Google Scholar] [CrossRef] [PubMed]
- Lovato, G.; Alvarado-Morales, M.; Kovalovszki, A.; Peprah, M.; Kougias, P.G.; Rodrigues, J.A.D.; Angelidaki, I. In-situ biogas upgrading process: Modeling and simulations aspects. Bioresour. Technol. 2017, 245, 332–341. [Google Scholar] [CrossRef] [Green Version]
- Palù, M.; Peprah, M.; Tsapekos, P.; Kougias, P.; Campanaro, S.; Angelidaki, I.; Treu, L. In-situ biogas upgrading assisted by bioaugmentation with hydrogenotrophic methanogens during mesophilic and thermophilic co-digestion. Bioresour. Technol. 2022, 348, 126754. [Google Scholar] [CrossRef]
- Bassani, I.; Kougias, P.G.; Angelidaki, I. In-situ biogas upgrading in thermophilic granular UASB reactor: Key factors affecting the hydrogen mass transfer rate. Bioresour. Technol. 2016, 221, 485–491. [Google Scholar] [CrossRef] [Green Version]
- Deschamps, L.; Imatoukene, N.; Lemaire, J.; Mounkaila, M.; Filali, R.; Lopez, M.; Theoleyre, M.-A. In-situ biogas upgrading by bio-methanation with an innovative membrane bioreactor combining sludge filtration and H2 injection. Bioresour. Technol. 2021, 337, 125444. [Google Scholar] [CrossRef]
- Tao, B.; Alessi, A.M.; Zhang, Y.; Chong, J.P.; Heaven, S.; Banks, C.J. Simultaneous biomethanisation of endogenous and imported CO2 in organically loaded anaerobic digesters. Appl. Energy 2019, 247, 670–681. [Google Scholar] [CrossRef]
- Wahid, R.; Mulat, D.G.; Gaby, J.C.; Horn, S.J. Effects of H2: CO2 ratio and H2 supply fluctuation on methane content and microbial community composition during in-situ biological biogas upgrading. Biotechnol. Biofuels 2019, 12, 104. [Google Scholar] [CrossRef] [Green Version]
- Xu, H.; Wang, K.; Zhang, X.; Gong, H.; Xia, Y.; Holmes, D.E. Application of in-situ H2-assisted biogas upgrading in high-rate anaerobic wastewater treatment. Bioresour. Technol. 2020, 299, 122598. [Google Scholar] [CrossRef]
- Jing, Y.; Campanaro, S.; Kougias, P.; Treu, L.; Angelidaki, I.; Zhang, S.; Luo, G. Anaerobic granular sludge for simultaneous biomethanation of synthetic wastewater and CO with focus on the identification of CO-converting microorganisms. Water Res. 2017, 126, 19–28. [Google Scholar] [CrossRef] [PubMed]
- Banks, C.; Heaven, S.; Zhang, Y.; Baier, U. Food Waste Digestion: Anaerobic Digestion of Food Waste for a Circular Economy; IEA Bioenergy: Paris, France, 2018. [Google Scholar]
- Chen, A.C.; Ohashi, A.; Harada, H. Acetate synthesis from H2/CO2 in simulated and actual landfill samples. Environ. Technol. 2003, 24, 435–443. [Google Scholar] [CrossRef] [PubMed]
- Sekoai, P.T.; Engelbrecht, N.; du Preez, S.P.; Bessarabov, D. Thermophilic Biogas Upgrading via ex Situ Addition of H2 and CO2 Using Codigested Feedstocks of Cow Manure and the Organic Fraction of Solid Municipal Waste. ACS Omega 2020, 5, 17367–17376. [Google Scholar] [CrossRef] [PubMed]
- Alfaro, N.; Fdz-Polanco, M.; Fdz-Polanco, F.; Díaz, I. H2 addition through a submerged membrane for in-situ biogas upgrading in the anaerobic digestion of sewage sludge. Bioresour. Technol. 2019, 280, 1–8. [Google Scholar] [CrossRef] [PubMed]
- Corbellini, V.; Catenacci, A.; Malpei, F. Hydrogenotrophic biogas upgrading integrated into WWTPs: Enrichment strategy. Water Sci. Technol. 2019, 79, 759–770. [Google Scholar] [CrossRef] [PubMed]
- Corbellini, V.; Feng, C.; Bellucci, M.; Catenacci, A.; Stella, T.; Espinoza-Tofalos, A.; Malpei, F. Performance Analysis and Microbial Community Evolution of In Situ Biological Biogas Upgrading with Increasing H2/CO2 Ratio. Archaea 2021, 8894455. [Google Scholar] [CrossRef]
- Díaz, I.; Fdz-Polanco, F.; Mutsvene, B.; Fdz-Polanco, M. Effect of operating pressure on direct biomethane production from carbon dioxide and exogenous hydrogen in the anaerobic digestion of sewage sludge. Appl. Energy 2020, 280, 115915. [Google Scholar] [CrossRef]
- Luo, G.; Wang, W.; Angelidaki, I. Anaerobic digestion for simultaneous sewage sludge treatment and CO biomethanation: Process performance and microbial ecology. Environ. Sci. Technol. 2013, 47, 10685–10693. [Google Scholar] [CrossRef]
- Wang, W.; Xie, L.; Luo, G.; Zhou, Q.; Angelidaki, I. Performance and microbial community analysis of the anaerobic reactor with coke oven gas biomethanation and in situ biogas upgrading. Bioresour. Technol. 2013, 146, 234–239. [Google Scholar] [CrossRef] [Green Version]
- Hu, Y.; Hao, X.; Zhao, D.; Fu, K. Enhancing the CH4 yield of anaerobic digestion via endogenous CO2 fixation by exogenous H2. Chemosphere 2015, 140, 34–39. [Google Scholar] [CrossRef]
- Braga Nan, L.; Trably, E.; Santa-Catalina, G.; Bernet, N.; Delgenès, J.-P.; Escudié, R. Biomethanation processes: New insights on the effect of a high H2 partial pressure on microbial communities. Biotechnol. Biofuels 2020, 13, 141. [Google Scholar] [CrossRef] [PubMed]
- Alfaro, N.; Fdz-Polanco, M.; Fdz-Polanco, F.; Díaz, I. Evaluation of process performance, energy consumption and microbiota characterization in a ceramic membrane bioreactor for ex-situ biomethanation of H2 and CO2. Bioresour. Technol. 2018, 258, 142–150. [Google Scholar] [CrossRef] [PubMed]
- Fernández, Y.B.; Soares, A.; Villa, R.; Vale, P.; Cartmell, E. Carbon capture and biogas enhancement by carbon dioxide enrichment of anaerobic digesters treating sewage sludge or food waste. Bioresour. Technol. 2014, 159, 1–7. [Google Scholar] [CrossRef] [Green Version]
- Mikucka, W.; Zielińska, M. Distillery stillage: Characteristics, treatment, and valorization. Appl. Biochem. Biotechnol. 2020, 192, 770–793. [Google Scholar] [CrossRef] [PubMed]
- Ofgem. Renewables Obligation (RO) Annual Report 2018–19; Office of Gas and Electricity Markets: London, UK, 2020.
- NNFCC. Anaerobic Digestion Deployment in the UK; National Non-Food Crops Centre: York, UK, 2021. [Google Scholar]
- Ofwat. Bioresources Market Review: Jacobs Report; Office of Water Services: Birmingham, UK, 2021.
- ADBA. ADBA Policy Report October 2021; Anaerobic Digestion and Bioresources Association: London, UK, 2021. [Google Scholar]
- UKWIR. BQ10: How Do We Remove More Carbon than We Emit by 2050? UK Water Industry Research: London, UK, 2022. [Google Scholar]
- EA. Renewable Energy Potential for the Water Industry; Environment Agency-Evidence Directorate: Bristol, UK, 2009.
- Ofgem. Decision on Revised Typical Domestic Consumption Values for Gas and Electricity and Economy 7 Consumption Split; Office of Gas and Electricity Markets: London, UK, 2020.
- Defra. Key Messages for 2021; Department for Environment & Rural Affairs: London, UK, 2021.
- DfT. Transport and Environment Statistics: Autumn 2021; Department for Transport: London, UK, 2021.
- BEIS. Greenhouse Gas Reporting: Conversion Factors 2018; Department for Business, Energy & Industrial Strategy: London, UK, 2018.
- Zhang, L.; Kuroki, A.; Tong, Y.W. A mini-review on in situ biogas upgrading technologies via enhanced hydrogenotrophic methanogenesis to improve the quality of biogas from anaerobic digesters. Front. Energy Res. 2020, 8, 69. [Google Scholar] [CrossRef]
- BEIS. Biomass Policy Statement; Department for Business, Energy & Industrial Strategy: London, UK, 2021.

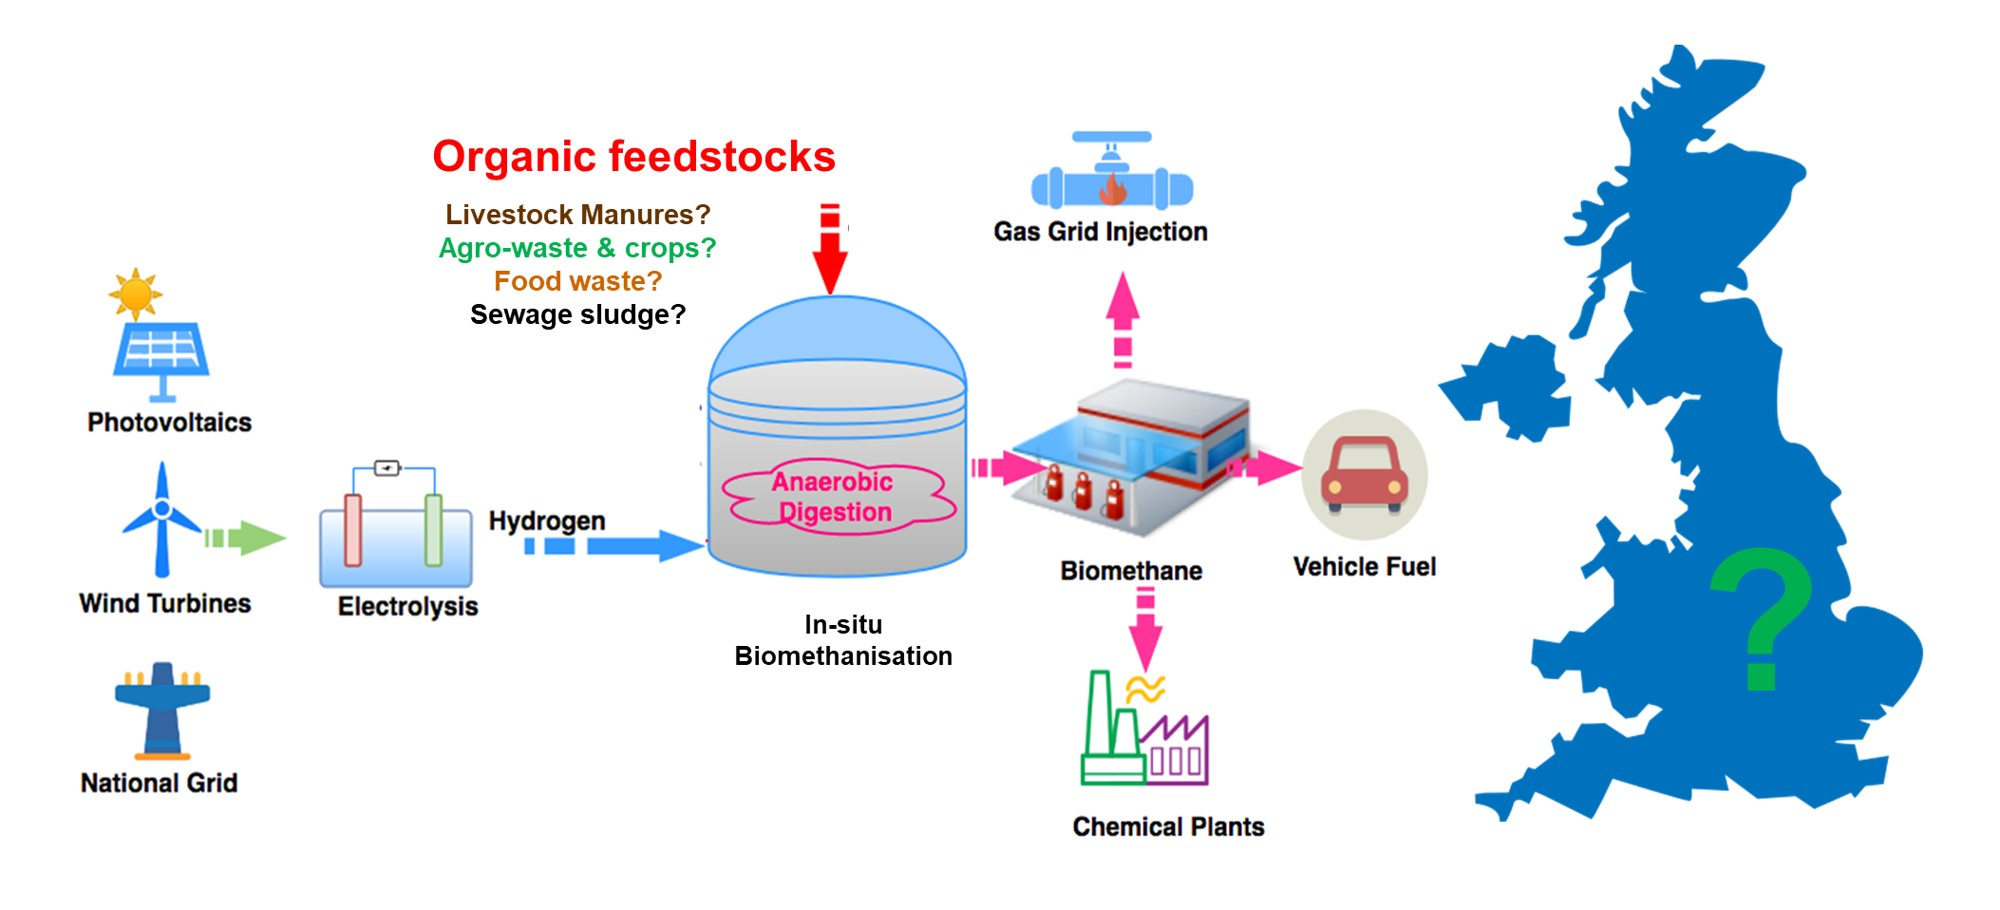
Table 1.
Estimated maximum biogas methane content and SMP for use in modelling.
| Without CO2 Biometh | With CO2 Biometh | ||||||
|---|---|---|---|---|---|---|---|
| Substrate Type | SMP a | CH4 a | pH | ab | Assumed Max pH a | Predicted Max CH4 | Predicted Max SMP |
| L CH4 g−1 VS | % | % | L CH4 g−1 VS | ||||
| Livestock manures | 0.190 | 60 | 7.5 | 7.60 × 10⁻⁸ | 8.2 | 93 | 0.295 |
| Crop & agro-wastes | 0.350 | 55 | 7.5 | 6.75 × 10⁻⁸ | 8.2 | 92 | 0.587 |
| Post-consumer food wastes | 0.450 | 55 | 7.9 | 2.54 × 10⁻⁸ | 8.2 | 79 | 0.649 |
| OFMSW | 0.300 | 55 | 7.5 | 6.75 × 10⁻⁸ | 8.2 | 92 | 0.503 |
| Sewage sludge | 0.260 | 65 | 7.5 | 8.68 × 10⁻⁸ | 8.0 | 90 | 0.359 |
a Based on literature values (see Tables S1–S4), cross-checked with ADAT [16] where possible. b Coefficient for equation relating pH and pCO2 under mesophilic conditions [12].
Table 2.
RO AD plant feedstock characteristics with and without CO2 biomethanisation.
| Feedstock Category 1 | Biogas Produced 1 m3 | Without CO2 Biometh | With CO2 Biometh | TS 2 %FM | VS 2 %TS | Feedstock 7 Tonnes FM | ||||
|---|---|---|---|---|---|---|---|---|---|---|
| CH4 2 % vol | SMP 2 L CH4 kg−1 VS | Gross Energetic Value 3 GWh | CH4 4 % vol | SMP 5 L CH4 kg−1 VS | Gross Energetic Value 6 GWh | |||||
| (a) | (b) | (c) | (d) | (e) | (f) | (g) | (h) | (i) | (j) | (k) |
| Silage | 219,462,510 | 55 | 350 | 1201 | 92 | 585 | 2009 | 30 | 94 | 1,222,942 |
| Food, garden and plant waste | 165,291,843 | 55 | 450 | 905 | 79 | 646 | 1299 | 24 | 92 | 914,961 |
| Manures and slurries | 64,654,159 | 60 | 190 | 386 | 93 | 295 | 598 | 9 | 83 | 2,733,213 |
| Distillery waste | 16,055,060 | 60 | 300 | 96 | 90 | 450 | 144 | 7.1 | 73 | 619,528 |
| DAF sludge/wastewater | 14,960,483 | 65 | 260 | 97 | 90 | 360 | 134 | 6 | 65 | 959,005 |
| Crops | 14,141,474 | 55 | 350 | 77 | 92 | 585 | 129 | 60 | 93 | 39,825 |
| Glycerol | 9,919,812 | 60 | 425 | 59 | 90 | 638 | 89 | 99.5 | 99.5 | 14,146 |
| Dairy waste | 7,921,015 | 51 | 450 | 40 | 90 | 794 | 71 | 6.1 | 90 | 163,518 |
| Municipal waste | 6,271,886 | 55 | 300 | 34 | 92 | 502 | 57 | 24 | 92 | 52,076 |
| Other | 6,513,539 | 50 | 350 | 32 | 90 | 630 | 58 | 24 | 92 | 42,142 |
| TOTAL | 525,191,781 | 2928 | 4589 | 6,761,357 | ||||||
1 Based on Ofgem data [13]. 2 From ADAT [16] and values in Table 1 and literature review data, using the feedstock mapping assumptions described above. 3 (e) = (b) ∗ (c) ∗ 35.82 MJ m−3/(100% ∗ 3.6 ∗ 106 MJ GWh−1). 4 From Table 1 and associated literature data; categories distillery waste, glycerol, dairy waste and other assumed as 90%. 5 (g) = (d) ∗ (f)/(c). 6 (h) = (e) ∗ (f)/(c). 7 (k) = (b) ∗ (c) ∗ 100/((d) ∗ (i) ∗ (j)).
Table 3.
Potential uplift in gross energetic value through CO2 biomethanisation of reported UK feedstocks (Defra data).
Table 3.
Potential uplift in gross energetic value through CO2 biomethanisation of reported UK feedstocks (Defra data).
| Feedstock Category 1 | Feedstock 2 Tonnes FM | TS 3 %FM | VS 3 %TS | Without CO2 Biometh | With CO2 Biometh | ||||
|---|---|---|---|---|---|---|---|---|---|
| CH4 4 % vol | SMP 4 L CH4 kg−1 VS | Gross Energetic Value 5 GWh | CH4 4 % vol | SMP 4 L CH4 kg−1 VS | Gross Energetic Value 6 GWh | ||||
| (a) | (b) | (c) | (d) | (e) | (f) | (g) | (h) | (i) | (j) |
| Crops (treated as silage) | 4,163,000 | 30 | 94 | 55 | 350 | 4088 | 92 | 585 | 6839 |
| Food waste | 4,084,000 | 24 | 92 | 55 | 450 | 4038 | 79 | 646 | 5799 |
| Manures and slurries | 2,359,000 | 9 | 83 | 60 | 190 | 333 | 93 | 295 | 516 |
| Crop waste | 525,000 | 60 | 93 | 55 | 350 | 1020 | 92 | 585 | 1707 |
| Other | 2,727,000 | 24 | 92 | 50 | 350 | 2097 | 90 | 630 | 3774 |
| TOTAL | 13,858,000 | 11,576 | 18,635 | ||||||
Publisher’s Note: MDPI stays neutral with regard to jurisdictional claims in published maps and institutional affiliations. |
© 2022 by the authors. Licensee MDPI, Basel, Switzerland. This article is an open access article distributed under the terms and conditions of the Creative Commons Attribution (CC BY) license (https://creativecommons.org/licenses/by/4.0/).
Share and Cite
MDPI and ACS Style
Bywater, A.; Heaven, S.; Zhang, Y.; Banks, C.J. Potential for Biomethanisation of CO2 from Anaerobic Digestion of Organic Wastes in the United Kingdom. Processes 2022, 10, 1202. https://0-doi-org.brum.beds.ac.uk/10.3390/pr10061202
AMA Style
Bywater A, Heaven S, Zhang Y, Banks CJ. Potential for Biomethanisation of CO2 from Anaerobic Digestion of Organic Wastes in the United Kingdom. Processes. 2022; 10(6):1202. https://0-doi-org.brum.beds.ac.uk/10.3390/pr10061202
Chicago/Turabian StyleBywater, Angela, Sonia Heaven, Yue Zhang, and Charles J. Banks. 2022. "Potential for Biomethanisation of CO2 from Anaerobic Digestion of Organic Wastes in the United Kingdom" Processes 10, no. 6: 1202. https://0-doi-org.brum.beds.ac.uk/10.3390/pr10061202
Note that from the first issue of 2016, this journal uses article numbers instead of page numbers. See further details here.