Article

An Investigation on the Features of Deformation and Residual Stress Generated by Patch Welding with Different Plate Sizes

by
Takehito Hashiguchi
1,
Mikihito Hirohata
1,* and
Károly Jármai
2
1
Graduate School of Engineering, Osaka University, Suita 565-0871, Japan
2
Faculty of Mechanical Engineering and Informatics, University of Miskolc, 3515 Miskolc, Hungary
*
Author to whom correspondence should be addressed.
Submission received: 30 May 2022 / Revised: 29 June 2022 / Accepted: 30 June 2022 / Published: 4 July 2022
(This article belongs to the Special Issue Chemical Engineering and Technology)

Abstract

:
Welding is widely used to manufacture and repair steel structures such as piping and pressure vessels. Welding induces deformation and residual stress, which influences the mechanical performance of the structural members. Noting patch welding, which is applied to repair steel structures, a series of patch welding experiments and numerical analyses were carried out. The features of out-of-plane deformation and residual stress by patch welding were examined by changing the patch size. The out-of-plane deformation showed different modes in the patch joints. The magnitude of the out-of-plane deformation depended on the patch size. The tensile residual stress at the weld toe increased with the enlargement of the patch size. The costs for the different sizes of patch welding were estimated for choosing the patch size reasonably. The patch size should be determined by considering the mechanical influences of welding and the economic viewpoints of the welding process.

1. Introduction

Welding is an important technology for joining metal structural members. Pressure vessels or pipes in chemical plant structures are assembled by welding. Welding is widely used not only for manufacturing new structures but also for repairing damaged parts of structures [1]. When cracks or defects are detected in a material, they are removed by grinding or gouging, and repair welding is performed [2]. When a member is thinned by corrosion, a patch plate is welded on the thickness-reduced part [3]. Welding can repair damages such as cracks or thickness reduction by filling the damaged part with the melted metal or joining the additional member to the damaged parts. Although welding has a lot of advantages as a repair method, there are some disadvantages, such as welding deformation and residual stress.
Many research works have been conducted on welding deformation and residual stress to investigate their generation mechanism and their features [4,5]. The high-temperature region by welding in the material is very local, and the temperature in the region away from the welded part is not so high. The large temperature difference causes a gap in thermal expansion. When the weld metal is put on the surface of the metal plate, the heated part on the surface is expanded by the temperature rise. Although the mid-thickness or the bottom surface of the plate is also heated by the supplement of the weld metal on the top surface, the temperature at these parts is lower than that at the top surface. After the heating stage, the plate starts to cool down. Then, the shrinkage of material occurs in the cooling stage. The degree of shrinkage varies in the thickness direction as well as the expansion in the heating stage. These differences in the expansion and shrinkage in the thickness direction create out-of-plane deformation. Furthermore, this expansion and shrinkage around the welded part are restrained by the surrounding parts, the temperature of which is not so high. As a result, residual stress is generated by welding. High tensile stress is produced around the welded part because the shrinkage in the cooling stage is restrained by the surrounding base metal. The welding deformation reduces the accuracy of assembly or the load-carrying capacity of the members. The residual welding stress becomes a cause of cracking and reduces fatigue strength. The welding deformation and residual stress might be crucial factors for ensuring the mechanical performance and safety of metal structures [6].
Among many kinds of welded joints, butt joints by flat plates or T-shaped joints are common targets because they are generally used in any type of structure. On the other hand, there are few reports about patch joints compared to flat plate joints or T-shaped joints because the patch joints are basically not for manufacturing but for repairing [7,8]. It should be noted that the weld repair induces harmful influences on structures due to deformation and residual stress, and this should be avoided [9]. From this point of view, the features of deformation and residual stress generated by patch welding might have significant meanings.
The features of welding residual stress have been investigated experimentally and analytically by the previous studies [10,11]. However, the joint type in these studies was not a patch welding but a groove welding of flat plates or pipes. Although the previous study investigated the feature of residual stress by patch welding [8], the features of deformation were not discussed. Therefore, this study aims to investigate the features of both deformation and residual stress by square patch welding on steel plates, noting its size effect. A series of experiments and FE simulations were conducted with changing patch sizes. The influences of the patch sizes on the welding deformation and residual stress were examined. Furthermore, a cost estimation was performed on the different sizes of patch welding, because the patch size, including the amount of material and the weld length, directly influences the cost of the repair work. The results obtained in this study will contribute to selecting the patch size for the weld repair process from mechanical and economical viewpoints.

2. Welding Experiment
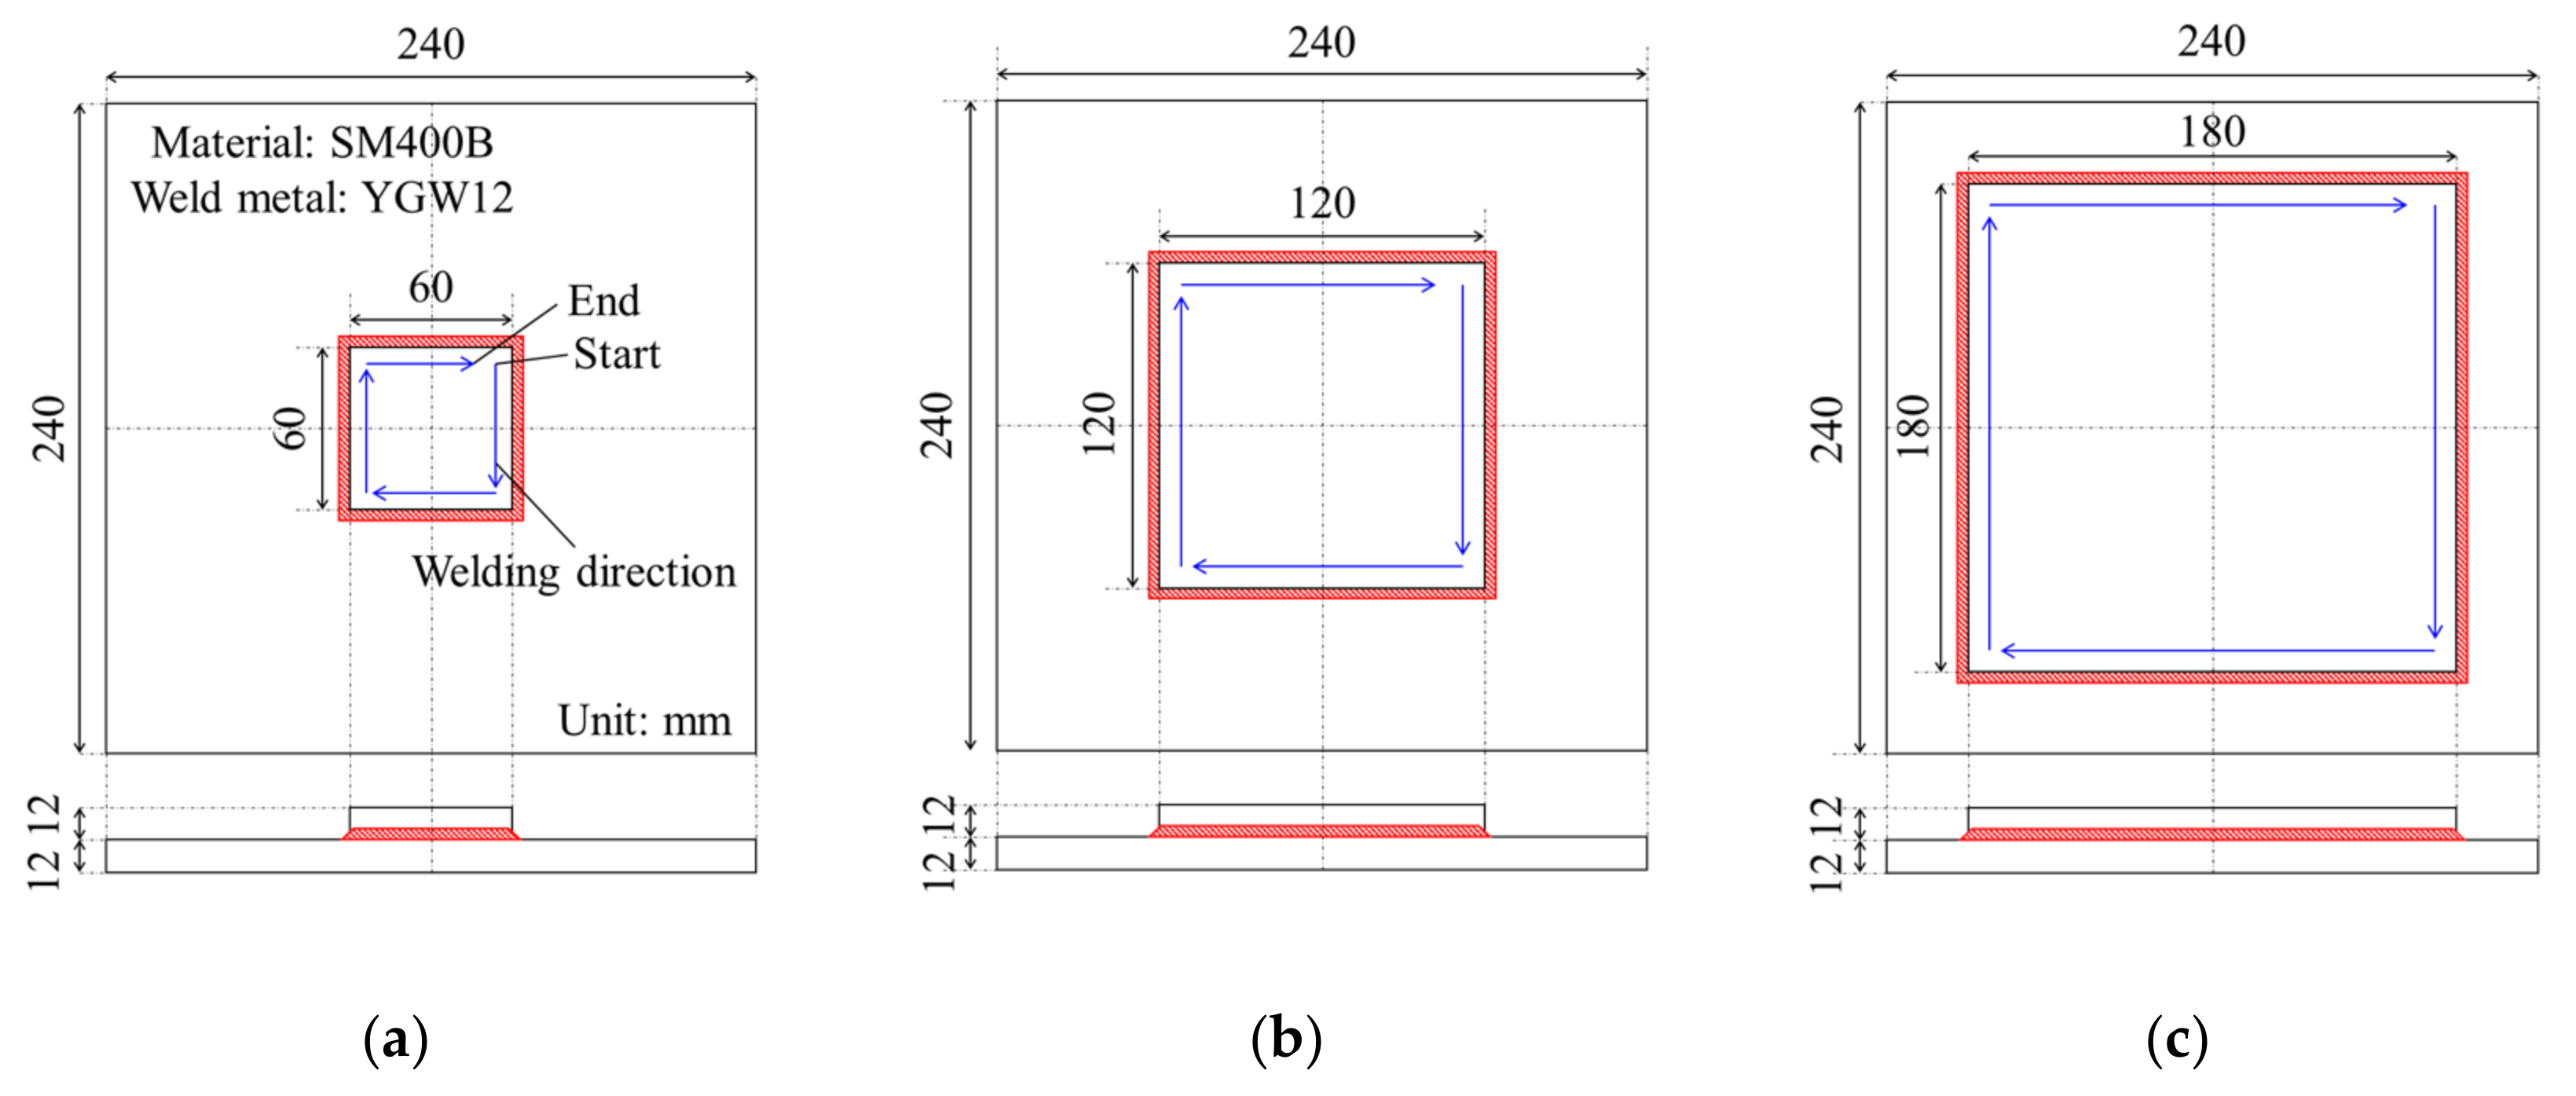
2.1. Specimen

Figure 1 shows the shape and dimensions of the specimens used in the experiment. The patch plates with different sizes of 60 mm, 120 mm, and 180 mm were welded to the center of the upper surface of the base plates, which was 240 mm on each side and 12 mm thick. Three specimens were prepared for each size of the patch plate, and a total of nine specimens were prepared. The specimens were named b60, b120, and b180 by the size of each plate. In order to accurately measure the residual stress induced by welding, the specimens were heat-treated in advance to release the initial stress before welding. The heat treatment was an annealing process by which the specimens were kept at 600 °C for 10 h and then slowly cooled in a furnace.
The material used in this study was SM400B (rolled steel for welded structures), specified by Japanese Industrial Standards (JIS G 3106) [12]. A gas metal arc welding with YGW12 (JIS Z 3312) [13] was performed. Table 1 shows the mechanical properties of the materials (mill sheet values and catalog values).
All specimens were welded clockwise around the entire circumference under the welding conditions shown in Table 2. The welding conditions were selected to provide the weld bead with a leg length of 4 mm based on the experience of skilled welders.

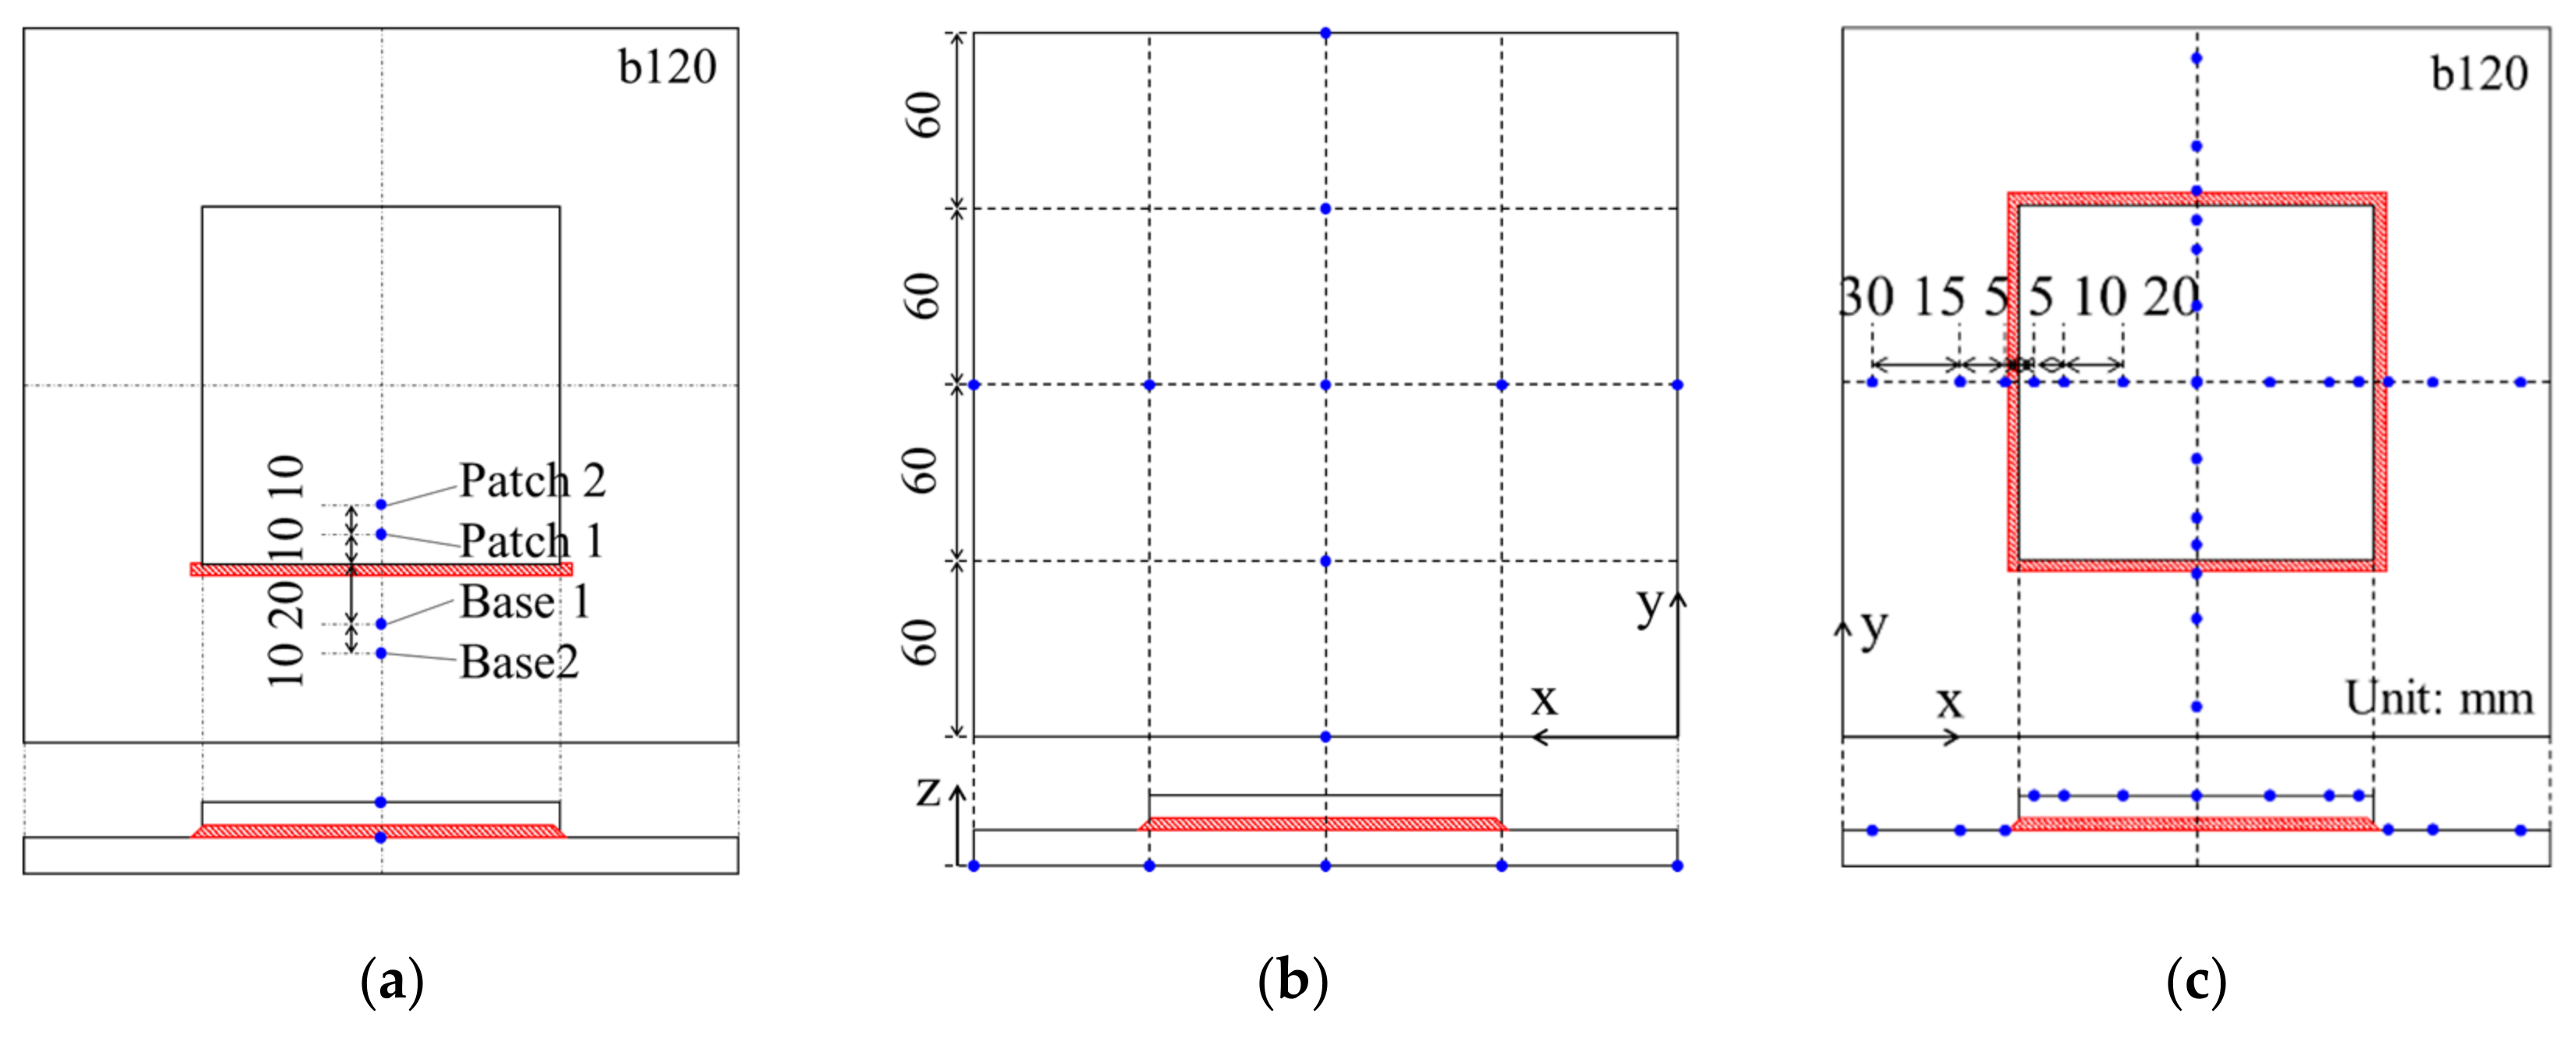
2.2. Measurement Method

Figure 2a shows the positions of the thermocouples for measuring the temperature histories by welding. The temperature data were acquired at intervals of 0.5 s. To reproduce the experimental results by the thermal elastic–plastic analysis described below, the temperature histories were obtained for two specimens of each size of the patch plates when the welding of the first pass was performed.
The specimens were welded around the entire circumference of the patch plate and cooled to room temperature; then, the out-of-plane deformation was measured. Figure 2b shows the measurement positions at intervals of 60 mm on the lower surface of the specimen. A dial gauge was used for the measurement. In order to measure the deformation due to welding, the initial deformation was also obtained before the welding. The out-of-plane deformation at both ends of the specimen was set to zero at each measurement line, and the relative displacement from the line connecting the two ends was calculated.
Several measurement methods of residual stress have been examined. A deep hole drilling method is one of the typical destructive measurement methods [10]. The deep hole drilling method can measure not only surface stress but also through-thickness stress. Because the specimens in this study are relatively thin and the surface stress is noted, non-destructive measurement by the X-ray diffraction method was adopted for efficient work [14].
Thirteen measurement points for residual stress were set on the centerline of the upper surface of the specimen in the x-axis and the y-axis directions, respectively. The residual stresses in the x-axis and the y-axis directions were measured at each point. Figure 2c shows the measurement positions. Before the measurement, the mill scale was removed by belt sanding, and the steel surface was smoothed by electropolishing. The depth of electropolishing was about 0.2 to 0.4 mm. The residual stresses were measured by a device of the X-ray diffraction method (μ-X360s, Pulstec Industrial Co., Ltd., Hamamatsu, Japan).

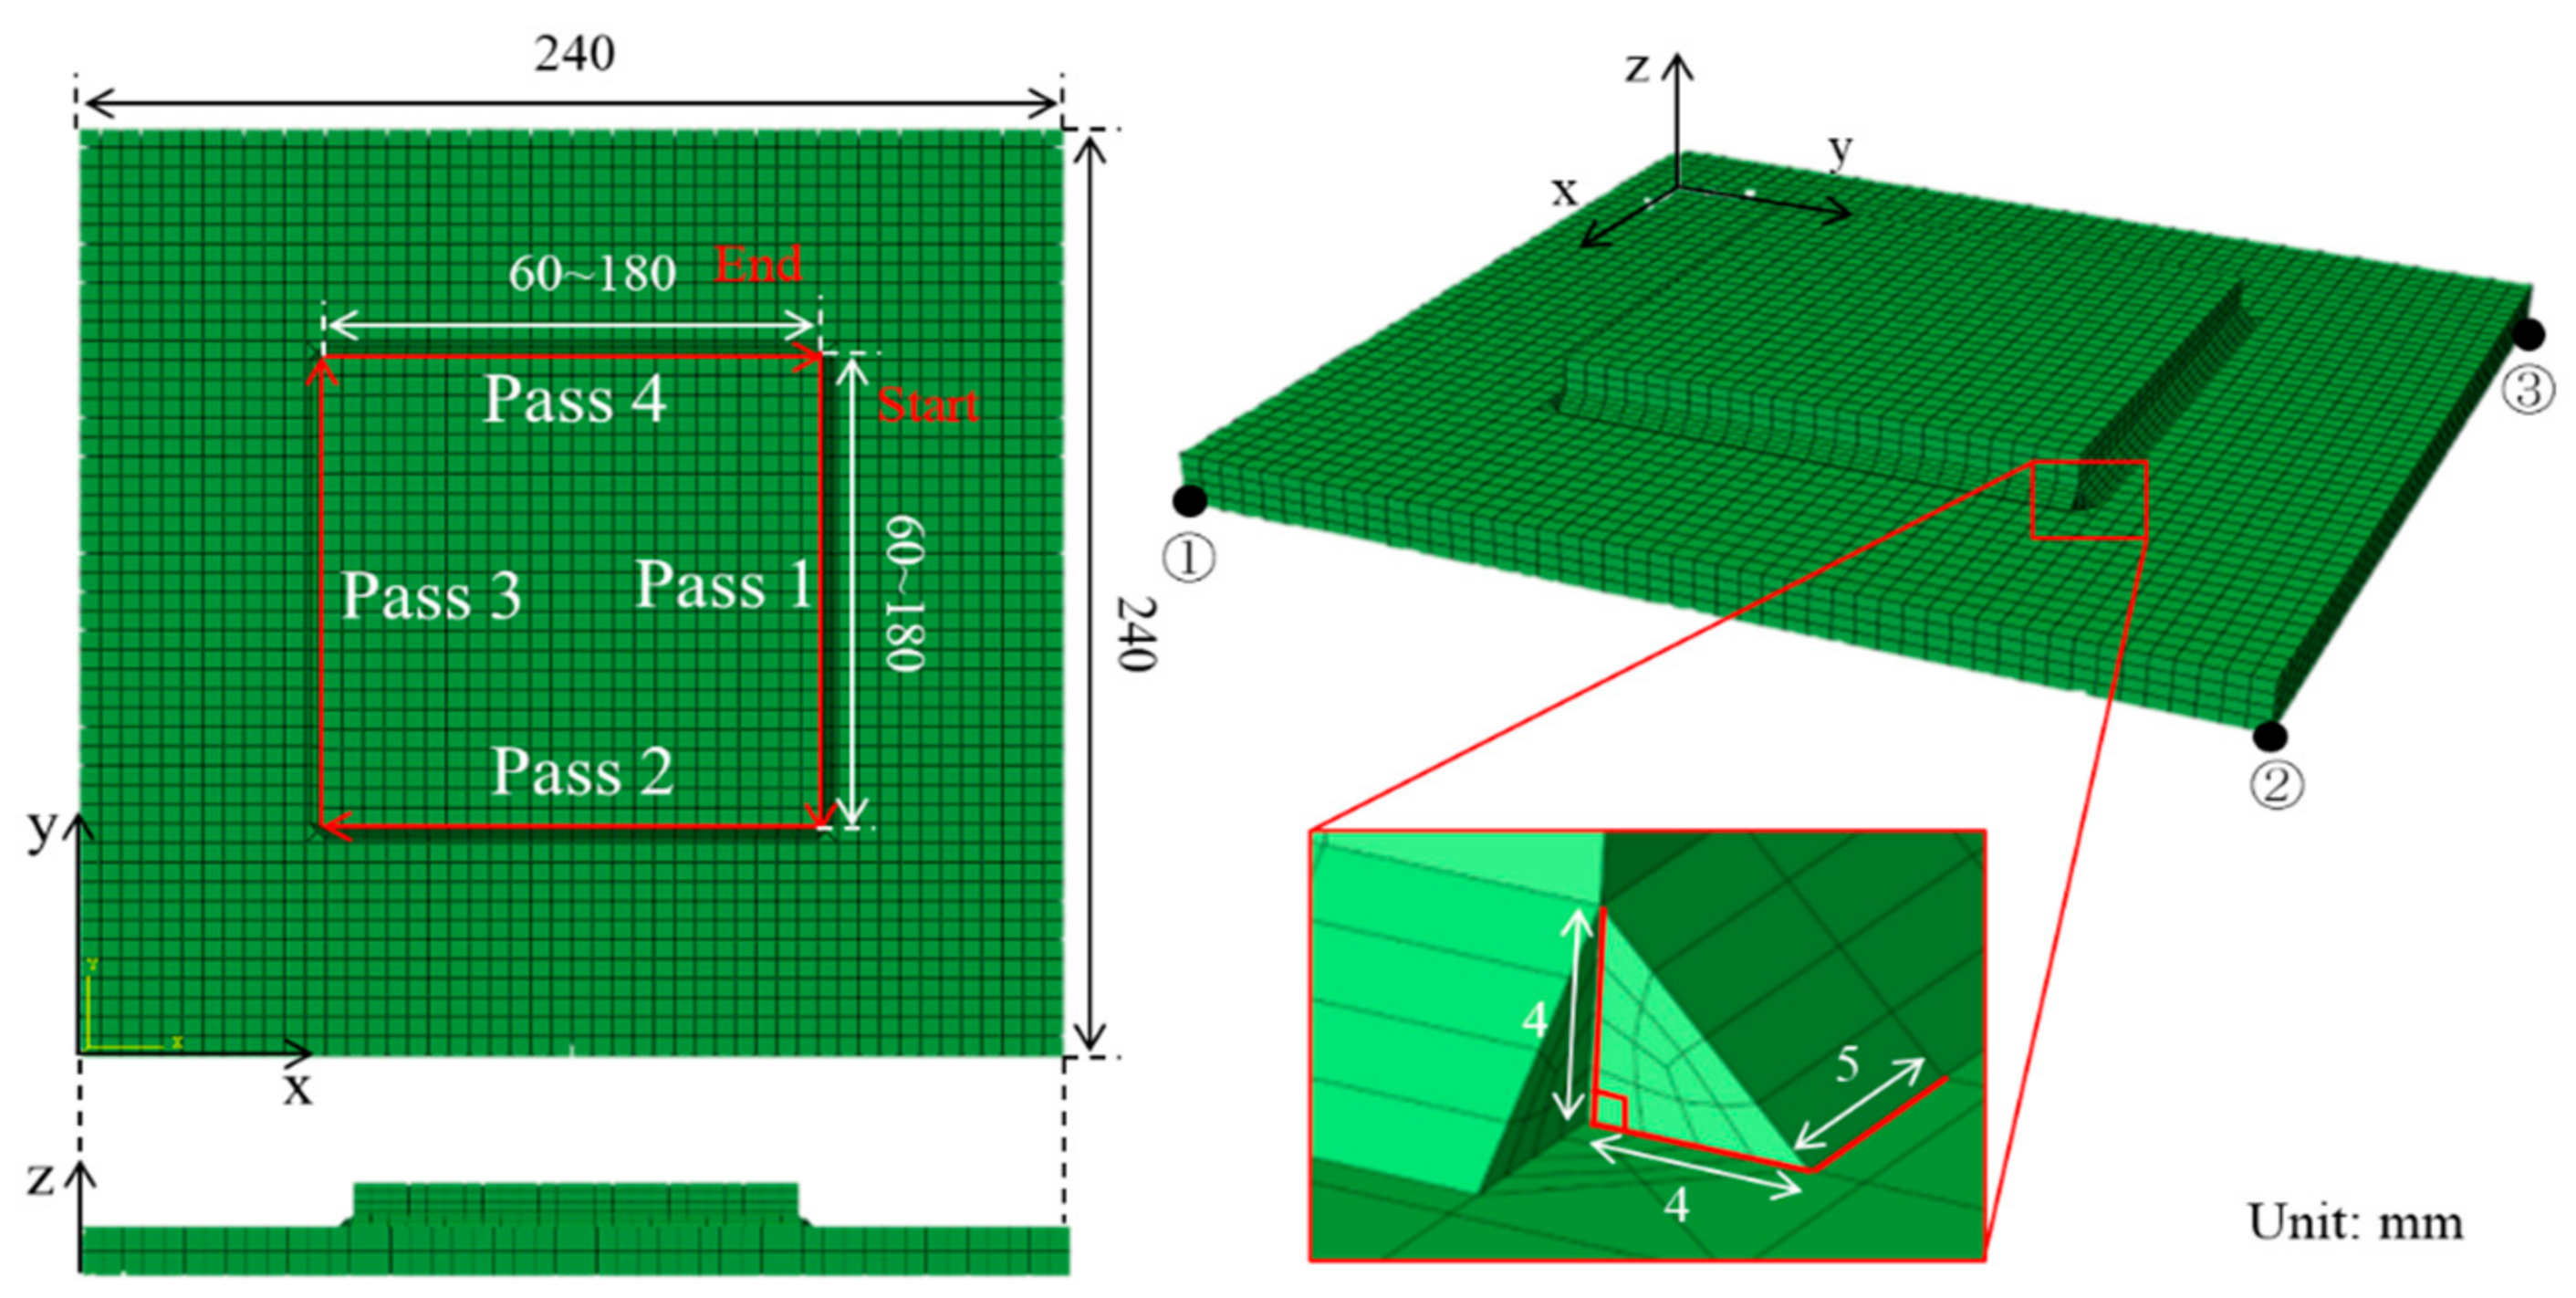
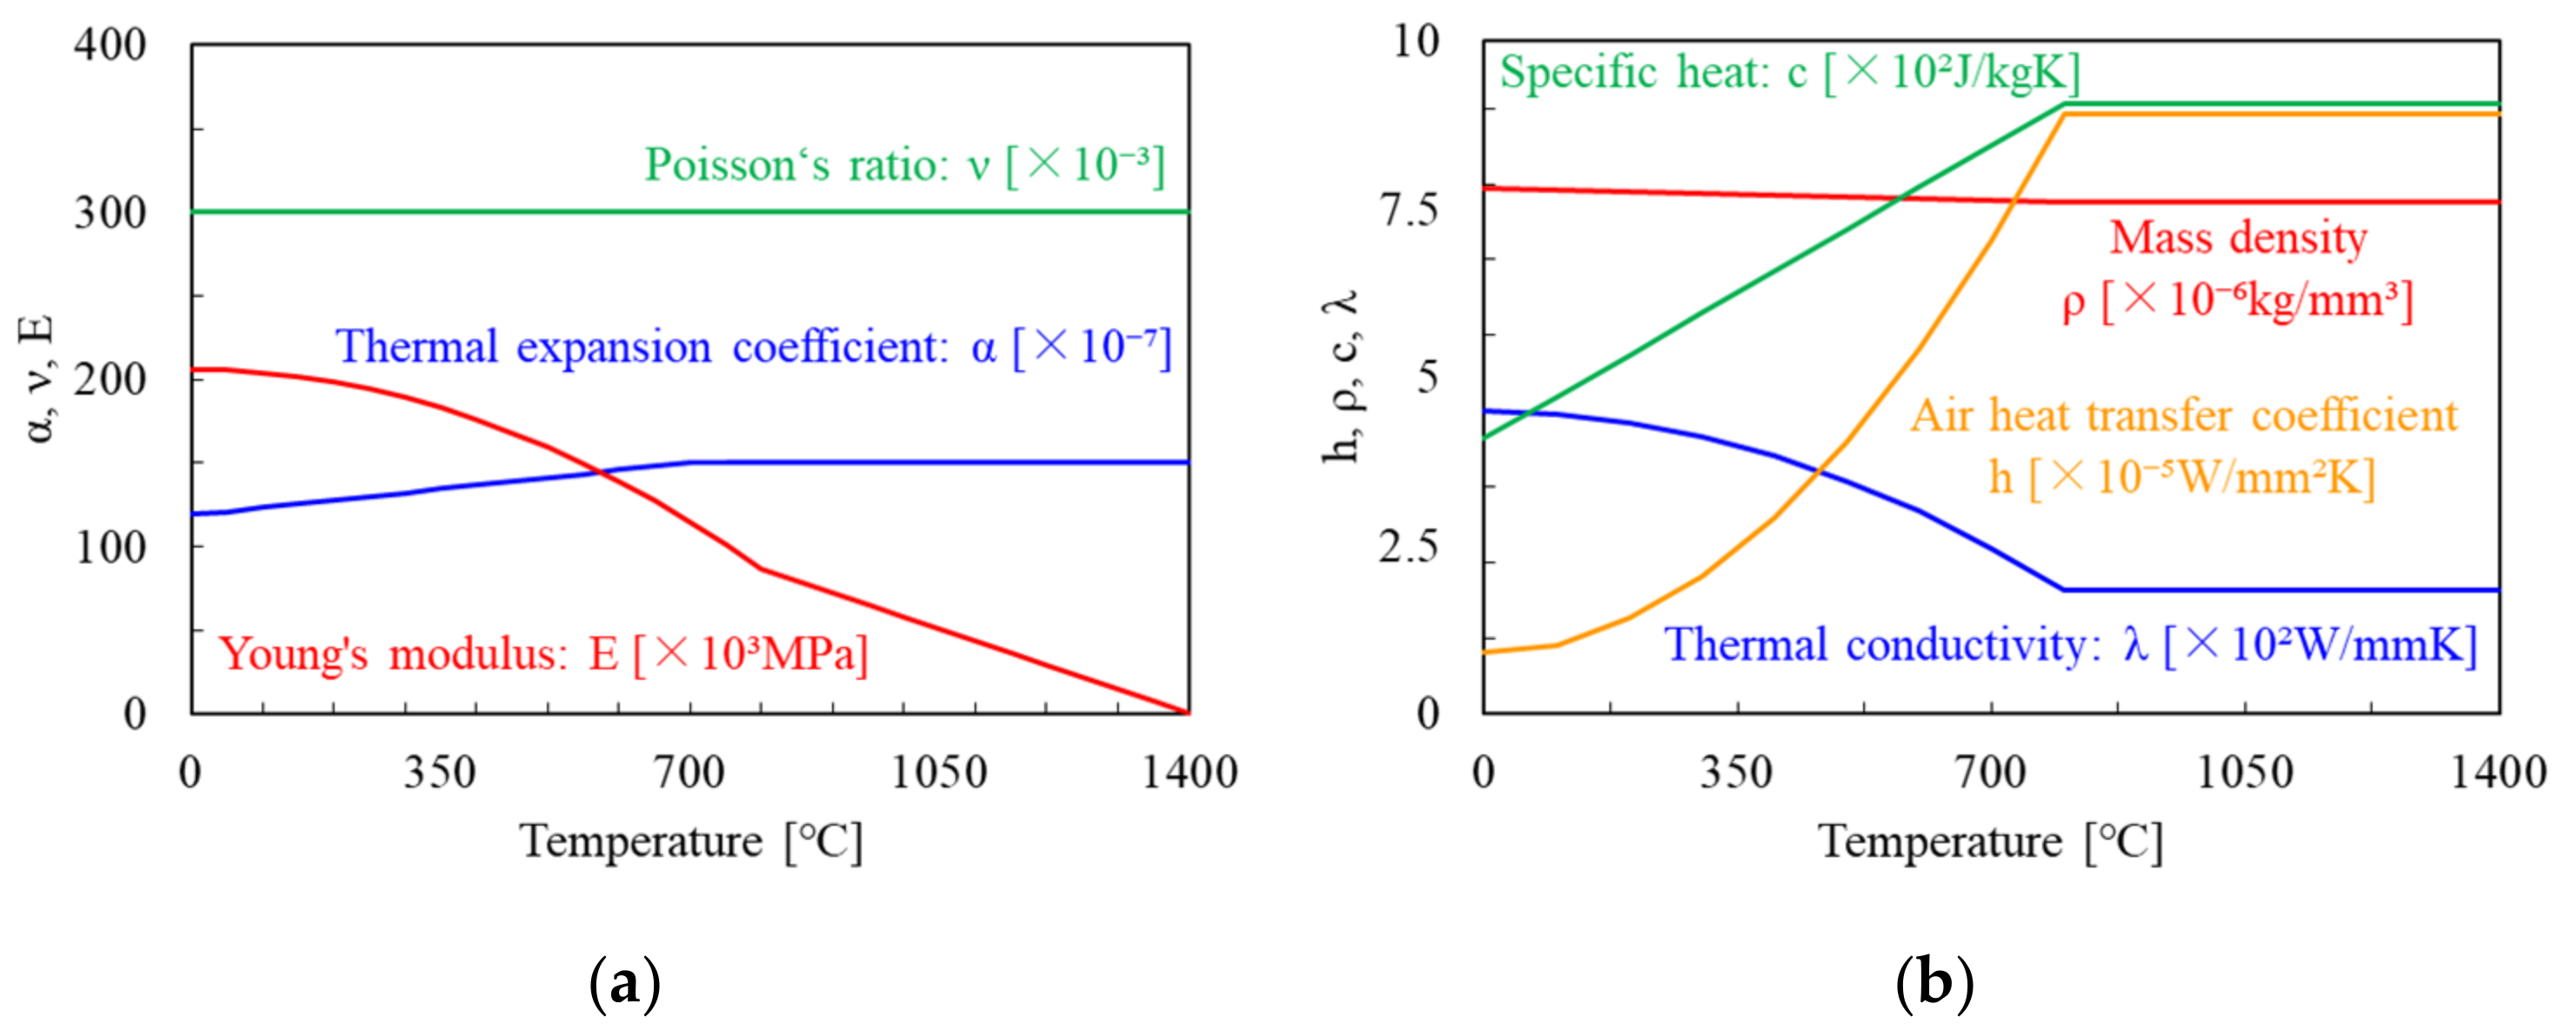
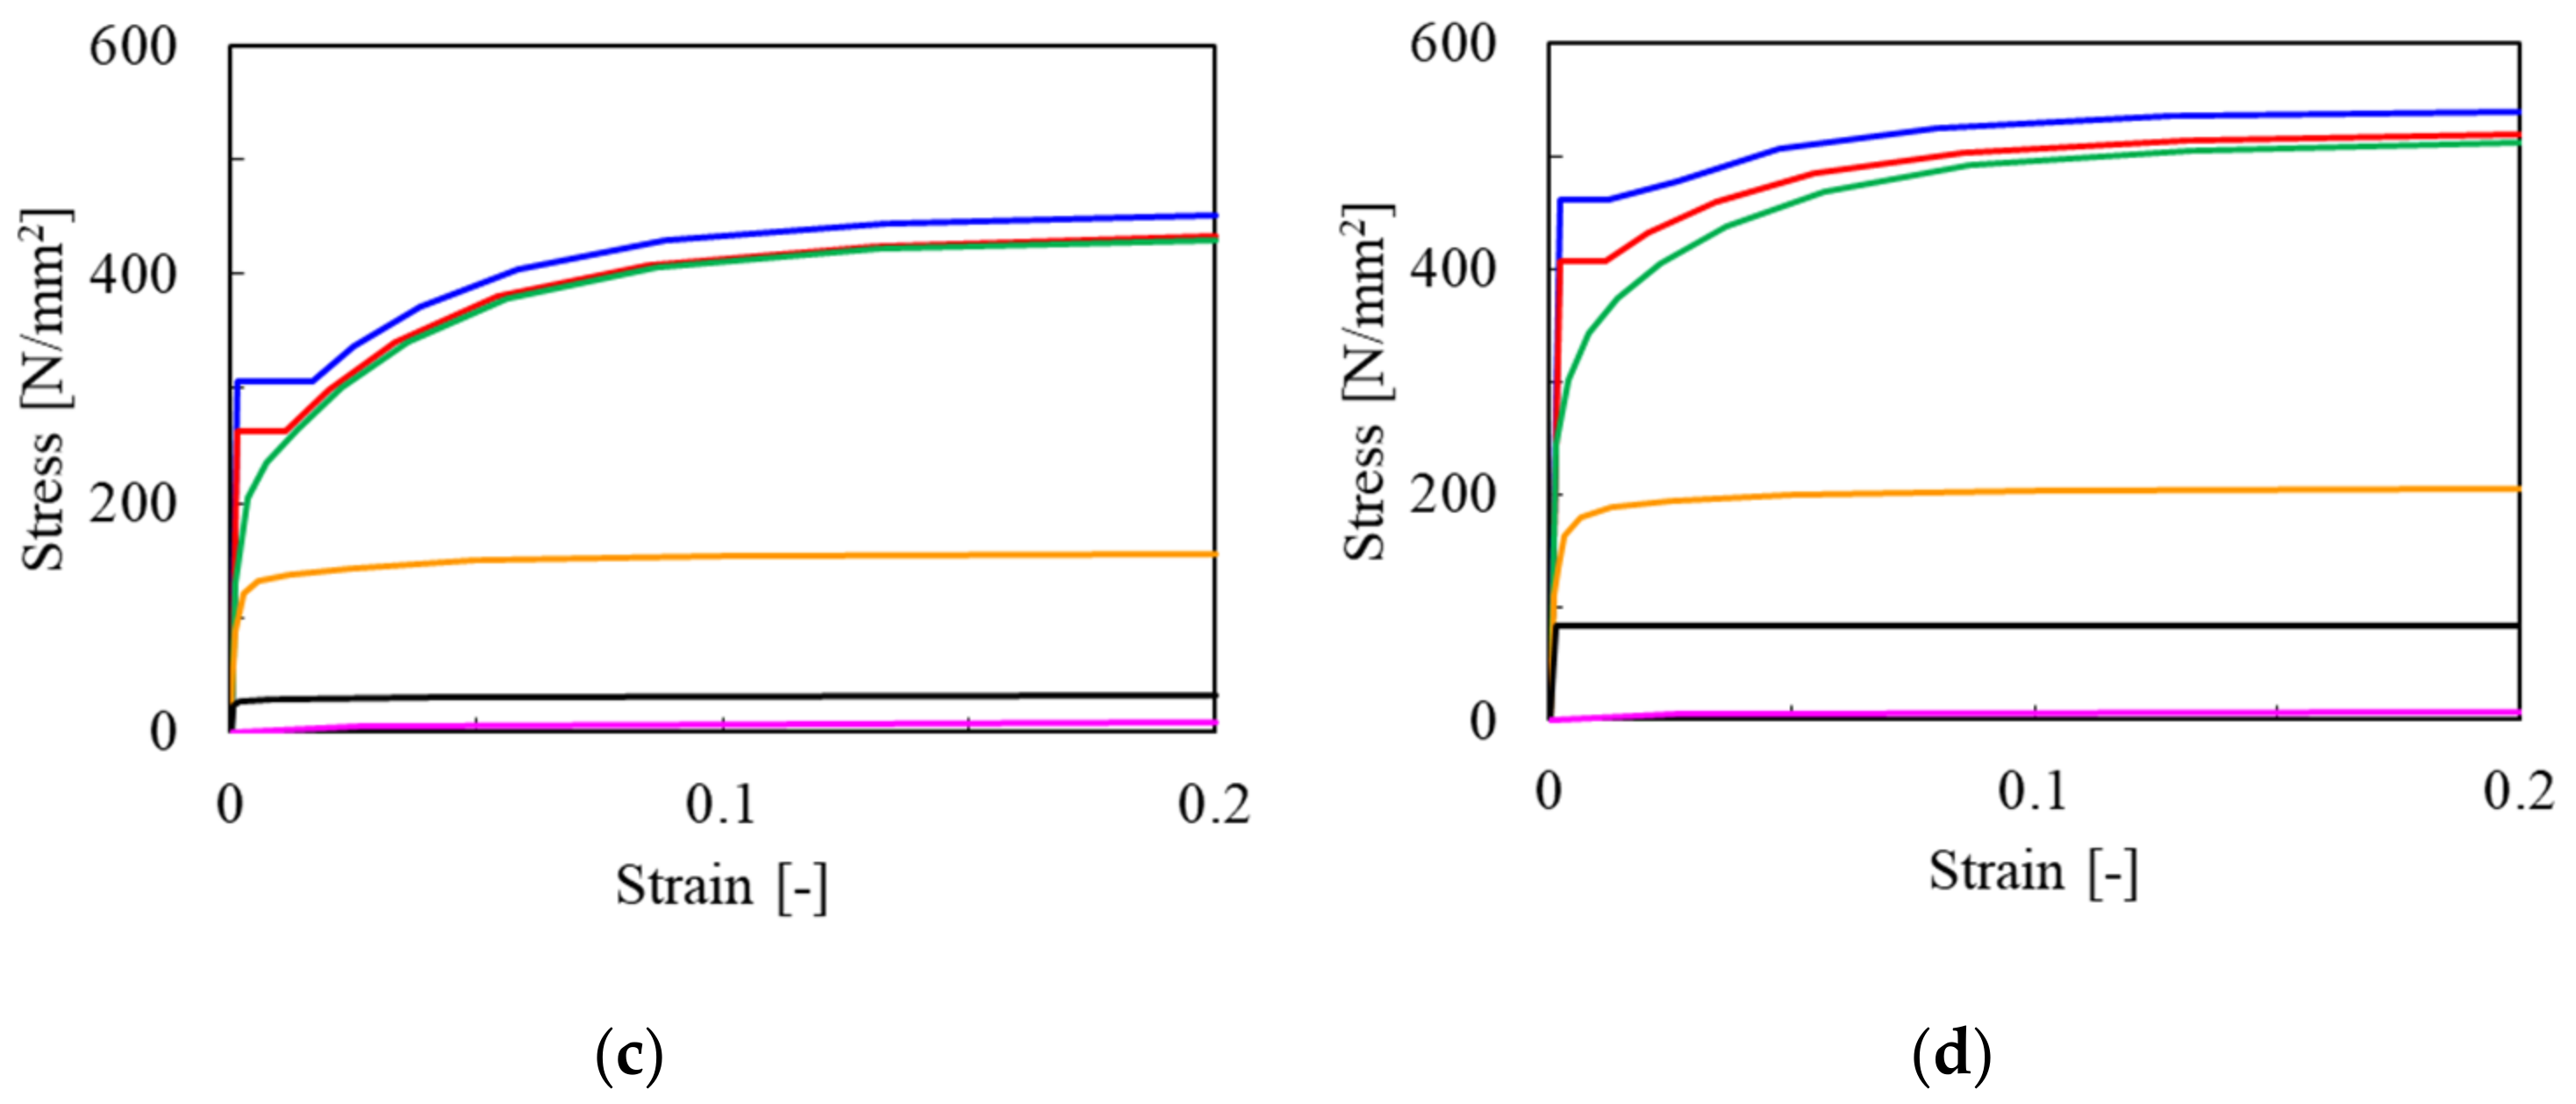
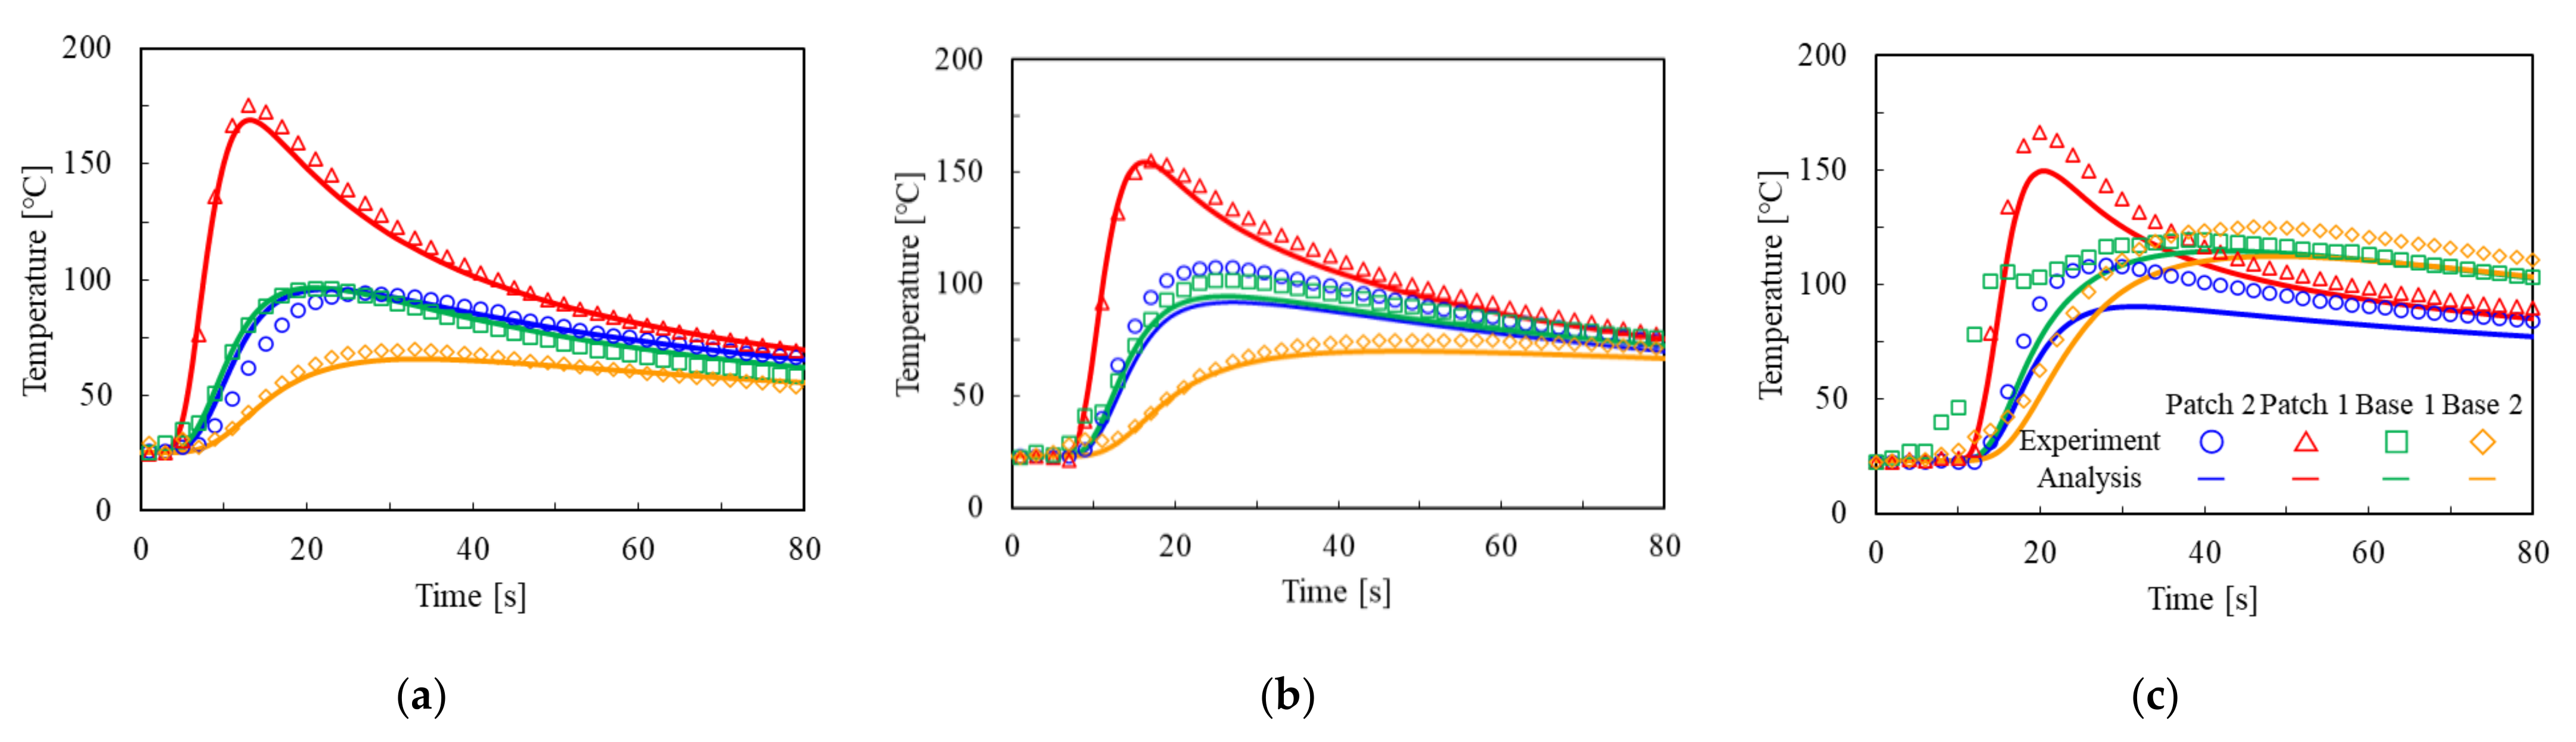
3. Welding Simulation by Thermal Elastic–Plastic Analysis

In order to clarify the features of deformation and the residual stresses of the patch joints, a simulation of the welding experiment by thermal elastic–plastic analysis was conducted. The commercial FE analysis software Abaqus ver. 6.14 was used.
The analytical model is shown in Figure 3. The analytical conditions are shown in Table 3. The cross-section of the weld bead was modeled as a right-angled isosceles triangle of 4 mm × 4 mm. In order to reproduce the welding process, weld bead elements were generated with the movement of the heat source by the element birth function. The red arrows in Figure 3 indicate the welding direction. A gap of 0.001 mm was set between the base plate and the patch plate, and a rigid contact condition was applied to the surfaces between the base plate and the patch plate. The mesh size of the elements was set to be about 5 mm. Only the rigid body displacement of the model was constrained as the mechanical boundary condition. The heat transfer from the surface to the air was defined as the thermal boundary condition.
A uniform heat input was calculated from Equation (1) [10].
q = η I V S L
where q is the heat input [J/mm3], η is the thermal efficiency [-], I is the welding current [A], V is the welding voltage [V], S is the cross-sectional area of the heat input element [mm2], and L is the length of the heat input element [mm].
The temperature-dependent material properties and the stress–strain relationship used in the analysis are shown in Figure 4. The previous studies were referred to in order to determine these properties [15,16].
The thermal efficiency of the heat input of the welding and the contact heat transfer between the plates were determined. Because the thermal efficiency η of arc welding is generally 0.7 to 0.9 [17,18], the analysis was conducted under the condition that η was varied in the range of 0.7 to 0.8. The value of η was selected to match the temperature history obtained in the experiment.
It is known that solid-state phase transformation affects the residual stress of weld metals of high-strength steel [10]. However, the material used in this study was normal carbon steel. Furthermore, not only the stress around the welds but also the deformation and the overall stress distribution in the joints were examined in this study. Therefore, the solid-state phase transformation was not considered in the analysis.
Since the specimens used in this study had a contact between the base plate and the patch plate, a heat transfer should be considered between them. In this analysis, it was assumed that the heat transfer coefficient was determined only by the temperature. The heat transfer was assumed to be independent of the contact pressure and the amount of gap for the sake of simplifying the analytical conditions. Therefore, the heat transfer between the base plate and the patch plate was modeled the same as the thermal conductivity of steel.
The results of the analysis under the above conditions are shown in Figure 5. The temperature change of the specimen due to the heat input during welding was reproduced with a high accuracy. Thereafter, in order to remove the influence of variations in the heat input and speed during welding, the analysis was conducted under the same conditions for all models, except for the dimensions. In other words, using the average experimental values of the welding speed of 5.75 mm/s, the voltage of 23 V, the current of 157 A, and the temperature of 24 °C, the analysis was conducted again.

4. Results and Discussion of the Experiment and Analysis

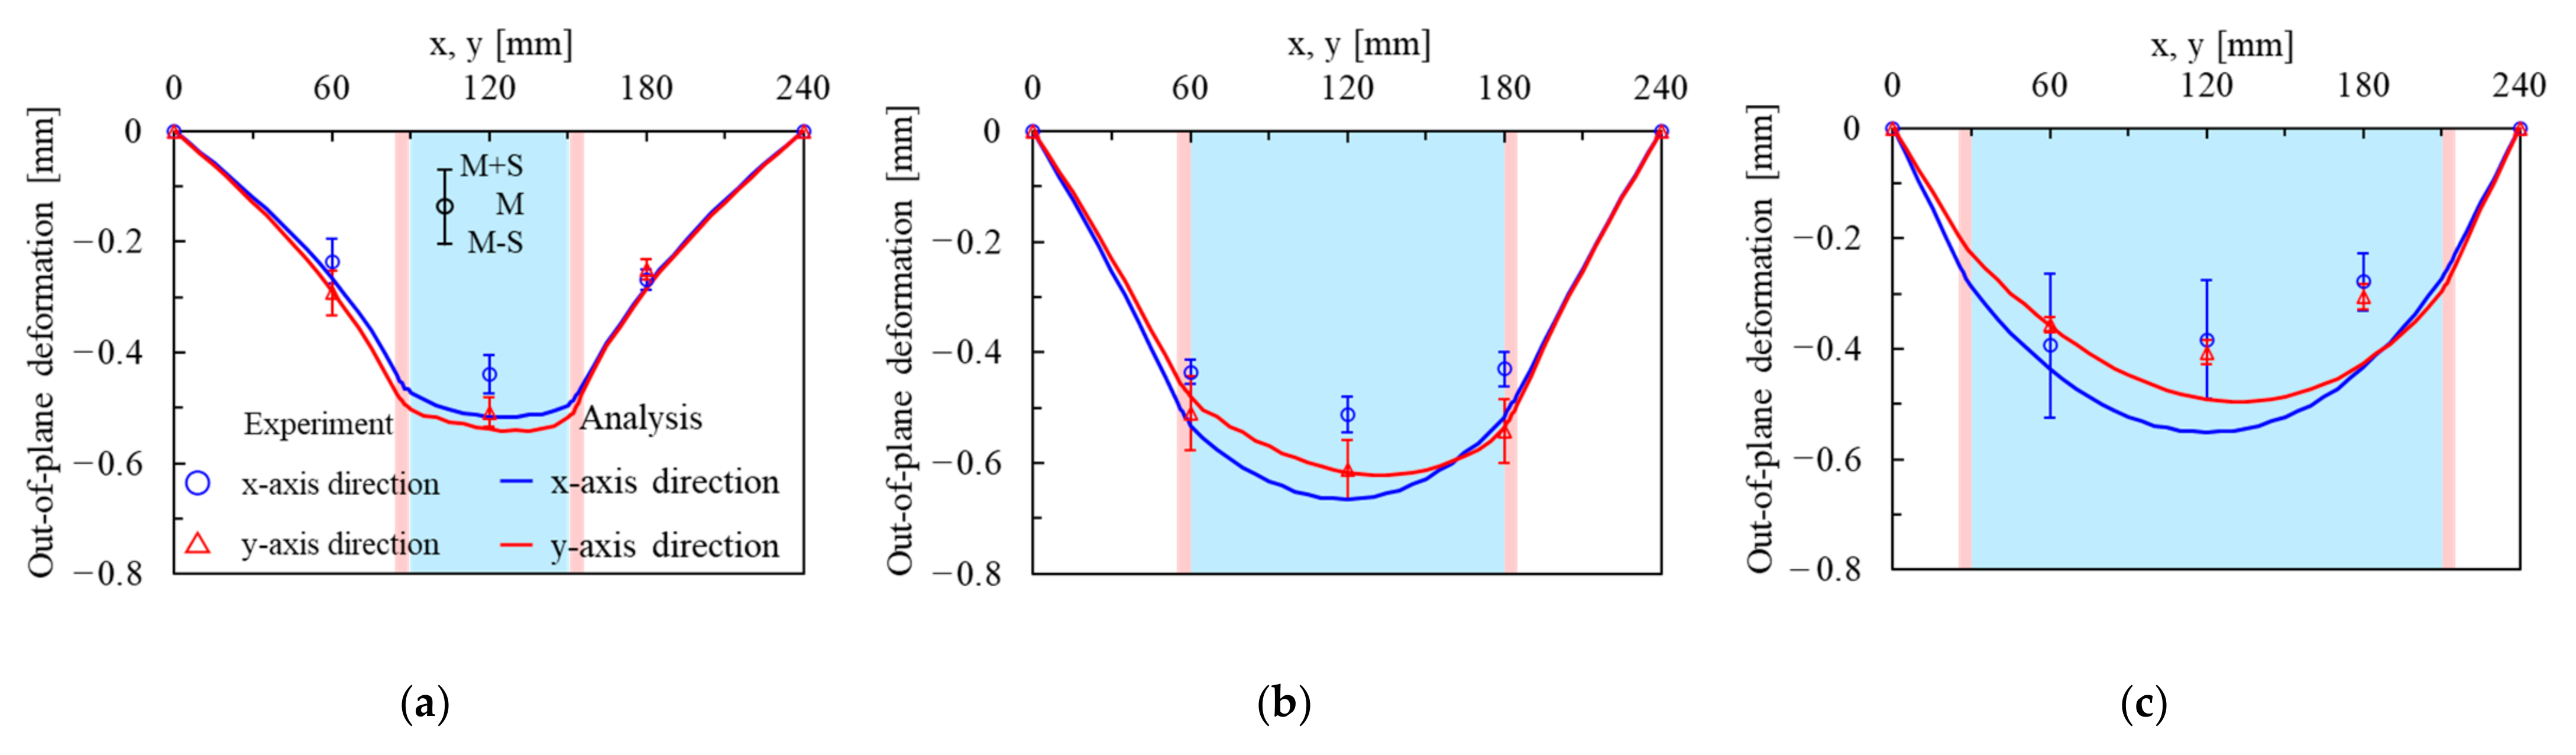
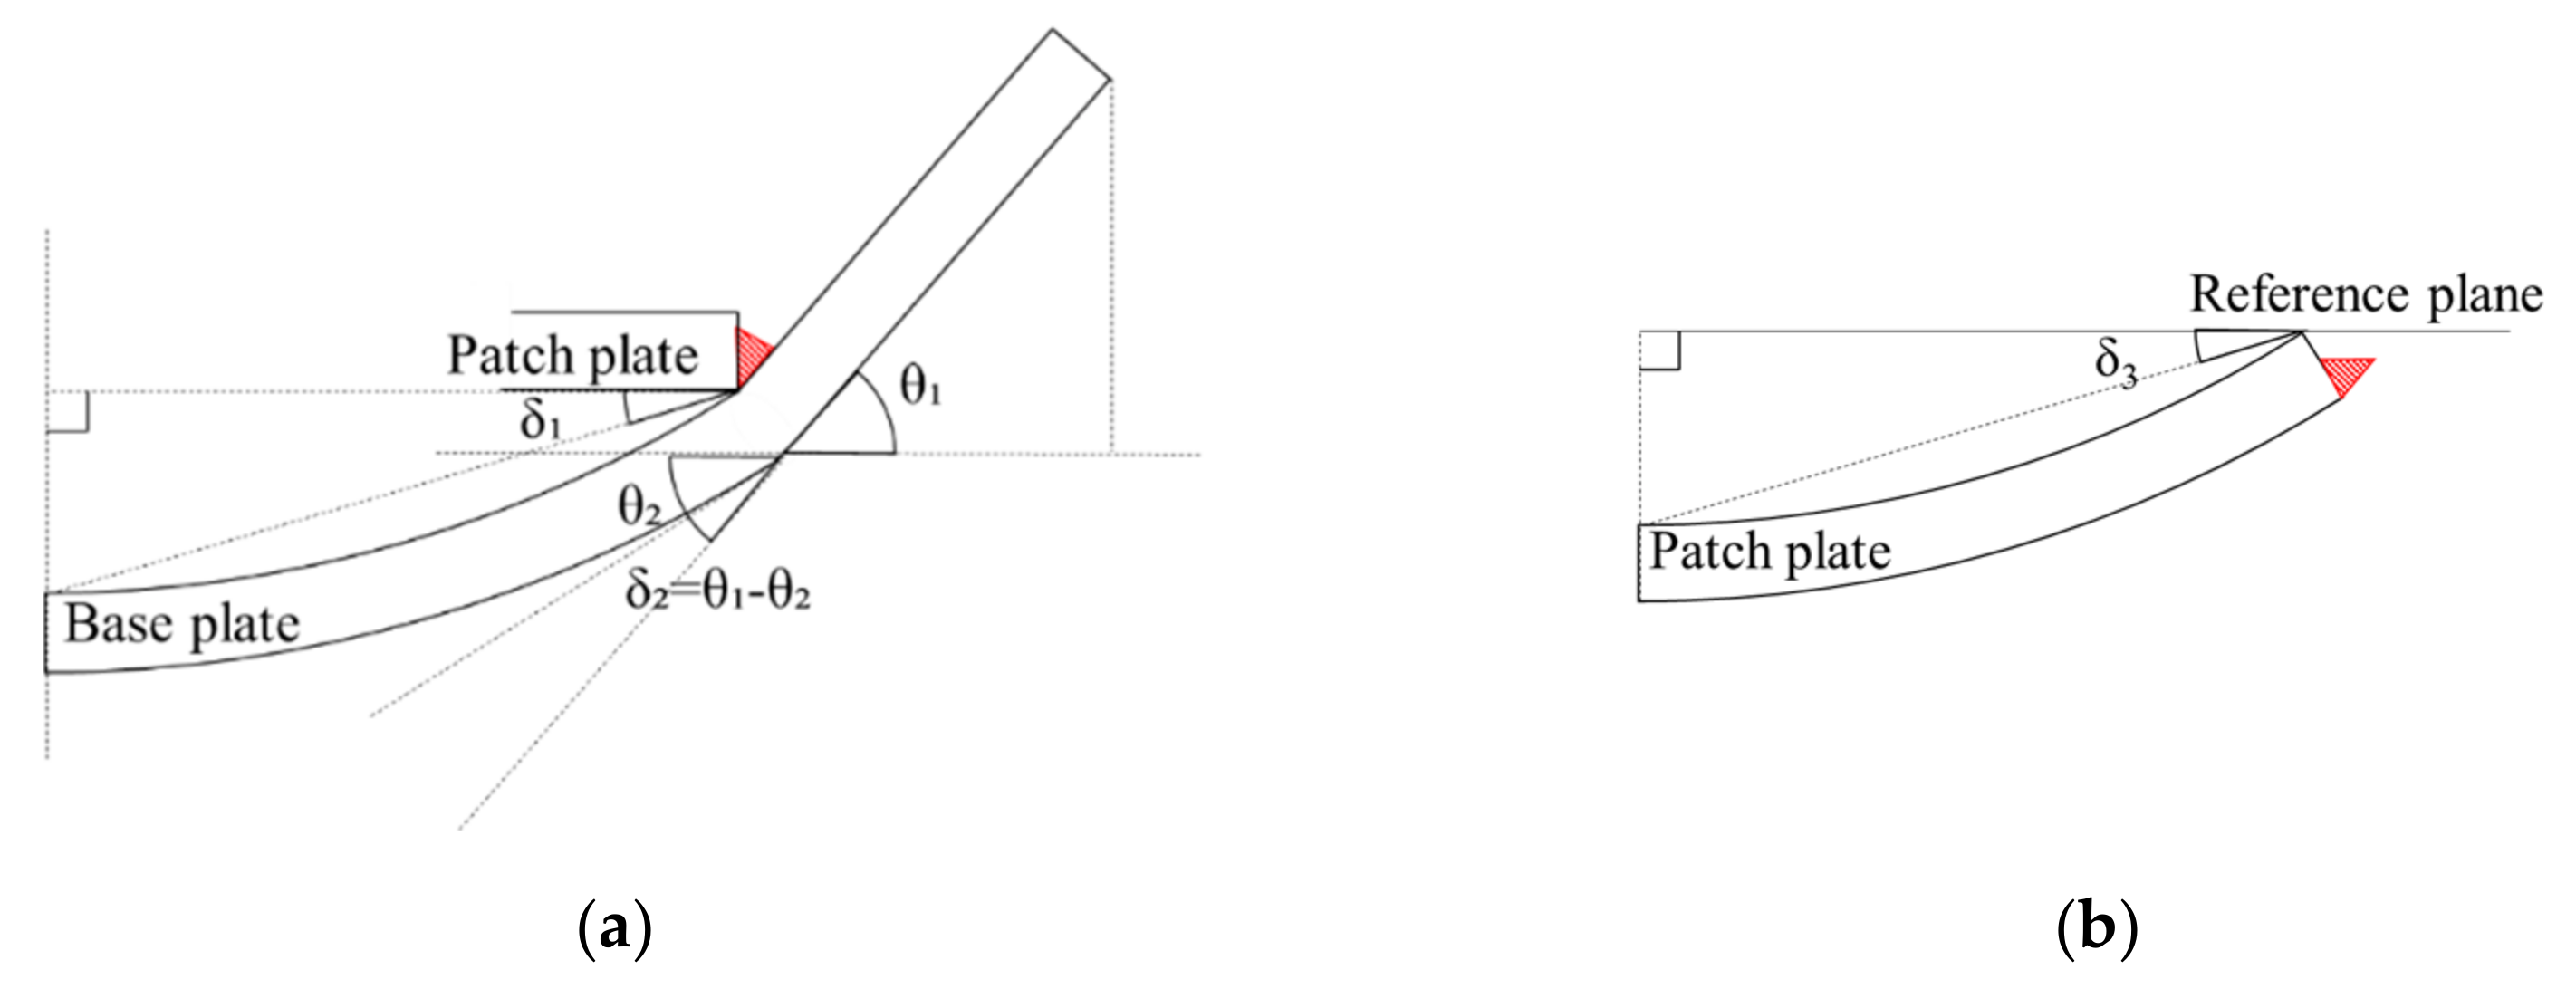
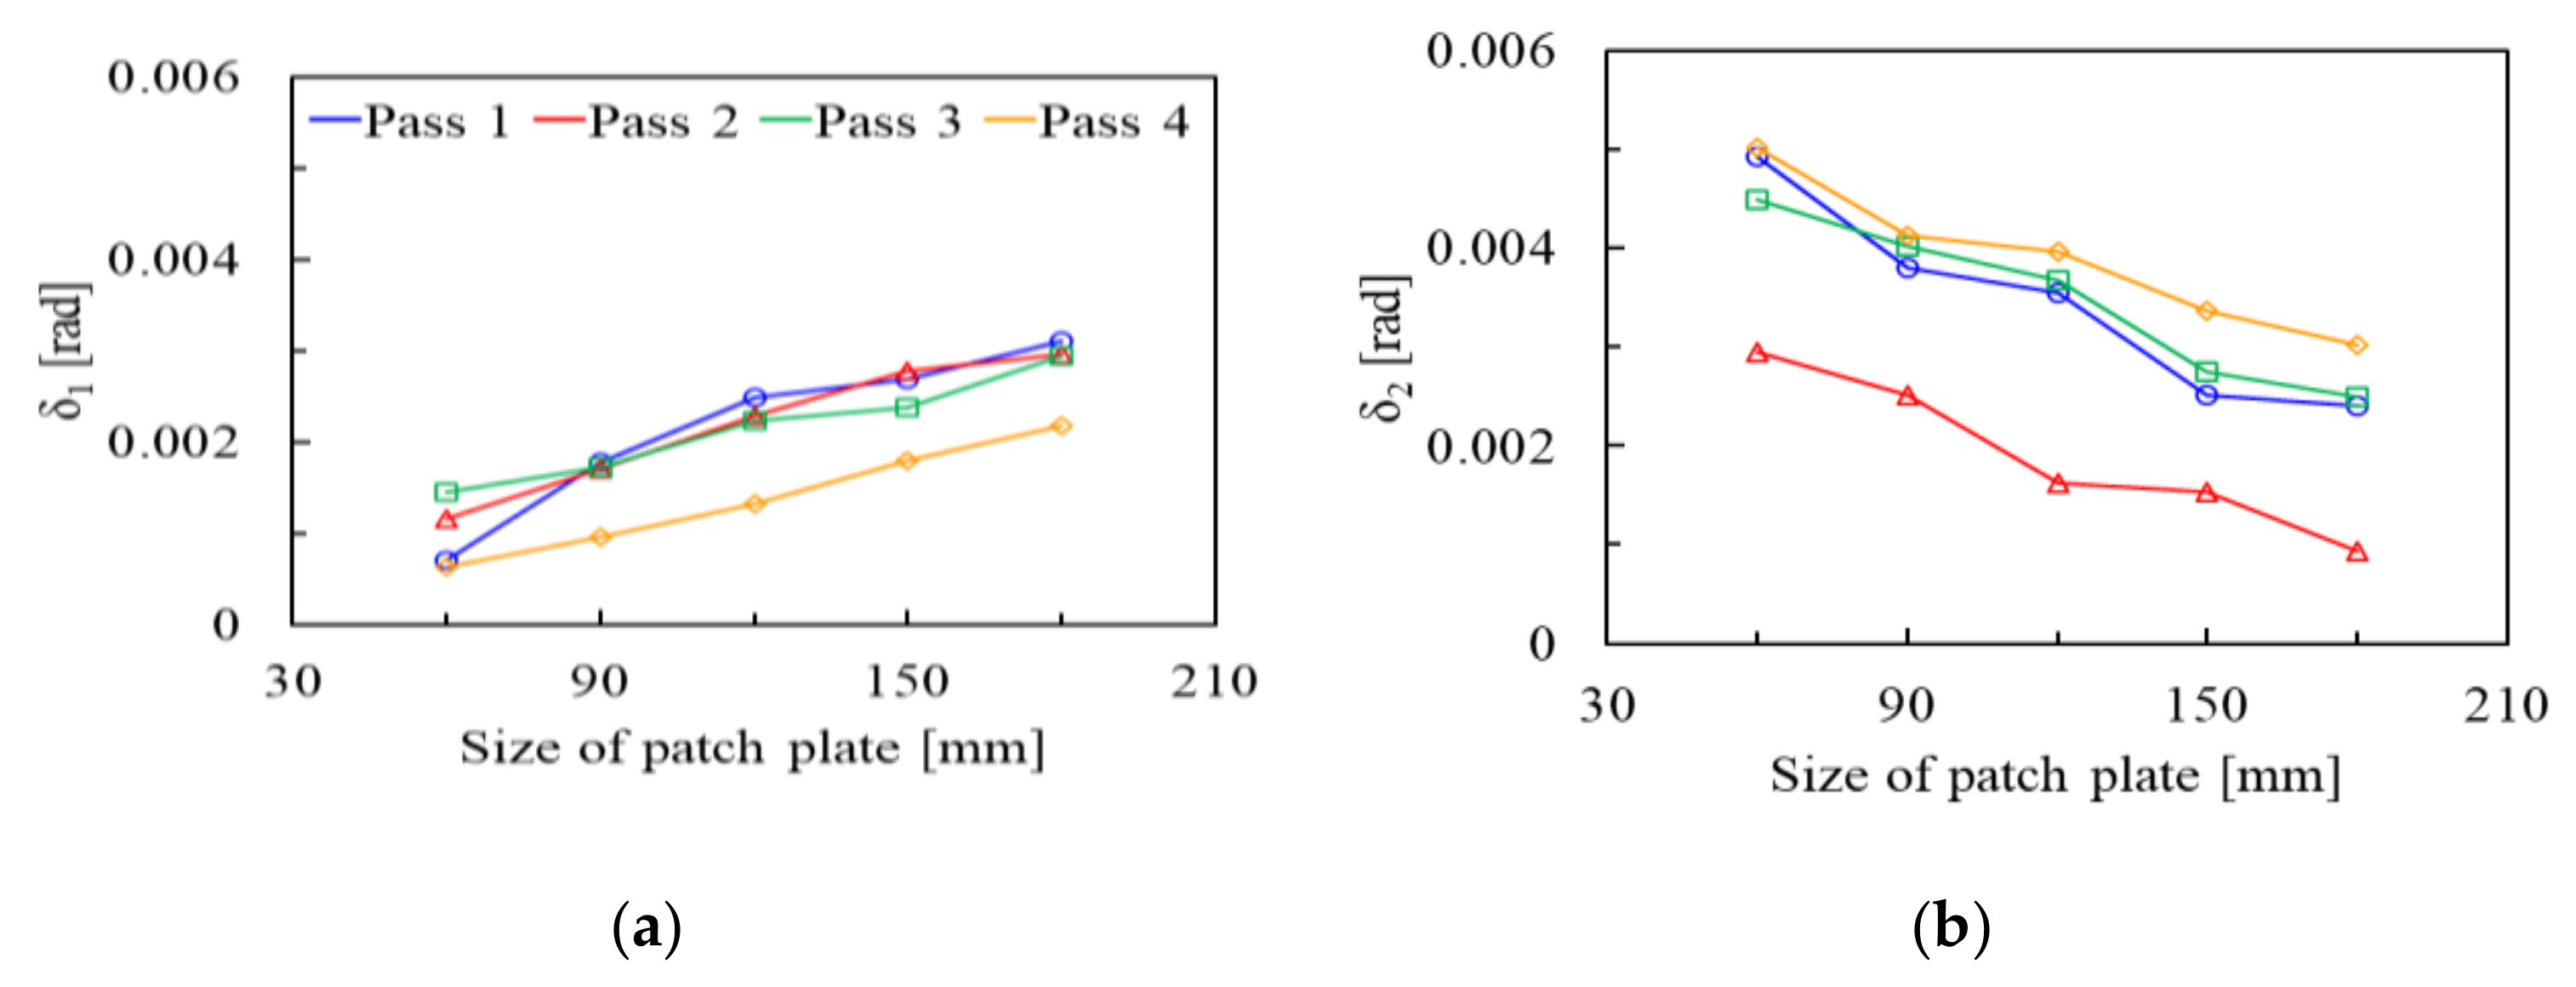
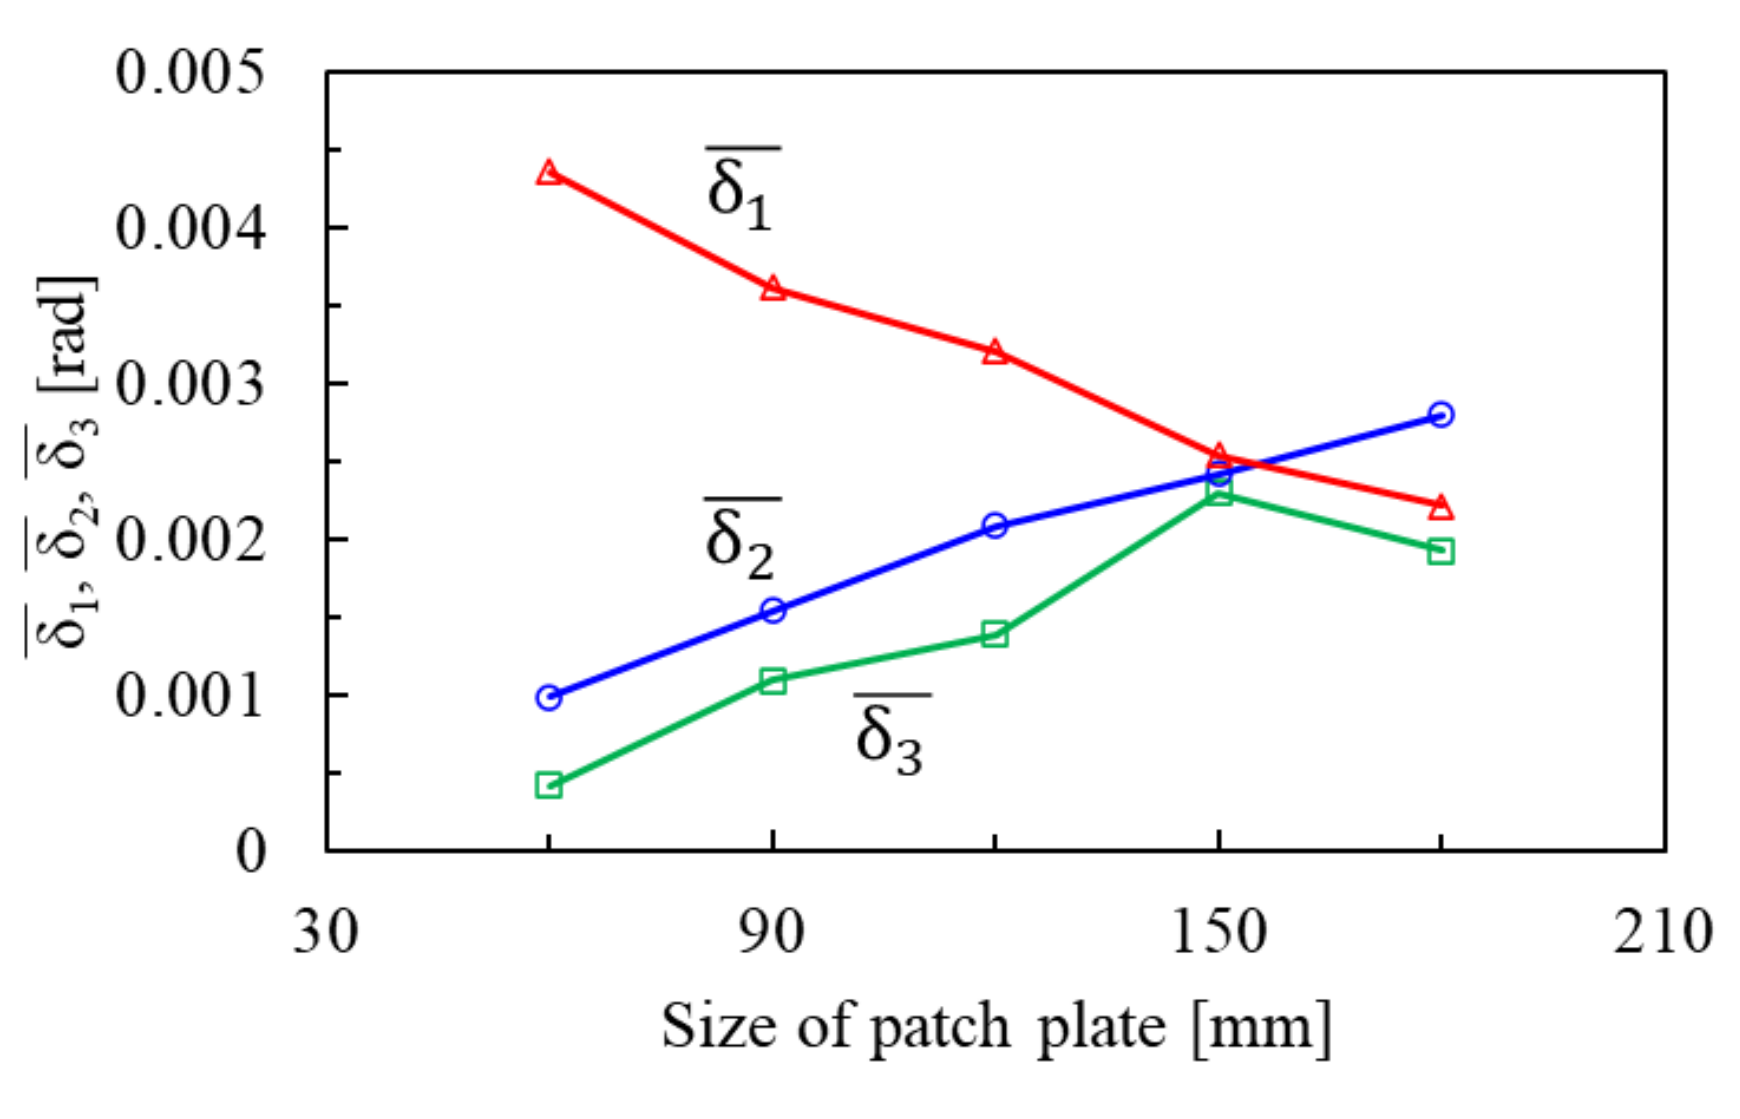
4.1. Out-of-Plane Deformation

Figure 6 shows the out-of-plane deformation obtained from the experiment and analysis. The light red area indicates the weld line. The light blue area indicates the area where the patch plates were joined. The out-of-plane deformation by the analysis was about 0.5 to 0.7 mm, and the maximum difference from the experimental value was about 0.2 mm. Despite the difference in the absolute values between the experimental and analytical results, the tendency of out-of-plane deformation could be reproduced. From the correspondence between the experimental and analytical values, the validity of the analytical model was confirmed.
Figure 6 represented that the base plate had two different modes of deformation. One was convex downward deformation in the region covered by the patch plate, and the other was linear deformation in the region not covered by the patch plate. As shown in Figure 7a, the former and latter modes were defined as bending deformation δ1 and angular deformation δ2, respectively.
First, the mechanism of the occurrence of δ1 is discussed. The out-of-plane deformation due to welding was caused by the temperature difference in the thickness direction of the plate. The temperature of the patch plate was higher than that of the base plate because the patch plate was smaller than the base plate. During the cooling process, the shrinkage of the patch plate was restrained by the base plate. Therefore, tensile stress acted on the patch plate and compressive stress acted on the base plate. In other words, the compressive force acting on the base plate generated a bending moment inside the base plate, resulting in a convex downward bending deformation.
Next, the mechanism of the occurrence of δ2 is discussed. A large temperature difference in the thickness direction on the weld line induced the difference in shrinkage in the thickness direction of the plate, which caused the angular deformation.
The deformation of the patch plate is also discussed. The reference planes were defined at three points among the four corners of the patch plate, and the relative displacement at the center of the patch plate was calculated as the out-of-plane deformation. Since the temperature was higher on the bottom surface than on the top surface of the patch plate, it was predicted that the deformation would be convex upward. However, the deformation was the opposite. In other words, the patch plate might be deformed convexly downward following the bending deformation of the base plate. Therefore, the deformation of the patch plate was determined as bending deformation, and δ3 was defined in Figure 7b.
The influence of the welding sequence on the out-of-plane deformation was examined. In order to investigate the trend of the out-of-plane deformation more clearly, models with patch plate sizes of 90 mm and 150 mm were created and analyzed under the same conditions. Figure 8 shows δ1 and δ2 for each weld line.
In all models, δ1 was the smallest at pass 4. The joint was not closed by the weld line in the welding of passes 1 to 3. However, it was constrained from all the edges in pass 4. In other words, the deformation of the joint was suppressed at pass 4 compared to the other weld lines. On the other hand, δ2 was the smallest at pass 2. After the welding of pass 1, the gap between the base plate and the patch plate increased due to the shrinkage of the weld bead. However, the gap gradually decreased in the welding of pass 2. During this process, a convex deformation occurred at a part of the edge of the patch plate corresponding to pass 2. The deformation by the other weld lines was uniformly convex downward, which might be due to the difference in the deformation mode of the weld lines.
Although the deformation of each weld line was different, the difference of δ1 was about 0.001 rad, and that of δ2 was about 0.002 rad in each pass. Therefore, the average values of the out-of-plane deformation are used as the index.
In Figure 9, the average value of δ1 in each weld line is represented by the red symbol, and the average value of δ2 is represented by the blue symbol. The average value of δ3 for the four different ways of taking the reference plane is represented by the green symbol. A positive correlation between the bending deformation ( δ 1 ¯ , δ 3 ¯ ) and the size of the patch plate is confirmed. A negative correlation between the angular deformation ( δ 2 ¯ ) and the size of the patch plate is confirmed.
As the length between the weld lines increases with the size of the patch plate, the degree of restraint by the weld lines decreases. This may cause a decrease in the resistance to bending. Therefore, δ 1 ¯ and δ 3 ¯ may increase as the patch plate becomes larger. However, δ 3 ¯ decreases in the range of the patch plate size from 150 mm to 180 mm. When the patch plate is small, δ 3 ¯ is generated, following δ 1 ¯ . However, the bending moment in the direction to suppress the bending deformation increases due to the tensile stress in the plate direction acting on the patch plate. Therefore, when the patch plate size is smaller than 150 mm, δ 1 ¯ and δ 3 ¯ are approximately equal. The difference between them gradually increases when the patch plate size is larger than 150 mm.
From the temperature history analysis, it was confirmed that the temperature difference between the top and bottom surfaces of the base plate decreased with the increase in the size of the base plate. The larger the patch plate becomes, the shorter the distance from the weld line to the edge of the base plate becomes. This might lead to the fact that the heat conduction toward the edge of the base plate tended to be uniform. Therefore, the difference in shrinkage between the upper and lower parts of the base plate decreased. As a result, δ 2 ¯ might become smaller.

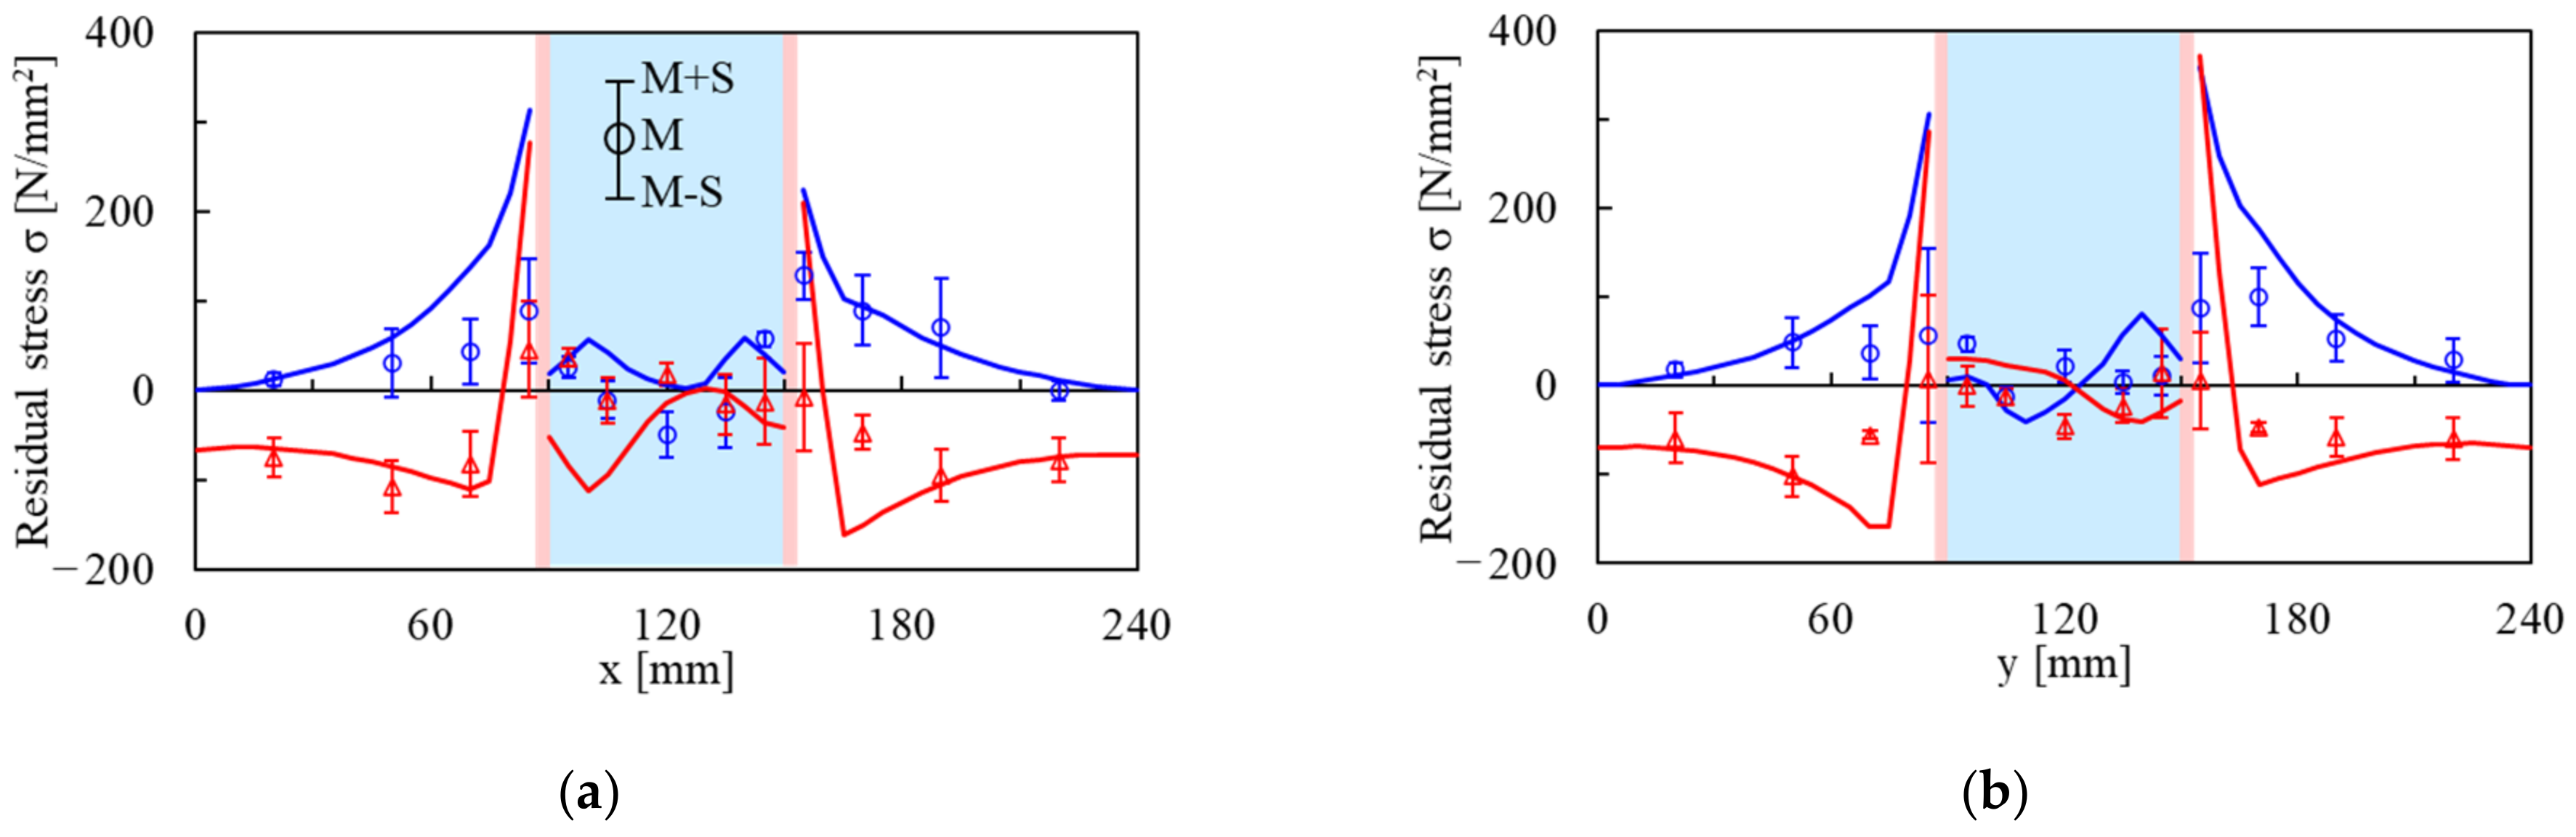
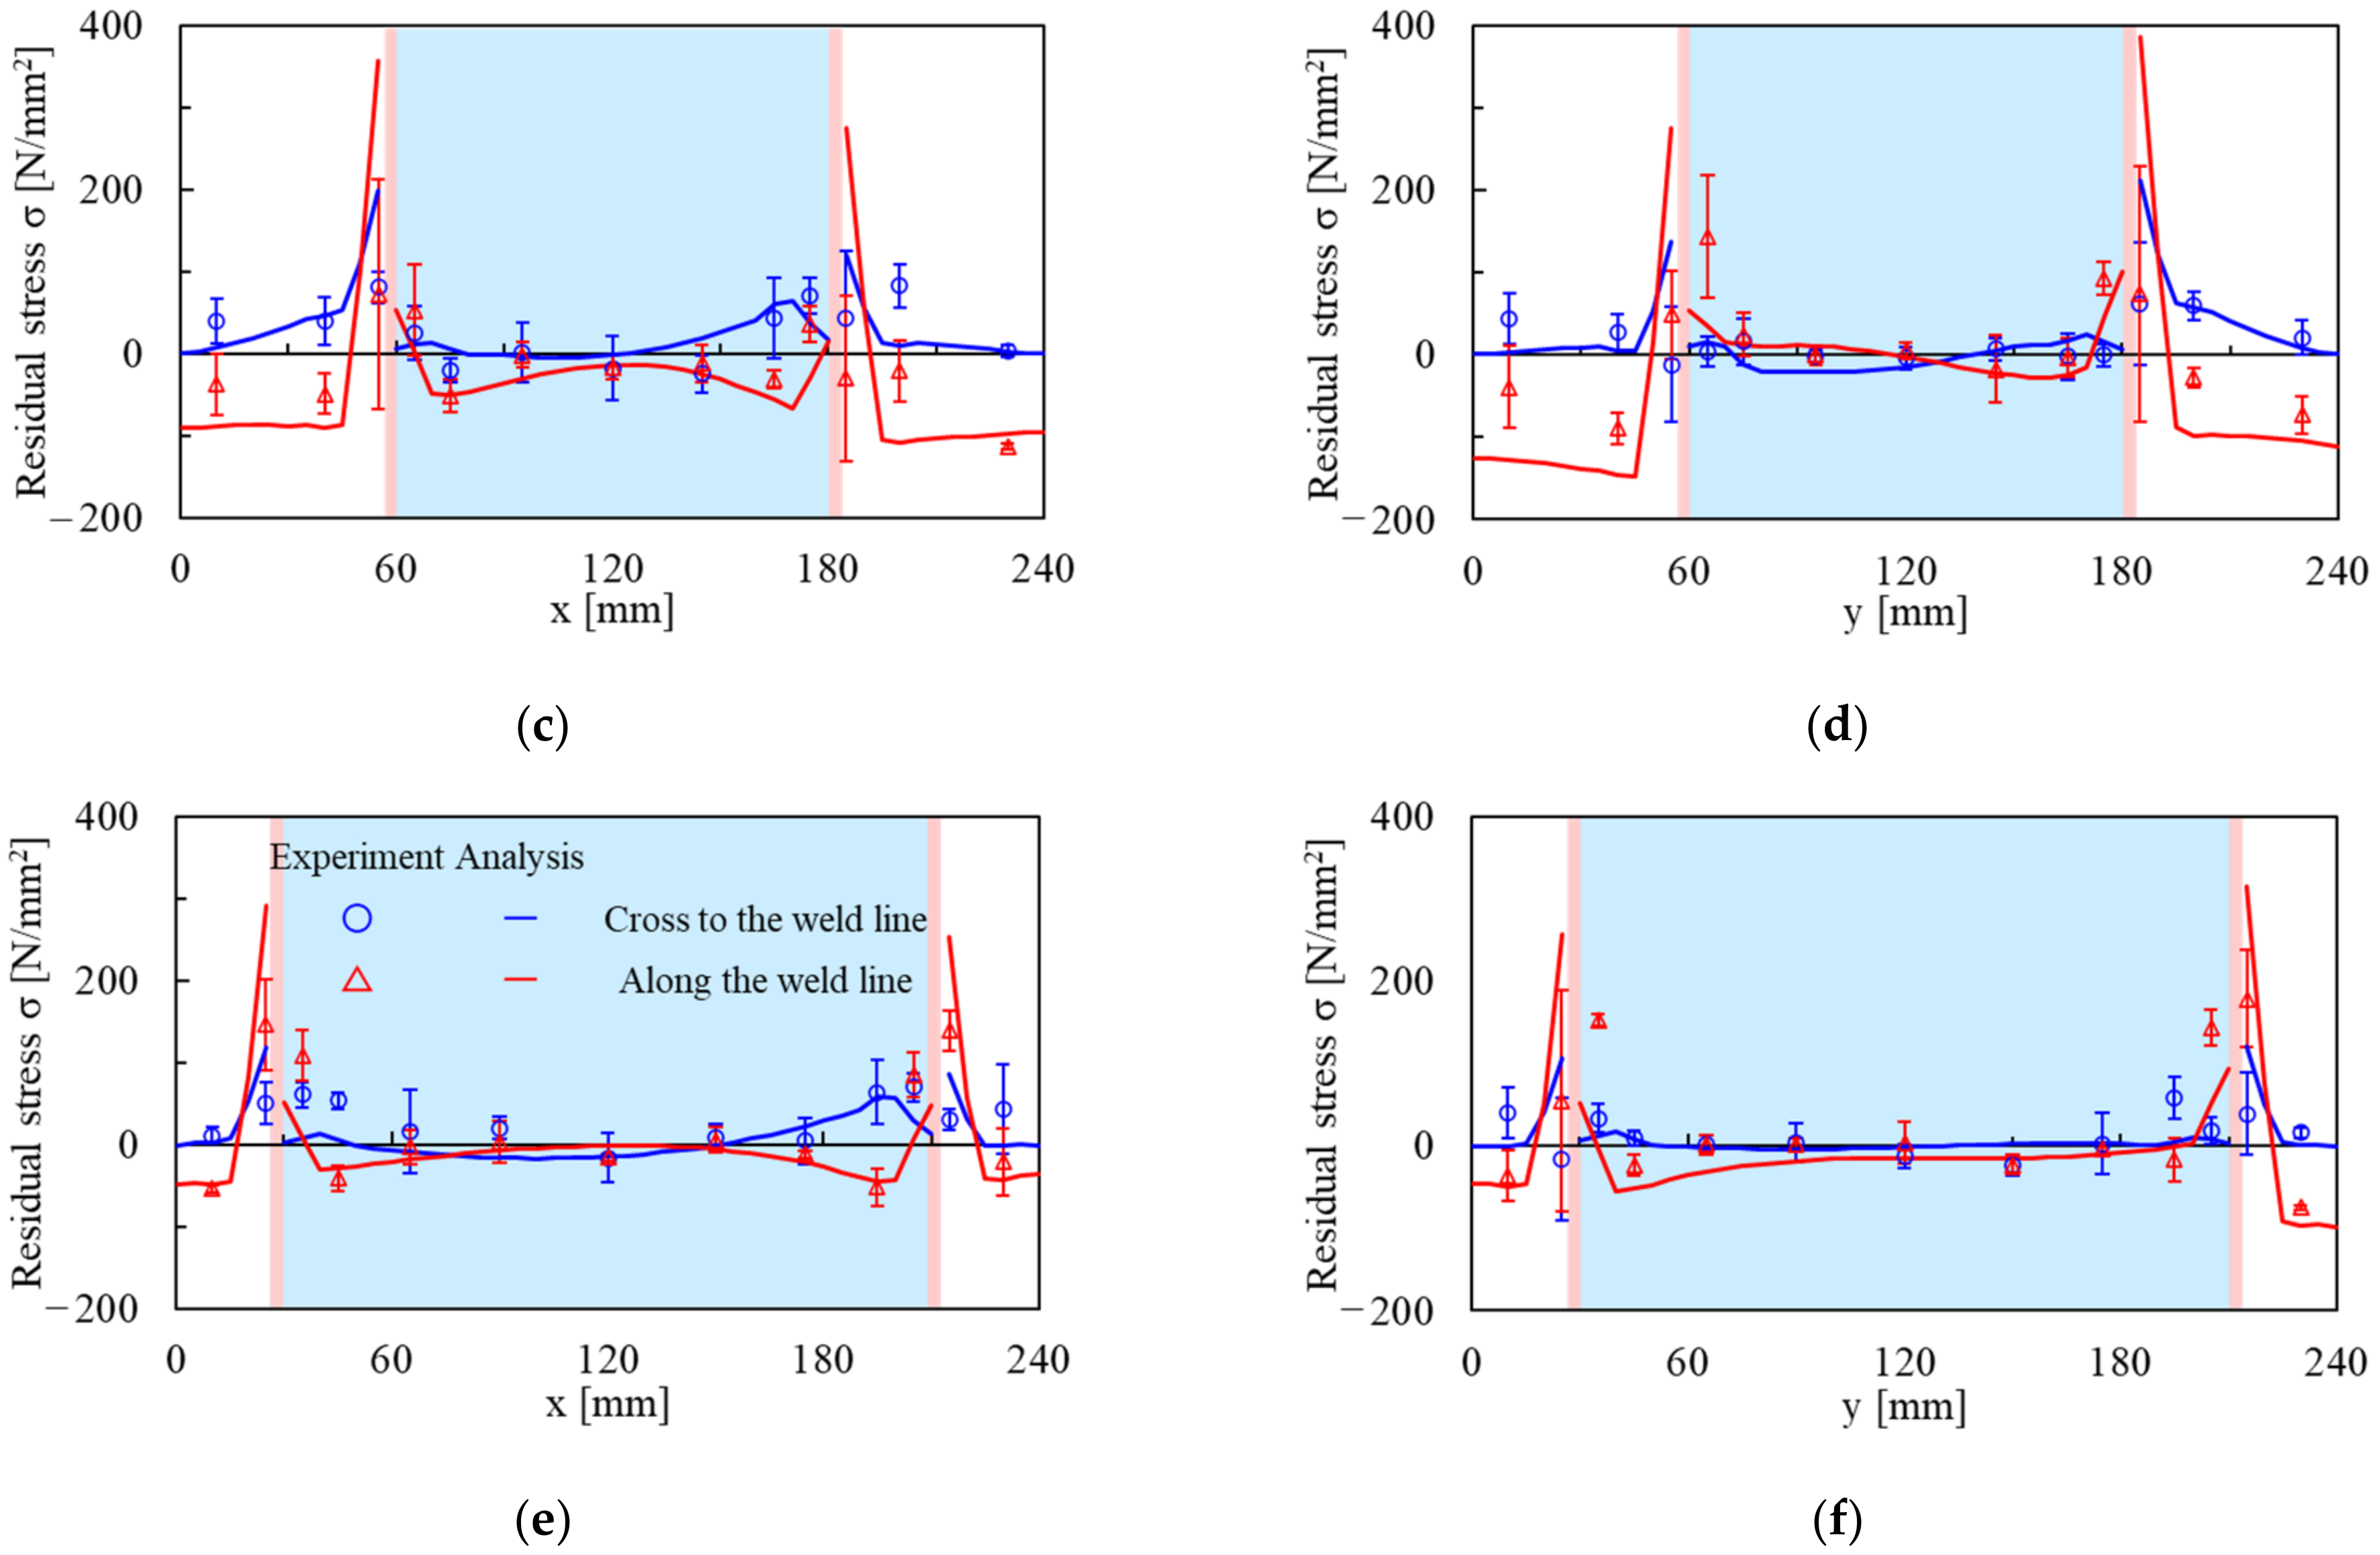
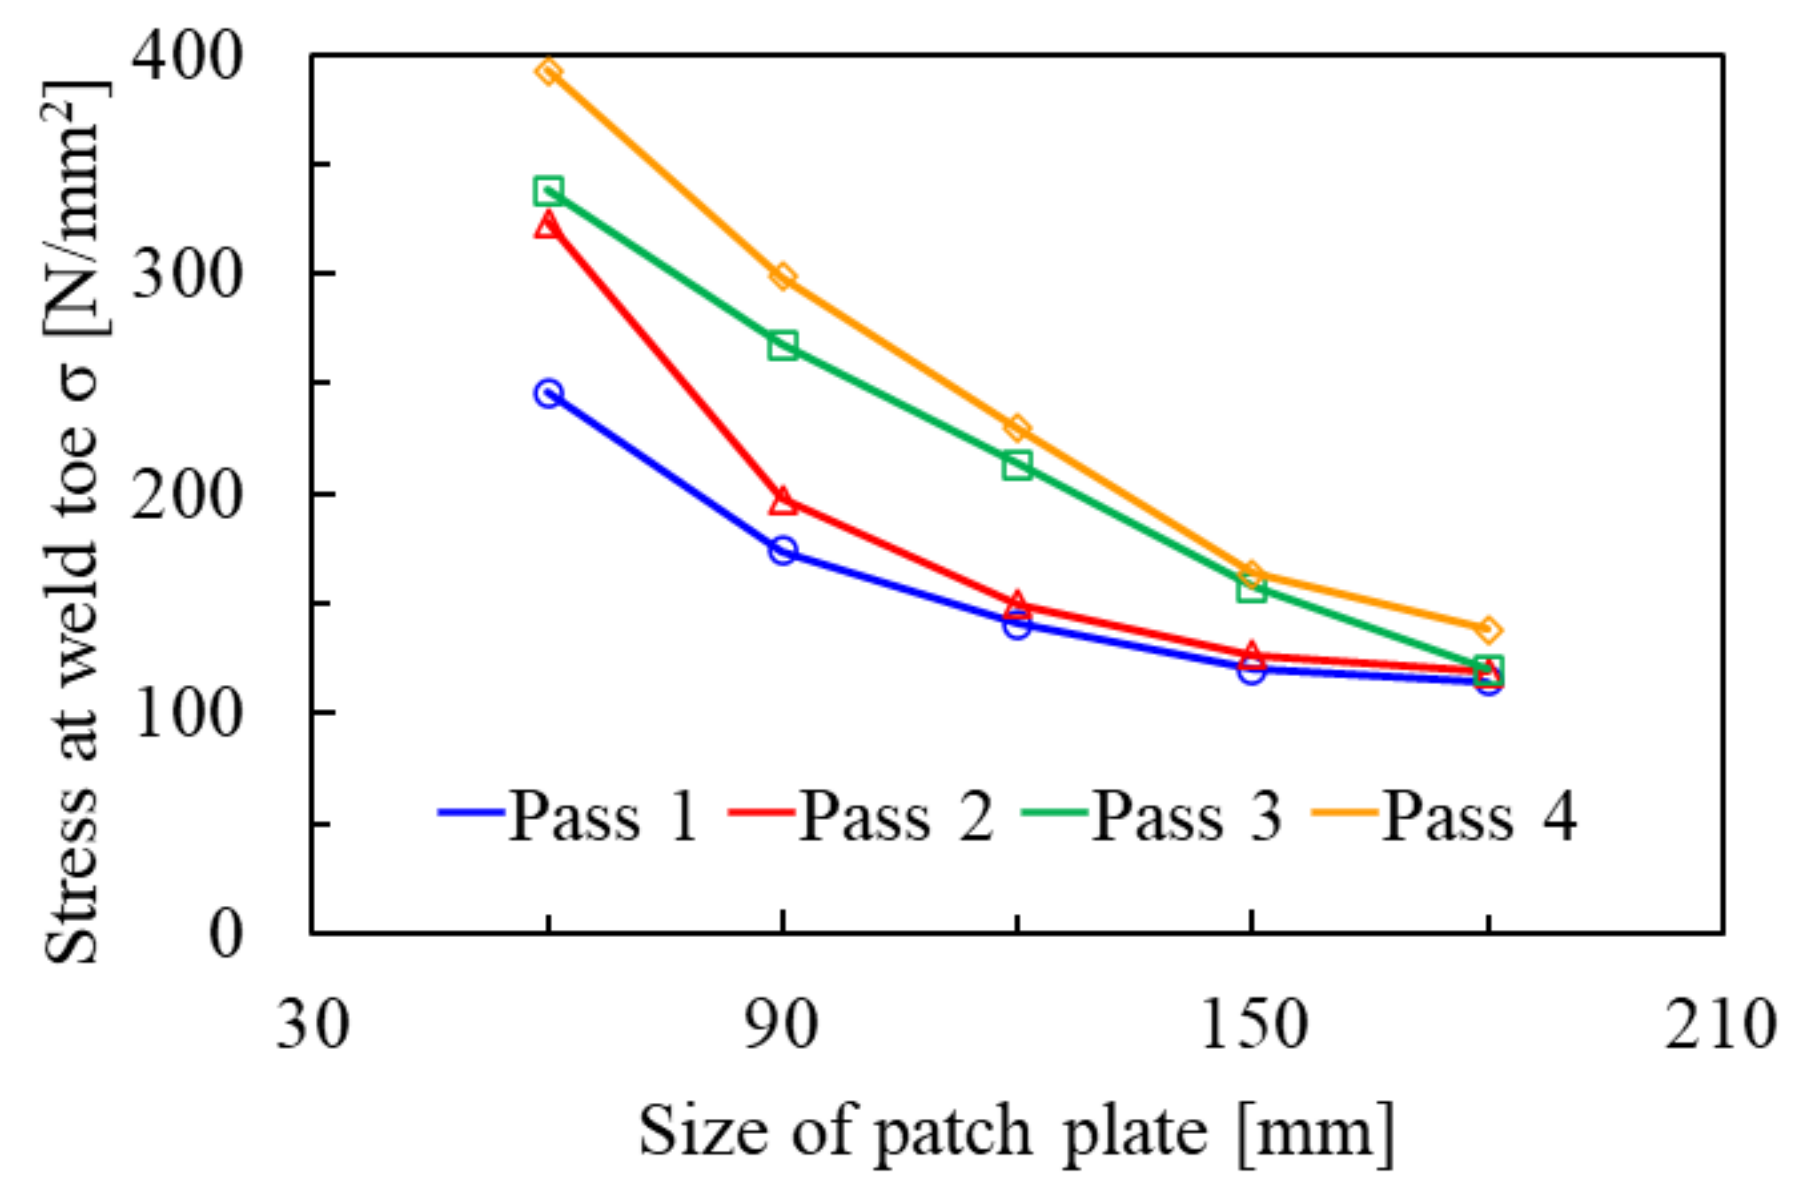
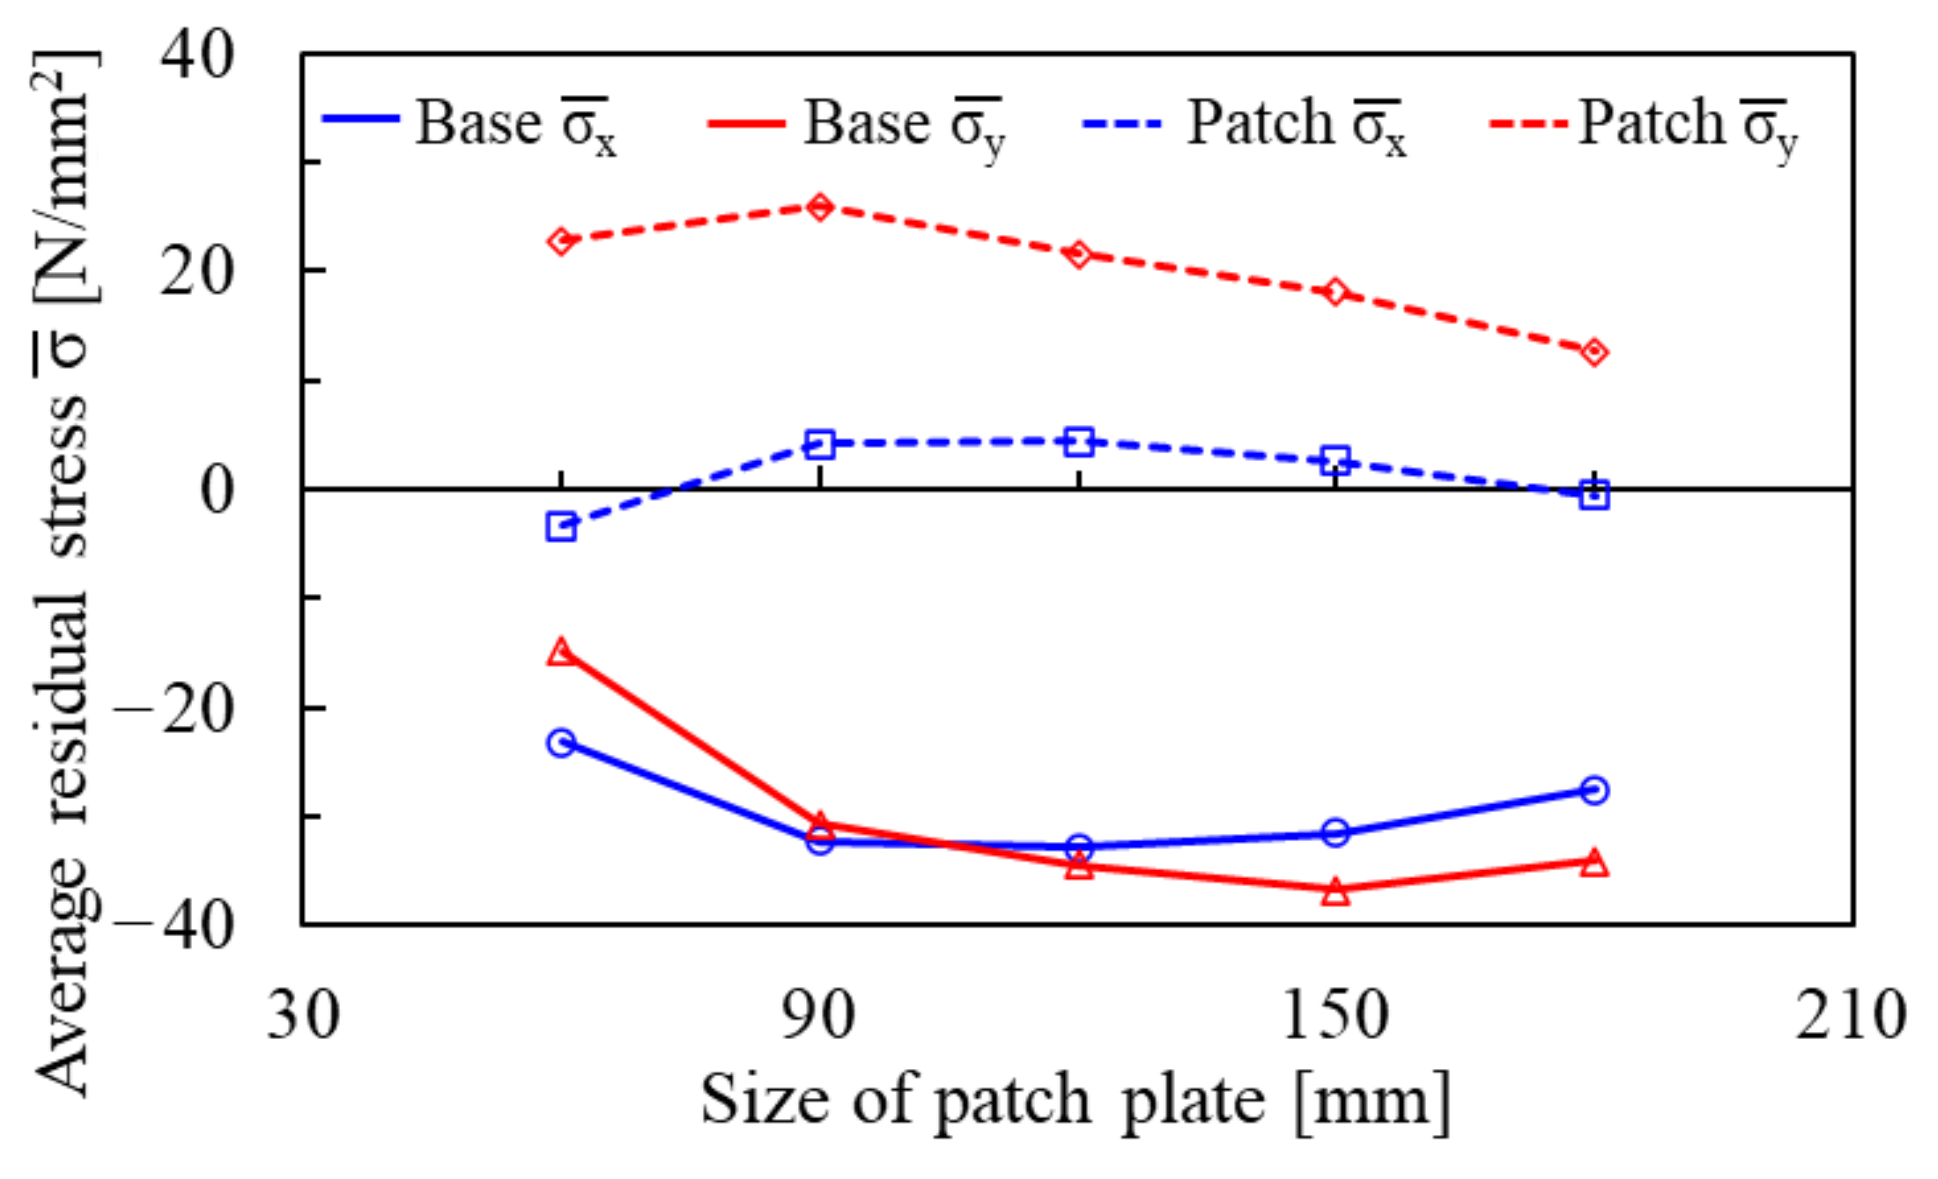
4.2. Residual Stress

Figure 10 shows the experimental and analytical results of the residual stresses in the x-axis and y-axis directions. The light red area indicates the weld line. The solid blue lines are the stress components across the weld line, and the solid red lines are the stress components along the weld line. The symbols are experimental values, respectively. The X-ray diffraction method could not be applied to the welded parts. The experimental values near the weld lines showed a large scatter. Although the experimental values and the analytical values did not show a correspondence in some points, such as the region near the weld line, the analysis could simulate the tendencies of the residual stresses.
These results show that large tensile stresses were generated near the weld toes. This was because the plastic strain was generated in the weld due to the local temperature rise, and the plastic strain was constrained by the surrounding area. The stress at the weld toes crossing to the weld line largely differed with the size of the patch plate because the degree of the restraint depended on the patch size.
The influence of the welding sequence on the residual stress is discussed. The stresses near the weld toes at the surface of the base plate are shown in Figure 11. For all models, the tensile residual stress at the final pass was the largest. It is known that there is a reciprocal relation between residual stress and deformation occurring in a joint. In this model, the weld line becomes longer as the weld progresses, and the restraint of the patch plate by the base plate increases. Therefore, the deformation is suppressed when the restraint is large. This results in large residual stresses.
The analytical values of the residual stresses in the area covered by the patch plate were almost constant in the x-axis and the y-axis directions for both the patch plate and the base plate. The average value at the center of the specimen (x = 120, y = 120) is selected as the index of the stress inside the joint. Figure 12 shows the averaged values of the stresses at the center of the patch plate and the base plate in each axial direction. The stresses in the base plate were almost uniform. However, the absolute values of the stresses in the y-axis direction were larger than those in the x-axis direction for the patch plate. In addition, although tensile residual stresses should be generated in the patch plate from the process of generating bending deformation, the stresses in the x-axis direction were of small compression for the patch plates of 60 mm and 180 mm. The compressive stress might be generated as a reaction force to the tensile stress generated by the longitudinal shrinkage of the weld line in the final pass.
No clear relationship between the residual stress in the area covered by the patch plate and the size of the patch plate was found. This might be because the influence of the thickness increased when the patch plate was small, while the residual stresses decreased with the relaxation of the restraints when the patch plate was large.

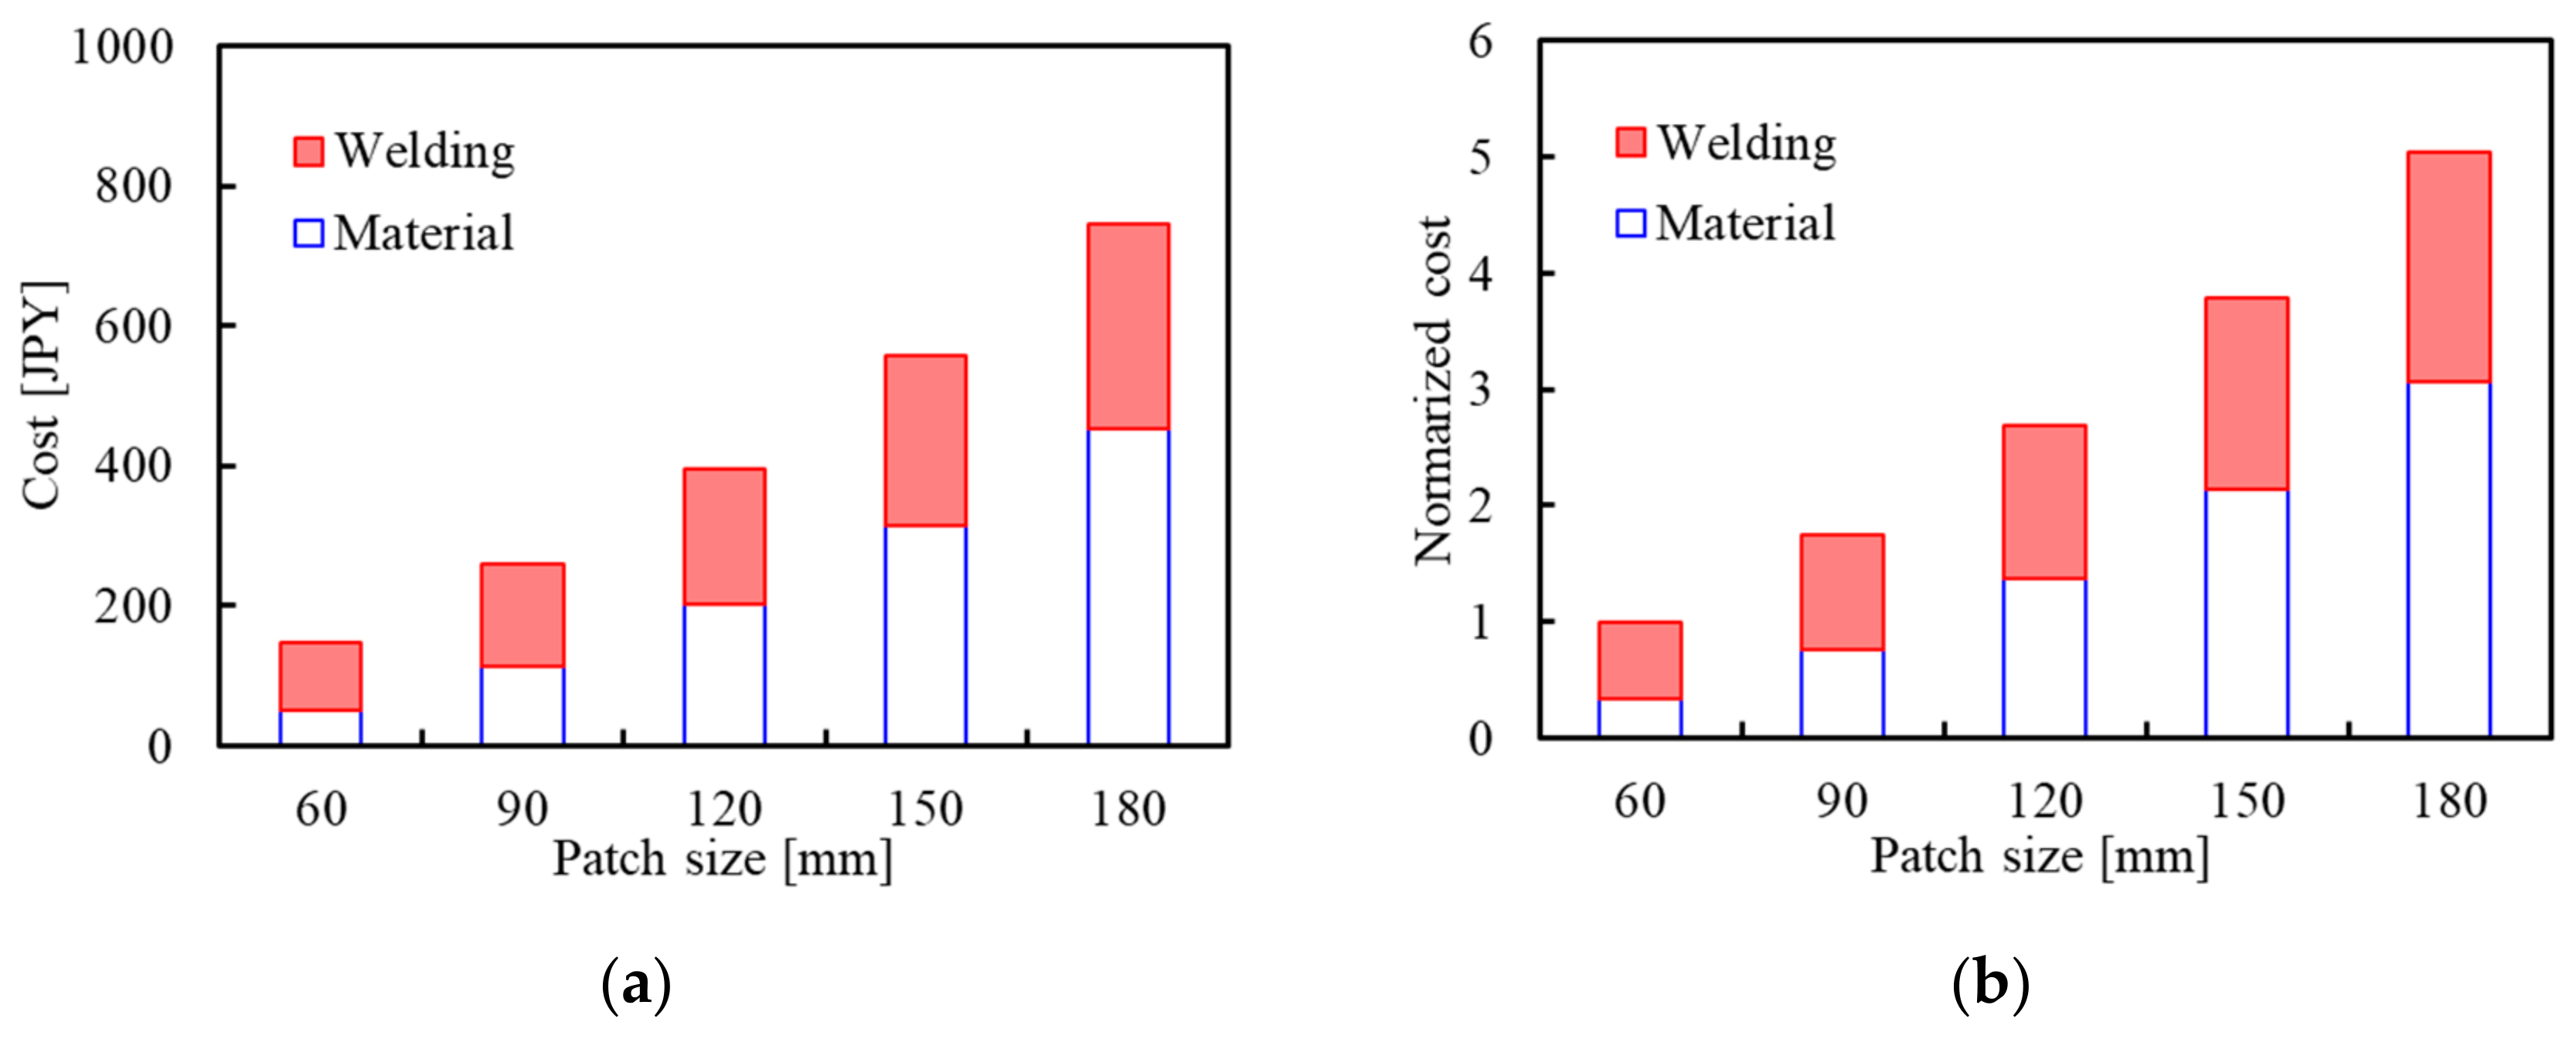
5. Cost Estimation of Patch Welding

The cost for the patch welding includes the costs of the material and welding work. The material costs of general carbon steel specified by the Construction Research Institute in Japan are shown in Table 4. The grades SM400A and SM490A are the general carbon steel for welded structures, the tensile strengths of which are over 400 N/mm2 or 490 N/mm2. The grade SM490YA has a higher yield strength than SM490A. The yield strength shown in the table is assumed as the thickness is less than 16 mm. The material prices are estimated by considering the grade and the thickness of 12 mm. The extra costs for the transportation and primer are not considered. As of May 2022, EUR 1 is approximately JPY 137.5.
The cost of general gas metal arc welding is calculated by Equation (2) [19].
CTOTAL = CPS + CCM + CLB
where CPS is the power supply cost, CCM is the consumable cost, and CLB is the labor cost.
The power supply cost (CPS) includes the costs of depreciation, maintenance, consumable goods, electric power, cooling water, etc. The consumable cost (CCM) includes the costs of the electrode, wire, flux, gas, backing plate, etc.
Table 5 shows examples of welding costs in Japan. The welding conditions for the cost estimation are gas metal arc welding by the shield gas of CO2 and fillet welding with a leg length of 6 mm. Welding voltage, current, and speed are typical values for them.
Figure 13 shows the combinations of the material costs and the welding costs for the patch sizes from 60 mm to 180 mm. The material costs are calculated by the weight of the patch plate with a steel density of 7.85 g/cm3. The steel grade SM400A is assumed in this estimation. Plate cutting and surface preparation are not included in the cost. The welding cost does not include the pre-welding and post-welding processes such as tack welding, repair welding, and disposal. Although the welding cost is proportional to the welding length, the material cost is not proportional to the welding lengths. The ratio of the material cost to the welding cost increases with the patch size. The larger patch size is preferable to decrease the residual welding stress, as shown in Section 4. The cost of patch welding becomes higher and higher with the patch size. The patch size should be determined by considering the mechanical influences of welding and the economic viewpoints of the welding process.

6. Conclusions

A series of experiments and numerical analyses were conducted to investigate the features of deformation and residual stress generated by different sizes of patch welding. The cost of the patch welding process was roughly estimated. The main results that were obtained are as follows.
The welding deformations generated between the patch plate and the base plate were defined as bending deformation and angular deformation based on their generation mechanism. The bending deformation increased and the angular deformation decreased as the size of the plate increased, respectively.
The residual stress at the weld toe of the final pass was the highest of all the weld lines, and the difference and the absolute value of the residual stress for each weld line became smaller as the size of the patch plate was increased. Compressive stress was uniformly generated under the patch plate at the base plate, and the residual stresses were not so large.
The cost for patch welding was estimated by combining the material cost and the welding work cost. The patch welding cost was not in proportion to the weld length. The patch size should be determined by considering the mechanical influences of welding and the economic viewpoints of the welding process.

Author Contributions

Experiment, T.H.; analysis, T.H.; methodology, T.H. and M.H.; software, T.H.; validation, T.H. and M.H.; investigation, T.H., M.H. and K.J.; data curation, T.H.; writing—original draft preparation, T.H. and M.H.; writing—review and editing, M.H.; visualization, T.H.; supervision, K.J.; project administration, M.H. All authors have read and agreed to the published version of the manuscript.

Funding

This research received no external funding.

Institutional Review Board Statement

Not applicable.

Informed Consent Statement

Not applicable.

Data Availability Statement

Not applicable.

Acknowledgments

Tomonori Nakahara, belonging to Japan Bridge Co., Ltd., provided the information related to the welding cost. The authors greatly appreciated his support. The research was partially supported by the Hungarian National Research, Development, and Innovation Office under the project number K 134358.

Conflicts of Interest

The authors declare no conflict of interest.

References

  1. The American Society of Mechanical Engineers. Repair of Pressure Equipment and Piping; ASME PCC-2-2018; American Society of Mechanical Engineers: New York, NY, USA, 2018. [Google Scholar]
  2. Lant, T.; Robinson, D.L.; Spafford, B.; Storesund, J. Review of weld repair procedures for low alloy steels designed to minimise the risk of future cracking. Int. J. Press. Vessel. Pip. 2001, 78, 813–818. [Google Scholar] [CrossRef]
  3. Roland, P.-J.; Dominic, P. Repairing Internal Corrosion Defects in Pipelines—A Case Study. In Proceedings of the 4th International Pipeline Rehabilitation and Maintenance Conference, Prague, Czech Republic, September 2000; pp. 1–25. [Google Scholar]
  4. Deng, D.; Murakawa, H. Prediction of welding distortion and residual stress in a thin plate butt-welded joint. Comput. Mater. Sci. 2008, 43, 353–365. [Google Scholar] [CrossRef]
  5. Perić, M.; Tonković, Z.; Rodić, A.; Surjak, M.; Garašić, I.; Boras, I.; Švaić, S. Numerical analysis and experimental investigation of welding residual stresses and distortions in a T-joint fillet weld. Mater. Des. 2014, 53, 1052–1063. [Google Scholar] [CrossRef]
  6. James, M.N. Residual stress influences on structural reliability. Eng. Fail. Anal. 2011, 18, 1909–1920. [Google Scholar] [CrossRef]
  7. Dong, P. On repair weld residual stresses and significance to structural integrity. Weld. World 2018, 62, 351–362. [Google Scholar] [CrossRef]
  8. Teng, T.-L.; Chang, P.-H.; Ko, H.-C. Finite element analysis of circular patch welds. Int. J. Press. Vessel. Pip. 2000, 77, 643–650. [Google Scholar] [CrossRef]
  9. Fazzini, P.G.; Otegui, J.L. Influence of old rectangular repair patches on the burst pressure of a gas pipeline. Int. J. Press. Vessel. Pip. 2006, 83, 27–34. [Google Scholar] [CrossRef]
  10. Taraphdar, P.K.; Kumar, R.; Pandey, C.; Mahapatra, M.M. Significance of finite element models and solid-state phase transformation on the evaluation of weld induced residual stresses. Met. Mater. Int. 2021, 27, 3478–3492. [Google Scholar] [CrossRef]
  11. Pandey, C.; Mahapatra, M.M.; Kumar, P. A comparative study of transverse shrinkage stresses and residual stresses in P91 welded pipe including plasticity error. Arch. Civ. Mech. Eng. 2018, 18, 1000–1011. [Google Scholar] [CrossRef]
  12. JIS G 3106; Rolled Steels for Welded Structures. Japanese Standards Association: Tokyo, Japan, 2015.
  13. JIS G 3312; Solid Wires for MAG and MIG Welding of Mild Steel, High Strength Steel and Low Temperature Service Steel. Japanese Standards Association: Tokyo, Japan, 2009.
  14. Joseph, A.; Palanichamy, P.; Rai, S.K.; Jayakumar, T.; Raj, B. Non-destructibe measurement of residual stresses in carbon steel weld joints. Sci. Technol. Weld. Join. 1998, 3, 267–271. [Google Scholar] [CrossRef]
  15. Nakagawa, H.; Suzuki, H. Ultimate temperatures of steel beams subjected to fire. Steel Constr. Eng. 1999, 6, 57–65. (In Japanese) [Google Scholar]
  16. Kim, Y.-C.; Lee, J.-Y.; Inose, K. Dominant factors for high accurate prediction of distortion and residual stress generated by fillet welding. Int. J. Steel Struct. 2007, 7, 93–100. [Google Scholar]
  17. Pépe, N.; Egerland, S.; Colegrove, P.A.; Yapp, D.; Leonhartsberger, A.; Scotti, A. Measuring the process efficiency of controlled gas metal arc welding processes. Sci. Technol. Weld. Join. 2011, 16, 412–417. [Google Scholar] [CrossRef] [Green Version]
  18. Joseph, A.; Harwig, D.; Farson, D.F.; Richardson, R. Measurement and calculation of arc power and heat transfer efficiency in pulsed gas metal arc welding. Sci. Technol. Weld. Join. 2003, 8, 400–406. [Google Scholar] [CrossRef]
  19. Harasawa, H. Planning and management of welding procedure. J. Jpn. Weld. Soc. 2008, 77, 582–594. (In Japanese) [Google Scholar] [CrossRef] [Green Version]
Figure 1. Shape and dimension of the specimen; (a) b60, (b) b120, and (c) b180.
Processes 10 01312 g001
Figure 2. Measurement positions of (a) temperature, (b) out-of-plane deformation, and (c) residual stress.
Processes 10 01312 g002
Figure 3. Analysis model.
Processes 10 01312 g003
Figure 4. Temperature-dependent material properties and stress–strain relationship; (a) mechanical properties, (b) physical constants, (c) stress–strain curves of SM400B, and (d) stress–strain curves of YGW12 [15,16].
Processes 10 01312 g004aProcesses 10 01312 g004b
Figure 5. Comparison of the experimental and analytical results of temperature history; (a) b60, (b) b120, and (c) b180.
Processes 10 01312 g005
Figure 6. Experimental and analytical results of the out-of-plane deformation; (a) b60, (b) b120, and (c) b180.
Processes 10 01312 g006
Figure 7. Deformation mode of the (a) base plate and (b) patch plate.
Processes 10 01312 g007
Figure 8. Out-of-plane deformations of (a) δ1 and (b) δ2 by each welding pass.
Processes 10 01312 g008
Figure 9. Influence of joint size on out-of-plane deformation.
Processes 10 01312 g009
Figure 10. Experimental and analytical results of residual stress; (a) b60 in the x-direction, (b) b60 in the y-direction, (c) b120 in the x-direction, (d) b120 in the y-direction, (e) b180 in the x-direction, and (f) b180 in the y-direction.
Processes 10 01312 g010aProcesses 10 01312 g010b
Figure 11. Influence of the welding order on the residual stress at the weld toe.
Processes 10 01312 g011
Figure 12. Average residual stresses in the center of the model.
Processes 10 01312 g012
Figure 13. Combinations of material cost and welding cost; (a) cost in JPY and (b) normalized cost of patch sizes from 60 mm to 180 mm by the cost of a patch size of 60 mm.
Processes 10 01312 g013
Table 1. Mechanical properties of SM400B and YGW12 [12,13].
SM400BYGW12
Yield Stress
[N/mm2]
Tensile Strength
[N/mm2]
Elongation
[%]
Yield Stress
[N/mm2]
Tensile Strength
[N/mm2]
Elongation
[%]
3064513046054028
Table 2. Welding conditions (gas metal arc welding).
Max.Min.Average
Weld voltage [V]242223
Weld current [A]175140157
Weld speed [mm/s]6.884.925.75
Table 3. Analysis conditions.
Analysis softwareAbaqus Ver. 6.14
Analysis typeTemperature-displacement coupling
Element type8-node reduced integral solid element
Mechanical boundary conditionsOnly rigid body displacement is constrained
Displacement constraint
Node 1: y- and z-directions
Node 2: x-, y-, and z-directions
Node 3: z-direction
Thermal boundary conditionsSurface heat transfer
Table 4. Material prices of several types of steel in Japan.
Yield Strength
[N/mm2]
Tensile Strength
[N/mm2]
Price in 2022
[JPY/t]
SM400AOver 245400–510148,500
SM490AOver 325490–610157,000
SM490YAOver 365490–610158,000
Table 5. Example of welding cost in Japan.
Welding Cost [JPY/m]
Power Supply
CPS
Consumable
CCM
Labor
CLB
Total
CTOTAL
1785303405
Publisher’s Note: MDPI stays neutral with regard to jurisdictional claims in published maps and institutional affiliations.

