
Optimization of Sour Water Stripping Unit Using Artificial Neural Network–Particle Swarm Optimization Algorithm

College of Chemistry & Chemical Engineering, Xi’an Shiyou University, Xi’an 710065, China
*
Author to whom correspondence should be addressed.
Processes 2022, 10(8), 1431; https://0-doi-org.brum.beds.ac.uk/10.3390/pr10081431
Submission received: 17 June 2022
/
Revised: 15 July 2022
/
Accepted: 19 July 2022
/
Published: 22 July 2022
(This article belongs to the Special Issue Chemical Engineering and Technology)
Abstract
:Sour water stripping can treat the sour water produced by crude oil processing, which has the effect of environmental protection, energy saving and emission reduction. This paper aims to reduce energy consumption of the unit by strengthening process parameter optimization. Firstly, the basic model is established by utilizing Aspen Plus, and the optimal model is determined by comparative analysis of back propagation neural network (BPNN), radial basis function neural network (RBFNN) and generalized regression neural network (GRNN) models. Then, the sensitivity analysis of Sobol is used to select the operating variables that have a significant influence on the energy consumption of the sour water stripping system. Finally, the particle swarm optimization (PSO) algorithm is used to optimize the operating conditions of the sour water stripping unit. The results show that the RBFNN model is more accurate than other models. Its network structure is 5-66-1, and the expected value has an approximately linear relationship with the output value. Through sensitivity analysis, it is found that each operating parameter has an impact on the sour water stripping process, which needs to be optimized by the PSO algorithm. After 210 iterations of the PSO algorithm, the optimal system energy consumption is obtained. In addition, the cold/hot feed ratio, sideline production position, tower bottom pressure, hot feed temperature, and cold feed temperature are 0.117, 18, 436 kPa, 146 °C, and 35 °C, respectively; the system energy consumption is 5.918 MW. Compared with value of 7.128 MW before optimization, the energy consumption of the system is greatly reduced by 16.97%, which shows that the energy-saving effect is very significant.
1. Introduction
In the process of petroleum refining, the aqueous solution containing volatile weak electrolytes, such as hydrogen sulfide, ammonia, carbon dioxide, and pollutants, such as phenolic cyanide and oil discharged from downstream units, are collectively referred to as sour water [1,2]. The main sources of sour water in the refineries are atmospheric distillation columns, vacuum distillation towers, delayed cokers, hydro-desulfurizers, fluidized catalytic cracking (FCC) units, amine regeneration units, the Claus process, and visbreaker fractionators [3].
Environmental issues have always been a hot topic. As the requirements of environmental regulations continue to increase, so does the treatment of sour water in refineries. At present, after the refining stage, the resulting acidic water is fed into a sour water treatment unit (SWTU) to reduce the contaminant levels. The removal process is usually carried out during the water stripping process, which is an integral part of the refinery [3,4]. The process is used to remove acid components from raw water through a stripping tower to obtain quality purified water. Sour water stripping technology mainly includes several different processes, including single column pressurized stripping with side-draw, single column low temperature stripping and double column pressurized stripping [5,6,7]. Compared with the latter two, single column pressurized stripping with the side-draw process has the advantages of being a simple process, with low steam consumption, fewer equipment and less occupation area, and the quality of liquid ammonia as a by-product can reach the national standard of qualified products; therefore, the process has received more and more attention and favor [8,9,10,11,12]. A sour water stripping unit is an important unit for oil refineries to treat sour water, and optimizing the unit can not only protect the environment, which have certain social benefits, but also save energy and reduce enterprise cost. Therefore, it is necessary to optimize the sour water stripping unit.
As the core equipment of the sour water stripping process, the energy consumption of the sour water stripping column mainly focuses on cooling the cold feed and on heating the steam at the bottom of the column. In recent years, in order to effectively reduce the energy consumption of the unit, many scholars have carried out a large number of relevant studies and achieved positive results. Gai et al. [13] proposed a new wastewater treatment process combined with a bottom flashing mechanical vapor recompression heat pump in order to reduce energy consumption in the process of sour water stripping. Umer et al. [14] and Kazemi et al. [4] proposed a design that employs mechanical work using a compressor instead of hot and cold utilities to reduce the energy consumption of the conventional sour water stripping process. That is, steam recompression that uses the mechanical work carried out by the compressor to heat the flow at the top of the tower and transport it to the bottom of the tower. This will increase the temperature gradient between the top and bottom products, resulting in an efficient heat transfer between them. Thus, heat to the column is provided by compressor work rather than using hot and cold utilities. However, in actual production, the above scheme can only be realized by replacing or transforming the equipment, which will incur extra costs and take a long time to replace or transform the equipment. Therefore, it is a better choice to optimize the operating parameters of the unit. Yu et al. [15] simulated the process of the sour water stripping unit and discussed the influence of the ratio of hot and cold feed to hot feed temperature and sideline extraction position on reboiler load and product quality. Tu et al. [16] focused on the problems of insufficient heat recovery in the energy recovery link and excessive temperature difference in heat transfer of the heat exchanger, and carried out energy-saving optimization of the single column pressurized side-line extraction stripping process. These only analyze the influence of each parameter on the thermal load of the unit, without giving specific optimization results.
Aimed at the above problems, this paper proposes to reduce energy consumption by optimizing operation parameters; however, the influence of these parameters on energy consumption is nonlinear and has a certain influence on each other, which cannot be ignored. Therefore, in order to accurately predict the actual energy consumption of a sour water stripping unit under different operation parameters, and to improve and optimize the performance of the existing system more specifically, an artificial neural network integrating an optimization algorithm is used to solve the above problems. On the one hand, the artificial neural network (ANN) is a black-box mathematical model with good nonlinear mapping ability that can respond to the complex relationship between target and influencing factors. On the other hand, with the rapid development of computer technology, genetic algorithm (GA), particle swarm optimization (PSO), ant colony algorithms, and other intelligent optimization algorithms (OA), the focus of research is to combine artificial neural networks, intelligent algorithms, and mathematical modeling to optimize operating variables, which is a kind of new research method in the field of the chemical industry [17]. Alimoradi H et al. [18]. proposed a combination of ANN models and PSO algorithm to optimize the performance of the cooling tower to improve the efficiency of the cooling tower. Wang et al. [19]. combined a back propagation neural network (BPNN) with GA to optimize the low temperature charge performance of a lithium-ion battery. Ling et al. [20]. used BPNN-GA to predict the corrosion rate of pipelines in oil pipelines. Farzaneh Rezaei et al. [21]. integrated a radial basis function neural network (RBFNN) with evolutionary algorithms to predict gas viscosity at high pressure-high temperature conditions.
Additionally, Ding et al. [22] used GA and PSO algorithms to optimize the kinetic parameters of the biomass pyrolysis reaction, and it was found that the PSO algorithm had higher accuracy than the GA algorithm, and better optimization abilities with the improvement of 30% than GA. Zhou et al. [23] used GA-BP and PSO-BP neural networks to predict the outlet water temperature in the intercooling tower sector, and found that the overall trend of the error curve of the PSO-BP neural network model was closer to zero, showing good performance. S. Yousaf et al. [24] compared and analyzed the control optimization of the PSO algorithm and GA algorithm for the nano-grid, and the results showed that the performance of the PSO algorithm was superior to GA algorithm with all controllers. Somayeh Toghyani et al. [25] used an artificial neural network to estimate the power and torque values of a Stirling heat engine, and compared the optimization performance of ANN-ICA and ANN-PSO. It was found that the mean square error of the ANN-PSO model was low, and the output of the test stage was in good agreement with the experimental data. Liu et al. [26] used GA, PSO and ICA optimization algorithm models, respectively, to optimize ANN to predict rock mass quality scores. The results show that the accuracy of PSO-ANN and ICA-ANN models was high, but the accuracy of the PSO-ANN model was higher. For the training stage and testing stage, the determination of coefficients R2 of PSO-ANN were 0.875 and 0.862, and root mean square errors (RMSE) were 1.584 and 1.782, while the R2 of ICA-ANN were 0.873 and 0.857; RMSE were 1.592 and 1.812. So, the PSO-ANN has better performance. Therefore, compared to other OA, the PSO uses less memory and it has a higher learning speed [27,28], so this study uses the PSO algorithm for optimization.
In conclusion, although some scholars have carried out some studies to reduce the energy consumption of sour water stripping, the literature is lacking on optimization schemes considering the process conditions. Therefore, in this study, ANN and PSO algorithms are combined to optimize the parameters of the sour water stripping process, which can reduce the energy consumption of the system, protect the environment, and reduce the cost of enterprises.
The present study is important because it aimed to carry out the following:
- (1)
- Use Aspen Plus software to simulate the sour water stripping process. The present study aimed to collect data for ANN models.
- (2)
- Determine the best ANN model for sour water stripping. The present study aimed to compare the performance of BPNN, RBFNN and GRNN models and select the appropriate ANN model.
- (3)
- Apply Sobol sensitivity analysis for the ANN model. The present study aimed to determine the influence of input variables on system energy consumption, which is conducive to further optimization using the PSO algorithm.
- (4)
- Utilize the PSO algorithm for optimizing energy consumption of the sour water stripping system. The present study aimed to reduce the energy consumption of the sour water stripping system and achieve the effect of energy saving by global optimization of PSO algorithm.
The structure of the present study is as follows:
2. Methods and Simulation
2.1. Process Simulation
Sour water is a multi-component solution composed of H2S, NH3 and CO2. These electrolytes are dissociated into ions in the wastewater, and these ions are in equilibrium with the undissociated molecules in the gas phase, respectively. Therefore, the system is a complex system of chemical equilibrium ionization equilibrium and phase equilibrium.
In this paper, the sour water system is a highly irrational weak electrolyte system, so the ELECNRTL thermodynamic method can be used to calculate its phase equilibrium. The specific expression is as follows:
where γi is the liquid phase activity coefficient of component I; xi is the mole fraction of component i; Gij is the interaction energy of the solution; τij is the intermolecular interaction parameter; Cij, Cji, Dij, Dji, Eij, and Eji are the ordered characteristic parameters of the ELECNRTL physical property method.
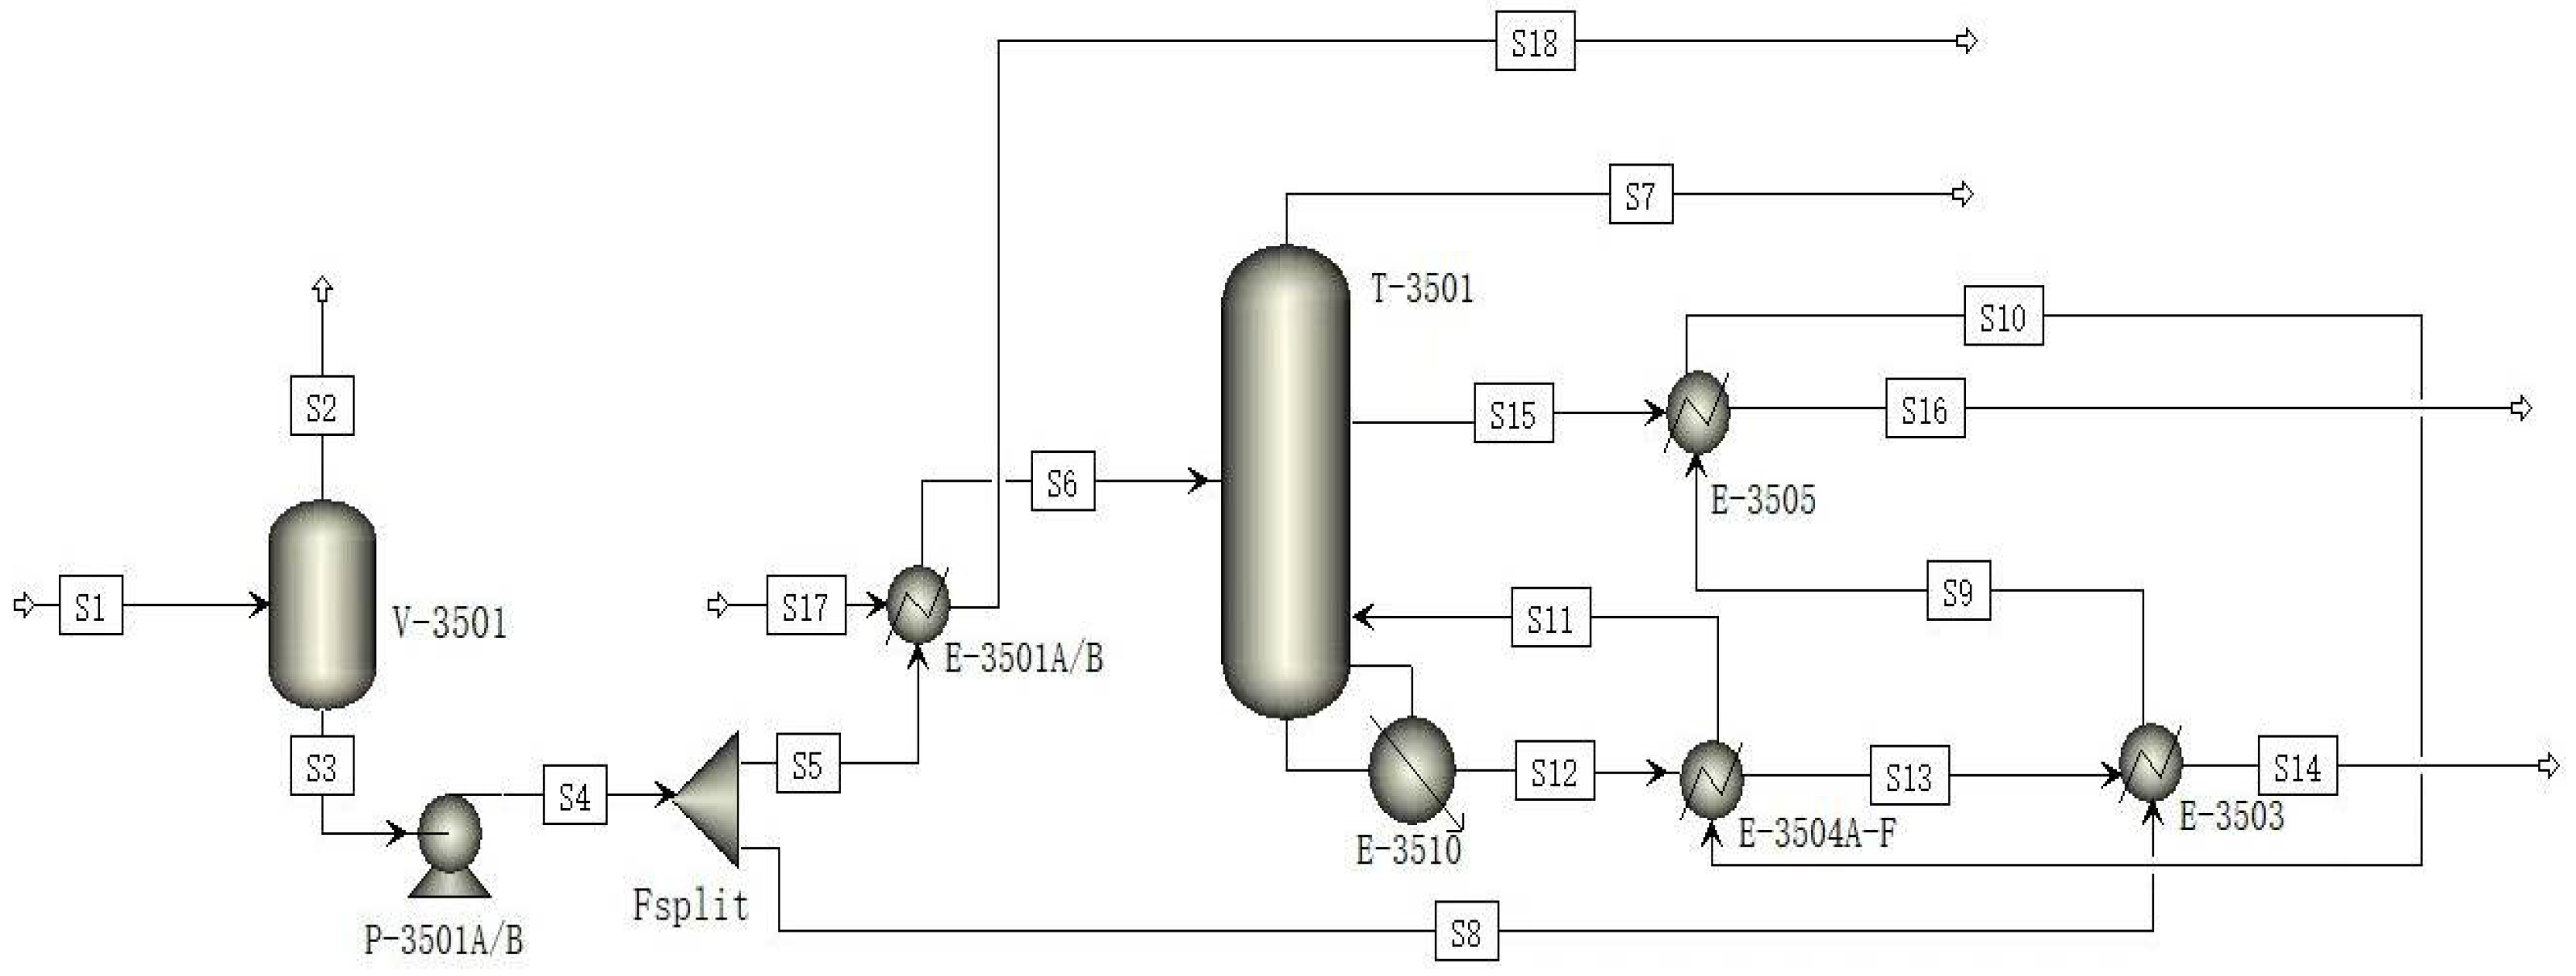
Aspen Plus is mainly used to calculate the strict mass and energy balance of the process, predict the flow rate, composition, and properties of the logistics, predict the operating conditions, equipment size and optimize the process, etc. [29,30,31]. The use of Aspen Plus for the process simulation of sour water stripping has been reported in many articles, including those by Alvaro de Farias Soares [32], H. Gai [13], Ho Chii-Dong [33], Jinfeng Jia [34]. It can be observed that Aspen Plus is a great choice to simulate and establish the mathematical model in this study. In the simulation process, each unit module is established through the Aspen Plus model library, the Flash2 module of the flash is used to express the sour water buffer tank and acid gas separator [35], and the RADFRAC module is used to simulate T-3501. E-3510, E-3504A-F, E-3503, and E-3505 are simulated by the heater module. P-3501A/B is simulated by the pump module. In addition, it is important to abide by the conservation of mass and energy in the process of simulation. The main flowchart of the Aspen Plus simulation model is presented in Figure 1.
In Figure 1, the sour water enters the flash tank (V-3501) to further homogenize the buffer and stabilize the properties of raw materials after oil removal. After being pressurized by the raw material pump (P-3501A/B), it is divided into two channels; after cooling through the cold feed cooler E-3501AB, it enters the top of the sour water stripper (T-3501) tower. The other passes through the raw water and purified water first-stage heat exchanger (E-3503), the first-stage condensing cooler (E-3505) and the raw water and purified water second-stage heat exchanger (E-3504A-F) to transfer heat to 140~150 °C and then enters the first layer tray of T-3501 as the heat feed. At the bottom of the T3501 tower, medium pressure steam is used for heat stripping, and the medium pressure steam is reduced to 0.8 MPa and 250 °C by temperature reducing and decompression pressure reducer, and then heat stripped by the reboiler (E-3510) after continuous reforming. The produced gas from the sideline is extracted from the sideline of the 18th column plate of T-3501 to obtain a high concentration of crude ammonia, which is sent to the ammonia gas treatment and recovery unit. After heat exchange between the purified water and the raw water at the bottom of the stripper, part of the purified water is sent to the outside of the unit for electric desalting water injection, and the rest is discharged to the oil-containing sewage pipe network. The sour gas at the top of stripper is sent to the sulfur recovery section.
2.2. Artificial Neural Network (ANN)
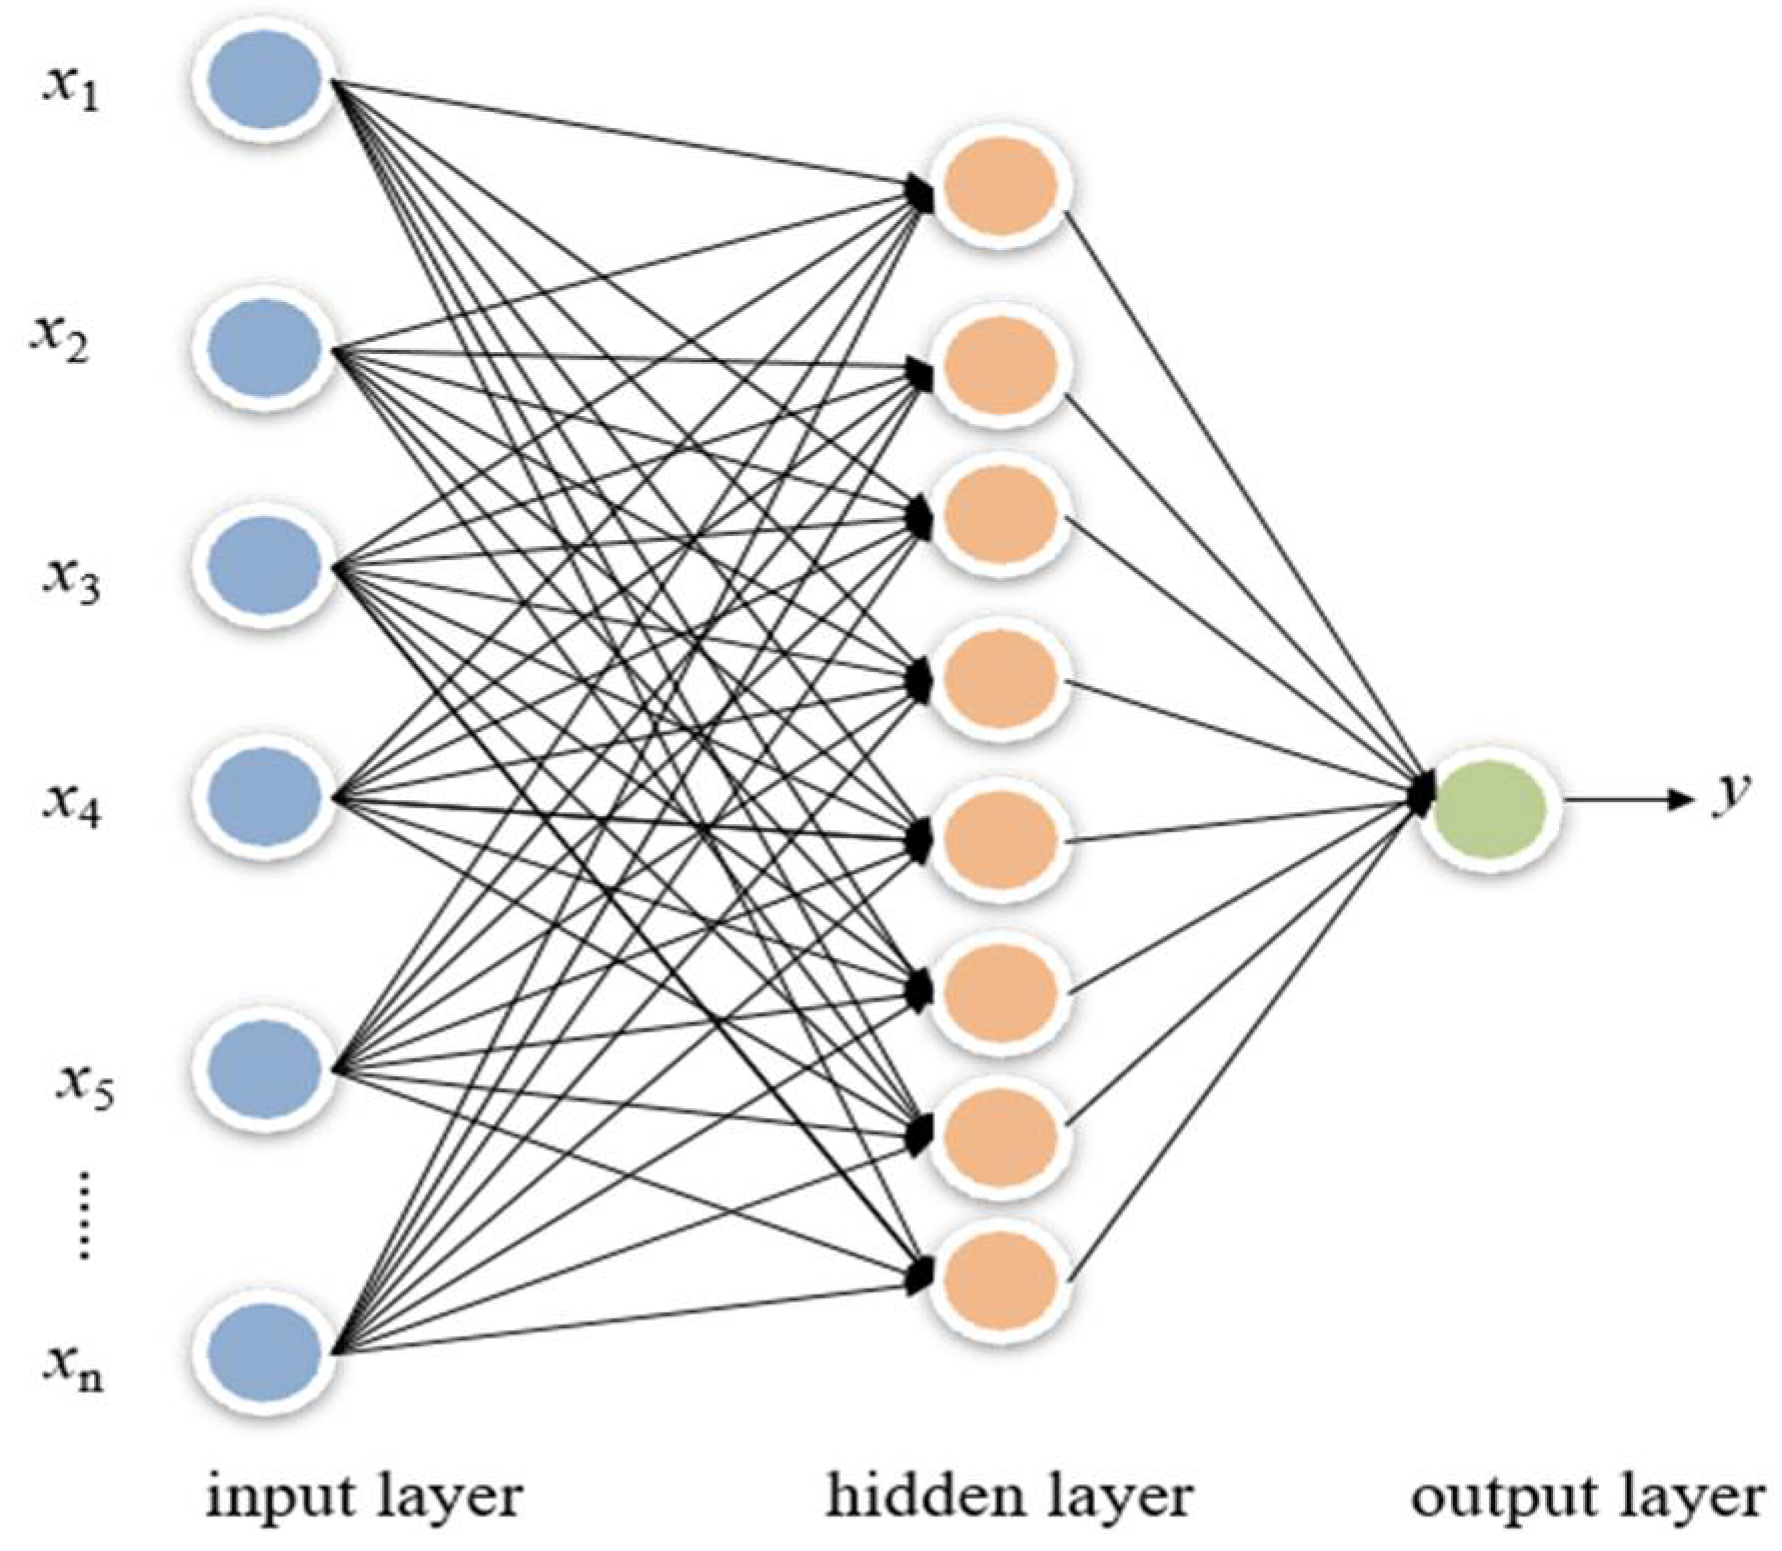
ANNs are based on the working principles of the human brain. This model can solve nonlinear problems through example learning [25,36]. ANN is mainly composed of three parts, the input layer, output layer, and hidden layer. At each layer, connections between neurons are determined by biases and weights. The architecture is shown in Figure 2. In recent years, ANN is one of the most popular tools in the field of artificial intelligence and machine learning, not only because it is a black-box model that is not constrained by physical laws and model parameters may have no physical meaning, but also because of its short computing time, high precision, and nonlinear mapping of the relationship between system inputs and outputs.
In this study, BPNN, RBFNN, and GRNN models are established respectively to analyze their accuracy and reliability and determine the best model. BPNN is a kind of multilayer feed-forward neural network that is characterized by signal forward transmission and error back propagation. RBFNN belongs to the type of forwarding neural network. RBFNN has some global approximation capability and does not have any local minimum problem. The value of nodes in the hidden layer of the RBFNN is calculated by the activation function, and the number of nodes is determined by training. GRNN is similar to the RBF network in structure. It consists of four layers, the input layer, pattern layer, summation layer, and output layer. Its theoretical basis is nonlinear regression analysis. The pattern layer is used to perform clustering in the training process [37,38]. The summation layer consists of two neurons, the first and second neurons are called S-summation neurons and D-summation neurons, respectively. Its theoretical basis is nonlinear regression analysis.
The performance of the neural network is determined by mean square error (MSE) and determination coefficient (R2), according to Equations (4) and (5), respectively. When the MSE value is low, and the R2 is close to 1, this indicates that the neural network model has good performance and high accuracy.
where p is the serial number of the sample, p = 1, 2, …, P; ykp is the output value, ŷkp is the expected value; ym is the average of the values.
2.3. Sensitivity Analysis of Sobol
Sensitivity analysis is a method to study and analyze the sensitivity of state or output changes in a system (or model) to changes in system parameters or surrounding conditions. It can determine which parameters have a greater impact on the system or model. Based on the RBFNN, sensitivity analysis is conducted by using Sobol to analyze whether the operational variables have a major impact on the sour water stripping system, which is further used for PSO. Sobol’s exponential model is used in this paper. Its model assumes that
x = x1, x2, …, xp is the input parameter and the variance D(y) of decomposition objective function y is as follows:
where Di is the variance of a single parameter; Dij is the variance generated when two parameters interact; Dijk is the variance generated by the interaction of three parameters i, j, and K; D1, 2, …, P is the variance generated by the joint action of P parameters.
Each sensitivity of parameter i can be expressed as follows:
where Si is the sensitivity of parameter i without considering other parameters, also known as the main effect index; Sij is the sensitivity when parameters i and j interact; STi is the full effect index of parameter i, which reflects the influence of parameter i and its interaction with other parameters on the output of the objective function. D~ i refers to the independent and interactive variances of other parameters, except for parameter i.
2.4. Particle Swarm Optimization
The optimization algorithm (OA) model that is used in this study is the PSO algorithm. This algorithm was first developed by Eberhart-Phillips and Chadwick. In this algorithm, each particle represents a potential solution to the problem, corresponding to a fitness value determined by the fitness function, and the particle velocity determines the direction and distance of particle movement [39,40,41,42,43].
In the K-dimensional search space, population Q is composed of n particles, that is, Q = (Q1, Q2, …, Qn). If the i-th particle moves in K-dimensional solvable space, its position can be expressed as Qi = (qi1, qi2, …, qiK)T, and the velocity can be expressed as Vu = [vu1, vu2, …, vuo, …, vuD]T, and the fitness can be calculated by a radial basis artificial neural network, and its value represents the advantages and disadvantages of the particle. It compares the new fitness of particles with the individual extreme value Pi = [Pi1, Pi2, …, Pio, …, PiD]T and population extreme value Gi = [Gi1, Gi2, …, Gio, …, GiD]T to continuously optimize the individual extremum and population extremum. The update of speed and position give the following equation:
where ω is the inertia weight, k is the number of current iterations, c1 and c2 are acceleration factors and non-negative constants, r1 and r2 are random values in the interval (01), Vi is the velocity of the i particle, Pi is the extreme value of the i particle individual, and Pg is the extreme value of the population.
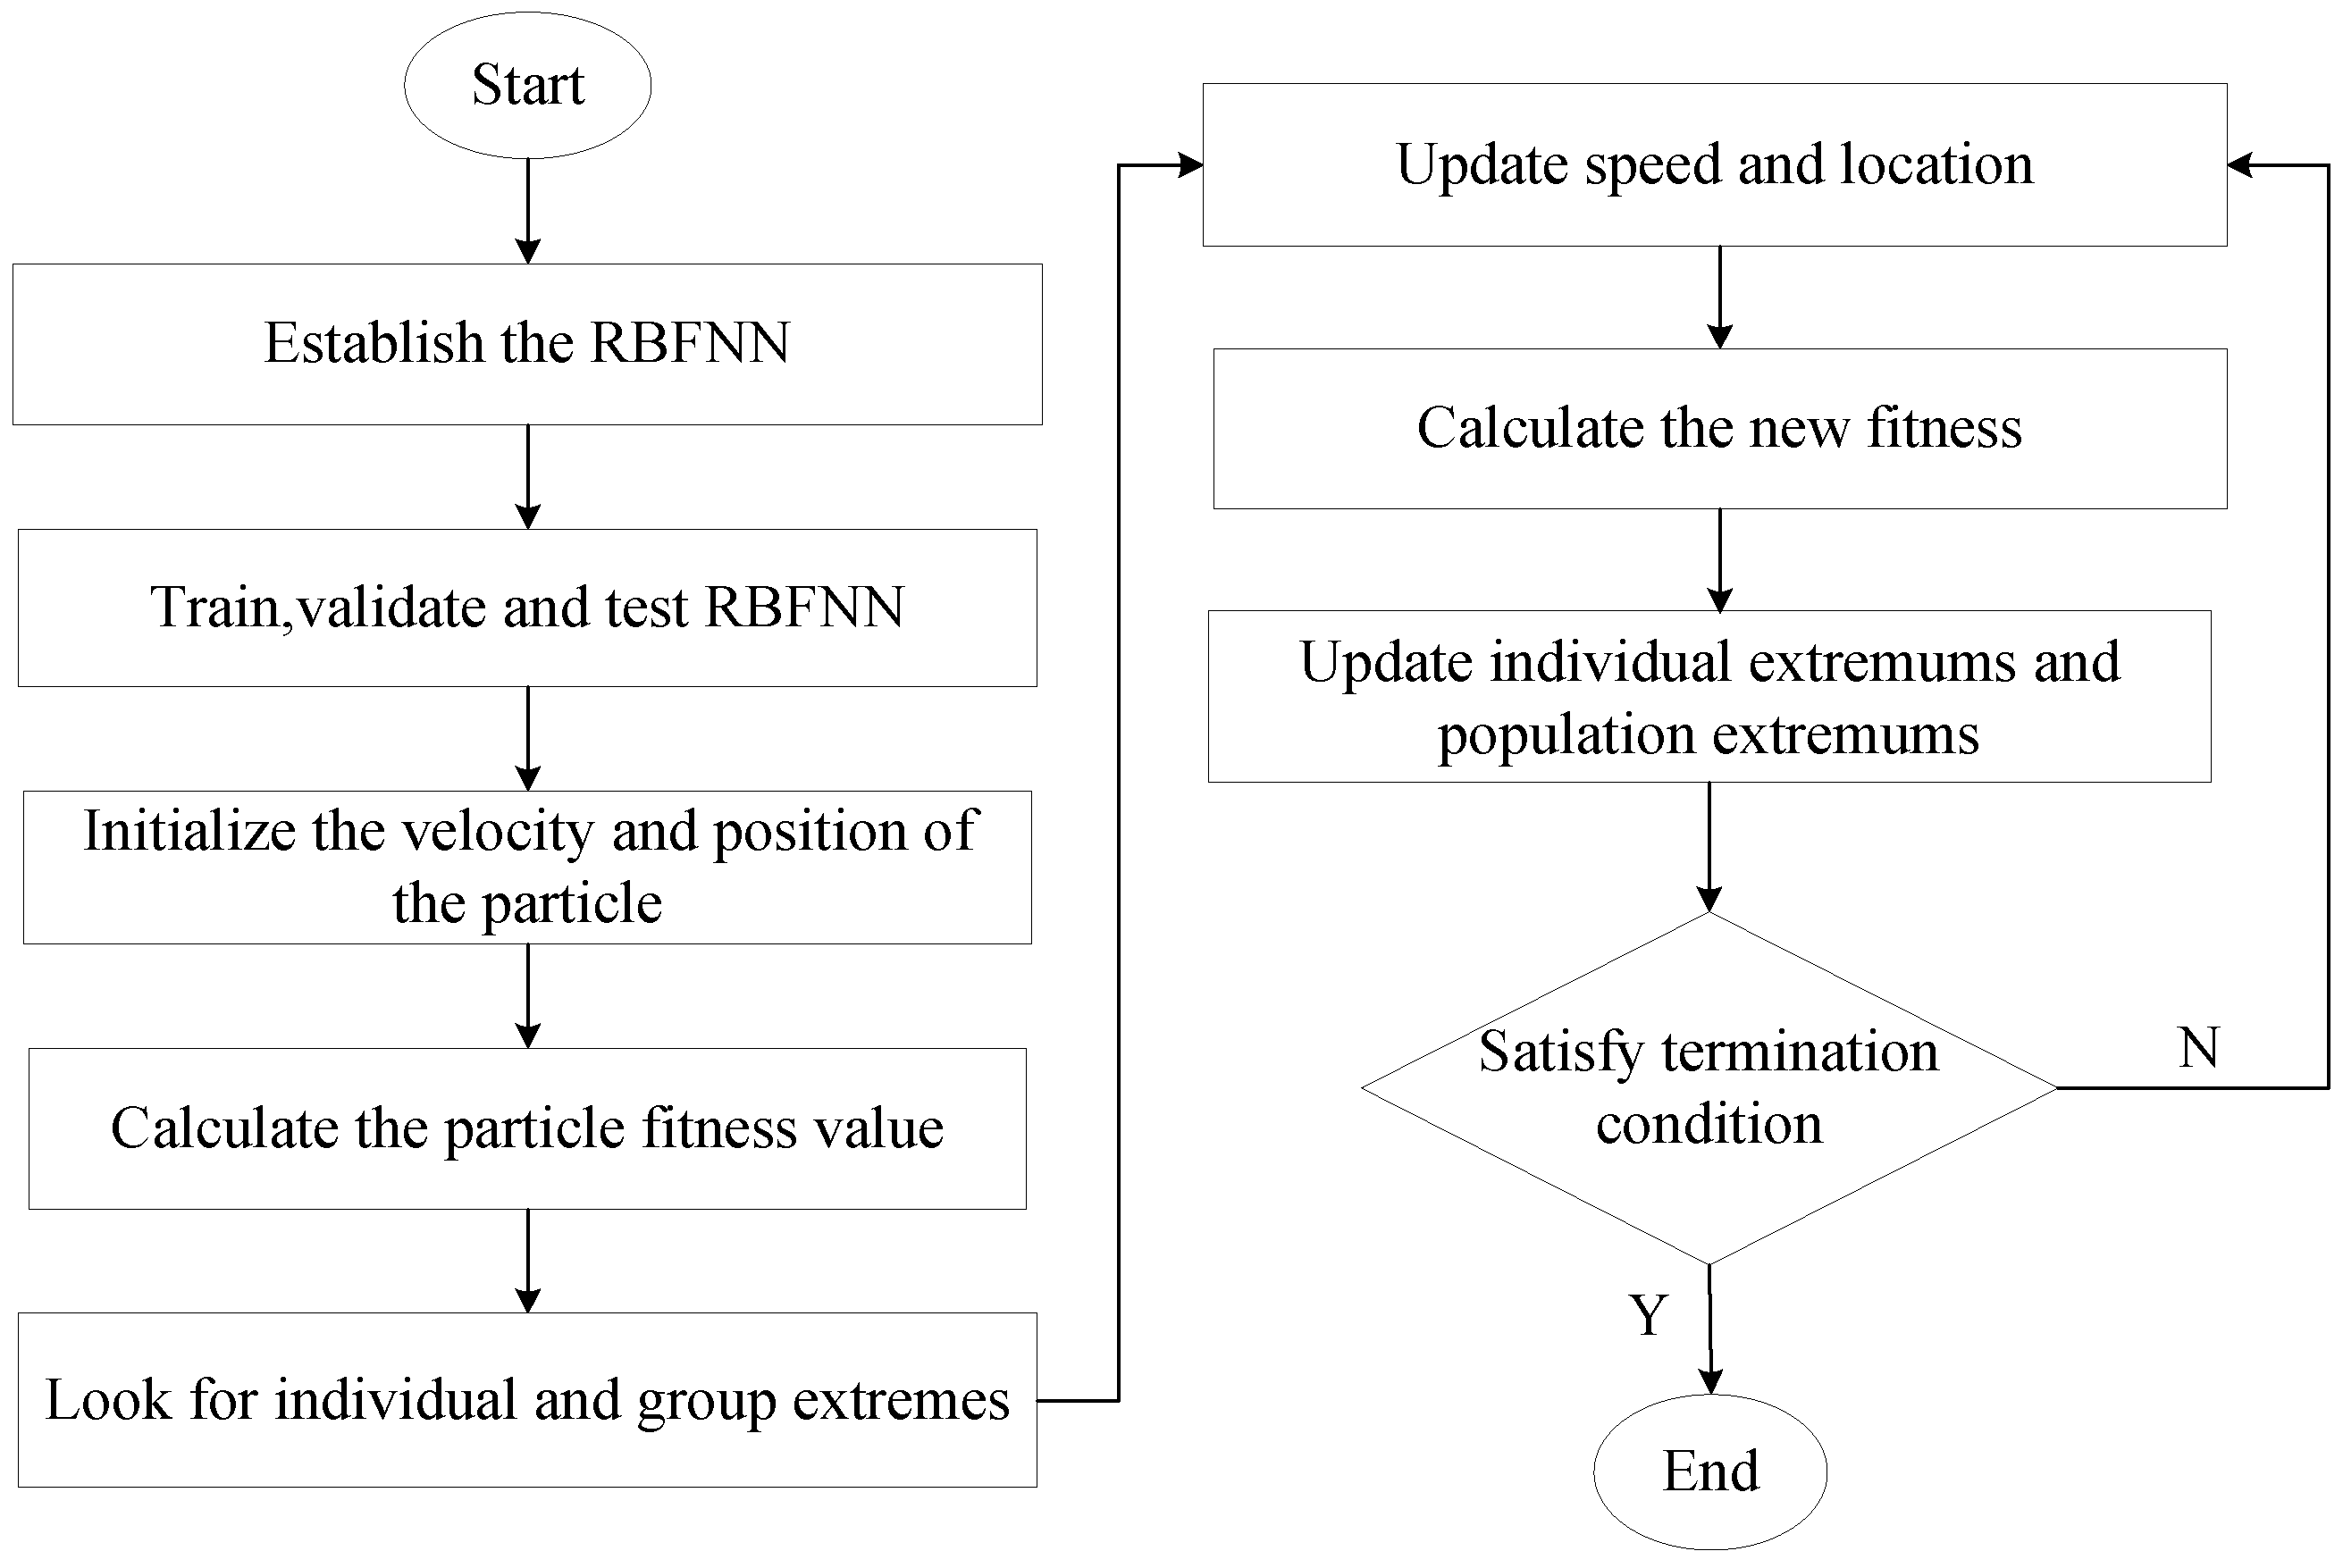
The PSO algorithm continuously updates the position and speed of each particle in the whole swarm through Formulas (9) and (10), until the fitness value of the maximum number of iterations or global optimal position meets the preset minimum fitness value. The optimization flow chart based on PSO algorithm is shown in Figure 3.
3. Results and Discussion
3.1. Data Collect
According to the Aspen simulation results, the number of stripper plates is 35, the sideline is the 18th plate, the top temperature is 53.26 °C, the pressure is 430 kPa, the bottom temperature is 184.53 °C and the bottom pressure is 450 kPa. The results of the main simulated logistics parameters are listed in Table 1, as follows.
As can be observed from Table 1, when the contents of hydrogen sulfide, ammonia, and carbon dioxide in the sour water are 0.4010% (W/W), 0.7122% (W/W), and 0.1793% (W/W), respectively, the contents of hydrogen sulfide, ammonia, and carbon dioxide in the purified water at the bottom of the tower are significantly reduced after the treatment of the sour water stripping. The ammonia content of the produced gas in the sideline is as high as 99.1021% (W/W), so the sour water stripper works well. Furthermore, it shows that the phase balance calculation of sour water stripping systems using the ELECNRTL thermodynamic method is accurate and reliable, which can better reflect the actual operation of the sour water stripping unit, and can be used as a basic model for subsequent energy conservation optimization.
Therefore, when the operation parameters (cold feed ratio; sideline production position; tower bottom pressure; the temperature of hot feed; cold feed temperature) of each unit in the sour water stripping system are in line with the industrial operating parameters and the system runs stably, different energy consumptions can be obtained by changing the operating parameters of the stripper. Table 2 shows the range of parameters and a total of 200 groups of data are collected through random combinations to train, validate, and test neural network models.
3.2. Energy Consumption Optimization of Sour Water Stripping Process
3.2.1. BPNN, RBFNN and GRNN Models
Establish Data Bank
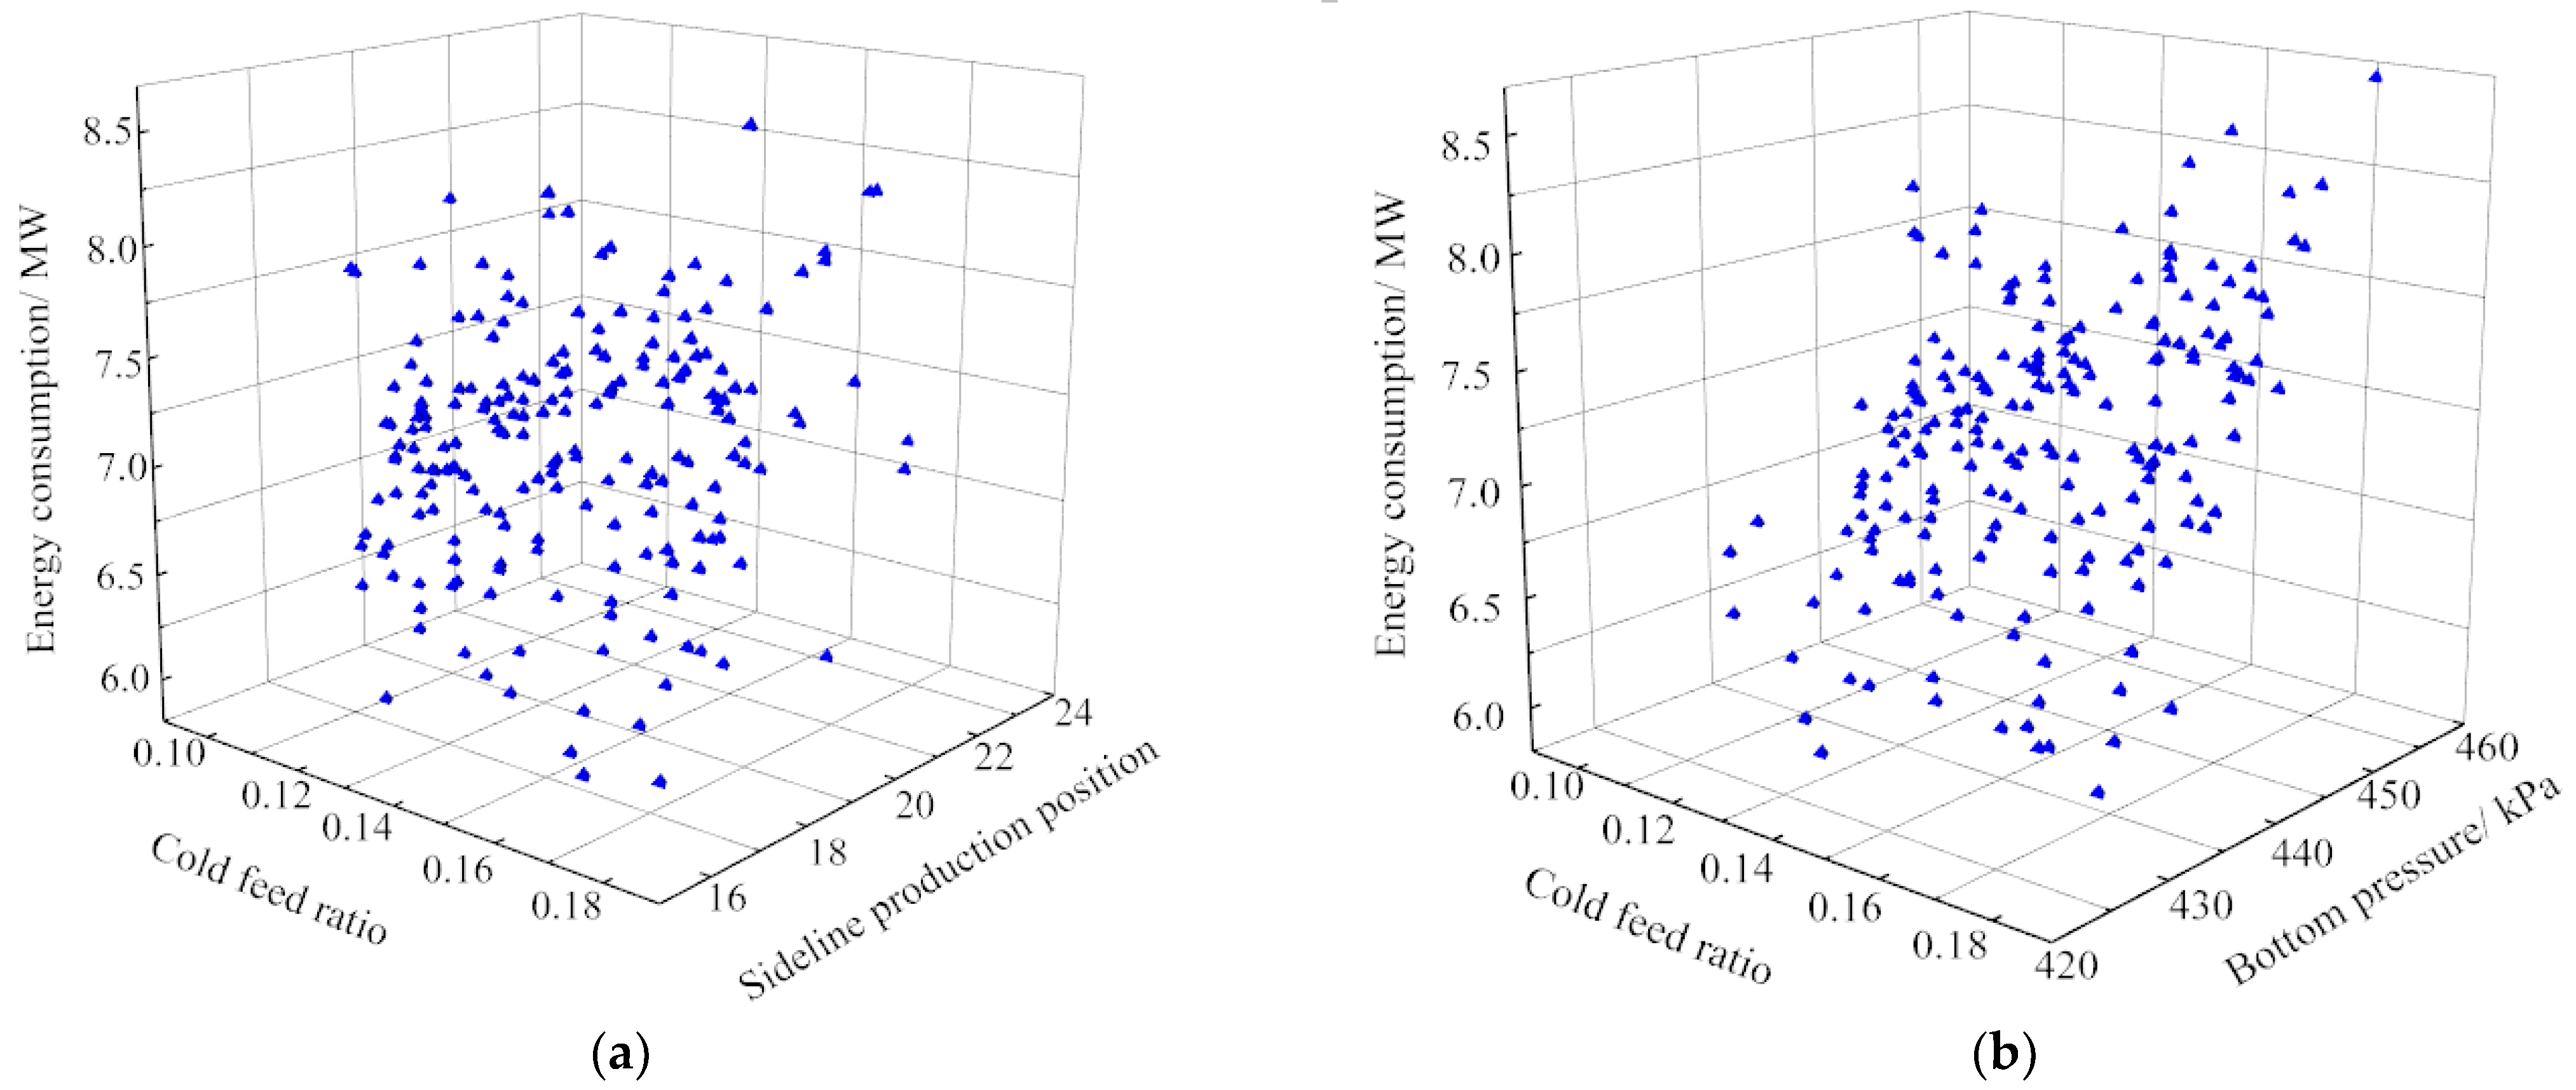
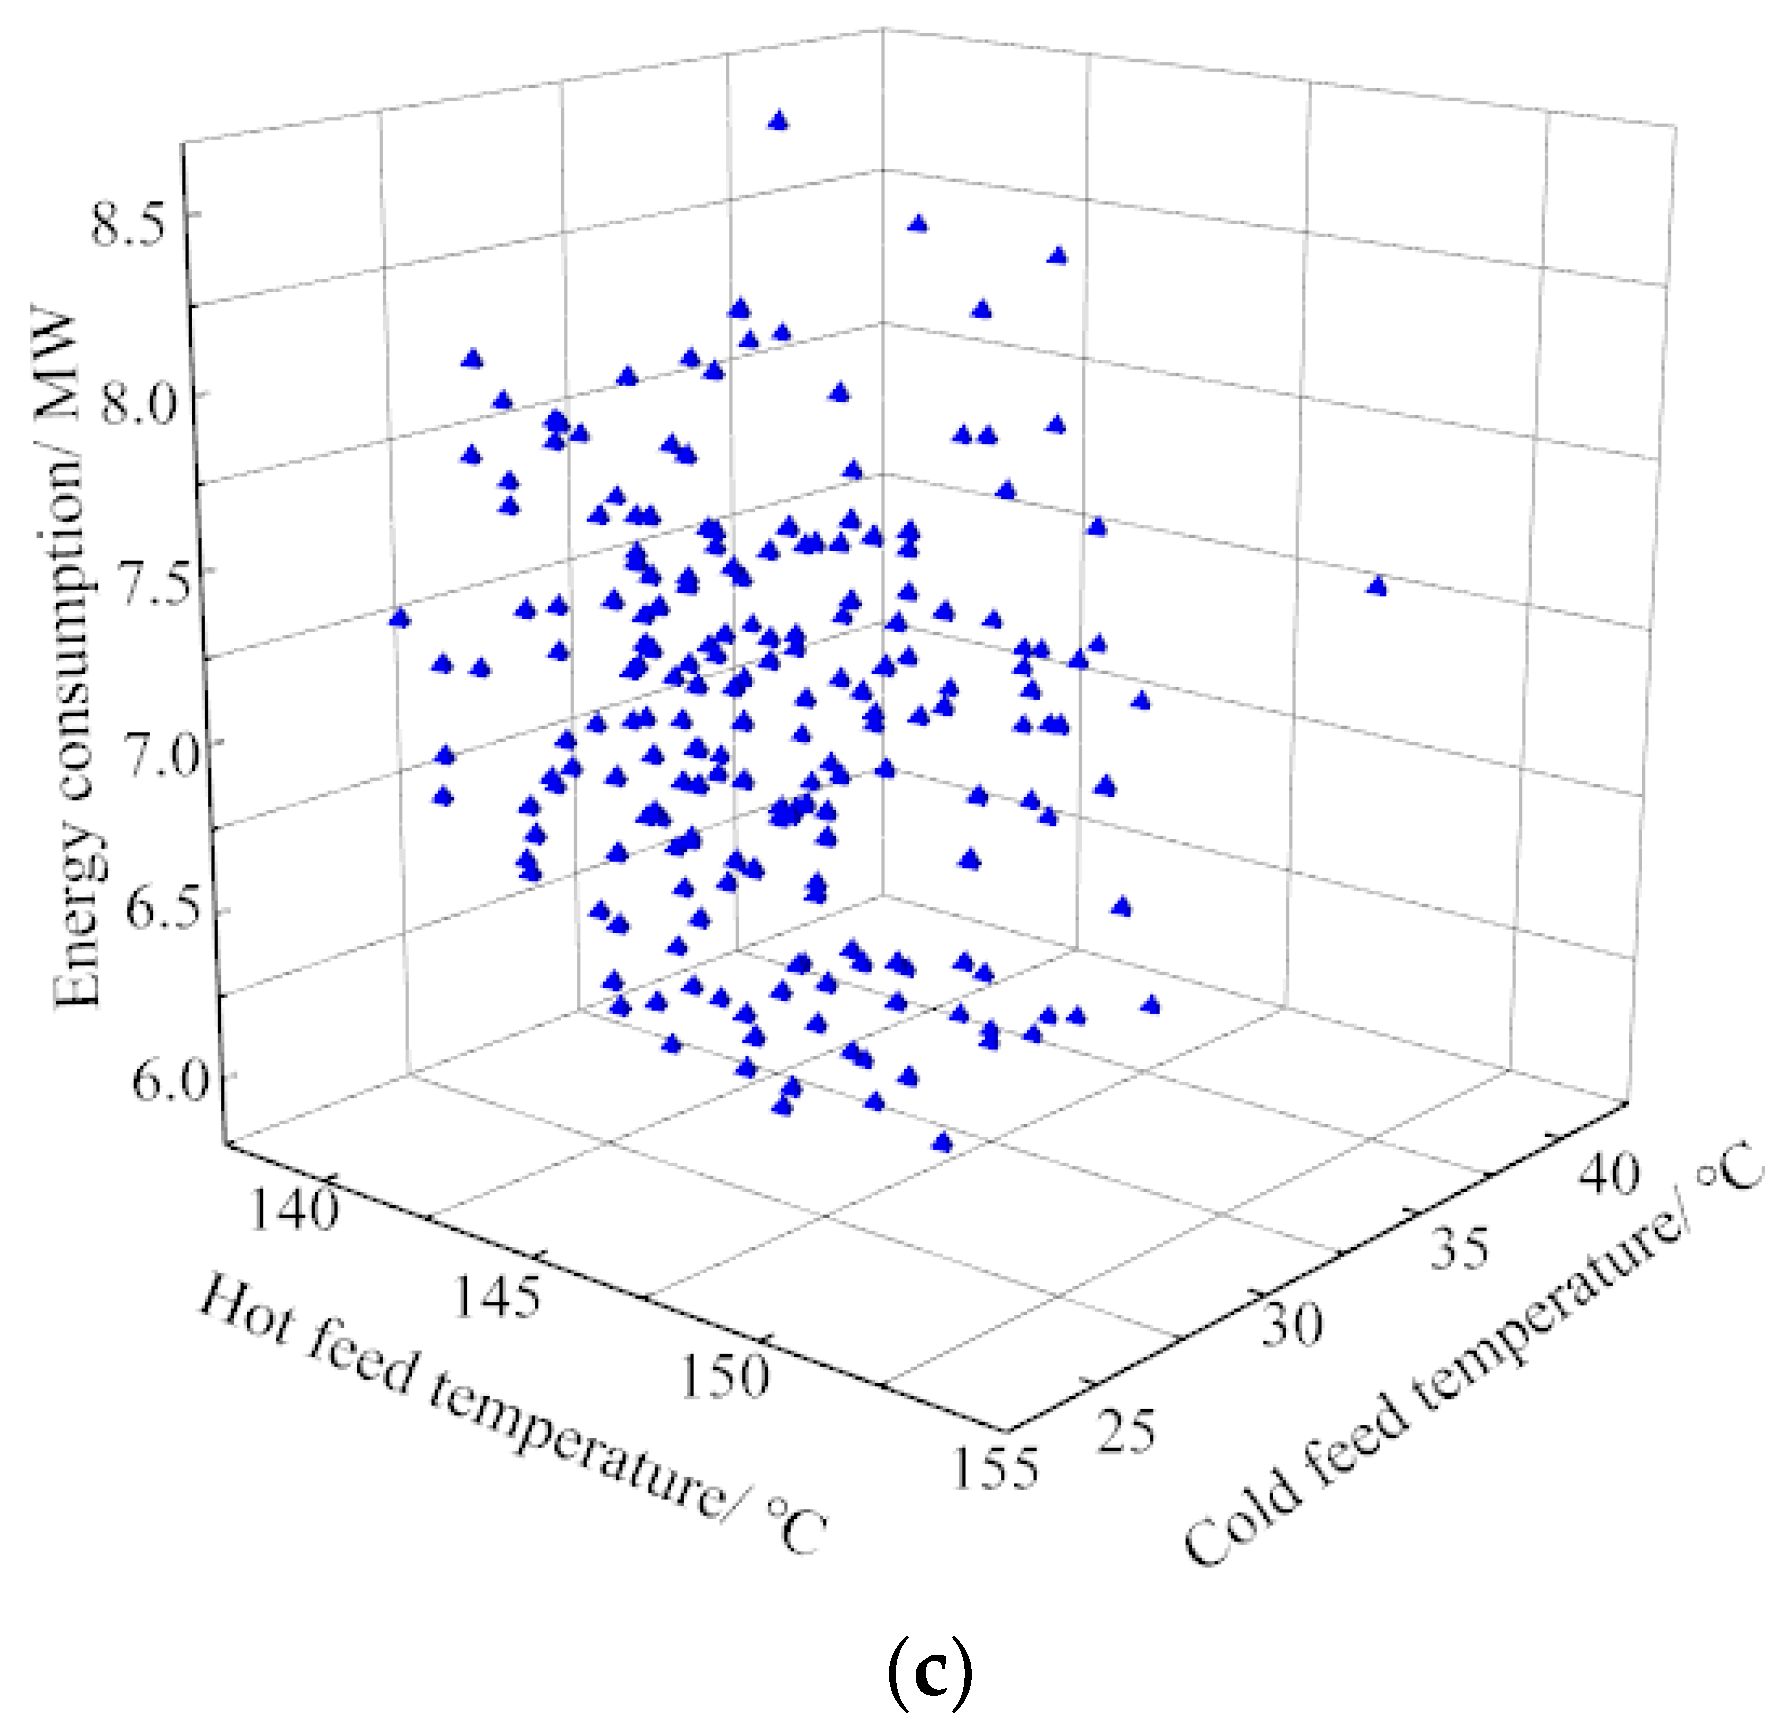
Two hundred sets of data collected by Aspen Plus are used for artificial neural network modeling. When constructing the ANN, the operation parameters of the stripper (cold feed ratio; sideline production position; tower bottom pressure; the temperature of hot feed; cold feed temperature) are selected as the inputs, and the energy consumption of the system is taken as the output. Under different working conditions, there are 200 groups of effective samples that are collected. Among them, the 1st to 120 groups of data are used as training samples for ANN training, while the 121st to 200 groups of data are used as testing and training samples and did not participate in training. After repeated training, when the ANN meets the convergence condition, the 121–160 sets of data can be used to verify the accuracy and reliability of the ANN model. If the convergence error limits meet the requirements after repeated training, the 161–200 groups of data can be input into the ANN for testing. The establishment of the sample database is shown in Figure 4. The blue triangles in Figure 4. represent sample points of corresponding system energy consumption under different operating conditions.
Training, Validation, and Testing of ANNs
In order to select a more suitable ANN model, BPNN, RBFNN and GRNN are established, respectively. All models are cross-validated in MATLAB to obtain a reliable and stable model. The accuracy and reliability of BPNN, RBFNN, and GRNN models can be reflected by the determination coefficient R2 and MSE. The results are listed in Table 3 and Figure 5.
Table 3 shows that the MSE of BPNN, RBFNN and GRNN are 0.2275, 0.0003 and 0.1151, respectively. Figure 5 shows that the determination coefficients of the BPNN, RBFNN and GRNN are 0.529, 0.971, and 0.846, respectively. The results show that the mean square error of RBFNN is the lowest compared with the other two and the determination coefficient of RBF is very close to 1, which indicates that the accuracy of the RBFNN model for the sour water stripping system is suitable. In addition, RBFNN is a kind of feed-forward neural network with excellent performance, which can accurately approximate any nonlinear function and has global approximation ability, so this paper adopts the RBFNN model for follow-up work.
The Suitable ANN Model for the Process
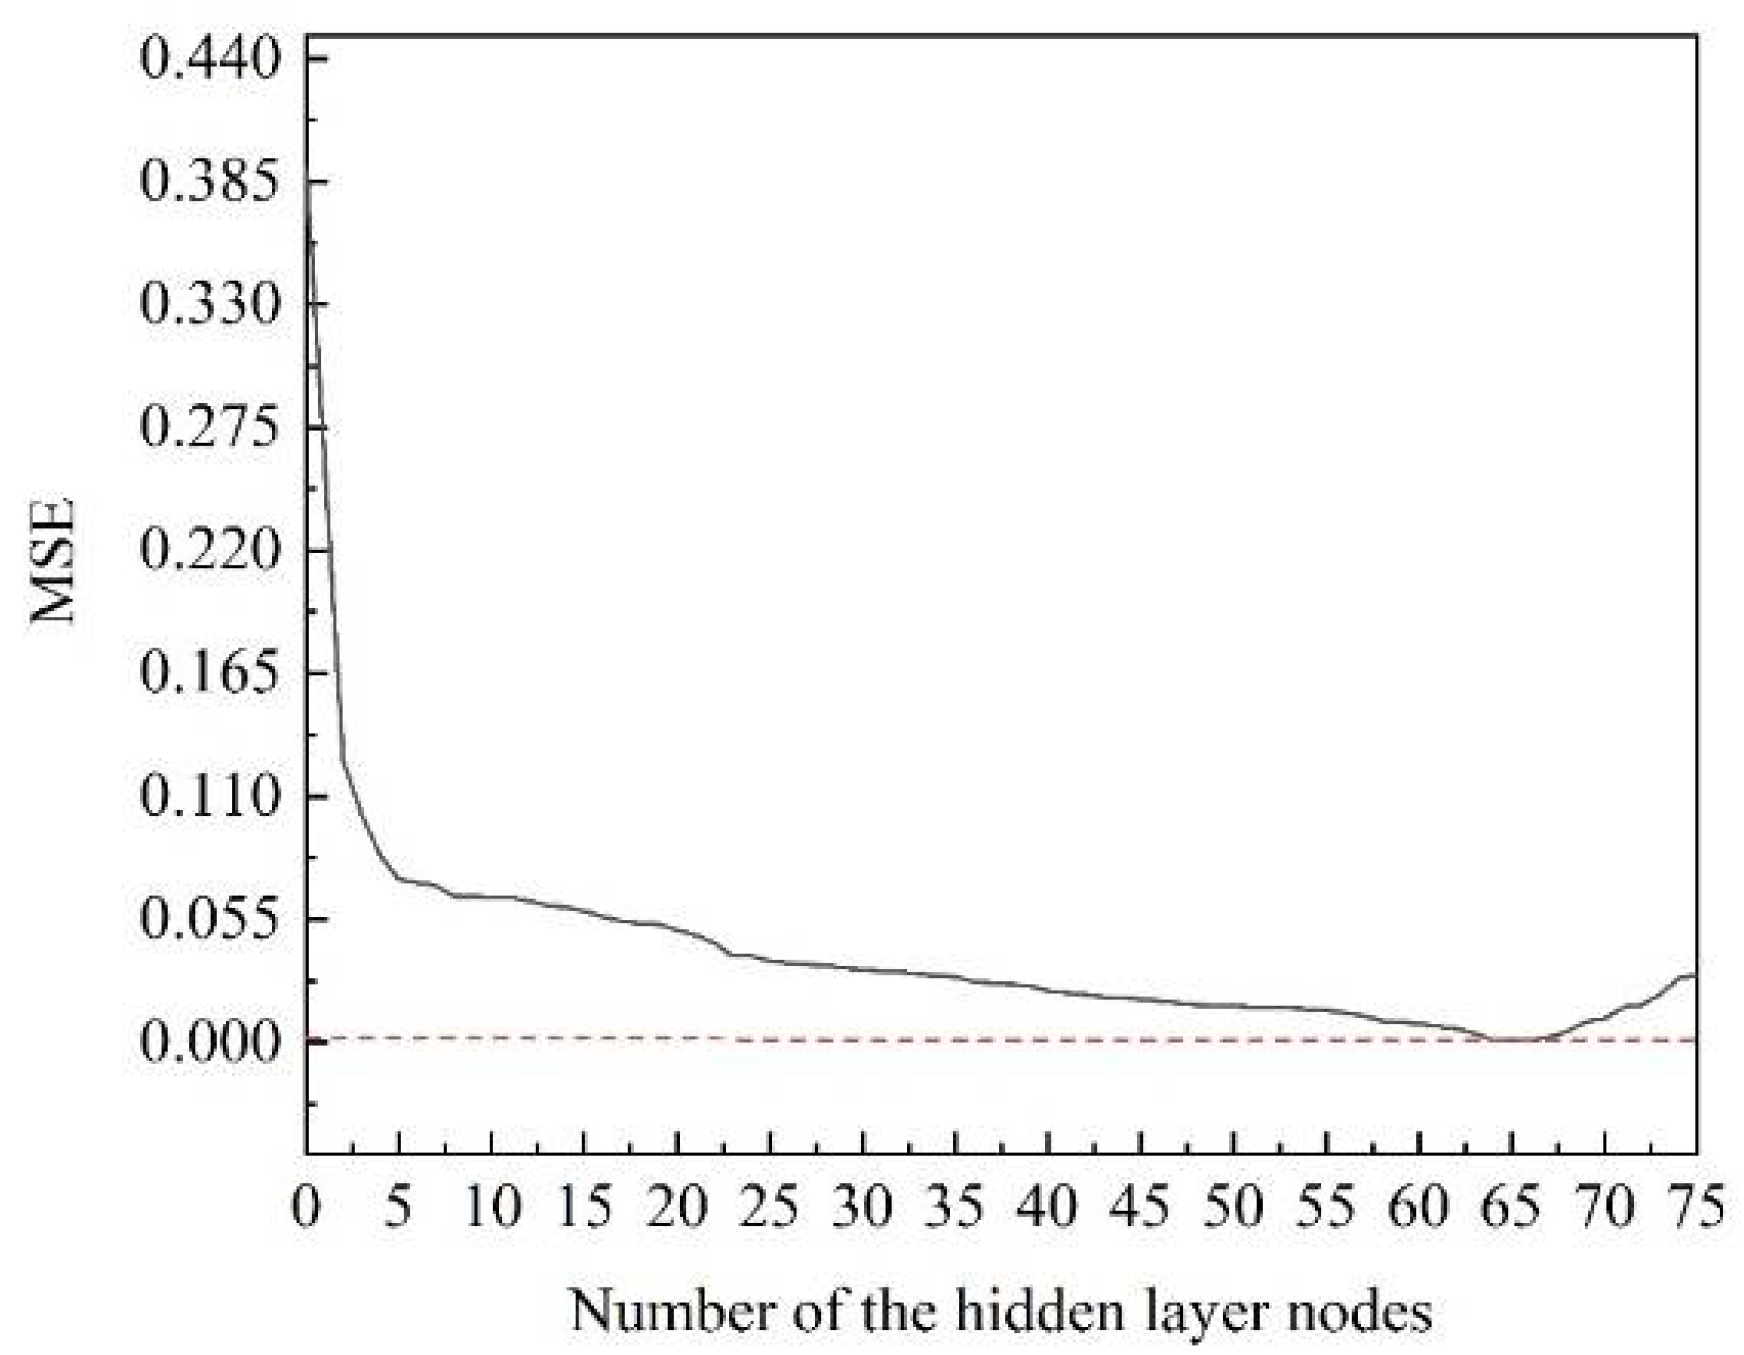
From the above studies, RBFNN is used for further study. For RBFNN, the number of hidden layer nodes is one of the key factors affecting the prediction effect of the model. In this paper, the newrb () function is used to design accurate radial basis networks. Newrb () is a radial basis network established through continuous attempts. In the process of creation, the number of nodes in the hidden layer needs to be continuously increased until the output error of the network meets the preset value. When the MSE value is less than 0.001, it indicates that the network has reached the convergence condition. Figure 6 shows the change in MSE with the number of hidden layer nodes.
In Figure 6, it is clear that MSE decreases with the increasing number of hidden nodes. When the number of nodes is too small, the network cannot learn well, and the training times need to be increased. However, if the number of nodes is too large, the training time will increase, and overfitting is easy to occur. Therefore, as the number of nodes is 66, the error is 0.000998, and the MSE is less than 0.001, indicating the high accuracy of the neural network. So, a neural network with a structure of 5-66-1 is used to train RBFNN in this paper.
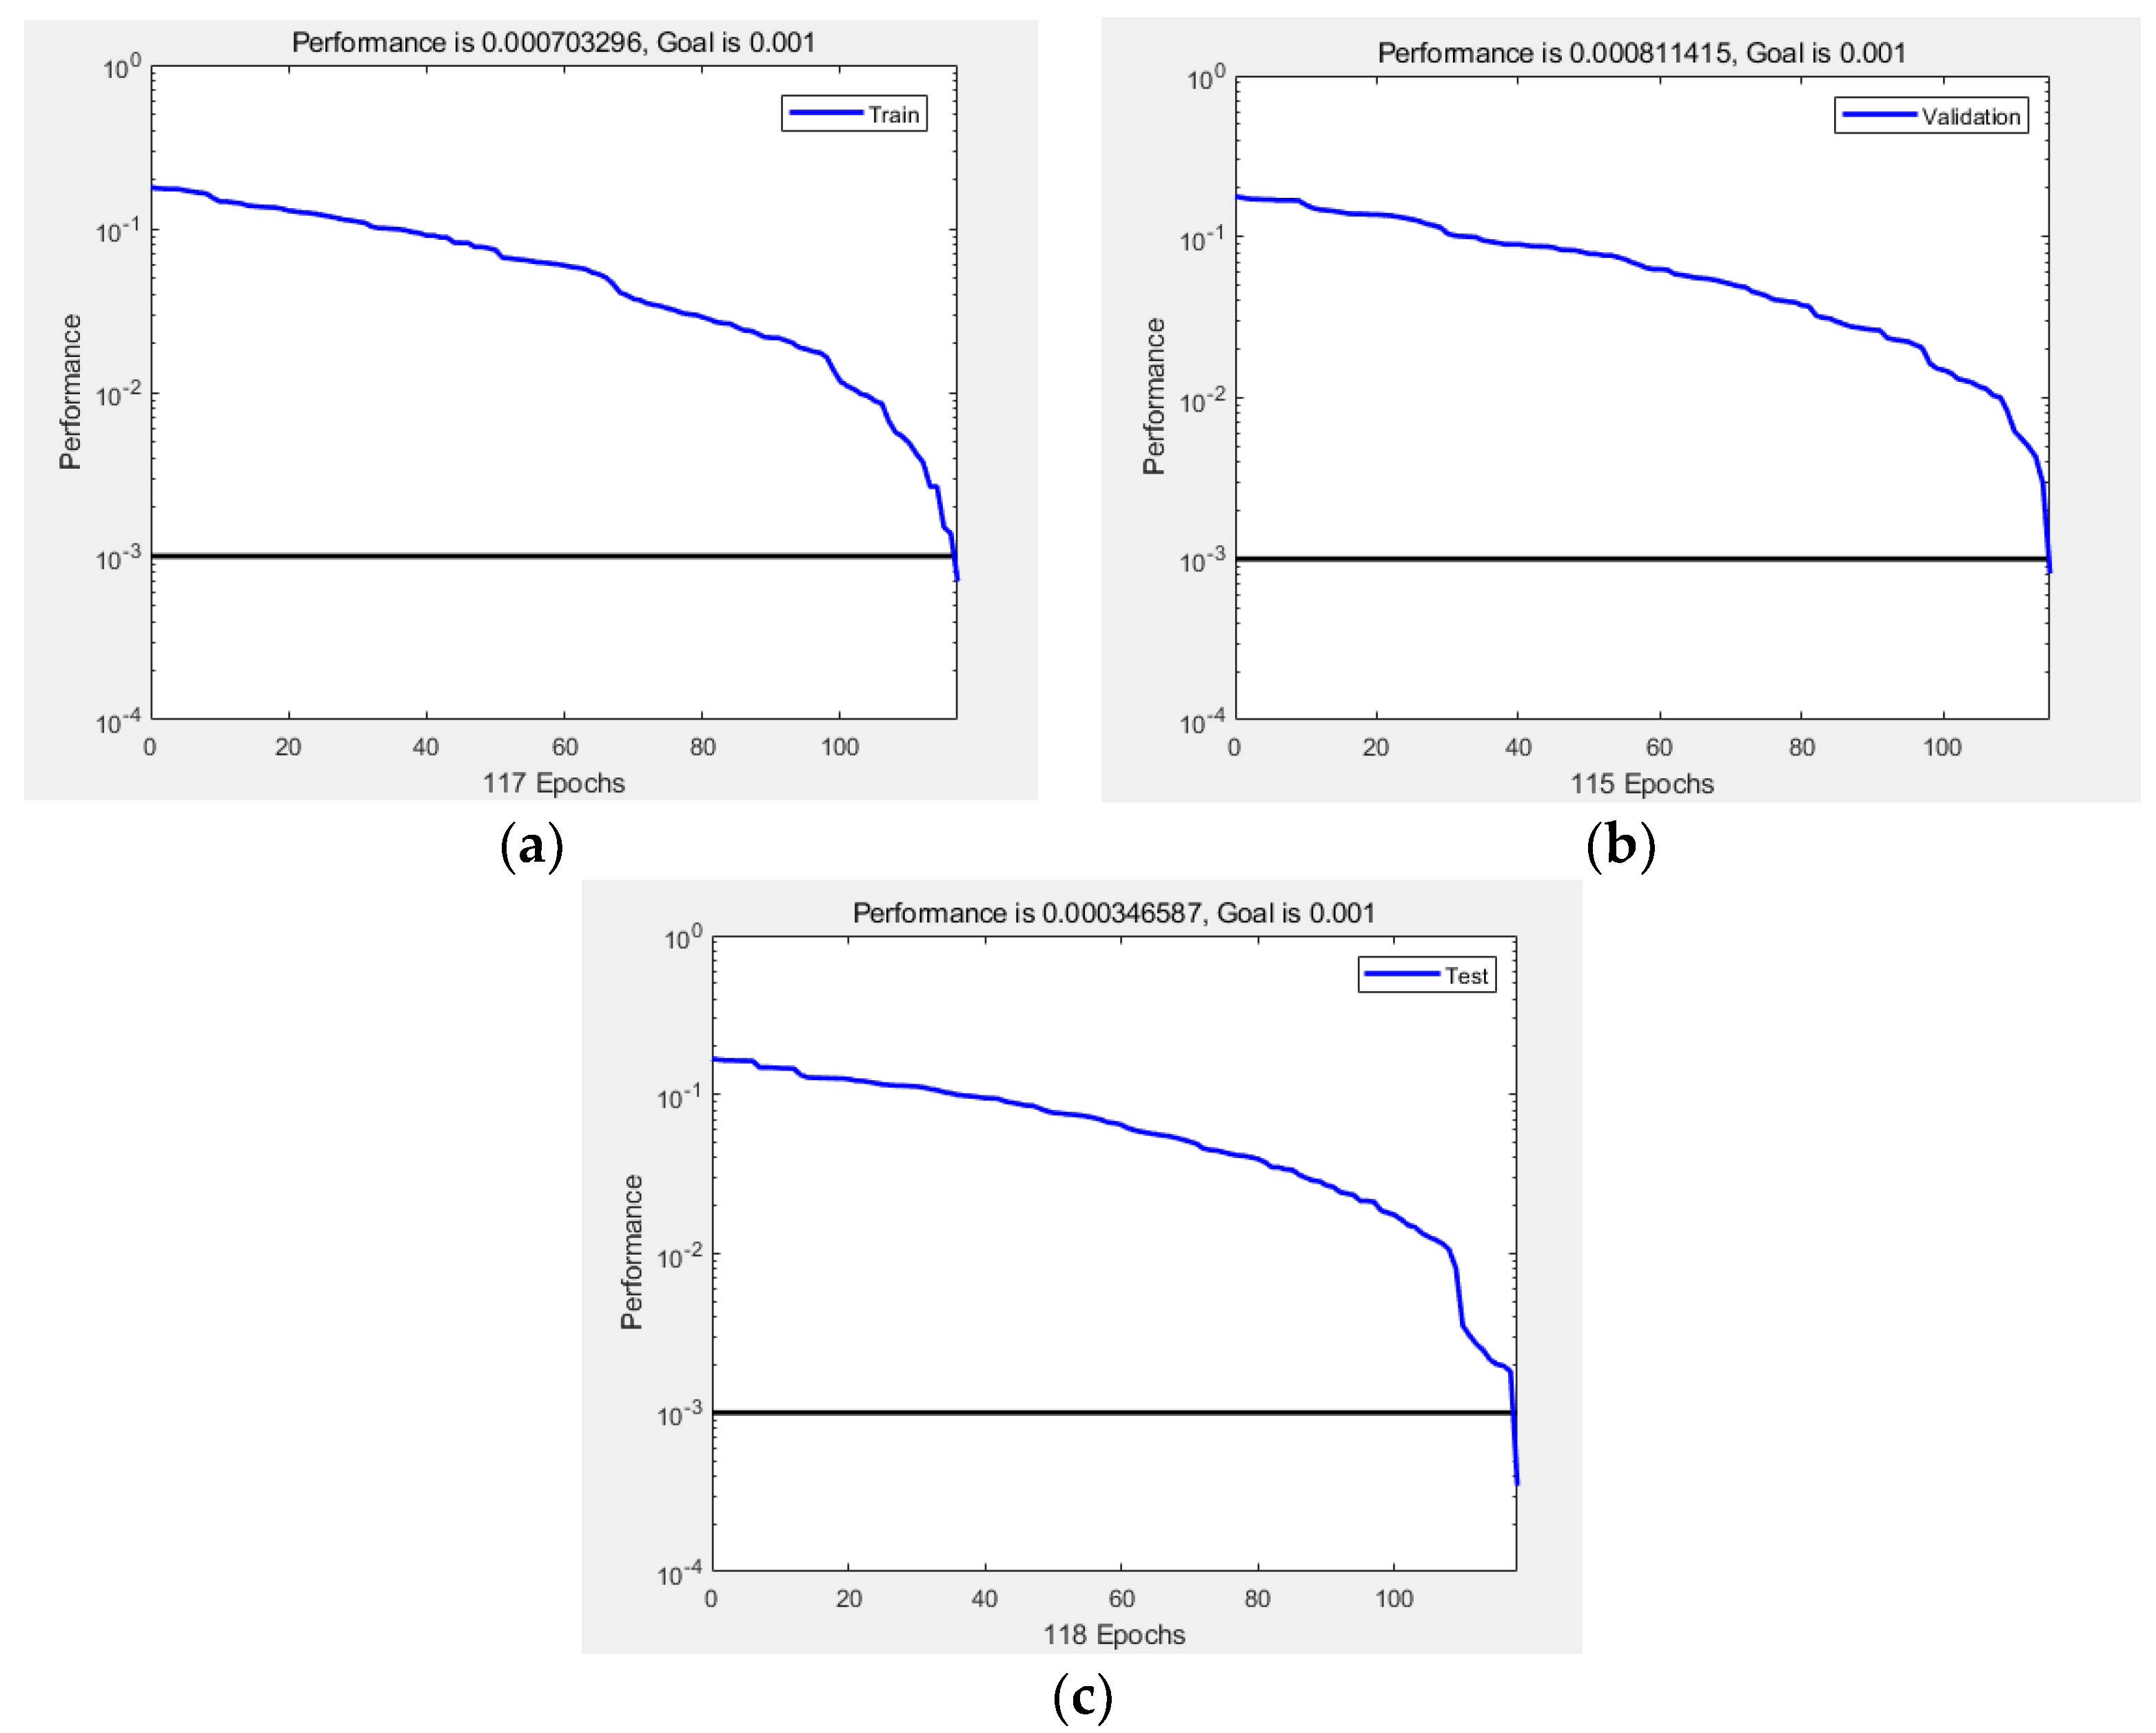
Figure 7 shows the change in MSE of RBFNN as the number of iterations increases. It can be observed from Figure 7 that the MSE of model decreases gradually with the increasing number of iterations. When the upper limit of iteration is 200, the training, verification and testing stage converge at 117, 118 and 115, and the MSE is 0.000703, 0.00081, and 0.000347, respectively, all less than the convergence error limit of 0.001. This shows that RBFNN meets the convergence requirements.
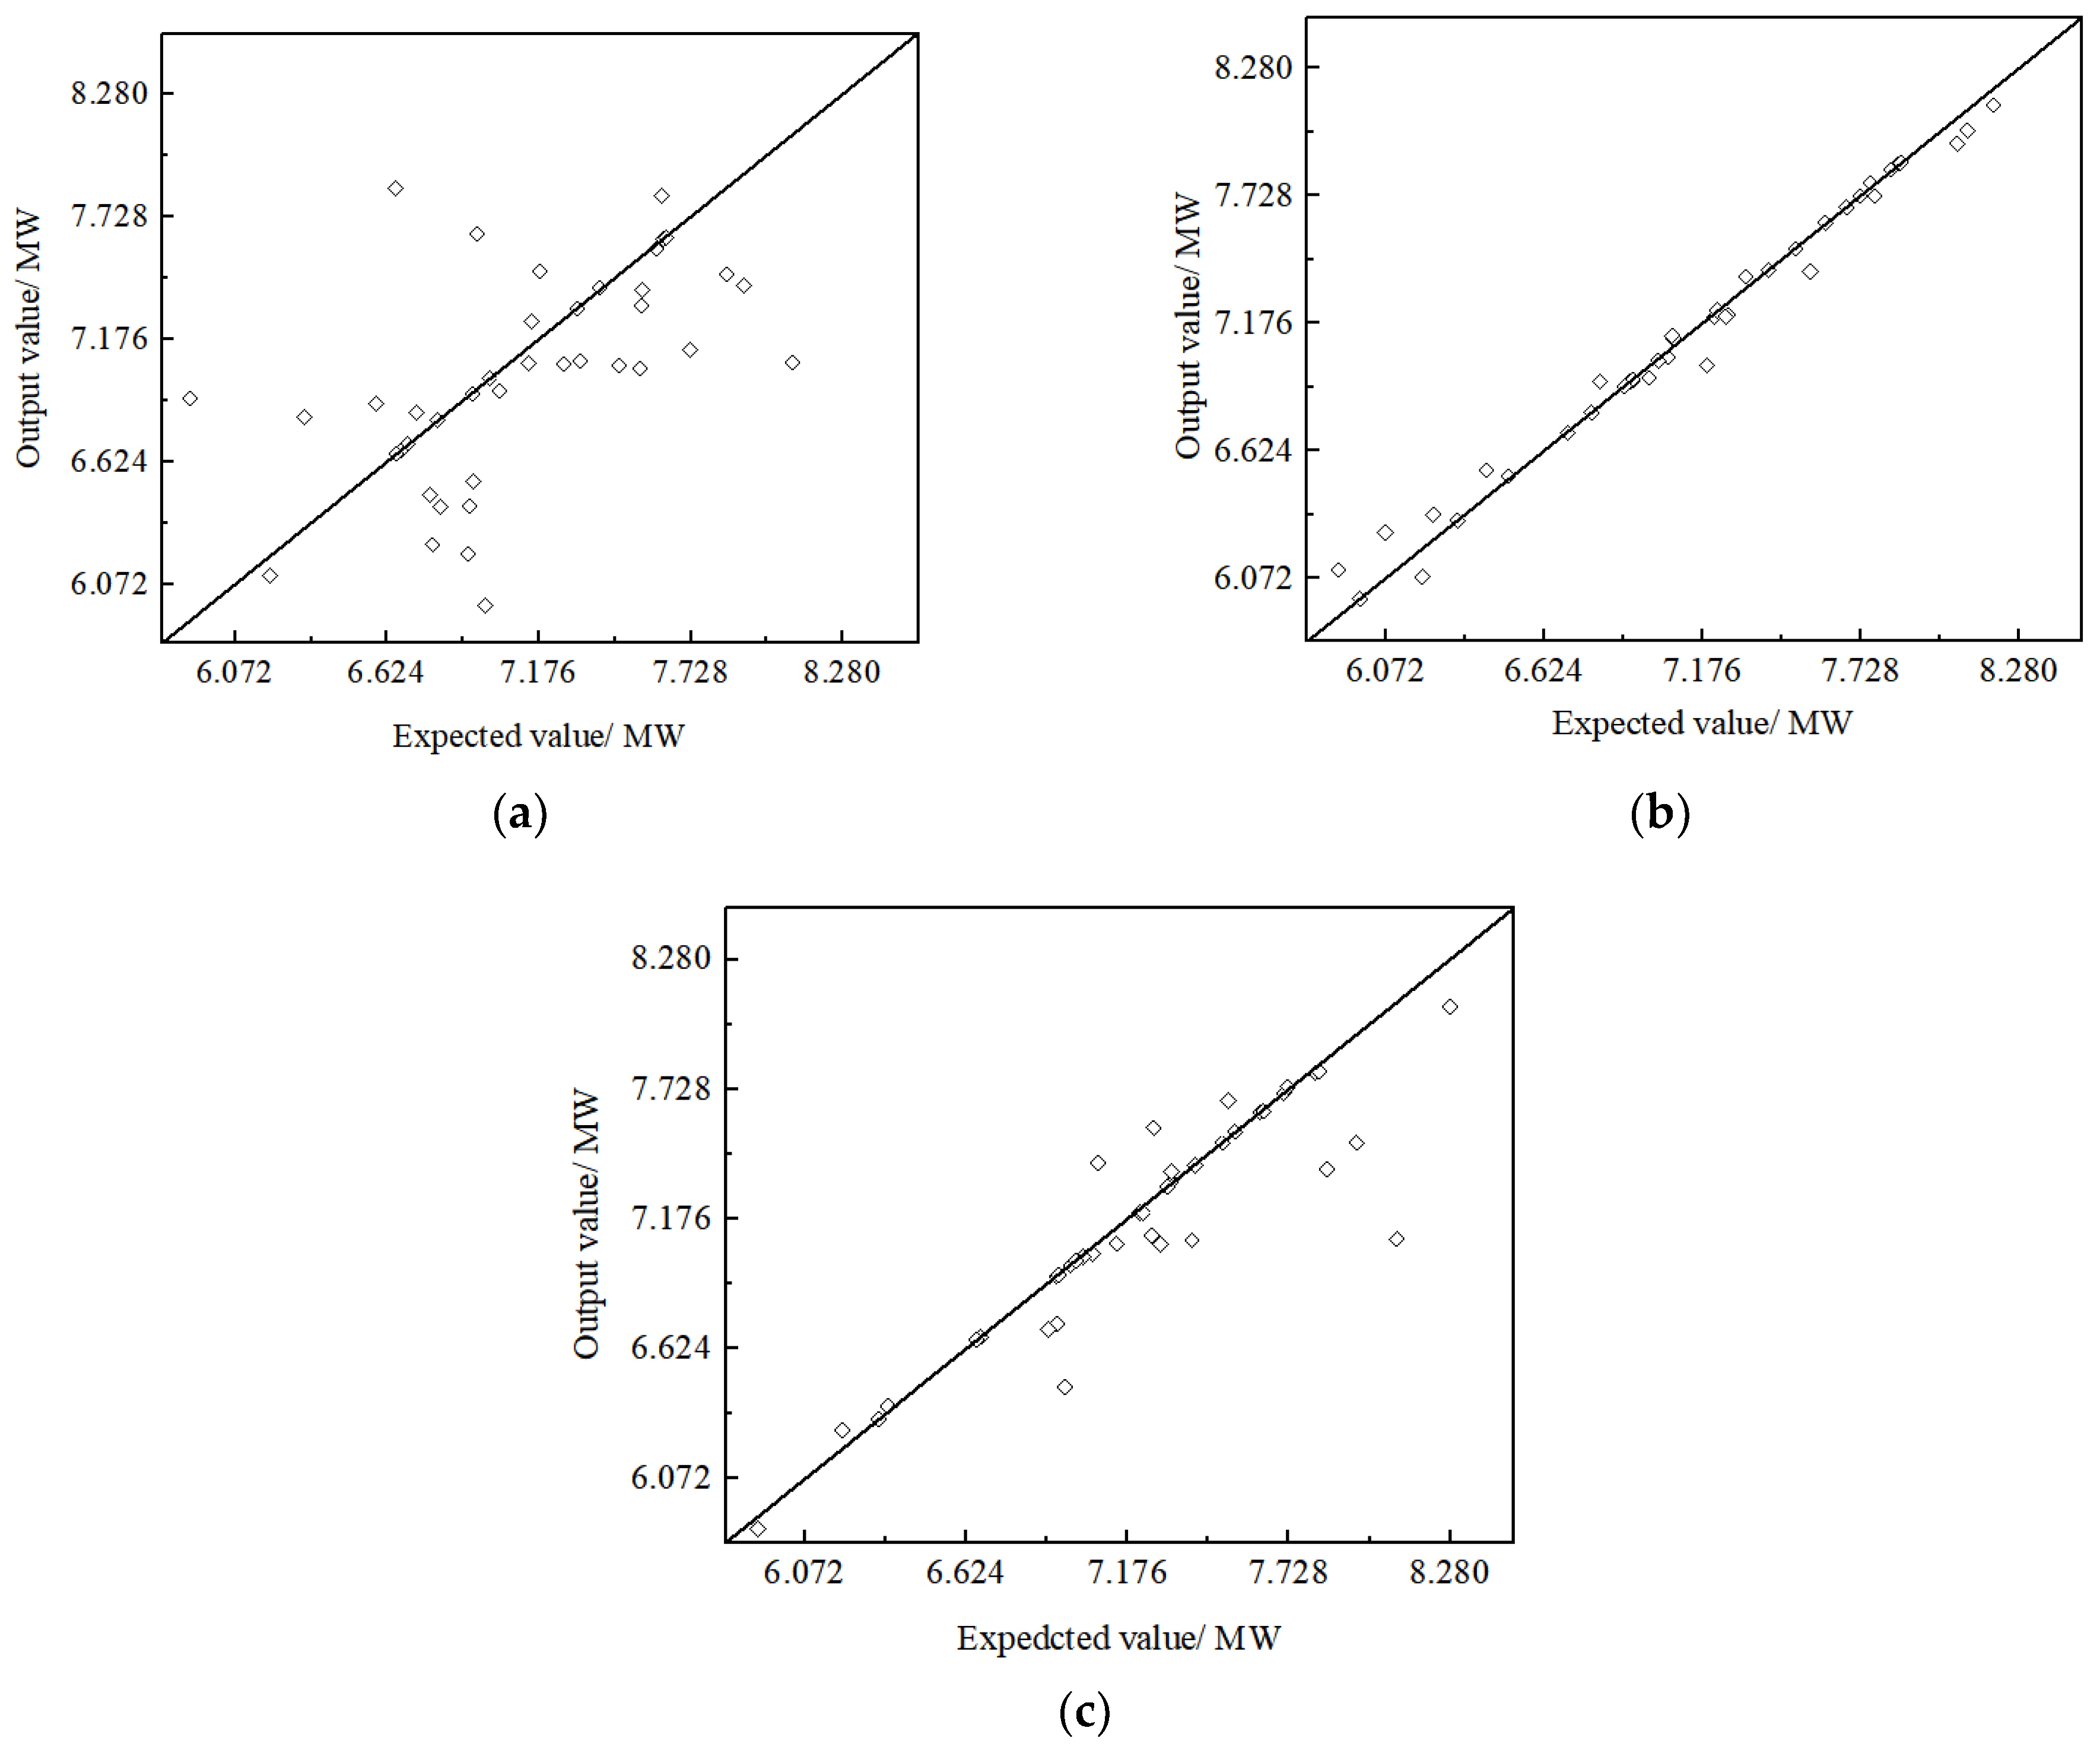
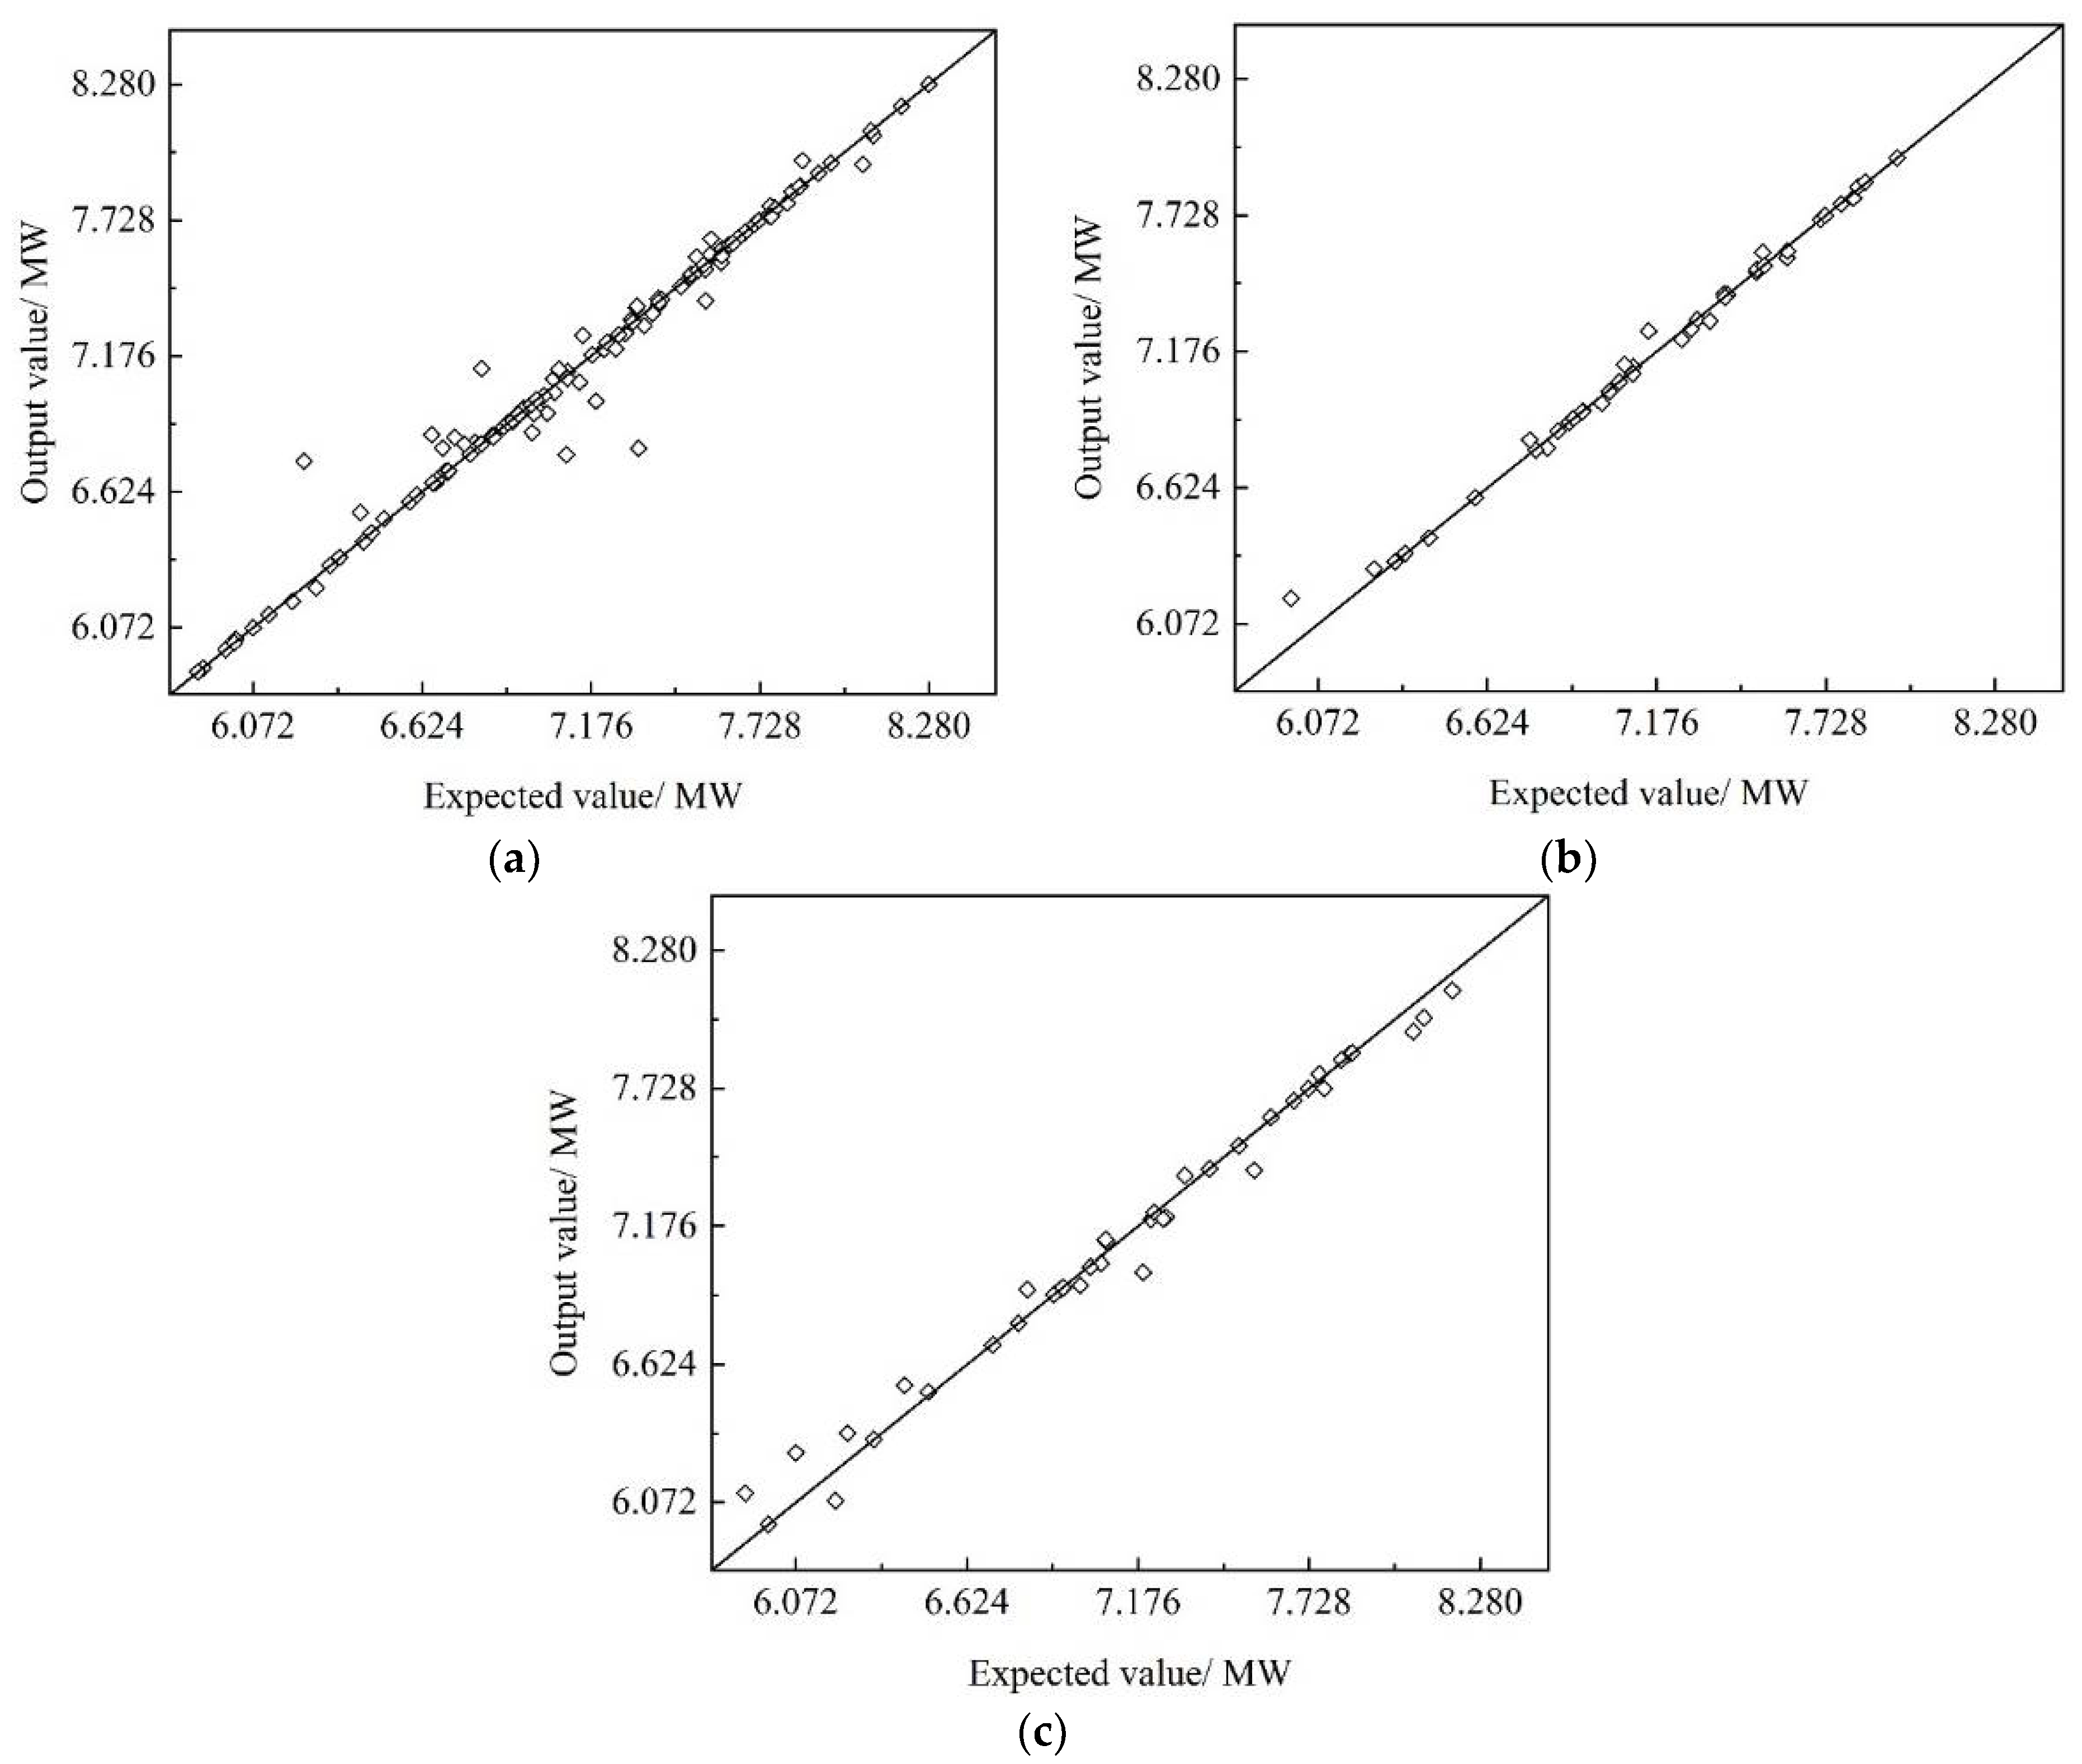
Figure 8 shows the comparison between the output value and expected output of RBFNN and the squares in Figure 8 represent the output values obtained by MATLAB. It can be observed from Figure 8 that the expected value and the output value of RBFNN are approximately linear, and the R2 of the training stage, verification stage, and test stage is 0.975, 0.962, and 0.933, respectively, indicating that the expected value and the output value are highly correlated. The RBFNN has high accuracy and reliability for predicting the energy consumption of the sour water stripping process.
3.2.2. Sensitivity Analysis of Sobol
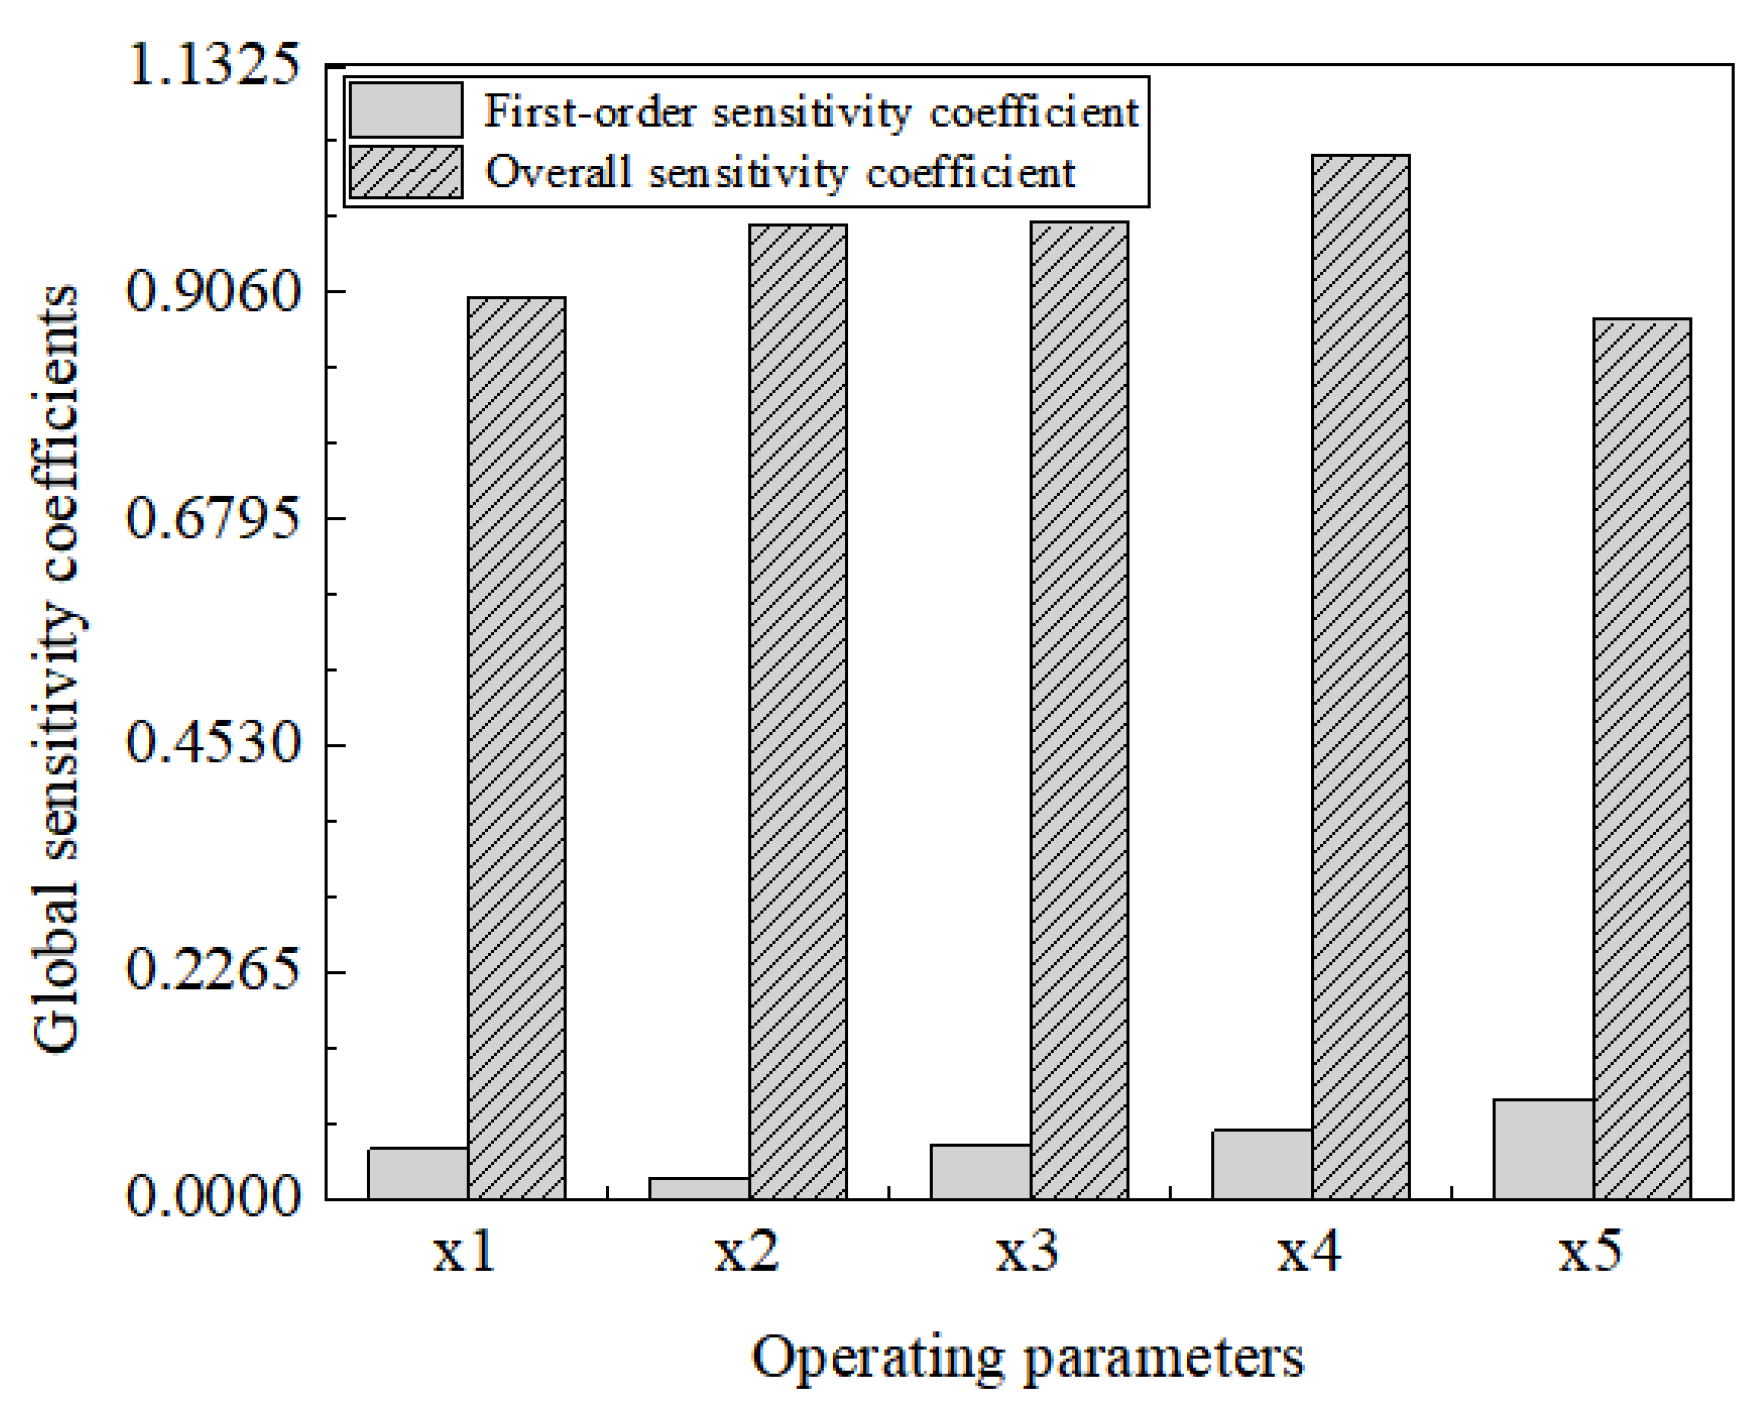
RBFNN is used to train, verify and test 200 groups of data, and the input and output matrices are obtained. The Sobol index method is used to analyze the input and output matrices, and then the first-order sensitivity coefficients and overall sensitivity coefficients of each operating parameter are obtained. In addition, the Sobol method is a convenient way to investigate the influence of parameter cross action. The first-order sensitivity coefficient reflects the effect of single parameter changes on the system energy consumption level, and the overall sensitivity coefficient not only reflects the influence of single parameter changes, but reflects the influence of interaction with other parameters changes. When the difference between the first-order sensitivity of a parameter and the overall sensitivity is large, the sensitivity suggests that there is an obvious interaction. In this study, x1, x2, x3, x4, and x5 represent the cold feed ratio, sideline production position, tower bottom pressure, hot feeding temperature, and cold feed temperature, respectively. Table 4 shows the first-order sensitivity and the overall sensitivity coefficient. Figure 8 is a histogram of the global sensitivity coefficient.
It can be observed from Table 4 and Figure 9 that the first-order sensitivity coefficient of cold feed temperature (x5) is high, which will have a great influence on the energy consumption of the stripper when it changes. In addition, the differences between the first-order sensitivity and the overall sensitivity of cold feed ratio (x1), sideline production position (x2), tower bottom pressure (x3), and hot feed temperature (x4) are 0.8509, 0.9536, 0.9220, and 0.9749, respectively, indicating that these parameters have obvious interactions with other parameters during analysis. Therefore, these variables are optimized using the PSO algorithm.
3.2.3. Energy Optimization by PSO
The PSO algorithm was used to optimize the weight and biases of the initial RBF model to minimize MSE. The PSO algorithm parameters are shown in Table 5. The model performance values are recorded in Table 6. Table 6 shows that the performance of the PSO-RBF model is superior to the RBF model and can be used to optimize system energy consumption.
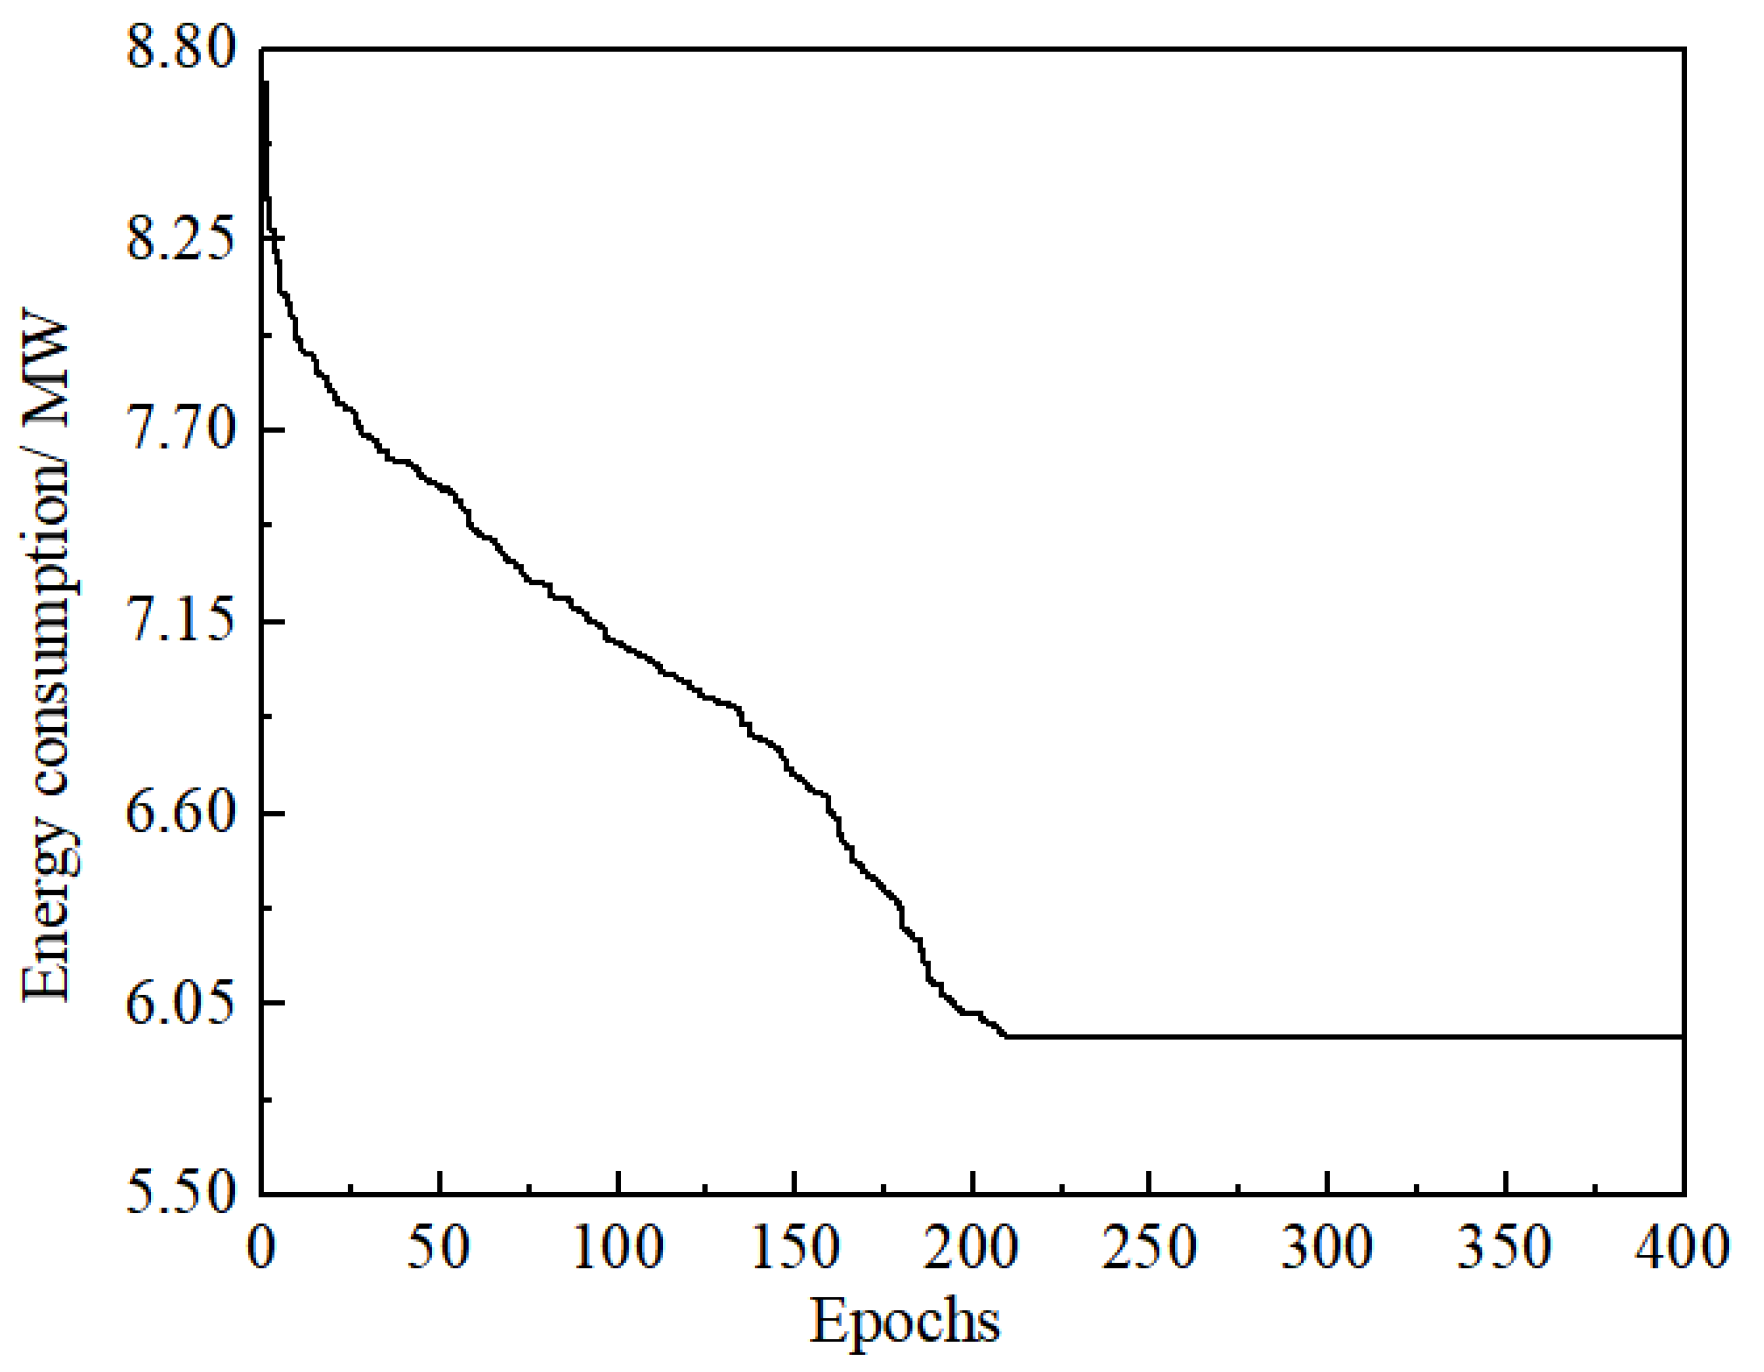
According to the above research content and aimed at the minimum energy consumption of the system, this paper uses MATLAB to generate a random input parameter matrix with a population of 200 particles and a dimension of each particle of 5 consistent with the Gaussian distribution to form the initial population through the randn () function. The PSO algorithm is used for global optimization, where particle fitness is calculated by the RBFNN prediction model. The termination conditions of the PSO algorithm include setting the maximum number of iterations, that is, when the number of iterations of particle evolution reaches 400, the iteration is stopped and optimization results are obtained, as shown in Figure 10.
As can be observed from Figure 10, the PSO-RBF model is used to optimize the energy consumption of the sour water stripping system; when the number of iterations reaches 210, the system energy consumption is 5.918 MW, which reaches the minimum level. Compared with 7.128 MW before optimization that is greatly reduced by 16.97%, the energy-saving effect is obvious. At this point, the cold feed ratio, sideline production position, tower bottom pressure, hot feed temperature, and cold feed temperature are 0.117, 18, 436 KPa, 146 °C, and 35 °C, respectively.
4. Conclusions
This paper mainly studied the energy consumption of sour water stripping systems. According to the study, the energy consumption of the unit will change when the operating parameters are changed. In addition, the energy consumption of the unit can be reduced by optimizing the operation parameters. Aspen Plus software is used to establish the basic mathematical model, and BPNN, RBFNN and GRNN models are established by MATLAB. Their MSEs are 0.2275, 0.0003, 0.1151 and R2 values are 0.529, 0.971 and 0.846, respectively. It can be concluded that the MSE of RBFNN approaches 0 and R2 approaches 1, so RBFNN is used for further research. The RBFNN structure is 5-66-1 and the MSEs of the training stage, verification stage and testing stage are 0.0007, 0.0008 and 0.0003, respectively, and R2 values are 0.975, 0.962 and 0.933, respectively. Therefore, the RBFNN has high accuracy and reliability for predicting the energy consumption of the sour water stripping process. According to the sensitivity analysis, although the first-order sensitivity coefficient of cold feed temperature(x5) is higher than that of other parameters, there is obvious interaction between each parameter, so all parameters must be optimized by the PSO algorithm. In the PSO algorithm, the optimal system energy consumption is obtained after 210 iterations, namely when the cold feed ratio, sideline production position, tower bottom pressure, hot feed temperature, and cold feed temperature are 0.117, 18, 436 kPa, 146 °C, and 35 °C, respectively; the system energy consumption is 5.918 MW, which is significantly reduced by 16.97 %.
Future work should be applied to production practice to verify the reliability of the research results.
Future research should further reduce system energy consumption by analyzing the various optimization algorithms to provide the most appropriate operating parameters for the sour water stripping process.
Author Contributions
Y.Z.: Wrote the original draft and completed the work with MATLAB. Z.F.: Conceptualization and supervision the whole project. G.J.: Simulation for the sour water stripping process. M.M.A.S.: Collected data and carried out data analysis. All authors have read and agreed to the published version of the manuscript.
Funding
This research was funded by China Scholarship Council, grant number: 201908610135 and 202208610064. And the APC was funded by Xi’an Shiyou University Graduate Student Innovation Practice Ability Training Program.
Institutional Review Board Statement
Not applicable.
Informed Consent Statement
Informed consent was obtained from all subjects involved in the study.
Data Availability Statement
Not applicable.
Acknowledgments
The authors thank Xi’an Shiyou University for the support of the Graduate Innovation and Practical Ability Training Program, and China Changqing Petrochemical Company for providing the relevant basic data in this paper. Z.F. and G.H.J. sincerely acknowledge the funding from China Scholarship Council.
Conflicts of Interest
The authors declare no conflict of interest.
References
- Liu, C.J.; Deng, J.Y.; Wen, S.C.; Li, C.W. Methods to improve the quality of water reuse and reduce energy consumption of acid water vapor extractor. J. Chem. Eng. Oil Gas 2015, 44, 116–121. [Google Scholar]
- Wei, J.H.; Zhang, H.W.; Li, Q.N.; Kang, J.; Li, W.S.; Xu, C.J. Optimization and application of water vapor extraction process of tail acid in Puguang Purification Plant. J. Chem. Eng. 2015, 43, 73–78. [Google Scholar]
- Zahid, U. Techno-economic evaluation and design development of sour water stripping system in the refineries. J. Clean. Prod. 2019, 236, 117633. [Google Scholar] [CrossRef]
- Kazemi, A.; Mehrabani-Zeinabad, A.; Beheshti, M. Development of a novel processing system for efficient sour water stripping. Energy 2017, 125, 449–458. [Google Scholar] [CrossRef]
- Wang, X.J.; Wang, Y.F. Process design of raw water pretreatment in acid water stripping unit of refinery. J. Shandong Chem. Ind. 2018, 47, 177–181. [Google Scholar]
- Ibrahim, S.; Rahman, R.; Raja, K. Effects of H2O in the feed of sulfur recovery unit on sulfur production and aromatics emission from claus furnace. J. Ind. Eng. Chem. Res. 2017, 56, 11713–11725. [Google Scholar] [CrossRef]
- Li, S.Z.; Li, X.Q.; Li, Z.H.; Zhou, D.; Liu, Q.; Wang, L. Process simulation and optimization of acid water stripper. J. Appl. Technol. 2019, 19, 48–51. [Google Scholar]
- Huang, Z.X. Cause analysis and measures of scale formation in single tower acid extraction water vapor stripping unit. J. Pet. Refin. Eng. 2018, 48, 7–11. [Google Scholar]
- Song, H.Y. Analysis on the cause of unqualified acid water vapor extraction in hydrogen production unit and its solution measures. J. Petroleum Process. Petrochem. 2017, 48, 79–82. [Google Scholar]
- Chardonneaua, M.; Ibrahim, S.; Gupta, A.; AlShoaibi, A. Role of Toluene and Carbon Dioxide on Sulfur Recovery Efficiency in a Claus Process. Energy Procedia 2015, 75, 3071–3075. [Google Scholar] [CrossRef] [Green Version]
- Li, N. New measures of energy saving and consumption reduction for acid water vapor stripping unit. J. Technol.-Econ. Petrochem. 2017, 33, 20–23. [Google Scholar]
- Fan, Z.C. Acid water vapor stripping device production technology. J. Shandong Chem. Ind. 2012, 41, 63–66. [Google Scholar]
- Gai, H.; Chen, S.; Lin, K.; Zhang, X.; Wang, C.; Xiao, M.; Huang, T.; Song, H. Conceptual design of energy-saving stripping process for industrial sour water. Chin. J. Chem. Eng. 2020, 28, 1277–1284. [Google Scholar] [CrossRef]
- Zahid, U.; Al-Qadri, A.; Al-Mousa, B.; Al-Nasser, A.; Ahmed, U. Design of a novel sour water stripping unit. Comput. Aided Chem. Eng. 2019, 46, 523–528. [Google Scholar] [CrossRef]
- Yu, X.W.; Li, Y.L.; Liu, F.Y.; Liu, W.K. Process simulation and energy consumption optimization of acid water stripping unit in refinery. J. Pet. Petrochem. Energy Sav. 2015, 5, 1–3. [Google Scholar]
- Tu, L. Energy saving optimization of Sour water single column pressurized side-line extraction stripping process. J. Henan Chem. Ind. 2021, 38, 36–38. [Google Scholar]
- Liu, Y.; Tu, Y.; Li, C.; Yang, C. Catalytic Cracking and PSO-RBF Neural Network Model of FCC Recycle Oil. J. China Pet. Proc. Petrochem. Technol. 2013, 15, 63–69. [Google Scholar]
- Alimoradi, H.; Soltani, M.; Shahali, P.; Moradi Kashkooli, F.; Larizadeh, R.; Raahemifar, K.; Adibi, M.; Ghasemi, B. Experimental Investigation on Improvement of Wet Cooling Tower Efficiency with Diverse Packing Compaction Using ANN-PSO Algorithm. Energies 2021, 14, 167. [Google Scholar] [CrossRef]
- Wang, T.; Zhang, S.; Chen, J. Low temperature charging performance optimization of lithium battery based on BP-PSO Algorithm. Energy Storage Sci. Technol. 2020, 9, 1940–1947. [Google Scholar]
- Ling, X.; Xu, L.; Yu, J.; Liang, R. Prediction of Corrosion Rate in Oil Pipeline Based on improved BP Neural Network. Sens. MicroSystem 2021, 40, 124–127. [Google Scholar]
- Rezaei, F.; Jafari, S.; Hemmati-Sarapardeh, A.; Mohammadi, A.H. Modeling of gas viscosity at high pressure-high temperature conditions: Integrating radial basis function neural network with evolutionary algorithms. J. Pet. Sci. Eng. 2021, 208, 109328. [Google Scholar] [CrossRef]
- Ding, Y.; Zhang, W.; Yu, L.; Lu, K. The accuracy and efficiency of GA and PSO optimization schemes on estimating reaction kinetic parameters of biomass pyrolysis. Energy 2019, 176, 582–588. [Google Scholar] [CrossRef]
- Zhou, H.; Chen, X.; Zhou, H.; Hu, R.; He, Y.B. Prediction of Outlet water Temperature in Intercooling tower Sector Based on GA-BP and PSO-BP Neural Network. J. Hunan Electr. Power 2021, 41, 6–11. [Google Scholar]
- Yousaf, S.; Mughees, A.; Khan, M.G.; Amin, A.A.; Adnan, M. A Comparative Analysis of Various Controller Techniques for Optimal Control of Smart Nano-Grid Using GA and PSO Algorithms. IEEE Access 2020, 8, 205696–205711. [Google Scholar] [CrossRef]
- Toghyani, S.; Ahmadi, M.H.; Kasaeian, A.; Mohammadi, A.H. Artificial neural network, ANN-PSO and ANN-ICA for modelling the Stirling engine. Int. J. Ambient Energy 2015, 37, 456–468. [Google Scholar] [CrossRef]
- Liu, J.; Jiang, Y.; Han, W.; Sakaguchi, O. Optimized ANN model for predicting rock mass quality ahead of tunnel face using measure-while-drilling data. Bull. Eng. Geol. Environ. 2021, 80, 2283–2305. [Google Scholar] [CrossRef]
- Wang, L. Optimization of continuous phase modulation training sequence based on improved PSO. J. Comput. Appl. Softw. 2020, 37, 227–231. [Google Scholar]
- Xiang, H.; Pu, H.; Wei, L. Optimization of C3+ light hydrocarbon recovery parameters in GSP process based on PSO algorithm. J. Nat. Gas Chem. Ind. 2020, 45, 70–74. [Google Scholar]
- Xie, Y.; Li, F. Simulation of Acid Water Extraction Based on Aspen Plus. J. Ji Suan Ji Yu Xian Dai Hua 2019, 12, 78–82. [Google Scholar]
- Zhao, C. Introduction of a Useful Industrial Flowsheet Simulation Program, ASPEN PLUS. J. Power Syst. Eng. 2003, 2003, 56–58. [Google Scholar]
- Fan, Z.; Jing, G.; Liu, Z.; Ling, L.; Tian, R.Z.; Ji, P.P.; Li, W.J.; Liu, Y.J. Energy-saving optimization of acid water stripping unit. J. Chem. Eng. 2020, 48, 73–78. [Google Scholar]
- Soares, A.D.F.; Penteado, E.D.; Diniz, A.A.R.; Komesu, A. Influence of operational parameters in sour water stripping process in effluents treatment. J. Water Process Eng. 2021, 41, 102012. [Google Scholar] [CrossRef]
- Ho, C.D.; Chen, Y.H.; Chang, C.M.; Chang, H. Evaluation of Process Control Schemes for Sour Water Strippers in Petroleum Refining. Processes 2021, 9, 363. [Google Scholar] [CrossRef]
- Jia, J.; Kui, X.; Zeng, W.; Xue, J.Z.; Liao, Y.G. Simulation Optimization of Acid Water Vapor Extraction Device Based on Aspen Plus. J. Energy Chem. Ind. 2021, 42, 72–76. [Google Scholar]
- Huang, Z.X.; Geng, Q.G. Analysis and countermeasures of common problems in acid water tank water seal tank of acid water vapor stripping unit. J. Pet. Refin. Eng. 2016, 46, 40–43. [Google Scholar]
- Al-Assadi, M.; El Kadi, H.A.; Deiab, I. Using Artificial Neural Networks to Predict the Fatigue Life of Different Composite Materials Including the Stress Ratio Effect. Appl. Compos. Mater. 2010, 18, 297–309. [Google Scholar] [CrossRef]
- Ghritlahre, H.K.; Prasad, R.K. Investigation of thermal performance of unidirectional flow porous bed solar air heater using MLP, GRNN, and RBF models of ANN technique. Therm. Sci. Eng. Prog. 2018, 6, 226–235. [Google Scholar] [CrossRef]
- Chen, Y.; Shen, L.; Li, R.; Xu, X.; Hong, H.; Lin, H.; Chen, J. Quantification of interfacial energies associated with membrane fouling in a membrane bioreactor by using BP and GRNN artificial neural networks. J. Colloid Interface Sci. 2020, 565, 1–10. [Google Scholar] [CrossRef]
- Wang, R.; Li, W. Optimization Design of Mine Hoist Control System Parameters Based on Improved PSO. J. Coal Mine Mach. 2020, 41, 20–22. [Google Scholar]
- Pant, P.; Chatterjee, D. Prediction of clad characteristics using ANN and combined PSO-ANN algorithms in laser metal deposition process. Surf. Interfaces 2020, 21, 100699. [Google Scholar] [CrossRef]
- Yadav, R.K.; Anubhav, A. PSO-GA based hybrid with Adam Optimization for ANN training with application in Medical Diagnosis. J. Cogn. Syst. Res. 2020, 64, 191–199. [Google Scholar] [CrossRef]
- Rostami, M.; Forouzandeh, S.; Berahmand, K.; Soltani, M. Integration of multi-objective PSO based feature selection and node centrality for medical datasets. Genomics 2020, 112, 4370–4384. [Google Scholar] [CrossRef] [PubMed]
- Fan, Z.; Tian, R.Z.; Lin, L.; Han, Y.Z.; Guo, Y.; Dou, L.L.; Jing, G.H.; Tyoor, A.D. Desulfurization optimization of reforming catalytic dry gas using radial basis artificial neural network based on PSO algorithm. J. Chem. Prog. 2021, 40, 3107–3118. [Google Scholar]
Figure 1.
Simulation diagram of sour water stripping process. (V-3501: flash tank; P-3501A/B: pump; T-3501: stripper; E-3501A/B, E-3504A-F, E-3503, E-3505: heat exchanger; E-3510: reboiler).
Figure 1.
Simulation diagram of sour water stripping process. (V-3501: flash tank; P-3501A/B: pump; T-3501: stripper; E-3501A/B, E-3504A-F, E-3503, E-3505: heat exchanger; E-3510: reboiler).

Figure 2.
The schematic diagram of neural network structure.

Figure 3.
Optimization flow chart based on PSO.

Figure 4.
Sample bases. (a) The relationship between cold feed ratio and the position of sideline production position and energy consumption; (b) the relationship between cold feed ratio and bottom pressure and energy consumption; (c) the relationship between hot feed temperature and cold feed temperature and energy consumption.


Figure 5.
Accuracy and reliability of BPNN, RBFNN, and GRNN models. (a) BPNN model; (b) RBFNN model; (c) GRNN model.
Figure 5.
Accuracy and reliability of BPNN, RBFNN, and GRNN models. (a) BPNN model; (b) RBFNN model; (c) GRNN model.

Figure 6.
Determination of the number of hidden layer nodes.

Figure 7.
The performance of RBFNN. (a) Training stage; (b) validation stage; (c) testing stage.

Figure 8.
Comparison between the expected value and the true value of RBFNN. (a) Training stage; (b) validation stage; (c) testing stage.
Figure 8.
Comparison between the expected value and the true value of RBFNN. (a) Training stage; (b) validation stage; (c) testing stage.

Figure 9.
Global sensitivity coefficient of operating parameters.

Figure 10.
Result of process energy optimization.


Table 1.
Calculation results of main logistics parameters of sour water stripper.
| Flow | Temperature °C | Pressure kPa | Flow Rate kg/h | Content /%(W/W) | |||
|---|---|---|---|---|---|---|---|
| CO2 | NH3 | H2S | H2O | ||||
| Sour water (S1) | 58.6 | 2000 | 68830.0 | 0.1793 | 0.7122 | 0.4010 | 98.7075 |
| Cold feed (S6) | 38.0 | 1500 | 9948.0 | 0.1793 | 0.7122 | 0.4010 | 98.7075 |
| The top of tower (S7) | 53.26 | 430 | 73.88 | 30.3881 | 5.2379 | 62.818 | 0.1556 |
| Hot feed (S11) | 145.0 | 1500 | 58882.0 | 0.1793 | 0.7122 | 0.4010 | 98.7075 |
| The bottom of tower (S14) | 184.53 | 450 | 62199.9 | 0.0019 | 0.0013 | 0.0237 | 99.9731 |
| Sideline (S15) | 143.23 | 440 | 6556.22 | 0.0117 | 99.1021 | 0.3867 | 0.4995 |
Table 2.
Operation parameters.
| Parameters | Value |
|---|---|
| Cold feed ratio | 0.1~0.18 |
| Sideline production position | 16~23 |
| Tower bottom pressure/kPa | 427~456 |
| The temperature of hot feed/°C | 139~153 |
| Cold feed temperature/°C | 24~39 |
Table 3.
The result of ANNs.
| Types | MSE | R2 |
|---|---|---|
| BPNN | 0.2275 | 0.529 |
| RBFNN | 0.0003 | 0.971 |
| GRNN | 0.1151 | 0.846 |
Table 4.
Global sensitivity coefficients.
| Operating Parameters | The First-Order Sensitivity Coefficient | The Overall Sensitivity Coefficient | Difference |
|---|---|---|---|
| Cold feed ratio (x1) | 0.0489 | 0.8998 | 0.8509 |
| Sideline production position (x2) | 0.0196 | 0.9732 | 0.9536 |
| Bottom pressure (x3) | 0.0530 | 0.9750 | 0.9220 |
| Hot feed temperature (x4) | 0.0675 | 1.0424 | 0.9749 |
| Cold feed temperature (x5) | 0.0988 | 0.8784 | 0.7796 |
Table 5.
PSO algorithm parameters.
| Parameters | Value |
|---|---|
| c1 | 1.5 |
| c2 | 1.5 |
| Epochs | 400 |
| Population | 200 |
| Inertia weightω | 0.6 |
| Pmax | 5 |
| Pmin | −5 |
| Vmax | 1 |
| Vmin | −1 |
Table 6.
Prediction performance results of the RBF and PSO-RBF models.
| Models | Stage | R2 | MSE |
|---|---|---|---|
| RBF | Training | 0.975 | 0.000703 |
| Validation | 0.962 | 0.000811 | |
| Testing | 0.933 | 0.000347 | |
| PSO-RBF | Training | 0.981 | 0.000694 |
| Validation | 0.968 | 0.000786 | |
| Testing | 0.954 | 0.000227 |
Publisher’s Note: MDPI stays neutral with regard to jurisdictional claims in published maps and institutional affiliations. |
© 2022 by the authors. Licensee MDPI, Basel, Switzerland. This article is an open access article distributed under the terms and conditions of the Creative Commons Attribution (CC BY) license (https://creativecommons.org/licenses/by/4.0/).
Share and Cite
MDPI and ACS Style
Zhang, Y.; Fan, Z.; Jing, G.; Saif, M.M.A. Optimization of Sour Water Stripping Unit Using Artificial Neural Network–Particle Swarm Optimization Algorithm. Processes 2022, 10, 1431. https://0-doi-org.brum.beds.ac.uk/10.3390/pr10081431
AMA Style
Zhang Y, Fan Z, Jing G, Saif MMA. Optimization of Sour Water Stripping Unit Using Artificial Neural Network–Particle Swarm Optimization Algorithm. Processes. 2022; 10(8):1431. https://0-doi-org.brum.beds.ac.uk/10.3390/pr10081431
Chicago/Turabian StyleZhang, Ye, Zheng Fan, Genhui Jing, and Mohammed Maged Ahemd Saif. 2022. "Optimization of Sour Water Stripping Unit Using Artificial Neural Network–Particle Swarm Optimization Algorithm" Processes 10, no. 8: 1431. https://0-doi-org.brum.beds.ac.uk/10.3390/pr10081431
Note that from the first issue of 2016, this journal uses article numbers instead of page numbers. See further details here.