Article

Statistical Optimization of Pyrolysis Process for Thermal Destruction of Plastic Waste Based on Temperature-Dependent Activation Energies and Pre-Exponential Factors

by
Ali O. Alqarni
1,
Rao Adeel Un Nabi
2,
Faisal Althobiani
3,*,
Muhammad Yasin Naz
2,*,
Shazia Shukrullah
2,
Hassan Abbas Khawaja
4,
Mohammed A. Bou-Rabee
5,
Mohammad E. Gommosani
6,
Hesham Abdushkour
3,6,
Muhammad Irfan
7 and
Mater H. Mahnashi
1
1
Department of Pharmaceutical Chemistry, College of Pharmacy, Najran University, Najran 61441, Saudi Arabia
2
Department of Physics, University of Agriculture, Faisalabad 38040, Pakistan
3
Faculty of Maritime Studies, King Abdulaziz University, Jeddah 22254, Saudi Arabia
4
Department of Automation and Process Engineering, UiT The Arctic University of Norway, 9019 Tromsø, Norway
5
Department of Electrical Engineering, College of Technical Studies, PAAET, Safat 13092, Kuwait
6
Nautical Science Department, Faculty of Maritime Studies, King Abdulaziz University, Jeddah 22254, Saudi Arabia
7
Electrical Engineering Department, College of Engineering, Najran University Saudi Arabia, Najran 61441, Saudi Arabia
*
Authors to whom correspondence should be addressed.
Submission received: 7 July 2022 / Revised: 23 July 2022 / Accepted: 28 July 2022 / Published: 9 August 2022
(This article belongs to the Special Issue Converting Plastic Waste into Useful Products)

Abstract

:
The massive increase in disposable plastic globally can be addressed through effective recovery methods, and one of these methods is pyrolysis. R software may be used to statistically model the composition and yield of pyrolysis products, such as oil, gas, and waxes to deduce an effective pyrolysis mechanism. To date, no research reports have been documented employing the Arrhenius equation in R software to statistically forecast the kinetic rate constants for the pyrolysis of high-density plastics. We used the Arrhenius equation in R software to assume two series of activation energies (Ea) and pre-exponential factors (Ao) to statistically predict the rate constants at different temperatures to explore their impact on the final pyrolysis products. In line with this, MATLAB (R2020a) was used to predict the pyrolysis products of plastic in the temperature range of 370–410 °C. The value of the rate constant increased with the temperature by expediting the pyrolysis reaction due to the reduced frequency factor. In both assumed series of Ea and Ao, a significantly larger quantity of oil (99%) was predicted; however, the number of byproducts increased in the first series analysis compared to the second series analysis. It was revealed that an appropriate combination of Ea, Ao, and the predicted rate constants could significantly enhance the efficiency of the pyrolysis process. The major oil recovery in the first assumed series occurred at 390 °C to 400 °C, whereas the second assumed series of Ea and Ao occurred at 380 °C to 390 °C. In the second series at 390 °C to 400 °C, the predicted kinetic rate constants behaved aggressively after 120 min of the pyrolysis process. The second assumed series and anticipated rate constants at 380 °C to 390 °C can be applied commercially to improve oil production while saving energy and heat.

1. Introduction

High-density plastic (HDPE) is a petroleum-based polymeric material that is among the most efficient plastic polymers available today. The management of polymer waste is a growing challenge that impacts the human health environment. Only 9% of plastic garbage is recycled, while 60% is sent to landfills and burnt. The burning of plastic waste and fossil fuels has a harmful influence on both human and marine life health. Instead of landfilling and burning this waste, it can be used to generate valuable resources, since plastic contains hydrocarbons such as oil, light diesel, carbon, and gases. In this context, new eco-friendly ways for dealing with or recycling plastic rubbish into valuable goods are critical for maintaining our ecology and planet. Multiple solutions have been proposed to reduce the rising amount of plastic waste but the recycling of this waste into products with added-value is the most viable solution. Plastic waste pyrolysis is preferred over other methods due to its commercial-scale potential. However, an optimal combination of the temperature and rate constants for chemical kinetics is a prerequisite for understanding the relevant chemical reaction and process parameters for efficiently converting plastic waste into valuable products. These factors significantly affect the quality and yield of the intended products by reducing the byproducts.
Plastics may be pyrolyzed or thermally converted into gaseous and liquid fuels using a heating chamber [1,2]. The polymers must first be broken [3] and then heated utilizing an endothermic process to be pyrolyzed. Pyrolysis can be conventional or microwave-assisted, depending on the type of heat employed [4]. Systematic experimental and numerical testing is required to anticipate the physicochemical parameters of pyrolysis products [5]. The lack of research on the statistical optimization of rate constants for the effective pyrolysis of wastes, particularly plastic waste, impedes the commercial scale valorization of such materials. To ensure the maximum output and high selectivity of the products, the process parameters should be statistically tailored using appropriate statistical models. Using the Arrhenius law, the type and number of primary products, such as oil, gas, and waxes, can be statistically approximated in R software. There have been no previous studies published on the statistical prediction of rate constants for the pyrolysis of plastics in R software. We are the first to use R software to develop a statistical model for predicting statistical kinetic rate constants.
Numerous studies have used various numerical methodologies to optimize the pyrolysis of plastic waste to obtain fuel-grade products. The loading and unloading behavior of HDPE was researched by Dusunceli et al. [6]. The findings of the creep tests demonstrated that the amount of load applied to the sample contributed to an increase in the measured creep strain. In the relaxation experiments, increasing the intensity of tension resulted in a larger stress reduction than any prior level of tension. This was the case regardless of the amount of tension that had been attempted before. The amount of strain present in the visco-plastic region did not affect the stress measured across the area. The visco-plasticity of the overstress model outperformed the Boyce model regarding modeling capabilities across the board for the various material behaviors that were investigated [7]. The Boyce model was successfully applied to high strain levels; however, it was not applicable when used at low strain levels. Levine et al. [8] predicted a comparable level of product improvement for a range of commodities by using the randomized split (RS) method. A dynamic relationship between the key chemical pathways that resulted in the creation of Low municipal waste plastic (LMWP) was investigated using net rate analysis. It was discovered that both the RS and BB routes play a vital role in producing LMWP; however, the RS pathway is much more prevalent based on the net rates of the end-chain radical reactions [9,10]. Another study was focused on the kinetic properties of high-density polyethylene through thermogravimetric analysis (TGA) [11]. The Coats–Redfern approach, which assumes first-order kinetics, was used to analyze the non-isothermal data. According to the results of TGA, the activation energies increased as a function of both the pyrolysis temperature and the volume flow rate of the injected nitrogen [12]. Thus, when studying TGA kinetics under non-isothermal conditions, low heating and nitrogen flow rates should be considered. According to calculations made using a semi-batch reactor under isothermal circumstances, the activation energies of carbon 14 and carbon 30 were 116.68 kilojoules per mole and 226.96 kilojoules per mole, respectively. The total activation energy was 113.17 kilojoules per mole [13]. Under non-isothermal conditions, it was possible to lower the total activation energies to 65.04 and 82.29 KJ mol−1. This shift in kinetics could be attributed to insufficient heat transmission and a difficult breakdown process [14]. The addition of metallic particles to the mixture resulted in a significantly higher heat transfer rate, which in turn significantly accelerated the reaction rate [15].
Safadi et al. [16] used a population-balance model in conjunction with an innovative modeling strategy (a lumped-empirical model). The primary goal of this method was to decrease the number of problems that need to be solved while maintaining the accuracy of the model. There were five major lumps in the routing model, including the polymer itself. During the pyrolysis of HDPE at 420 °C, it was discovered that the paired models were effective in distinguishing 181 different species [17]. The model performed well when used for condensed alkanes but performed even better when applied to alkenes. It was demonstrated that the lack of branching, cyclization, aromatization and weak bond reactions in the stated reaction equations were responsible for some of the data discrepancies [18]. Liu et al. [19] used simulated trajectories as their primary method. It was determined that end-chain scission is a significant contributor to ethylene production [20]. It was observed that the synthesis of higher olefins requires the severing of a mid-chain at some point throughout the process. The high temperatures led to the discovery of many hydrogen-shift processes [21]. The hydrogen shift reaction and the following scission were the primary routes that led to propylene production. Cyclization, the breakdown of H2 molecules, and branching were all identified simultaneously as the other processes [22]. To provide a qualitative indication of the outcomes, the use of ReaxFF MD simulation in combination with VARMD’s automated creation of correct chemical reactions was helpful in gasifying HDPE [23]. Oisin et al. [24] conducted research on pyrolysis through ReaxFF simulation. An HDPE model consisting of 8 PE chains and 7216 atoms was developed during the simulation. It was found that the maximum number of waxes were produced at higher temperatures, indicating the formation of a large number of alkaline components [25]. Mortezaeikia et al. [26] examined a mechanical model for the pyrolysis of HDPE using moment methods. The model had 151 different species and 11,000 different responses. The experimental data for the pyrolytic model was compared to HDPE when it was heated to 420 °C [27]. It was discovered that the molar yields of the condensable LMW products were incredibly consistent with the previously published data; however, the molar yields of gaseous LMW products were found to be less consistent with the previously collected information.
In this work, we evaluate the impacts of temperature on the final product by optimizing a series of activation energies and pre-exponential or frequency factors. A rarely researched method, Arrhenius equation in R software, was used to statistically forecast the kinetic rate constants for the thermal valorization of HDPE waste. Two series of activation energies and pre-exponential factors were assumed to predict the rate constants in the temperature range from 370–410 °C.

2. Work Layout

The Arrhenius Equation (1) was used to assume two series of activation energies and pre-exponential factors to predict the rate constants as follows:
k = A o × e Ea R (   T 1 T 2 )
where, k is the rate constant; Ao is the pre-exponential or frequency factor; Ea is the activation energy; R is the general gas constant, which is 8.134 J/K-mol; and T is the absolute temperature. Equation (1) can also be written in a logarithmic form as:
ln(k) = ln (Ao) − Ea/RT
A graphical illustration of the best fit for a relation between T, Ea, and Ao is provided below in Figure 1. The reactants must have sufficient energy to overcome a reaction barrier for the reaction to continue. The distribution of energy inside a system of particles may be used to define the temperature of the system. When the temperature is high, a large number of particles have enough energy to cross the barrier. The rate constant varies with temperature, because when the temperature of a reaction is raised, the rate of the process often rises. The Arrhenius equation predicts that the rate constant will increase when the temperature is raised. The value of the exponential component of the equation will become less negative as T continues to rise, which will increase the value of k.
The 23s solver for ordinary differential equations (ODE) was used to solve the model equations in MATLAB (R2020a). When the conditions for the pyrolysis process are satisfied, the light wax with the reaction the constant k1, oil with reaction constant k2, gas with reaction constant k3, and heavy wax with reaction constant k4 are the dominating products. Free radicals also convert light wax to oil with a reaction constant of k5, light wax to gas with a reaction constant of k6, heavy wax to gas with a reaction constant of k8, and heavy wax to oil with a reaction constant of k9. Additionally, Figure 2 shows that some part of the oil transforms straight into a gas with the reaction constant k7 [28].
The R software is used to assume two series of activation energies to calculate the frequency factor, which is required to calculate the statistically predicted rate constants. Table 1 and Table 2 represent both the assumed Ea and Ao as well as the statistically predicted rate constants. The entire process has been graphically illustrated in Figure 3.

3. Analysis of Statistically Predicted Rate Constants at 370 °C to 380 °C

For both series of activation energies, when the temperature is between 370 °C and 380 °C, just a small amount of HDPE (3%) remained after 18 min of the process. When the light and heavy waxes created at the start of the process were fully consumed, the oil and gas production decreased dramatically. The percentages of heavy and light wax after 11 min of the process were 35% and 1%, respectively, for the first assumed series of Ea and Ao and were 26% and 2% for the second assumed series of Ea and Ao. The oil yield remained 57%, 81%, and 92% after 1, 2, and 3 h of the process time for the first series and 63%, 86%, and 94% for the second assumed series of Ea and Ao. Similarly, the gas yield was 32%, 16%, and nearly 7% for the first assumed series and 32%, 16%, and 7% for the second assumed series after 1, 2, and 3 h of process time, as shown in Figure 4.

4. Analysis of Statistically Predicted Rate Constants at 380 °C to 390 °C

Table 3 and Table 4 show the expected rate constants for when the temperature was increased from 380 °C to 390 °C for both series combinations of Ea and Ao. At this temperature, the production of light wax was maintained at the same level for both series, but the production of heavy wax declined by 34% for the first assumed series and 22% for the second assumed series of Ea and Ao. The production of oil yield remained 72%, 91%, and 97% for the first assumed series of Ea and Ao, and 77%, 94%, and 98% for the second assumed series of Ea and Ao during a period of 1, 2, and 3 h, respectively. On the other hand, it was discovered that the production of gas during the same time dropped to 23%, 7%, and 2% for the first series and 22%, 6%, and almost 1% for the second assumed series of Ea and Ao, as shown in Figure 5.

5. Analysis of Statistically Predicted Rate Constants at 390 °C to 400 °C

Table 5 and Table 6 show the predicted rate constants for temperatures in the range of 390 °C to 400 °C for the assumed series of Ea and Ao. The quantity of light wax was predicted to be about 2% for both series of Ea and Ao, while the percentage of heavy wax was predicted to be about 32% for the first assumed series and 27% for the second assumed series of Ea and Ao. The oil yield was found to be 84%, 97%, and 99% for the first assumed series after 1, 2, and 3 h. An interesting trend was found in the production of oil in the case of the second assumed series. The oil yield increased to 84%, 97%, and 99% for the first assumed series after 1, 2, and 3 h. An about 88% oil yield was obtained during the first hour of the pyrolysis process for the second series. This indicates that high temperatures significantly affected the oil yield, especially in the case of the second assumed series. The gas yield, on the other hand, revealed a decreasing trend. The gas yield was predicted to be about 14% and 11% for the first and second assumed series, respectively, during the first hour, as shown in Figure 6.

6. Effect of Time on Statistically Predicted Rate Constants

All the predicted rate constants from the first and second series are listed in Table 7 and Table 8, respectively. Both the experimental and statistical approaches first involved the cracking of HDPE into smaller particles, which transformed them into heavy and lighter waxes. The oil and gas production dropped substantially when the light and heavy waxes developed during the conversion process were consumed [29]. The time-dependent conversion of plastic into oil, gas, and waxes is reported in 
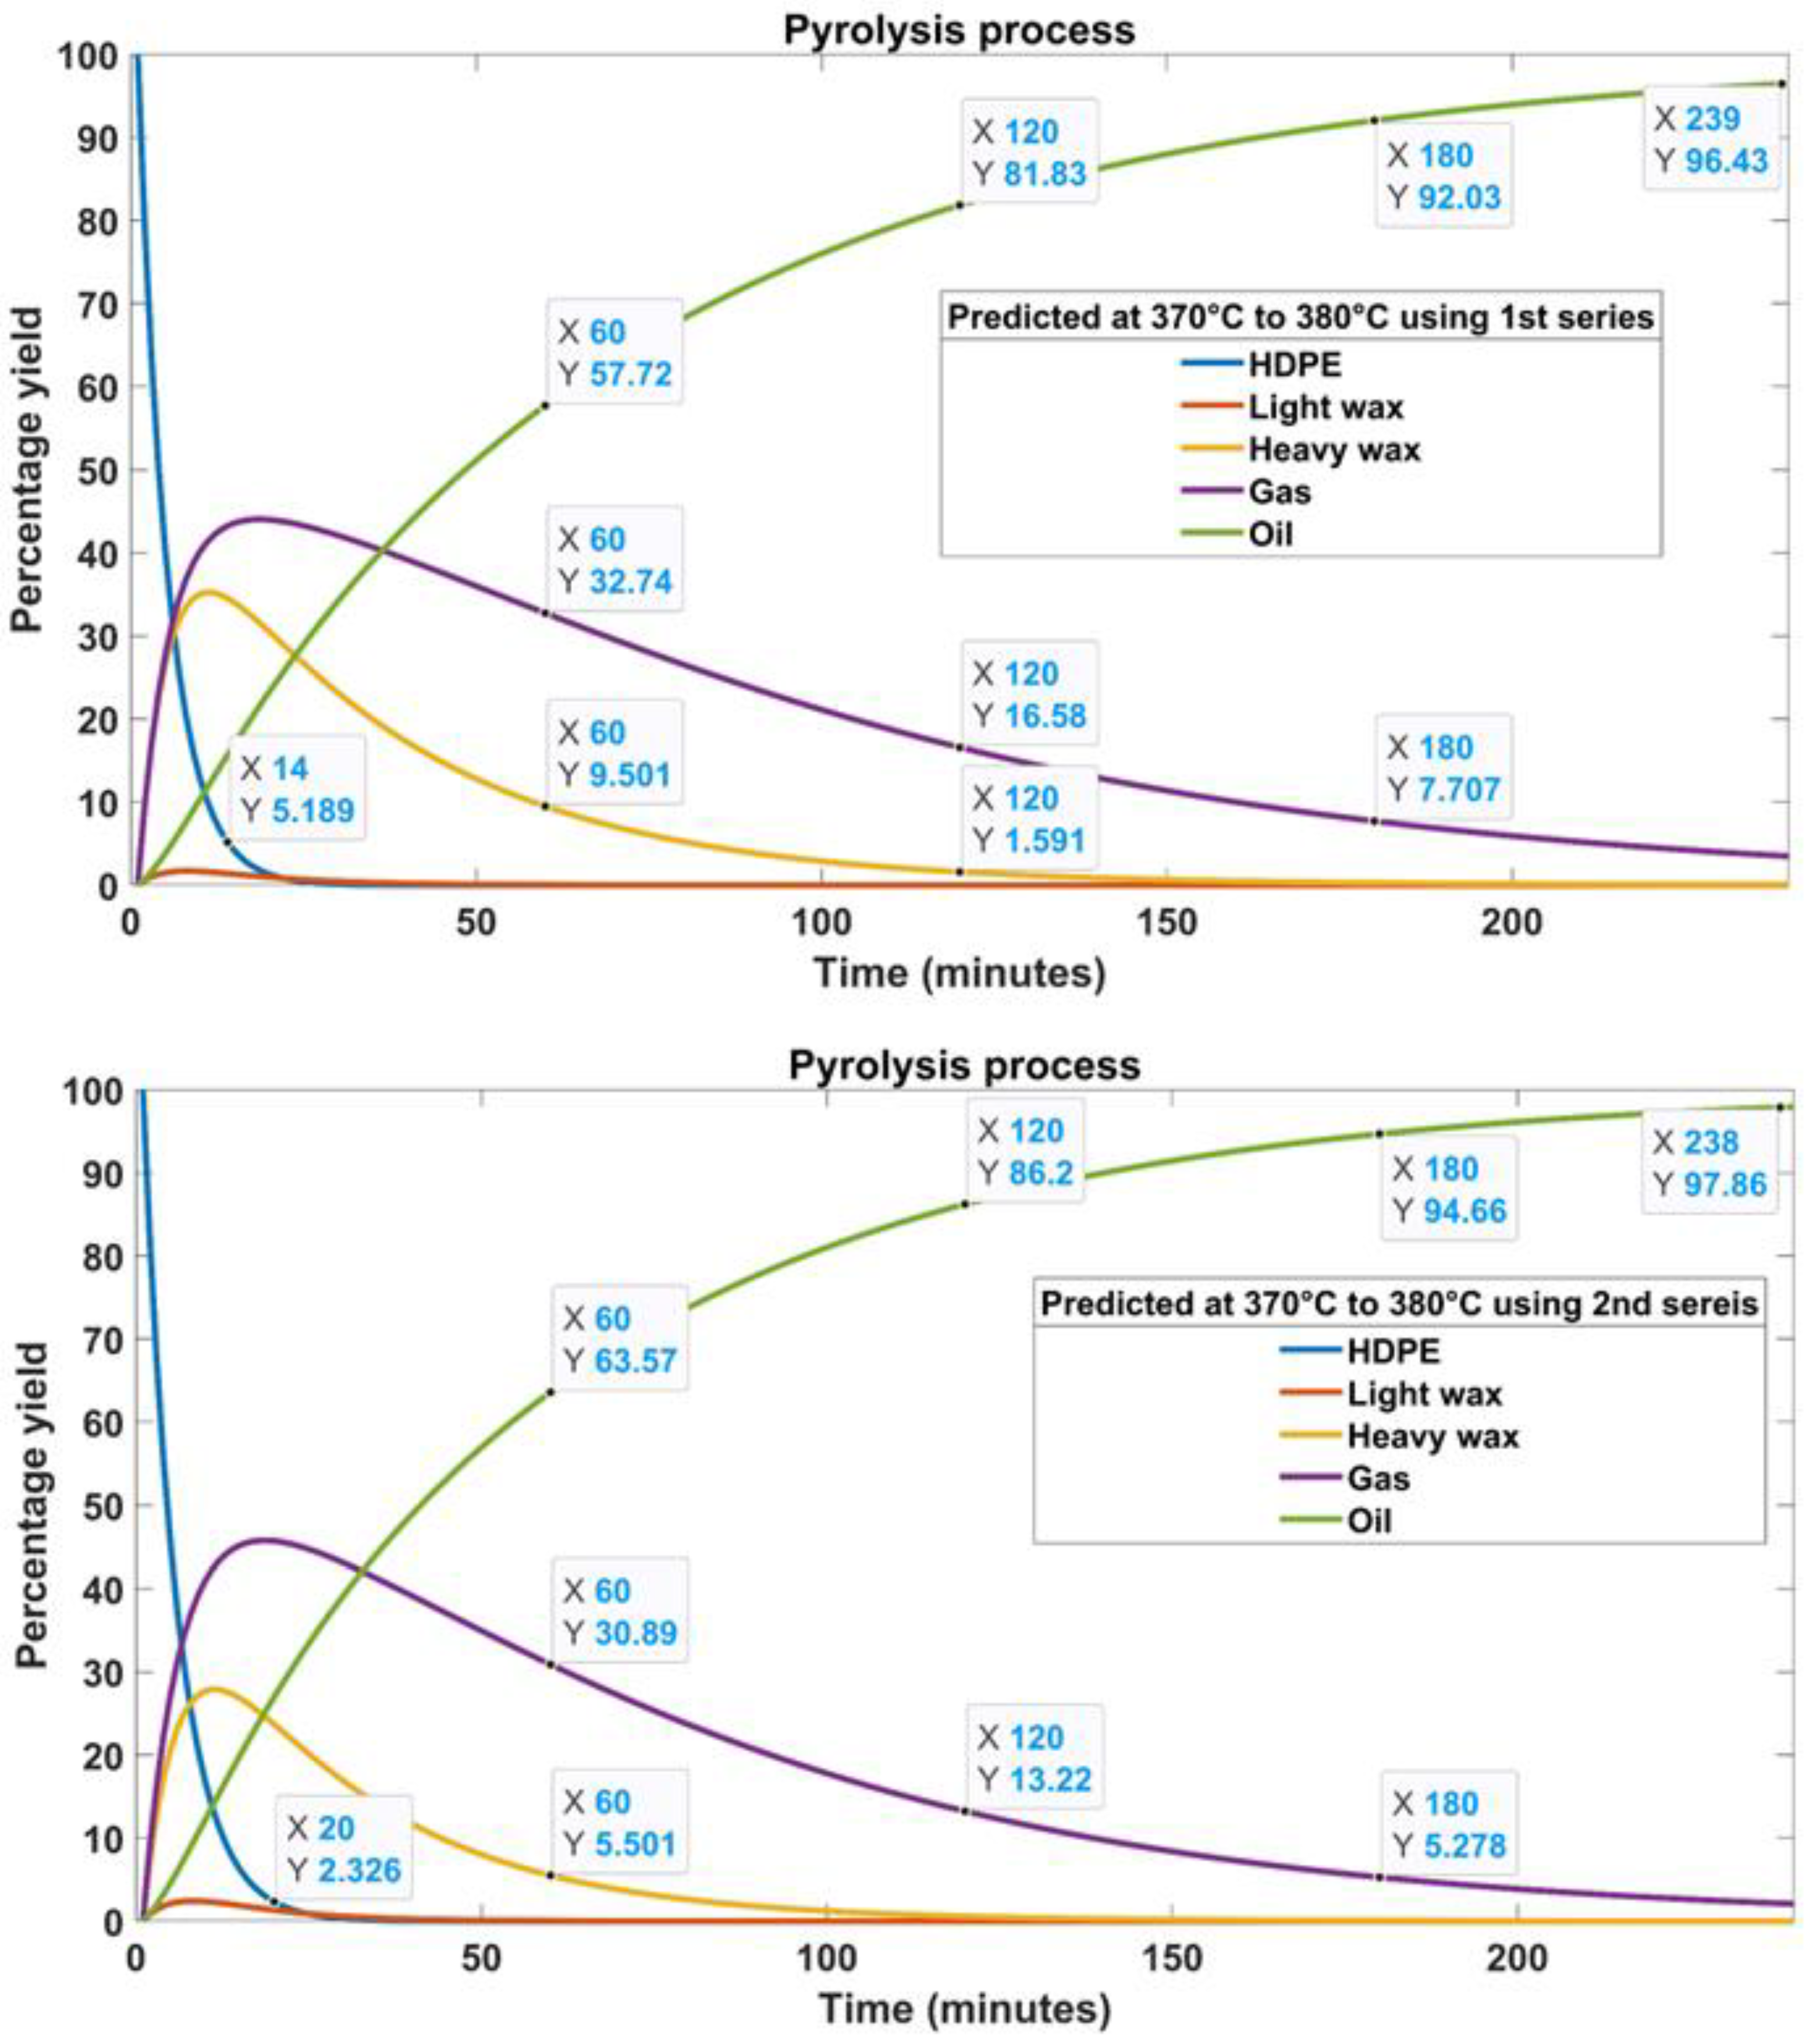
Table 9. The time-dependent conversion reveals that the quantity of the residual is approximately 0.5 to 1% and the light wax is 0% for both the assumed series at all temperatures. About 26% to 35% of heavy wax was produced in the temperature range from 370 °C to 380 °C during first hour of processing time. The production of heavy wax ceased after 2 h when the temperature was raised from 380 °C to 400 °C. The gas yield reduced from 32% to 14% and 30% to 11% for the first and second series, respectively, when the temperature was raised to 400 °C. After 1 h of pyrolysis, the efficiency of the oil yield increased to 57% and 84% for the first and second series, respectively, by increasing the temperature from 370 °C to 400 °C. The oil yield improved to a further 97–99% after 3 h of pyrolysis for the first series.
In the second series, after 1 h of pyrolysis time, the oil yield improved from 63% to 88% with a rise in temperature from 370 °C to 400 °C. After 2 and 3 h of processing, the oil production jumped to 94% and 98%, respectively, with a similar change in temperature. The high conversion efficiency of the process is attributed to the lower values of Ea and Ao at higher temperatures. Numerous studies have been carried out to investigate the impact of operational parameters on oil output from the pyrolysis of HPDE [30]. Khan et al. [31] pyrolyzed HDPE plastic wastes to produce oil, gas, and char. To produce useable fuel products, HDPE was pyrolyzed in a self-designed stainless-steel reactor. After 2 to 3 h of pyrolysis at 330–490 °C, the HDPE waste was fully degraded into liquid fuel, solid residue, and combustible hydrocarbons. Salem et al. [32] performed the thermal pyrolysis of HDPE to produce gasoline range hydrocarbons. They used a fixed bed reactor to pyrolyze HDPE in the temperature range from 500–800 °C. The optimum temperature for obtaining a maximum oil product yield of 70% was 550 °C. A chemical kinetic analysis of the cracking reactions was conducted to explore the reaction mechanism providing the best oil product and yield. The recovered oil had a large proportion of aliphatic hydrocarbons, particularly in the C8 to C12 range, with a lesser fraction of aromatic hydrocarbons. The carbon number of the oil product increased proportionally as the operating temperature increased. The experimental data were also modeled using synthetic HDPE degradation reaction kinetics, reflecting a two-stage process. The primary stage breakdown had high activation energy, whereas the second stage degradation to gas, liquid, and solid fractions had lower limits representing the intramolecular hydrogen shift and termination step.
In another study, Uzun et al. [33] researched the co-pyrolysis of waste composed of synthetic materials and PS at a temperature of 500 °C. The co-pyrolysis was performed in a semi-batch format in an inert environment under fixed bed reactor conditions. The co-pyrolysis of PS and HDPE at a ratio of 1:2 resulted in the most noticeable kinetics and the highest liquid yield. The bio-oil showed superior properties compared to the oil obtained from the pyrolysis of a single biomass source. The percentages of carbon and hydrogen both increased, while the amount of oxygen decreased. The bio-oils, produced via co-pyrolysis, had high calorific values, making them an attractive candidate for use as fuel. According to the results, incorporating HDPE improves the dispersion of hydrocarbons, which leads to an increase in both the quantity and quality of the oil. The actual amount of oil was 65% of the expected amount. Rodrguez et al. [34] found HDPE to produce alkanes at 450–550 °C due to scissions and intermolecular hydrogen transfer. The pyrolysis of HDPE into wax created mid- to long-chain molecules, whereas a wax-to-oil transition produced room-temperature liquid hydrocarbons. Park et al. [35] showed that the two-step pyrolysis of PVC waste at 730 °C may produce 80% oil. Heat pretreatment impacts the combustion of oil and chlorine contents in two-step pyrolysis. Sun et al. [36] employed sludge char as a substrate to produce pyrolysis oil from plastic trash. The temperature, residence time, and polymeric composition impacted the conversion efficiency and oil production. Alvarez et al. [37] produced 57% oil via rapid co-pyrolysis HDPE in a fixed-bed reactor at 525 °C to 675 °C. HDPE and red oak’s synergetic influence was studied by analyzing the yields and properties of oxygenated products generated at 575 °C. Miandad et al. [38] make oil and char from plastic trash. Mixed plastics were turned into oil at 420 °C for 75 min. In comparison to other plastic types, polystyrene waste produced the most liquid oil (80.8%), the least amount of gas (13%), and the least amount of char (6.2%). All the forms of the liquid oils from the plastics mostly contained aromatic chemicals; however, some also contained alkanes and alkenes. Due to the high level of the aromatic chemicals present, upgrading the liquid oil using various post-treatment techniques, such as distillation, refining, and blending with standard diesel, was advised. The abovementioned literature is summarized and compared with the current study in Table 10. In most cases, the oil yield did not exceed 80% due to the use of the conventional or unoptimized pyrolysis approaches. In the current study, we were able to predict a 98% oil yield through an efficient statistical analysis after 3 h of pyrolysis. These findings suggest the high significance of the results and practical value of the reported work.

7. Limitations of the Reported Model

The reported statistical model predicts better results in the temperature range from 370–400 °C. At elevated temperatures, the model behaves more aggressively towards the cracking of the feedstock. The oil content decreases while the gas content increases at higher temperatures. In addition, the reported model is only applicable to high-density plastics. Limited kinetic rate reactions can be studied in this model, whereas the plastic may undergo numerous complex reactions.
The numerical analysis can only operate using a second-order differential solver. This model produced an oil yield of 98%, which is difficult to achieve experimentally. A sensitivity analysis is required to analyze the behavior of the predicted rate constants.

8. Conclusions and Future Prospects

This study was conducted to identify an appropriate combination of Ea and Ao. Using our statistical model in the R software, we could determine rate constants that potentially enhance the oil yield to a significant extent. This model enables the discovery of a possible energy combination that could boost oil yields on a commercial scale. The Arrhenius equation in the R software was used to assume two series of Ea and AO to statistically predict the rate constants at different pyrolysis temperatures and explore the impact of the kinetic rate constant on the final products. In line with this, MATLAB was used to conduct four statistical studies at various temperatures in the range of 370–410 °C to evaluate the effect of the temperature on the statistically predicted rate constants and percentage yield. It was discovered that the efficiency of the pyrolysis process might be greatly increased by using the right mix of Ea, AO, and the predicted rate constant. In the first assumed series, the major oil recovery took place between 390 °C and 400 °C, whereas the second assumed series of Ea and Ao took place between 380 °C and 390 °C. The amount of light wax was estimated to be about 2% for both series at temperatures between 390 °C and 400 °C, while the percentage of heavy wax was estimated to be about 32% for the first assumed series and 27% for the second supposed series. After 1, 2, and 3 h, it was discovered that the oil yield for the first series was 84%, 97%, and 99%. In the case of the second series, an intriguing trend was discovered regarding oil production. After 1, 2, and 3 h, the oil yield increased to 84%, 97%, and 99% for the first assumed series. On the other hand, there was a trend toward a diminishing gas yield. In the future, we need to analyze the sensitivity of the statistically predicted rate constants to implement the findings at the industrial level.

Author Contributions

Conceptualization, A.O.A.; Data curation, R.A.U.N.; Formal analysis, M.Y.N. and H.A.K.; Funding acquisition, F.A. and M.I.; Investigation, M.A.B.-R.; Methodology, F.A. and M.I.; Project administration, M.H.M.; Resources, H.A.; Software, H.A.K.; Validation, S.S.; Visualization, M.A.B.-R. and M.E.G.; Writing—original draft, R.A.U.N. and M.Y.N.; Writing—review & editing, A.O.A., S.S., M.E.G., H.A. and M.H.M. All authors have read and agreed to the published version of the manuscript.

Funding

This research was funded by the Deanship of Scientific Research, Najran University, Saudi Arabia, under the Research Groups funding program grant code number (NU/RG/SERC/11/3).

Institutional Review Board Statement

Not applicable.

Informed Consent Statement

Not applicable.

Data Availability Statement

The reported data is available from the corresponding authors on valid request.

Acknowledgments

The authors acknowledge the support from the Scientific Research, Najran University, Saudi Arabia.

Conflicts of Interest

The authors declare no conflict of interest or competing interest regarding the publication of this article.

References

  1. Saebea, D.; Ruengrit, P.; Arpornwichanop, A.; Patcharavorachot, Y. Gasification of plastic waste for synthesis gas production. Energy Rep. 2020, 6, 202–207. [Google Scholar] [CrossRef]
  2. Ndolomingo, M.J.; Bingwa, N.; Meijboom, R. Review of supported metal nanoparticles: Synthesis methodologies, advantages and application as catalysts. J. Mater. Sci. 2020, 55, 6195–6241. [Google Scholar] [CrossRef]
  3. Suriapparaoa, D.V.; Vinu, R. Resource recovery from synthetic polymers via microwave pyrolysis using different susceptors. J. Anal. Appl. Pyrolysis 2015, 113, 701–712. [Google Scholar] [CrossRef]
  4. Heller, M.C.; Mazor, M.H.; Keoleian, G.A. Plastics in the US: Toward a material flow characterization of production, markets and end of life. Environ. Res. Lett. 2020, 15, 094034. [Google Scholar] [CrossRef]
  5. Arshad, H.; Sulaiman, S.A.; Hussain, Z.; Naz, Y.; Basrawi, F. Microwave assisted pyrolysis of plastic waste for production of fuels: A review. MATEC Web Conf. 2017, 131, 2005. [Google Scholar] [CrossRef] [Green Version]
  6. Dusunceli, N.; Colak, O.U. High density polyethylene (HDPE): Experiments and modeling. Mech. Time-Depend. Mater. 2006, 10, 331–345. [Google Scholar] [CrossRef]
  7. Wang, H.; Xu, Y.; Huang, D. A non-ordinary state-based peridynamic formulation for thermo-visco-plastic deformation and impact fracture. Int. J. Mech. Sci. 2019, 159, 336–344. [Google Scholar] [CrossRef]
  8. Levine, S.E.; Broadbelt, L.J. Detailed mechanistic modeling of high-density polyethylene pyrolysis: Low molecular weight product evolution. Polym. Degrad. Stab. 2009, 94, 810–822. [Google Scholar] [CrossRef]
  9. Van Geem, K. Kinetic modeling of the pyrolysis chemistry of fossil and alternative feedstocks. In Computer Aided Chemical Engineering; Elsevier: Amsterdam, The Netherlands, 2019; Volume 45, pp. 295–362. [Google Scholar]
  10. Debuigne, A.; Hurtgen, M.; Detrembleur, C.; Jérôme, C.; Barner-Kowollik, C.; Junkers, T. Interpolymer radical coupling: A toolbox complementary to controlled radical polymerization. Prog. Polym. Sci. 2012, 37, 1004–1030. [Google Scholar] [CrossRef]
  11. Khaghanikavkani, E.; Farid, M.M. Thermal pyrolysis of polyethylene: A kinetic study. Energy Sci. Technol. 2011, 2, 1–10. [Google Scholar]
  12. Khonde, R.; Chaurasia, A. Rice husk gasification in a two-stage fixed-bed gasifier: Production of hydrogen rich syngas and kinetics. Int. J. Hydrogen Energy 2016, 41, 8793–8802. [Google Scholar] [CrossRef]
  13. Mishra, R.K.; Kumar, V.; Mohanty, K. Pyrolysis kinetics behavior and thermal pyrolysis of Samanea saman seeds towards the production of renewable fuel. J. Energy Inst. 2020, 93, 1148–1162. [Google Scholar] [CrossRef]
  14. Mehl, M.; Pitz, W.J.; Westbrook, C.K.; Curran, H.J. Kinetic modeling of gasoline surrogate components and mixtures under engine conditions. Proc. Combust. Inst. 2011, 33, 193–200. [Google Scholar] [CrossRef] [Green Version]
  15. Liu, Y.; Chen, G.; Yue, J. Manipulation of gas-liquid-liquid systems in continuous flow microreactors for efficient reaction processes. J. Flow Chem. 2020, 10, 103–121. [Google Scholar] [CrossRef] [Green Version]
  16. Safadi, Y.; Zeaiter, J.; Ahmad, M. Advanced Modeling of High-Density Polyethylene Pyrolysis. Int. J. Therm. Environ. Eng. 2013, 5, 123–128. [Google Scholar]
  17. Nisar, J.; Ali, G.; Shah, A.; Shah, M.R.; Iqbal, M.; Ashiq, M.N.; Bhatti, H.N. Pyrolysis of Expanded Waste Polystyrene: Influence of Nickel-Doped Copper Oxide on Kinetics, Thermodynamics, and Product Distribution. Energy Fuels 2019, 33, 12666–12678. [Google Scholar] [CrossRef]
  18. Kumar, S.; Panda, A.K.; Singh, R. A review on tertiary recycling of high-density polyethylene to fuel. Resour. Conserv. Recycl. 2011, 55, 893–910. [Google Scholar] [CrossRef]
  19. Liu, X.; Li, X.; Liu, J.; Wang, Z.; Kong, B.; Gong, X.; Yang, X.; Lin, W.; Guo, L. Study of high density polyethylene (HDPE) pyrolysis with reactive molecular dynamics. Polym. Degrad. Stab. 2014, 104, 62–70. [Google Scholar] [CrossRef]
  20. Das, P.; Tiwari, P. Valorization of packaging plastic waste by slow pyrolysis. Resour. Conserv. Recycl. 2018, 128, 69–77. [Google Scholar] [CrossRef]
  21. Liang, S.; Hemberger, P.; Levalois-Grützmacher, J.; Grützmacher, H.; Gaan, S. Probing phosphorus nitride (p≡ n) and other elusive species formed upon pyrolysis of dimethyl phosphoramidite. Chem.-A Eur. J. 2017, 23, 5595–5601. [Google Scholar] [CrossRef]
  22. Gu, J.; Fan, H.; Wang, Y.; Zhang, Y.; Yuan, H.; Chen, Y. Co-pyrolysis of xylan and high-density polyethylene: Product distribution and synergistic effects. Fuel 2020, 267, 116896. [Google Scholar] [CrossRef]
  23. Li, S.; Luo, Z.; Wang, W.; Lu, K.; Yang, Y.; Liang, X. Characterization of pyrolytic lignin and insight into its formation mechanisms using novel techniques and DFT method. Fuel 2020, 262, 116516. [Google Scholar] [CrossRef]
  24. Zsin, G.; Pütün, A.E. Co-pyrolytic behaviors of biomass and polystyrene: Kinetics, thermodynamics and evolved gas analysis. Korean J. Chem. Eng. 2018, 35, 428–437. [Google Scholar]
  25. Park, J.H.; Park, H.-W.; Choi, S.; Park, D.-W. Effects of blend ratio between high density polyethylene and biomass on co-gasification behavior in a two-stage gasification system. Int. J. Hydrogen Energy 2016, 41, 16813–16822. [Google Scholar] [CrossRef]
  26. Mortezaeikia, V.; Tavakoli, O.; Khodaparasti, M.S. A review on kinetic study approach for pyrolysis of plastic wastes using thermogravimetric analysis. J. Anal. Appl. Pyrolysis 2021, 160, 105340. [Google Scholar] [CrossRef]
  27. Khedri, S.; Elyasi, S. Kinetic analysis for thermal cracking of HDPE: A new iso conversational approach. Polym. Degrad. Stab. 2016, 129, 306–318. [Google Scholar] [CrossRef]
  28. Eidesen, H.; Khawaja, H.; Jackson, S. Simulation of the HDPE Pyrolysis Process. Int. J. Multiphysics 2018, 12, 79–88. [Google Scholar] [CrossRef] [Green Version]
  29. Yongle, H.U.; Mingqiang HA, O.; Guoli CH, E.N.; Ruiyan SU, N.; Shi, L.I. Technologies and practice of CO2 flooding and sequestration in China. Pet. Explor. Dev. 2019, 46, 753–766. [Google Scholar]
  30. Kabir, M.J.; Chowdhury, A.A.; Rasul, M.G. Pyrolysis of municipal green waste: A modeling, simulation, and experimental analysis. Energies 2015, 8, 7522–7541. [Google Scholar] [CrossRef] [Green Version]
  31. Khan, M.Z.H.; Sultana, M.; Al-Mamun, M.R.; Hasan, M.R. Pyrolytic Waste Plastic Oil and Its Diesel Blend: Fuel Characterization. J. Environ. Public Health 2016, 2016, 7869080. [Google Scholar] [CrossRef] [Green Version]
  32. Al-Salem, S. Thermal pyrolysis of high density polyethylene (HDPE) in a novel fixed bed reactor system for the production of high value gasoline range hydrocarbons (HC). Process Saf. Environ. Prot. 2019, 127, 171–179. [Google Scholar] [CrossRef]
  33. Önal, E.; Uzun, B.B.; Pütün, A.E. An experimental study on bio-oil production from co-pyrolysis with potato skin and high-density polyethylene (HDPE). Fuel Process. Technol. 2012, 104, 365–370. [Google Scholar] [CrossRef]
  34. Rodríguez-Luna, L.; Bustos-Martínez, D.; Valenzuela, E. Two-step pyrolysis for waste HDPE valorization. Process Saf. Environ. Prot. 2021, 149, 526–536. [Google Scholar] [CrossRef]
  35. Park, K.-B.; Choi, M.-J.; Chae, D.-Y.; Jung, J.; Kim, J.-S. Separate two-step and continuous two-stage pyrolysis of a waste plastic mixture to produce a chlorine-depleted oil. Energy 2022, 244, 122583. [Google Scholar] [CrossRef]
  36. Sun, K.; Themelis, N.J.; Bourtsalas, A.; Huang, Q. Selective production of aromatics from waste plastic pyrolysis by using sewage sludge derived char catalyst. J. Clean. Prod. 2020, 268, 122038. [Google Scholar] [CrossRef]
  37. Gracida-Alvarez, U.R.; Mitchell, M.K.; Sacramento-Rivero, J.C.; Shonnard, D.R. Effect of temperature and vapor residence time on the micro pyrolysis products of waste high-density polyethylene. Ind. Eng. Chem. Res. 2018, 57, 1912–1923. [Google Scholar] [CrossRef]
  38. Miandad, R.; Barakat, M.; Aburiazaiza, A.S.; Rehan, M.; Ismail, I.; Nizami, A. Effect of plastic waste types on pyrolysis liquid oil. Int. Biodeterior. Biodegrad. 2016, 119, 239–252. [Google Scholar] [CrossRef]
Figure 1. A graphical illustration of the Arrhenius equation by plotting temperature and rate constant.
Processes 10 01559 g001
Figure 2. The graphical representation of rate constant dependent conversion of high-density plastic.
Processes 10 01559 g002
Figure 3. Graphical representation of the entire process.
Processes 10 01559 g003
Figure 4. Type and amount of the predicted products at 370 °C to 380 °C.
Processes 10 01559 g004
Figure 5. Type and amount of the predicted products at 380 °C to 390 °C.
Processes 10 01559 g005
Figure 6. Type and amount of the predicted products at 390 °C to 400 °C.
Processes 10 01559 g006
Table 1. Statistically predicted rate constants from the first assumed series at 370 °C to 380 °C.
Ea (J)AoPredicted Rate Constant (k1–k9)
80,625.01933.6150.109
80,625.01932.6640.106
124,686.88642.9880.006
122,916.91842.6120.007
113,732.62441.0880.013
109,446.24541.2560.017
113,878.97144.5340.014
85,148.66532.2680.076
133,160.25650.431631430.004
Table 2. Statistically predicted rate constants from the second assumed series at 370 °C to 380 °C.
Ea (J)AoPredicted Rate Constants (k1–k9)
84,686.59533.6080.081
81,443.17632.4690.099
120,686.72341.3490.008
117,797.80940.7660.009
109,352.35239.5330.017
106,092.44640.0260.021
111,473.94743.5720.016
82,618.84331.3830.088
130,076.54549.3080.005
Table 3. Statistically predicted rate constants using a first assumed series at 380 °C to 390 °C.
Ea (J)AoPredicted Rate Constants (k1–k9)
80,625.01933.6150.146
80,625.01932.6640.142
124,686.88642.9880.010
122,916.91842.6120.011
113,732.62441.0880.019
109,446.24541.2560.026
113,878.97144.5340.020
85,148.66532.2680.103
133,160.25650.4320.006
Table 4. Statistically predicted rate constants using a second assumed series at 380 °C to 390 °C.
Ea (J)AoPredicted Rate Constants (k1–k9)
84,686.59533.6080.111
81,443.17632.4690.133
120,686.72341.3480.012
117,797.80940.7660.014
109,352.35239.5330.025
106,092.44640.0260.031
111,473.94743.5720.024
82,618.84331.3830.119
130,076.54549.3080.008
Table 5. Statistically predicted rate constant using the first assumed series at 390 °C to 400 °C.
Ea (J)AoPredicted Rate Constants
(k1–k9)
80,625.01933.6150.191
80,625.01932.6640.186
124,686.88642.9880.015
122,916.91842.6120.016
113,732.62441.0880.028
109,446.24541.2560.037
113,878.97144.5340.030
85,148.66532.2680.137
133,160.25650.4320.010
Table 6. Statistically predicted rate constant using second assumed series at 390 °C to 400 °C.
Ea (J)AoPredicted Rate Constant
84,686.59533.6080.148
81,443.17632.4690.175
120,686.72341.3480.018
117,797.80940.7660.021
109,352.35239.5330.036
106,092.44640.0260.045
111,473.94743.5720.034
82,618.84331.3830.157
130,076.54549.3080.012
Table 7. Summary of all the statistically predicted rate constants using the first assumed series.
Assumed Ea (j)Ao370–380 °C380–390 °C390–400 °C
9697.50080,625.0190.1090.1460.191
9697.50080,625.0190.1060.1420.186
14,997.219124,686.8860.0060.0100.015
14,784.329122,916.9180.0070.0110.016
13,679.651113,732.6240.0130.0190.028
13,164.090109,446.2450.0170.0260.037
13,697.254113,878.9710.0140.0200.030
10,241.60085,148.6650.0760.1030.137
16,016.388133,160.2560.0040.0060.010
Table 8. All the statistically predicted rate constants using the second assumed series.
Assumed Ea (j)Ao370–380 °C380–390 °C390–400 °C
84,686.59533.6080.0810.1110.148
81,443.17632.4690.0990.1330.175
120,686.72341.3480.0080.0120.018
117,797.80940.7660.0090.0140.021
109,352.35239.5330.0170.0250.036
106,092.44640.0260.0210.0310.045
111,473.94743.5720.0160.0240.034
82,618.84331.3830.0880.1190.157
130,076.54549.3080.0050.0080.012
Table 9. Time-dependent conversion of HDPE plastic into oil, gas, and waxes.
Series Time (Minutes)SeriesTime (Minutes)
1stYield (%)601201802nd60120180
370–380 °COil578192370–380 °C638694
Gas3216730135
LW000000
HW35202610
380–390 °COil729197380–390 °C779498
Gas23721871
LW000000
HW300200
390–400 °COil849799390–400 °C88AggressiveAggressive
Gas14201120
LW000000
HW100000
Table 10. Comparison of oil yield from different waste, methods, and temperatures.
Waste TypeTemperature (°C)MethodOil Yield (%)Reference
PS/HDPE500Co-pyrolysis65[31]
HDPE550Pyrolysis70[32]
HDPE330–490Pyrolysis76[33]
HDPE450–550Pyrolysis77[34]
HDPE730Two-step Pyrolysis80[35]
Mix800Pyrolysis53[36]
HDPE535–675Pyrolysis57[37]
PP, PE420Pyrolysis80[38]
HDPE370–400Pyrolysis98Current study
HDPEPyrolysis370–380 (1st series)96Current study
HDPEPyrolysis370–380 (2nd series)97Current study
HDPEPyrolysis380–390 (1st series)97Current study
HDPEPyrolysis380–390 (1st series)98Current study
Publisher’s Note: MDPI stays neutral with regard to jurisdictional claims in published maps and institutional affiliations.

