

Profile Phenolic Compounds in Spanish-Style and Traditional Brine Black Olives (‘Gemlik’ Cv.) Provided from Different Regions of Türkiye

Abstract
:
1. Introduction
2. Materials and Methods
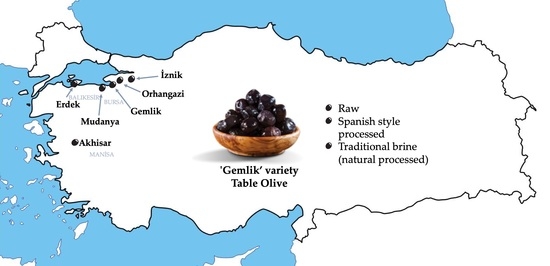
2.1. Procedure and Collection Date of the Samples
2.2. Chemicals
2.3. Table Olive Processing
2.4. Phenolic Compound Characterization
Extraction
3. Statistical Analysis
4. Results and Discussion
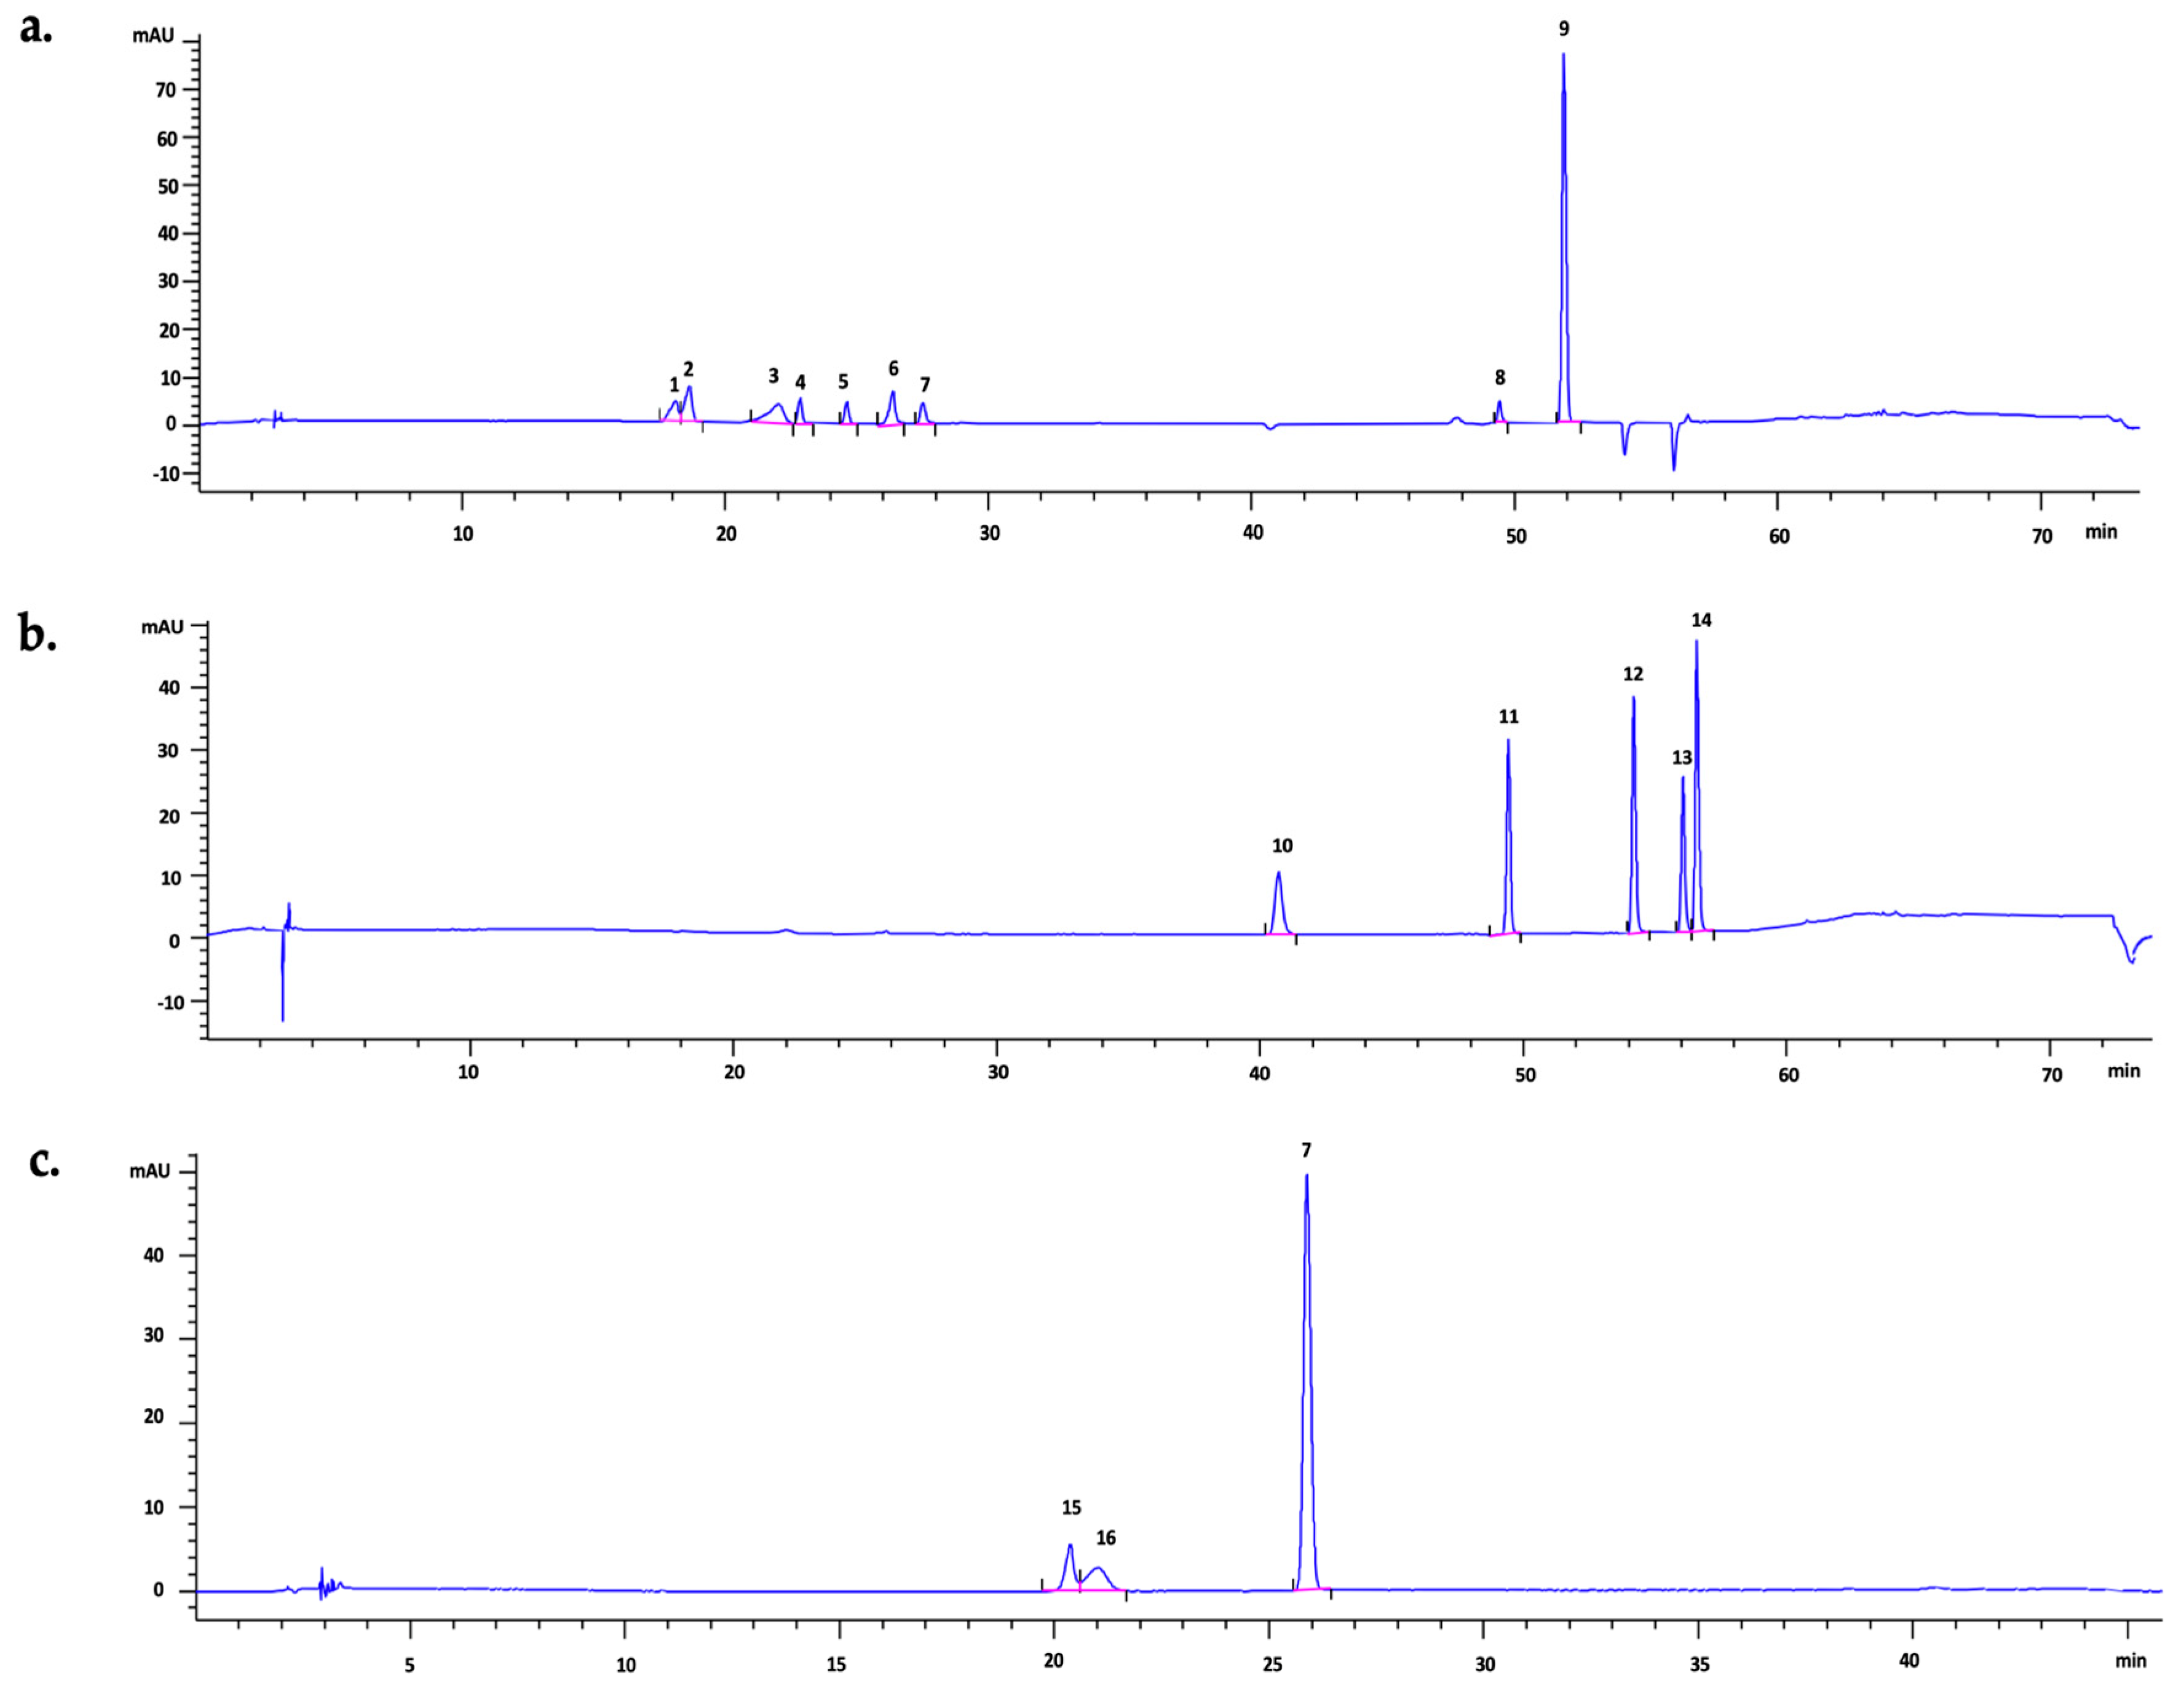
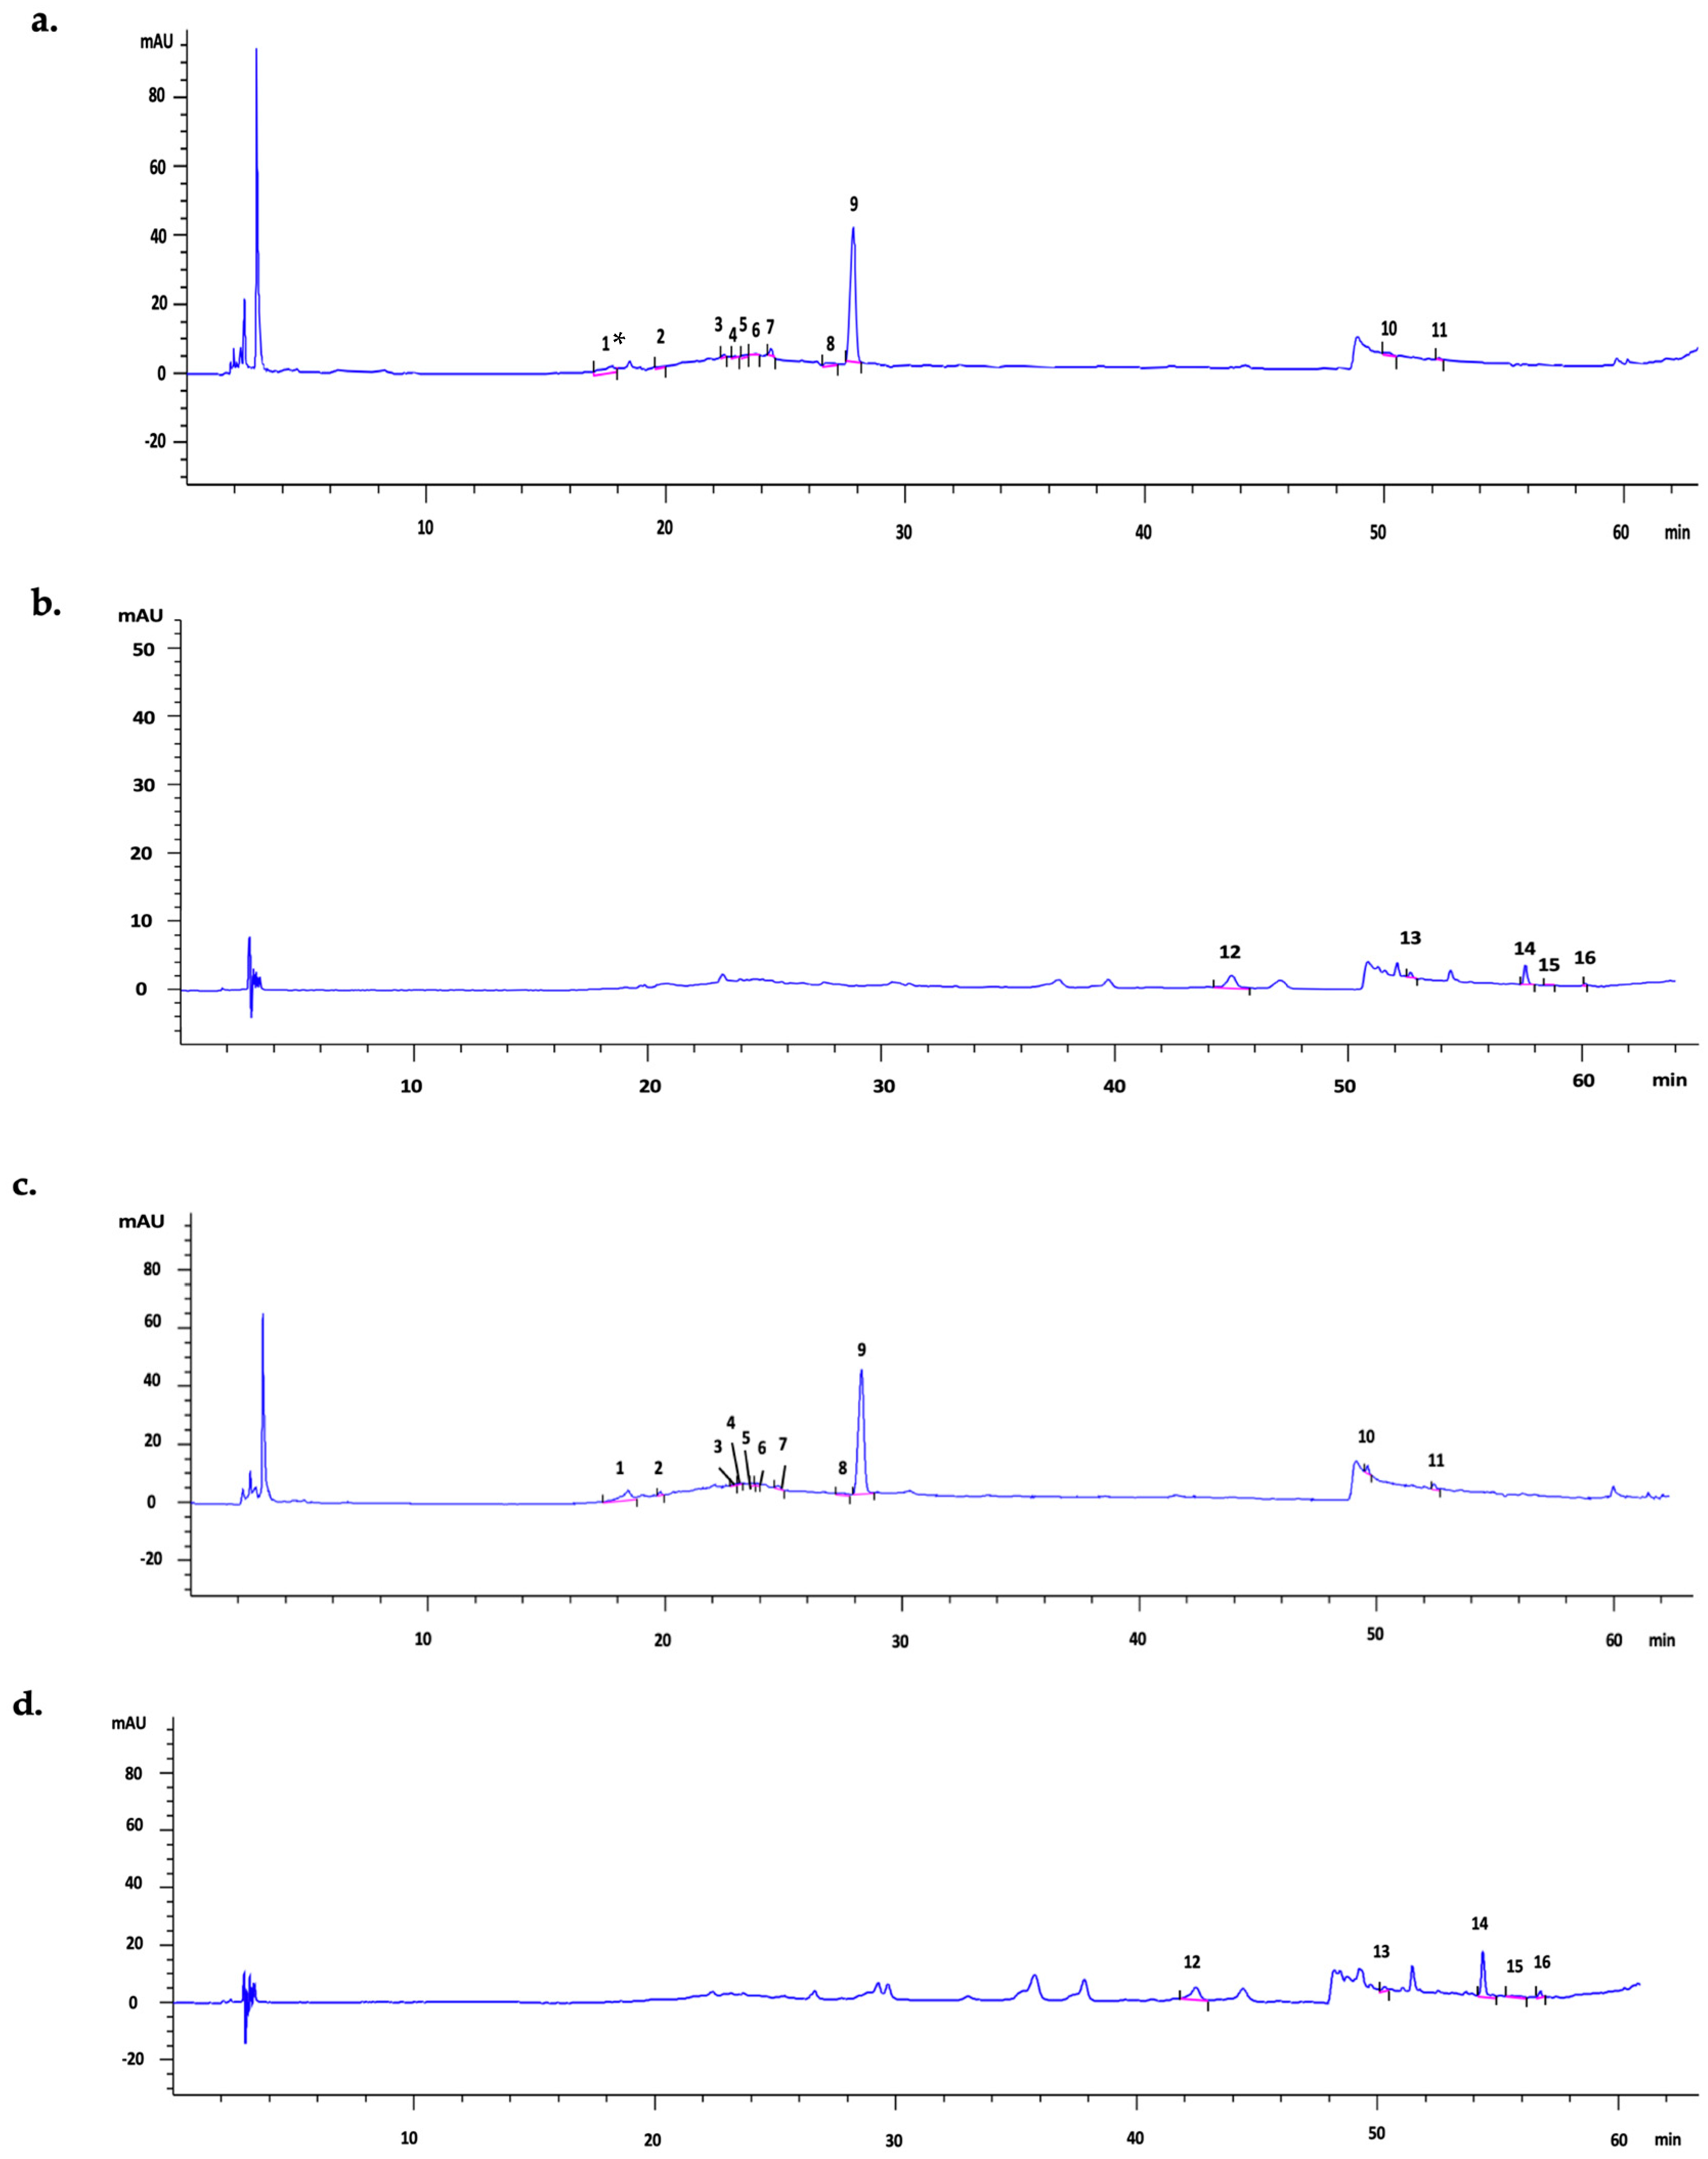
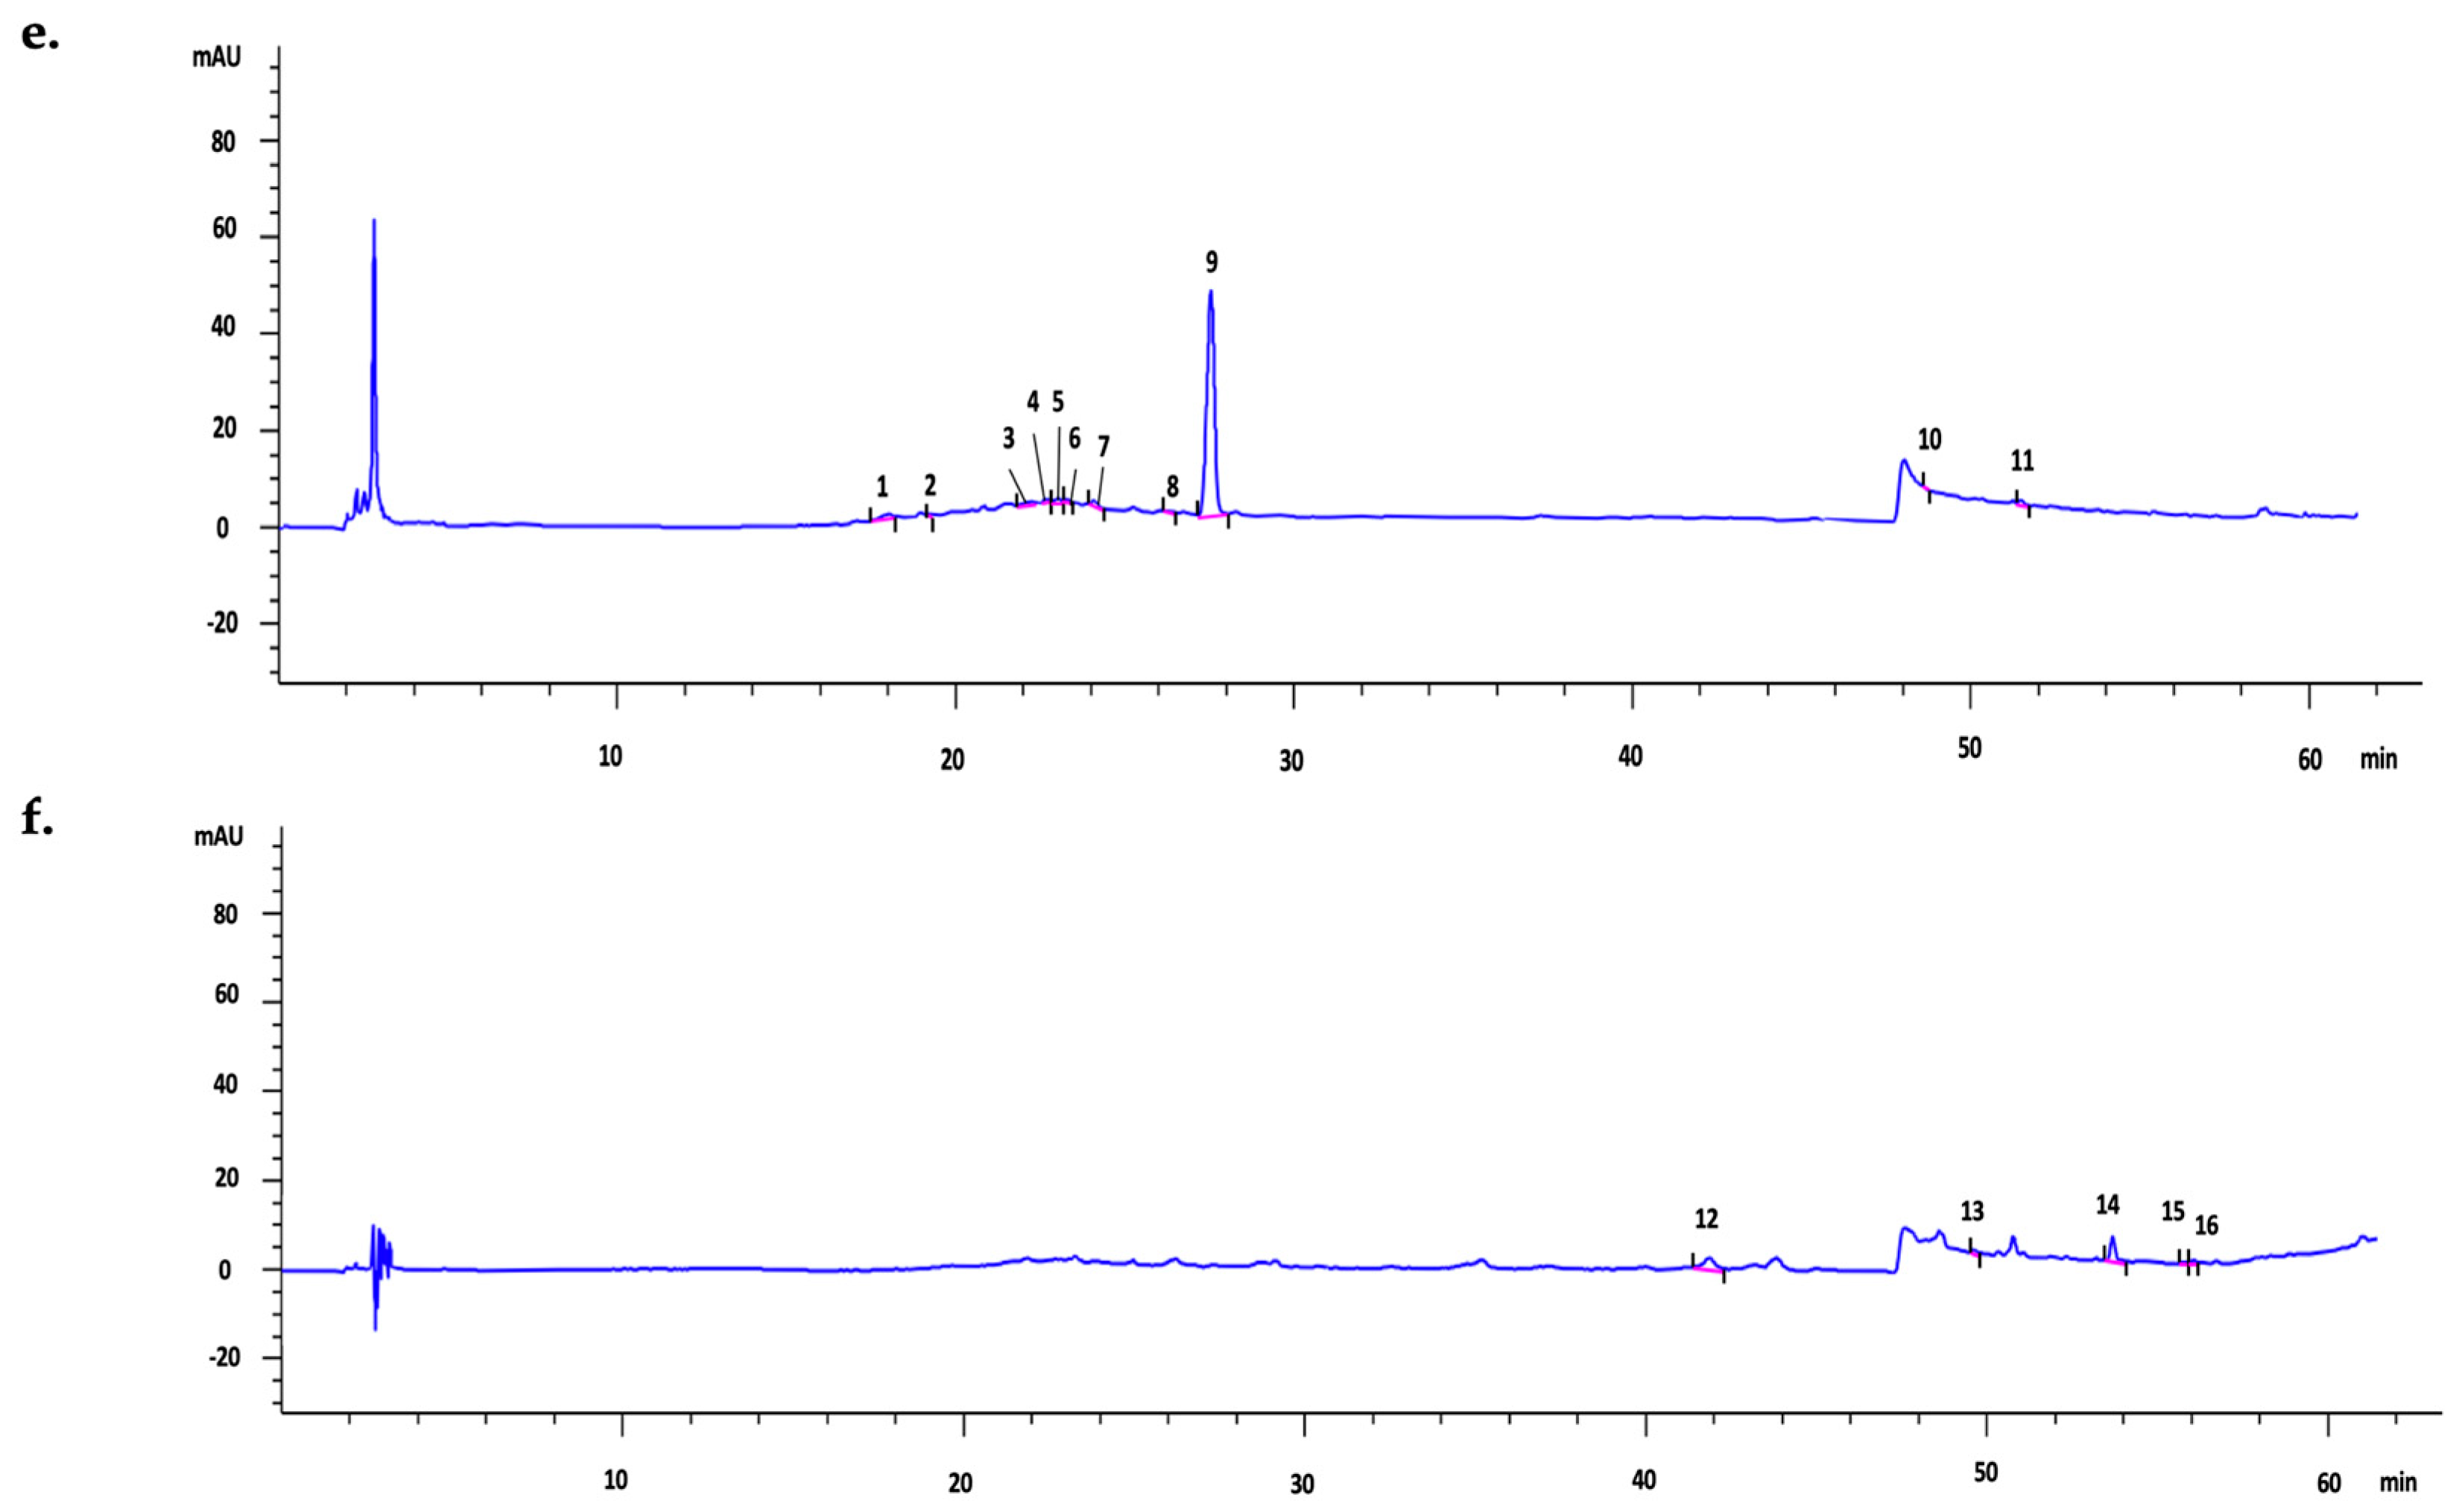
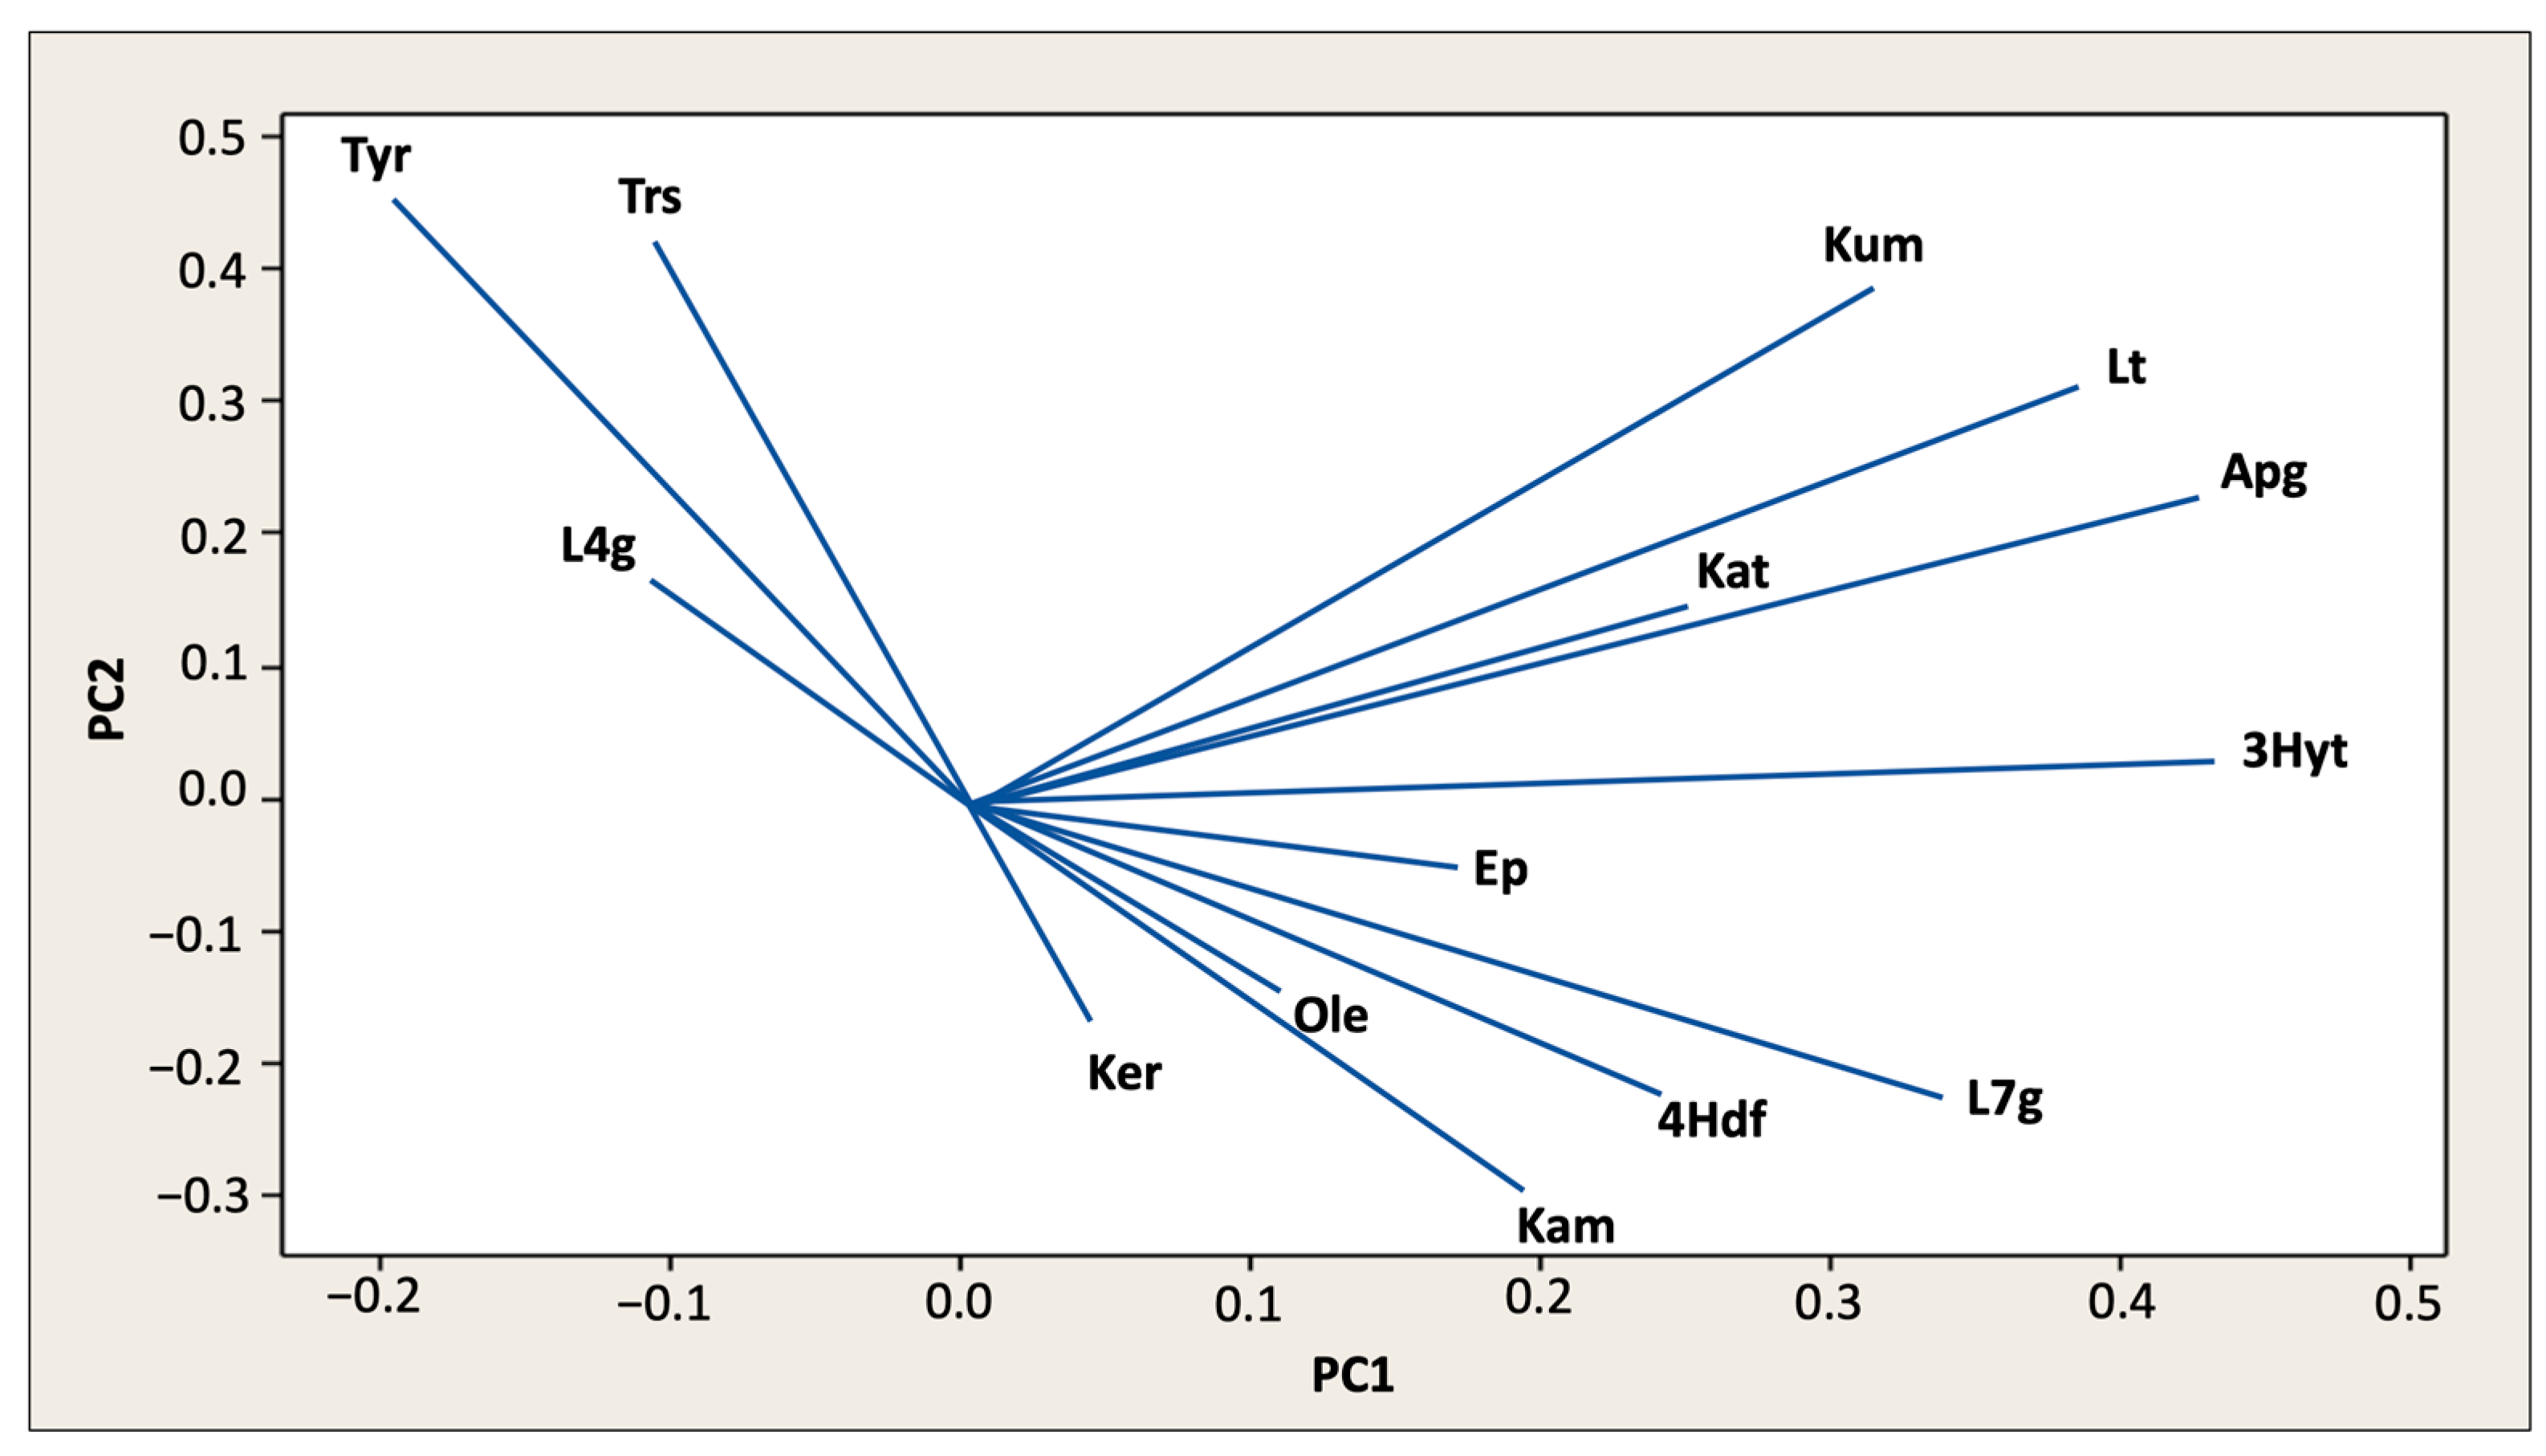
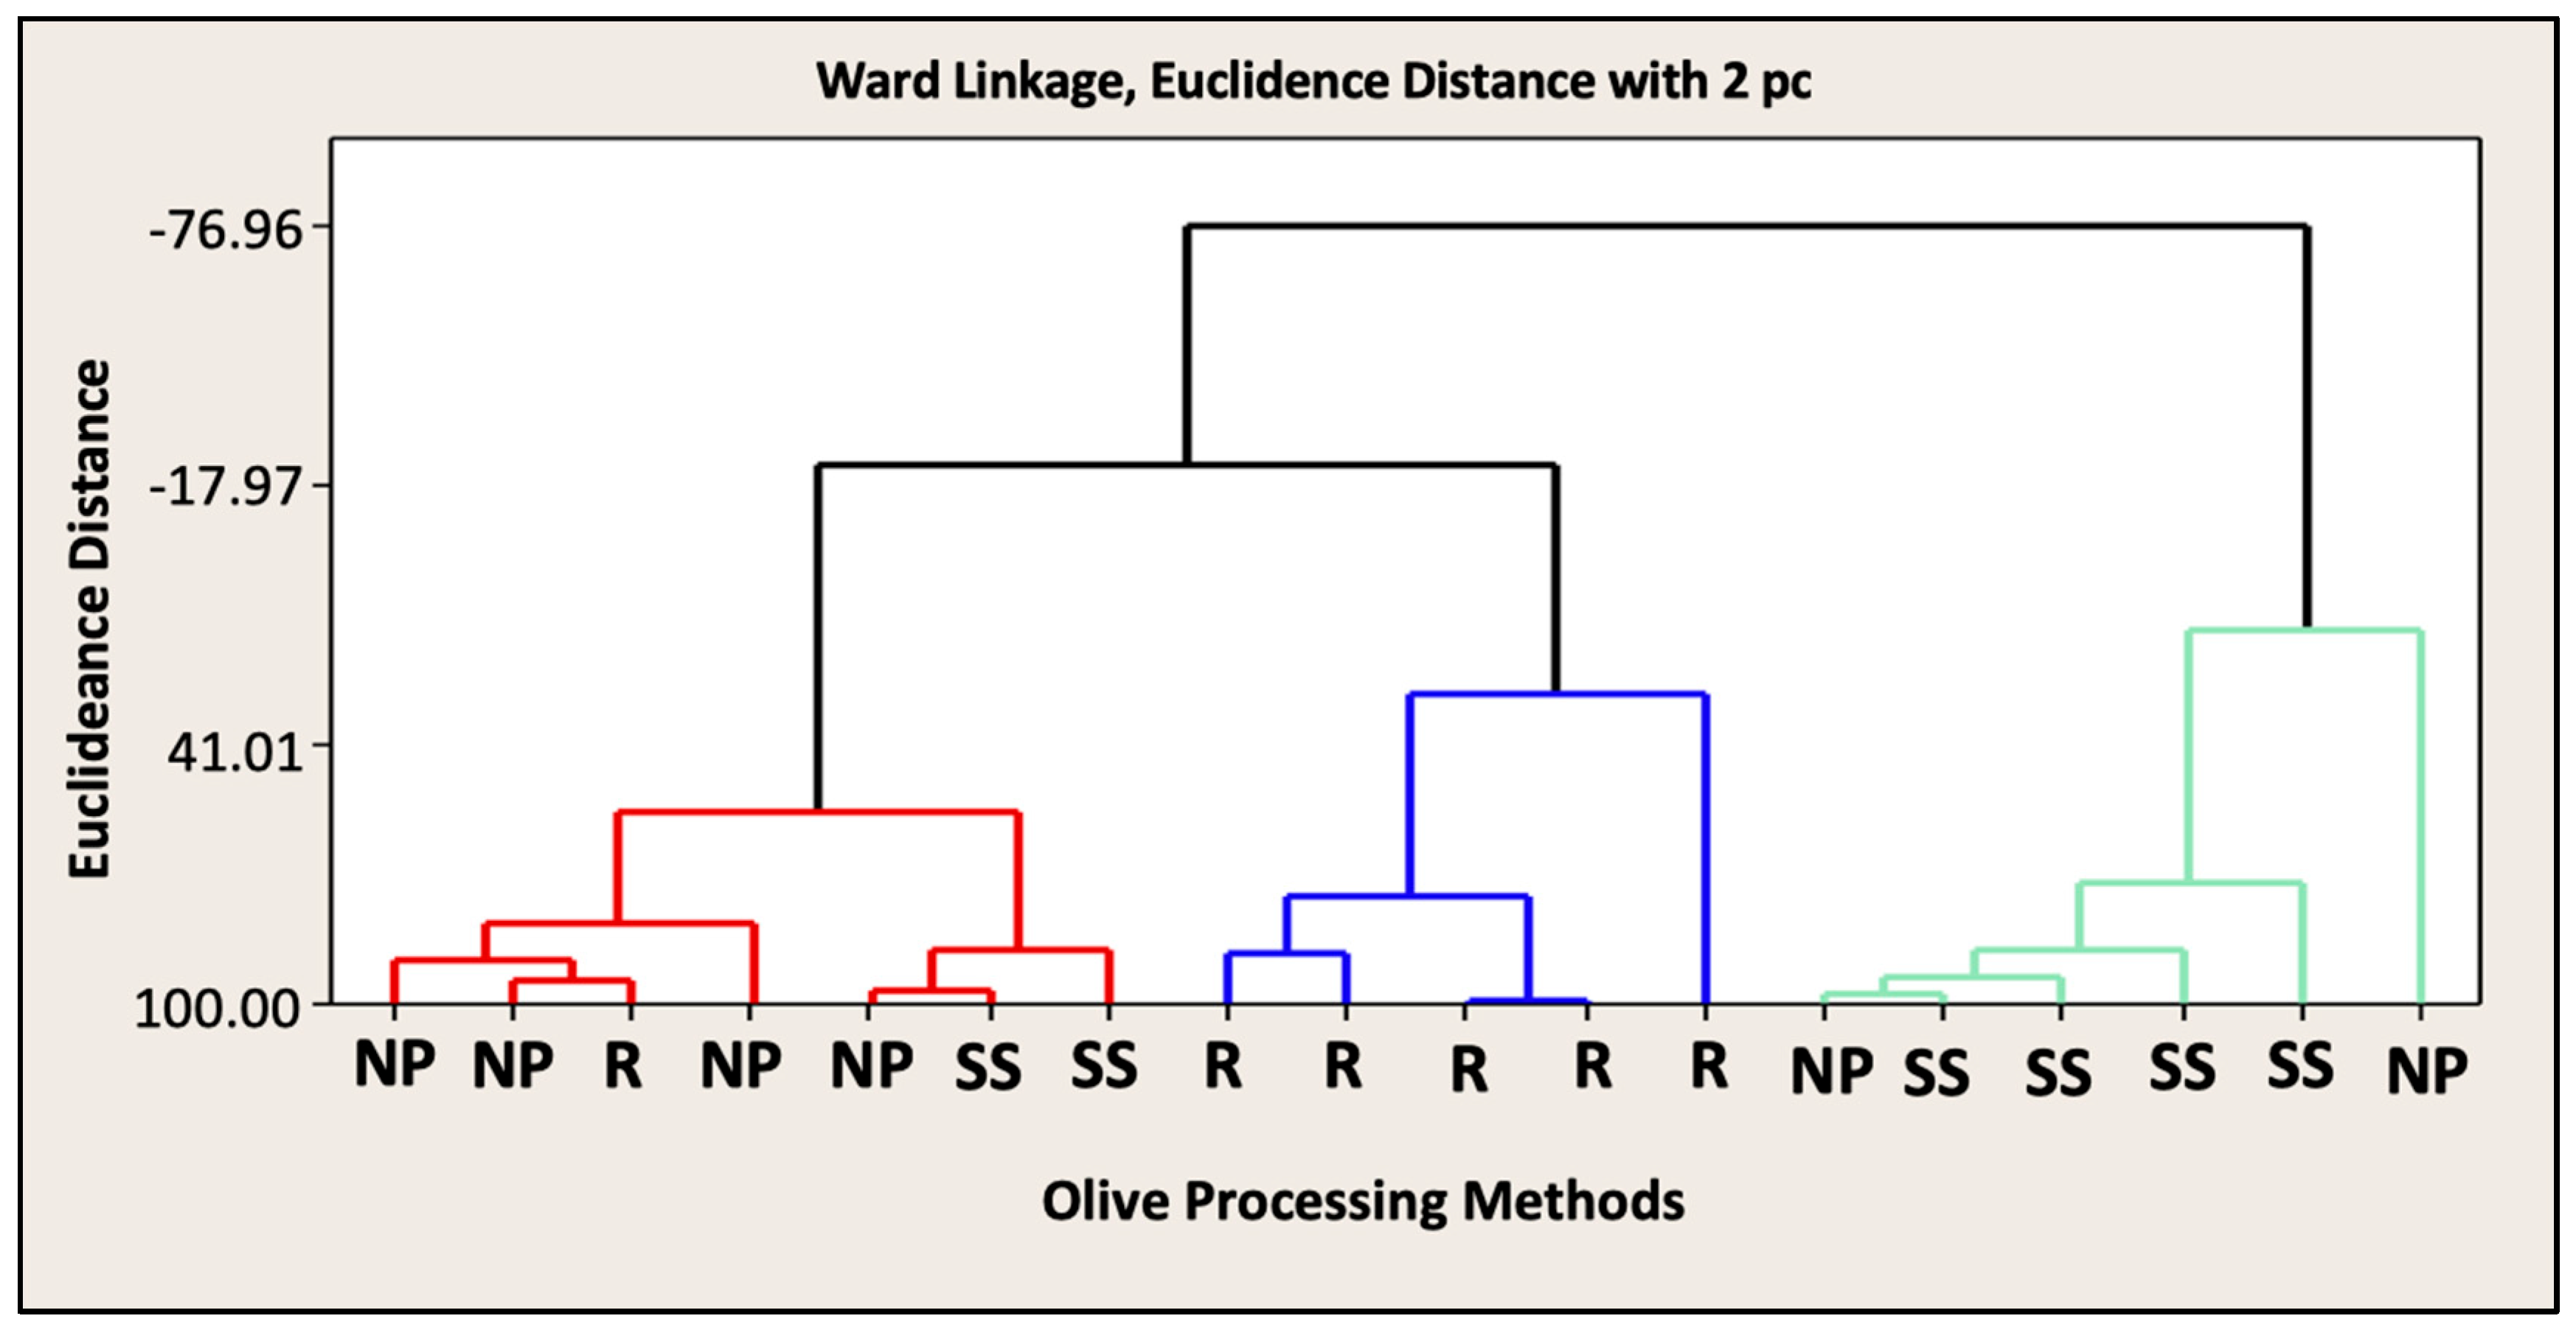
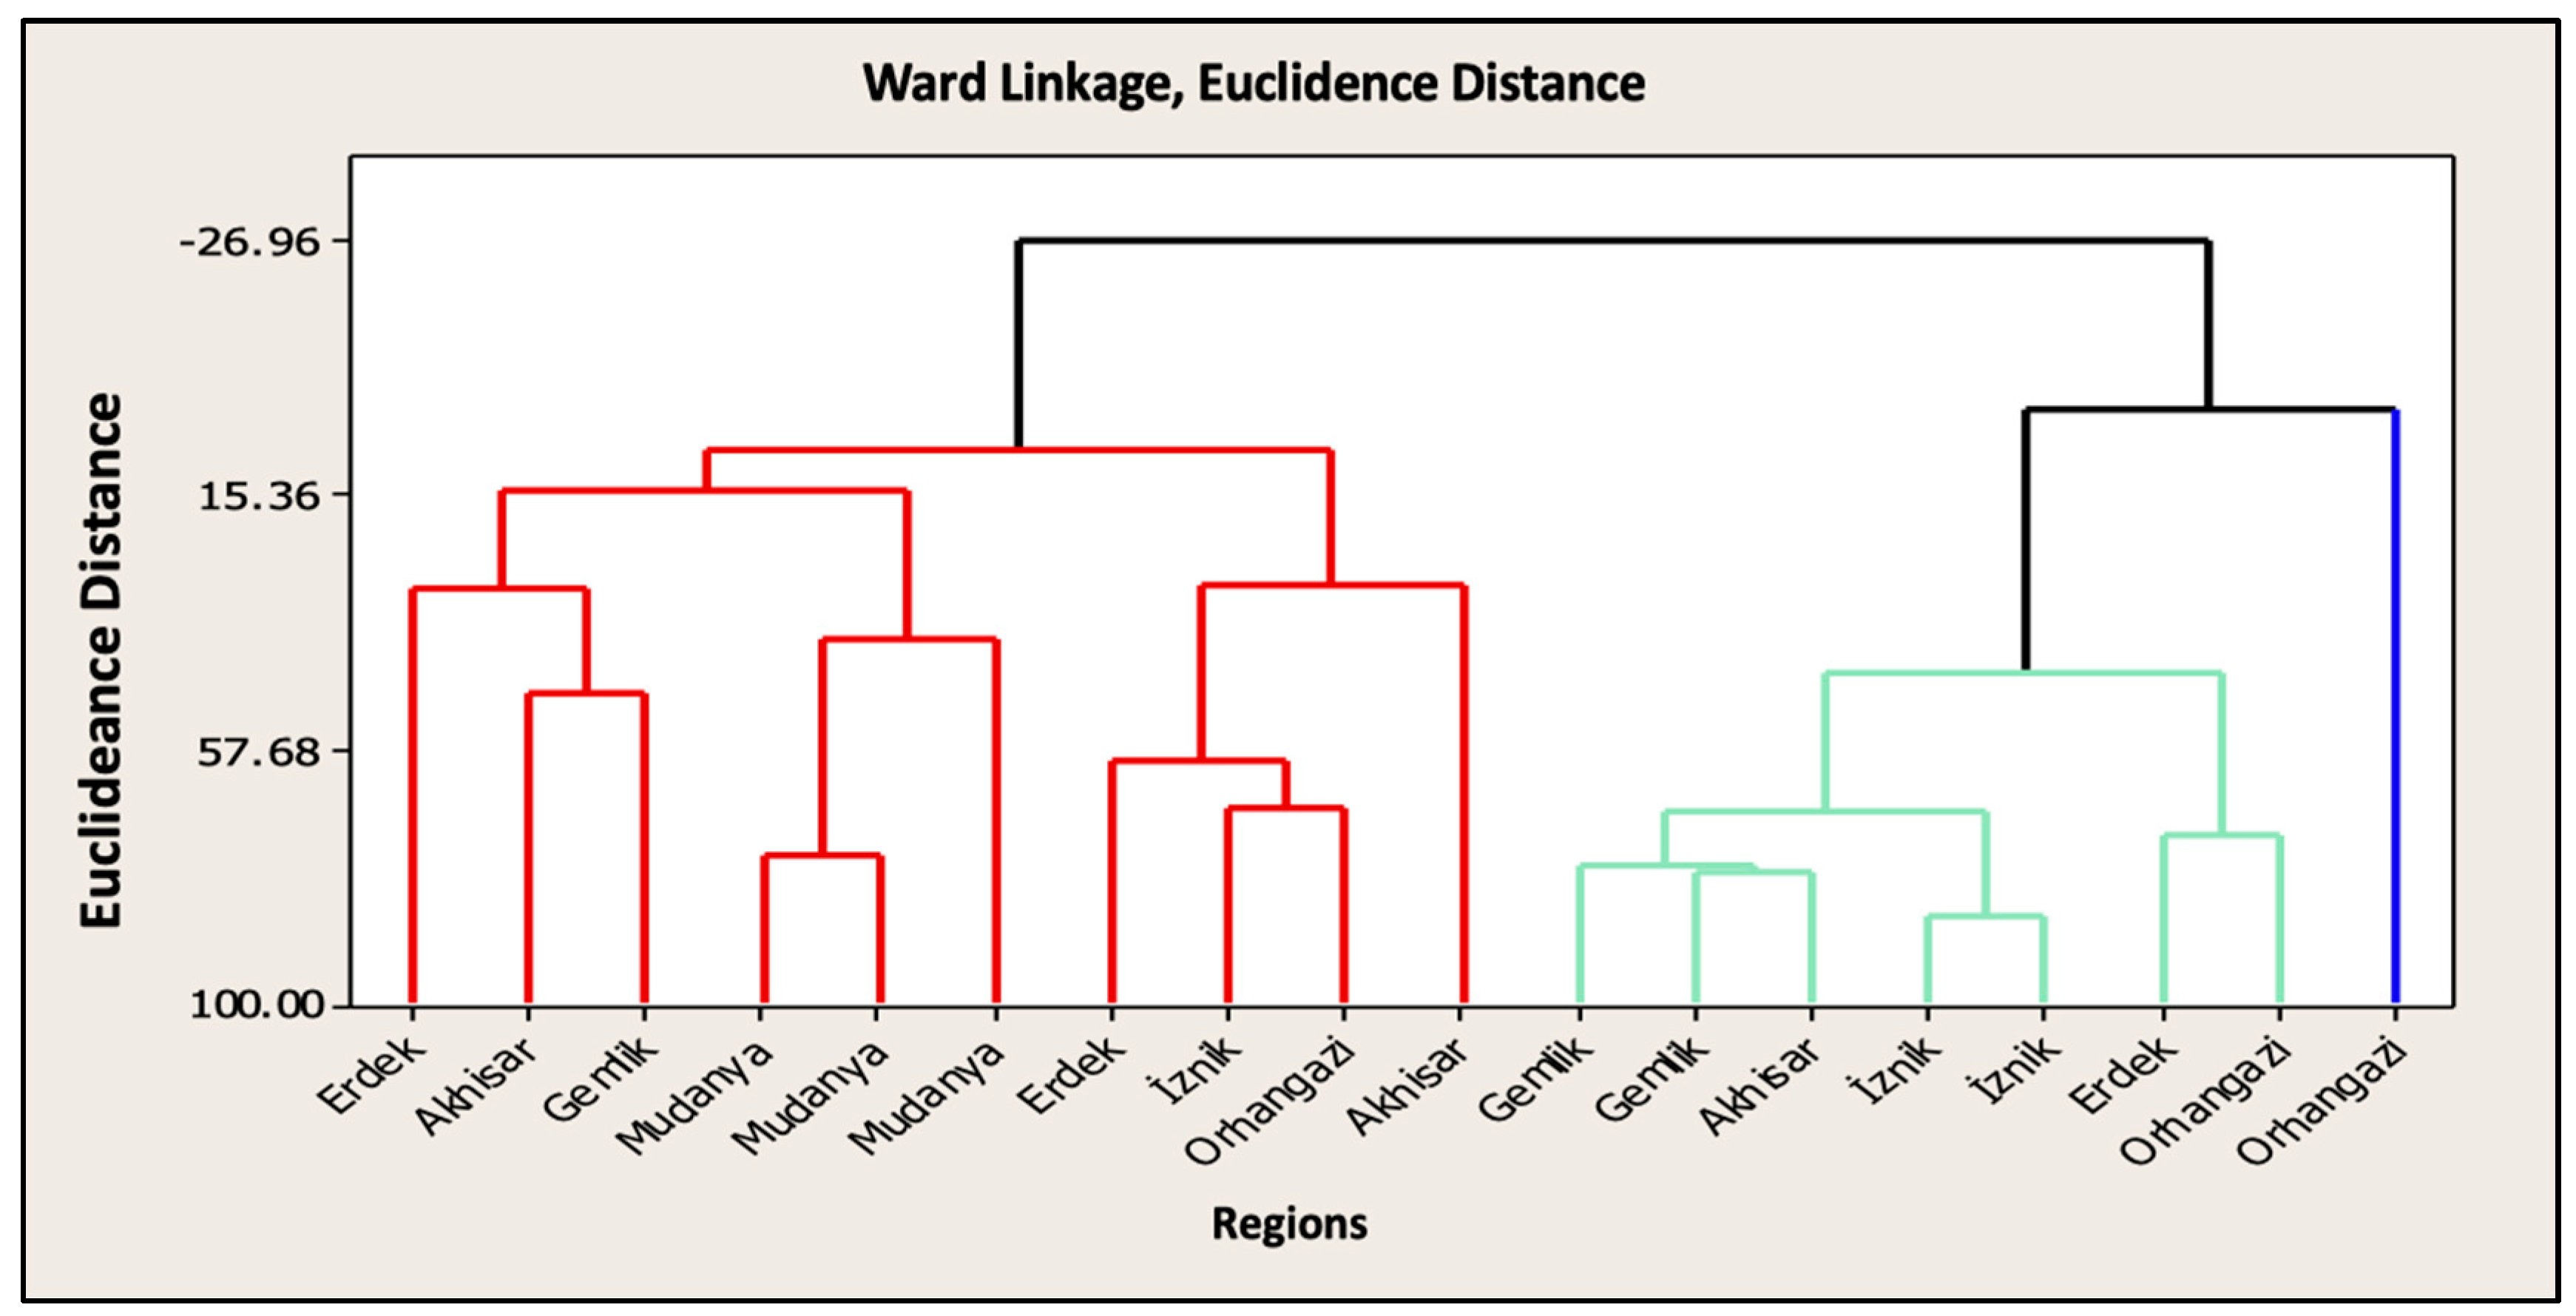
HPLC Identification and Quantification of Phenolic Compounds
5. Conclusions
Author Contributions
Funding
Data Availability Statement
Conflicts of Interest
References
- Iraklia, M.; Chatzopouloua, P.; Ekateriniadou, L. Optimization of ultrasound-assisted extraction of phenolic compounds: Oleuropein, phenolic acids, phenolic alcohols and flavonoids from olive leaves and evaluation of its antioxidant activities. Ind. Crops Prod. 2018, 124, 382–388. [Google Scholar] [CrossRef]
- Ozturk, F.; Ocak, O.; Unal, M.K. Effect of ozone treatment on the physical, microbiological and sensorial properties of Spanish-style table olives. Grasas y Aceites 2020, 71, e348. [Google Scholar] [CrossRef]
- International Olive Council IOC/T.28/Doc No 1/Rev 1; Guidelines for Accomplishment of the Requirements of the Norm ISO 17025 by the Laboratories of Sensory Analysis of Virgin Olive Oil. International Olive Oil Council: Madrid, Spain, 2017.
- Pistarino, E.; Aliakbarian, B.; Casazza, A.A.; Paini, M.; Cosulich, M.E.; Perego, P. Combined effect of starter culture and temperature on phenolic compounds during fermentation of Taggiasca black olives. Food Chem. 2013, 138, 2043–2049. [Google Scholar] [CrossRef] [PubMed]
- Serrano, P.G.; Romero, C.; Brenes, M.; García, P.G. Enrichment in phenolic compounds of black ripe olives through nanofiltration and vacuum evaporation techniques. Innov. Food Sci. Emerg. Technol. 2019, 51, 73–79. [Google Scholar] [CrossRef]
- Rodriguez, P.R.; Barreiro, C.G.; Carballo, M.E.; Perez, C.N.; Otero, R.R.; Gonzales, F.M.; Grande, G.B. Applicability of an ın-vitro digestion model to assess the bioaccessibility of phenolic compounds from olive-related products. Molecules 2021, 26, 6667. [Google Scholar] [CrossRef] [PubMed]
- Deng, J.; Xu, Z.; Xiang, C.; Liu, J.; Zhou, L.; Li, T.; Yang, Z.; Ding, C. Comparative evaluation of maceration and ultrasonic-assisted extraction of phenolic compounds from fresh olives. Ultrason. Sonochem. 2017, 37, 328–334. [Google Scholar] [CrossRef] [PubMed]
- Ryan, D.; Robards, K.; Lavee, S. Determination of phenolic compounds in olives by reversed- phase chromatography and mass spectrometry. J. Chromatogr. 1999, 832, 87–96. [Google Scholar] [CrossRef]
- Salis, C.; Papadakis, I.E.; Hagdimitriou, M. Identification and quantification of phenolic compounds in fresh and processed table olives of cv. ‘Kalamata’. Not. Bot. Horti Agrobot. Cluj-Napoca 2021, 49, 12394. [Google Scholar] [CrossRef]
- Medinaa, G.; Sanzb, C.; Leónc, L.; Pérezb, A.G.; Rosac, R. Phenolic variability in fruit from the ‘Arbequina’ olive cultivar under Mediterranean and Subtropical climatic conditions. Grasas y Aceites 2021, 72, 4–438. [Google Scholar] [CrossRef]
- Mettouchia, S.; Sacchib, R.; Moussaa, Z.E.O.; Paduanob, A.; Savaresec, M.; Tamendjaria, A. Effect of Spanish style processing on the phenolic compounds and antioxidant activity of Algerian green table olives. Grasas y Aceites 2016, 67, 114. [Google Scholar]
- Sahan, Y.; Cansev, A.; Gulen, H. Effect of processing techniques on Antioxidative enzyme activities, antioxidant capacity, phenolic compounds, and fatty acids of table olives. Food Sci. Biotechnol. 2013, 22, 613–620. [Google Scholar] [CrossRef]
- Irmak, S.; Irmak, H. The effects of green table olive processing methods on polyphenol content of some Turkish table olive varieties. J. Food Health Technol. 2021, 4, 296–308. [Google Scholar]
- Lauren, M.; Crawforda, D.M.; Holstegeb, S.C.; Wanga, C. High-throughput extraction method for phenolic compounds in olive fruit (Olea europaea). J. Food Compost. Anal. 2018, 66, 136–144. [Google Scholar]
- Uylaser, V. Changes in phenolic compounds during ripening in ‘Gemlik’ variety olive fruits obtained from different locations. CyTA—J. Food 2015, 13, 167–173. [Google Scholar] [CrossRef]
- Johnson, R.L.; Mitchell, A.E. Reducing phenolics related to bitterness in table olives. J. Food Qual. 2018, 12, 3193185. [Google Scholar] [CrossRef]
- Ozaltas, M.; Savran, M.K.; Ulas, M.; Kaptan, S.; Kokturk, H. Turkiye Olive Growing Sector Report; Olive Research Institute: Bornova, Izmir, Türkiye, 2016; ISBN 978-605-9175-57-9. [Google Scholar]
- Koyuncu, G.; Cabaroglu, T. Determination of quality characteristics and aroma compounds of ‘Gemlik’ variety olive fruit grown in Adana province. Food 2020, 45, 1163–1174. [Google Scholar]
- Ozkan, G.; San, B.; Akcay, U.Ç.; Dagdelen, A.; Dolgun, O.; Konuskan, D.; Gulsoy, S. Comparison of Fruit, Oil and Molecular Characteristics of ‘Gemlik’ Olive Varieties Grown in Marmara, Aegean, Western and Eastern Mediterranean Regions; TUBITAK Project No: 109O099; The Scientific and Technological Research Council of Türkiye (TUBITAK): Ankara, Türkiye, 2011. [Google Scholar]
- Anonymous. Institute Geographical Indication Registration Certificate. Turkish Patent 76, 23 September 2003. [Google Scholar]
- Vinha, A.F.; Ferreres, F.; Silva, B.M.; Valentao, G.A.; Pereira, J.A.; Olivera, M.B.; Seabra, R.M.; Andrade, P.B. Phenolic profiles of Portuguese olive fruits (Olea europaea L.): Influences of cultivar and geographical origin. Food Chem. 2005, 89, 561–568. [Google Scholar] [CrossRef]
- Ramírez, E.; Medina, E.; Brenes, M.; Romero, C. Endogenous enzymes ınvolved in the transformation of oleuropein in Spanish table olive varieties. J. Agric. Food Chem. 2014, 62, 9569–9575. [Google Scholar] [CrossRef]
- Malheiro, R.; Sousa, A.; Casal, S.; Bento, A.; Pereira, J.A. Cultivar effect on the phenolic composition and antioxidant potential of stoned table olives. Food Chem. Toxicol. 2011, 49, 450–457. [Google Scholar] [CrossRef]
- Lodolinia, E.M.; Bañegilb, M.C.; Fernándezb, A.; Adámezb, J.D.; Ramírezb, R.; Vertedor, D.M. Monitoring of acrylamide and phenolic compounds in table olive after high hydrostatic pressure and cooking treatments. Food Chem. 2019, 286, 250–259. [Google Scholar] [CrossRef]
- Othman, B.N.; Roblain, P.; Thonart and Hamdi, M. Tunisian table olive phenolic compounds and their antioxidant capacity. J. Food Sci. 2008, 73, C235–C240. [Google Scholar] [CrossRef] [PubMed]
- Arslan, D.; Ozcan, M.M. Phenolic profile and antioxidant activity of olive fruits of the Turkish variety “Sarıulak” from different locations. Grasas y Aceites 2011, 62, 53–461. [Google Scholar] [CrossRef]
- Ghorbala, B.A.; Leventdurura, S.; Agirmana, B.; Gunduz, B.P.; Kelebek, H.; Çarşanba, E.; Darıcı, M.; Erten, H. Influence of geographic origin on agronomic traits and phenolic content of cv. ‘Gemlik’ olive fruits. J. Food Compost. Anal. 2018, 74, 1–9. [Google Scholar] [CrossRef]
- Tsantili, E. Original article quality attributes and their relations in fresh black ripe ‘Kalamon’ olives (Olea europaea L.) for table use-phenolic compounds and total antioxidant capacity. Int. J. Food Sci. Technol. 2014, 49, 657–665. [Google Scholar] [CrossRef]
- Ozcan, M.M.; Fındık, S.; Aljuhaimi, F.; Ghafoor, K.; Babiker, E.E.; Adiamo, O. The effect of harvest time and varieties on total phenolics, antioxidant activity and phenolic compounds of olive fruit and leaves. J. Food Sci. Technol. 2019, 56, 2373–2385. [Google Scholar] [CrossRef] [PubMed]
- Aktas, A.B.; Ozen, B.; Tokatli, F.; Sen, I. Phenolics profile of a naturally debittering olive in comparison to regular olive varieties. J. Sci. Food. Agric. 2014, 94, 691–698. [Google Scholar] [CrossRef] [PubMed]
- Medjkouh, L.; Tamendjari, A.; Alves, C.R.; Laribi, R.; Oliveira, M.B.P.P. Phenolic profiles of eight olive cultivars from Algeria: Effect of Bactrocera oleae attack. Food Funct. 2018, 9, 890–897. [Google Scholar] [CrossRef] [PubMed]
- Irmak, S. The effects of processing methods on polyphenol content of some Turkish black table olives. Riv. Ital. Delle Sostanze Grasse 2021, 98, 205–215. [Google Scholar]


| Regions | Codes of Regions | Olive Processing Methods Codes | ||
|---|---|---|---|---|
| Raw | Natural Processing (NP) | Spanish Style (SS) | ||
| Gemlik | Gem | GemRaw | GemNP | GemSS |
| Iznik | Izn | IznRaw | IznNP | IznSS |
| Mudanya | Mud | MudRaw | MudNP | MudSS |
| Orhangazi | Orh | OrhRaw | OrhNP | OrhSS |
| Erdek | Erd | ErdRaw | ErdNP | ErdSS |
| Akhisar | Akh | AkhRaw | AkhNP | AkhSS |
| Gemlik Region | Mudanya Region | Iznik Region | |||||||
|---|---|---|---|---|---|---|---|---|---|
| Phenolic Compound (mg/kg) | Raw | Natural Processing | Spanish-Style | Raw | Natural Processing | Spanish-Style | Raw | Natural Processing | Spanish-Style |
| 3Hyt * | 104.11± 2.66 bcd** | 64.54 ± 1.73 def | 40.86± 1.61 efg | 131.69 ± 1.72 abc | 80.32± 1.42 de | 42.91 ± 1.36 efg | 145.58 a ± 2.75 | 49.71 ±3.95 ef | 49.71± 1.59ef |
| Ker | 0.48 ± 0.01 | 0.29 ± 0.05 | 0.29 ± 0.05 | 1.46 ± 0.09 | nd *** | 1.28 ± 0.07 | nd | nd | nd |
| Kum | 1.44 ± 0.04 | 1.92 ± 0.13 | 2.13 ± 0.10 | 5.36 ± 0.55 | 1.60 ± 0.12 | 3.36 ± 0.12 | 2.63 ± 0.12 | 2.54 ± 0.35 | 0.23 ± 0.05 |
| Kat | 1.44 ± 0.04 | 1.87 ± 0.12 | 1.87 ± 0.11 | 5.36 ± 0.55 | 5.53 ± 0.35 | 3.66 ± 0.11 | 2.63 ± 0.12 | 4.51 ± 0.66 | 1.63 ± 0.12 |
| Tyr | 8.09 ± 1.28 bc | 4.43 ± 0.60 c | 4.68± 0.50 c | 7.26 ± 1.25 c | 3.14± 0.28 c | 3.36 ± 0.10 c | 6.87± 1.89 c | 16.02 ± 1.21 b | 15.89 ± 1.22 b |
| 4Hdf | 38.89 ± 2.02 bc | 42.77 ± 1.78 bc | 42.77 ± 1.28 bc | 48.12 ± 1.37 bc | 50.95 ± 1.25 bc | 34.63 ± 1.16 bc | 26.86 ± 2.12 cd | 34.03± 1.35 bc | 34.04 ± 1.41 bc |
| L7g | 39.25 ± 2.75 | 21.46 ± 0.82 | 0.32 ± 0.05 | 34.82 ± 1.22 | 26.30 ± 1.13 | 14.18 ± 1.55 | 8.59 ± 1.54 | 6.80 ± 0.36 | 8.02 ± 0.93 |
| L4g | 3.56 ± 0.02 | 0.72 ± 0.02 | 0.09 ± 0.01 | 0.52 ± 0.01 | 0.17 ±0.01 | nd | nd | 0.96 ± 0.08 | 0.96 ± 0.09 |
| Trs | 0.59 ± 0.03 | 0.10 ± 0.01 | 0.32 ± 0.04 | 3.73 ± 0.20 | 0.54 ± 0.03 | 1.05 ± 0.06 | 0.08 ± 0.01 | 0.06 ± 0.01 | 0.06 ± 0.01 |
| Lt | 1.60 ± 0.12 lj | 11.28 ± 0.59 efgh | 4.50 ± 0.52 hlj | 13.09± 1.14 efg | 0.17± 0.01 j | 5.63 ± 0.12 ghlj | 21.60± 1.53 cd | 0.96 ± 0.05 lj | 5.62 ± 0.70 ghlj |
| Kam | 1.60 ± 0.12 | 0.63 ± 0.02 | 0.15 ± 0.01 | 0.79 ± 0.02 | 0.48 ± 0.01 | 0.08 ± 0.01 | 0.32 ± 0.01 | 0.23 ± 0.08 | 0.23 ±0.01 |
| Apg | 0.23 ± 0.05b | nd | nd | 0.52± 0.08 b | 0.57± 0.01 b | nd | 0.88 ± 0.03 b | nd | nd |
| Orhangazi Region | Erdek Region | Akhisar Region | |||||||
| Phenolic Compound (mg/kg) | Raw | Natural Processing | Spanish-Style | Raw | Natural Processing | Spanish-Style | Raw | Natural Processing | Spanish-Style |
| 3Hyt * | 155.04 ± 3.42 a** | 32.76 ± 1.43 fg | 4.58 ± 0.12 g | 168.21 ± 2.55 a | 131.01 ± 2.73 abc | 44.97 ± 2.08 ef | 141.38 ± 2.13 ab | 94.32 ± 3.03 cd | 42.52 ± 2.05 efg |
| Ker | nd *** | 0.20 ± 0.01 | nd | nd | nd | nd | nd | 0.15 ± 0.01 | 0.15 ± 0.03 |
| Kum | 0.89 ± 0.03 | 4.17 ± 0.08 | 1.90 ± 0.08 | 7.01 ± 0.70 | 5.90 ± 1.87 | 4.71 ± 0.17 | 10.64 ± 1.46 | 2.30 ± 0.44 | 1.55 ± 0.44 |
| Kat | 7.32 ± 1.21 | 1.86 ± 0.12 | 0.09 ± 0.01 | 5.51 ± 0.55 | nd | nd | 5.83 ± 0.85 | nd | 2.85 ± 0.39 |
| Tyr | 4.19 ± 0.65 c | 47.24 ± 2.45 a | 1.64 ± 0.04 c | 3.66 ± 0.65 c | 1.95 ± 3.05 c | 1.57 ± 0.44 c | 8.12 ± 1.29 bc | 2.21 ± 0.85 c | 4.50 ± 0.64 c |
| 4Hdf | 30.17 ± 1.84 bc | 27.92 ± 1.84 cd | 4.04 ± 0.07 de | 40.40 ± 1.57 bc | 37.17 ± 11.94 bc | 0.76 ± 0.05 e | 49.41 ± 2.78 bc | 97.58 ± 2.36 a | 54.29 ± 1.80 b |
| L7g | 15.48 ± 0.57 | 4.17 ± 0.07 | 8.02 ± 0.17 | 19.65 ± 0.93 | 48.99 ± 3.42 | 11.26 ± 0.51 | 40.24 ± 1.11 | 58.64 ± 1.70 | 26.21 ± 1.63 |
| L4g | 2.39 ± 0.02 | 4.28 ± 0.09 | nd | nd | 1.36 ± 0.04 | 0.39 ± 0.03 | nd | 1.63 ± 0.29 | 0.18 ± 0.08 |
| Trs | 0.29 ± 0.01 | 7.37 ± 0.42 | 0.01 ± 0.00 | 0.83 ± 0.03 | 1.36 ± 0.05 | 3.70 ± 0.64 | 0.47 ± 0.09 | 0.66 ± 0.72 | nd |
| Lt | 18.92 ± 1.08 cde | 9.09 ± 0.21 fghl | 1.60 ± 0.11 lj | 30.33 ± 1.05 b | 0.60 ± 0.03 j | 14.76 ± 1.74 def | 53.56 ± 2.31 a | 27.18 ± 1.12 bc | 7.38 ± 0.25 fghlj |
| Kam | 0.39 ± 0.01 | nd | 0.10 ± 0.01 | 0.56 ± 0.04 | 0.66 ± 0.05 | 0.10 ± 0.01 | 0.24 ± 0.01 | 0.73 ± 0.05 | 0.13 ± 0.01 |
| Apg | 0.55 ± 0.02 b | nd | nd | 0.56 ± 0.01 b | 0.42 ± 0.01 b | 0.15 ± 0.03 b | 5.12±0.25 a | 0.46 ± 0.0 b | nd |
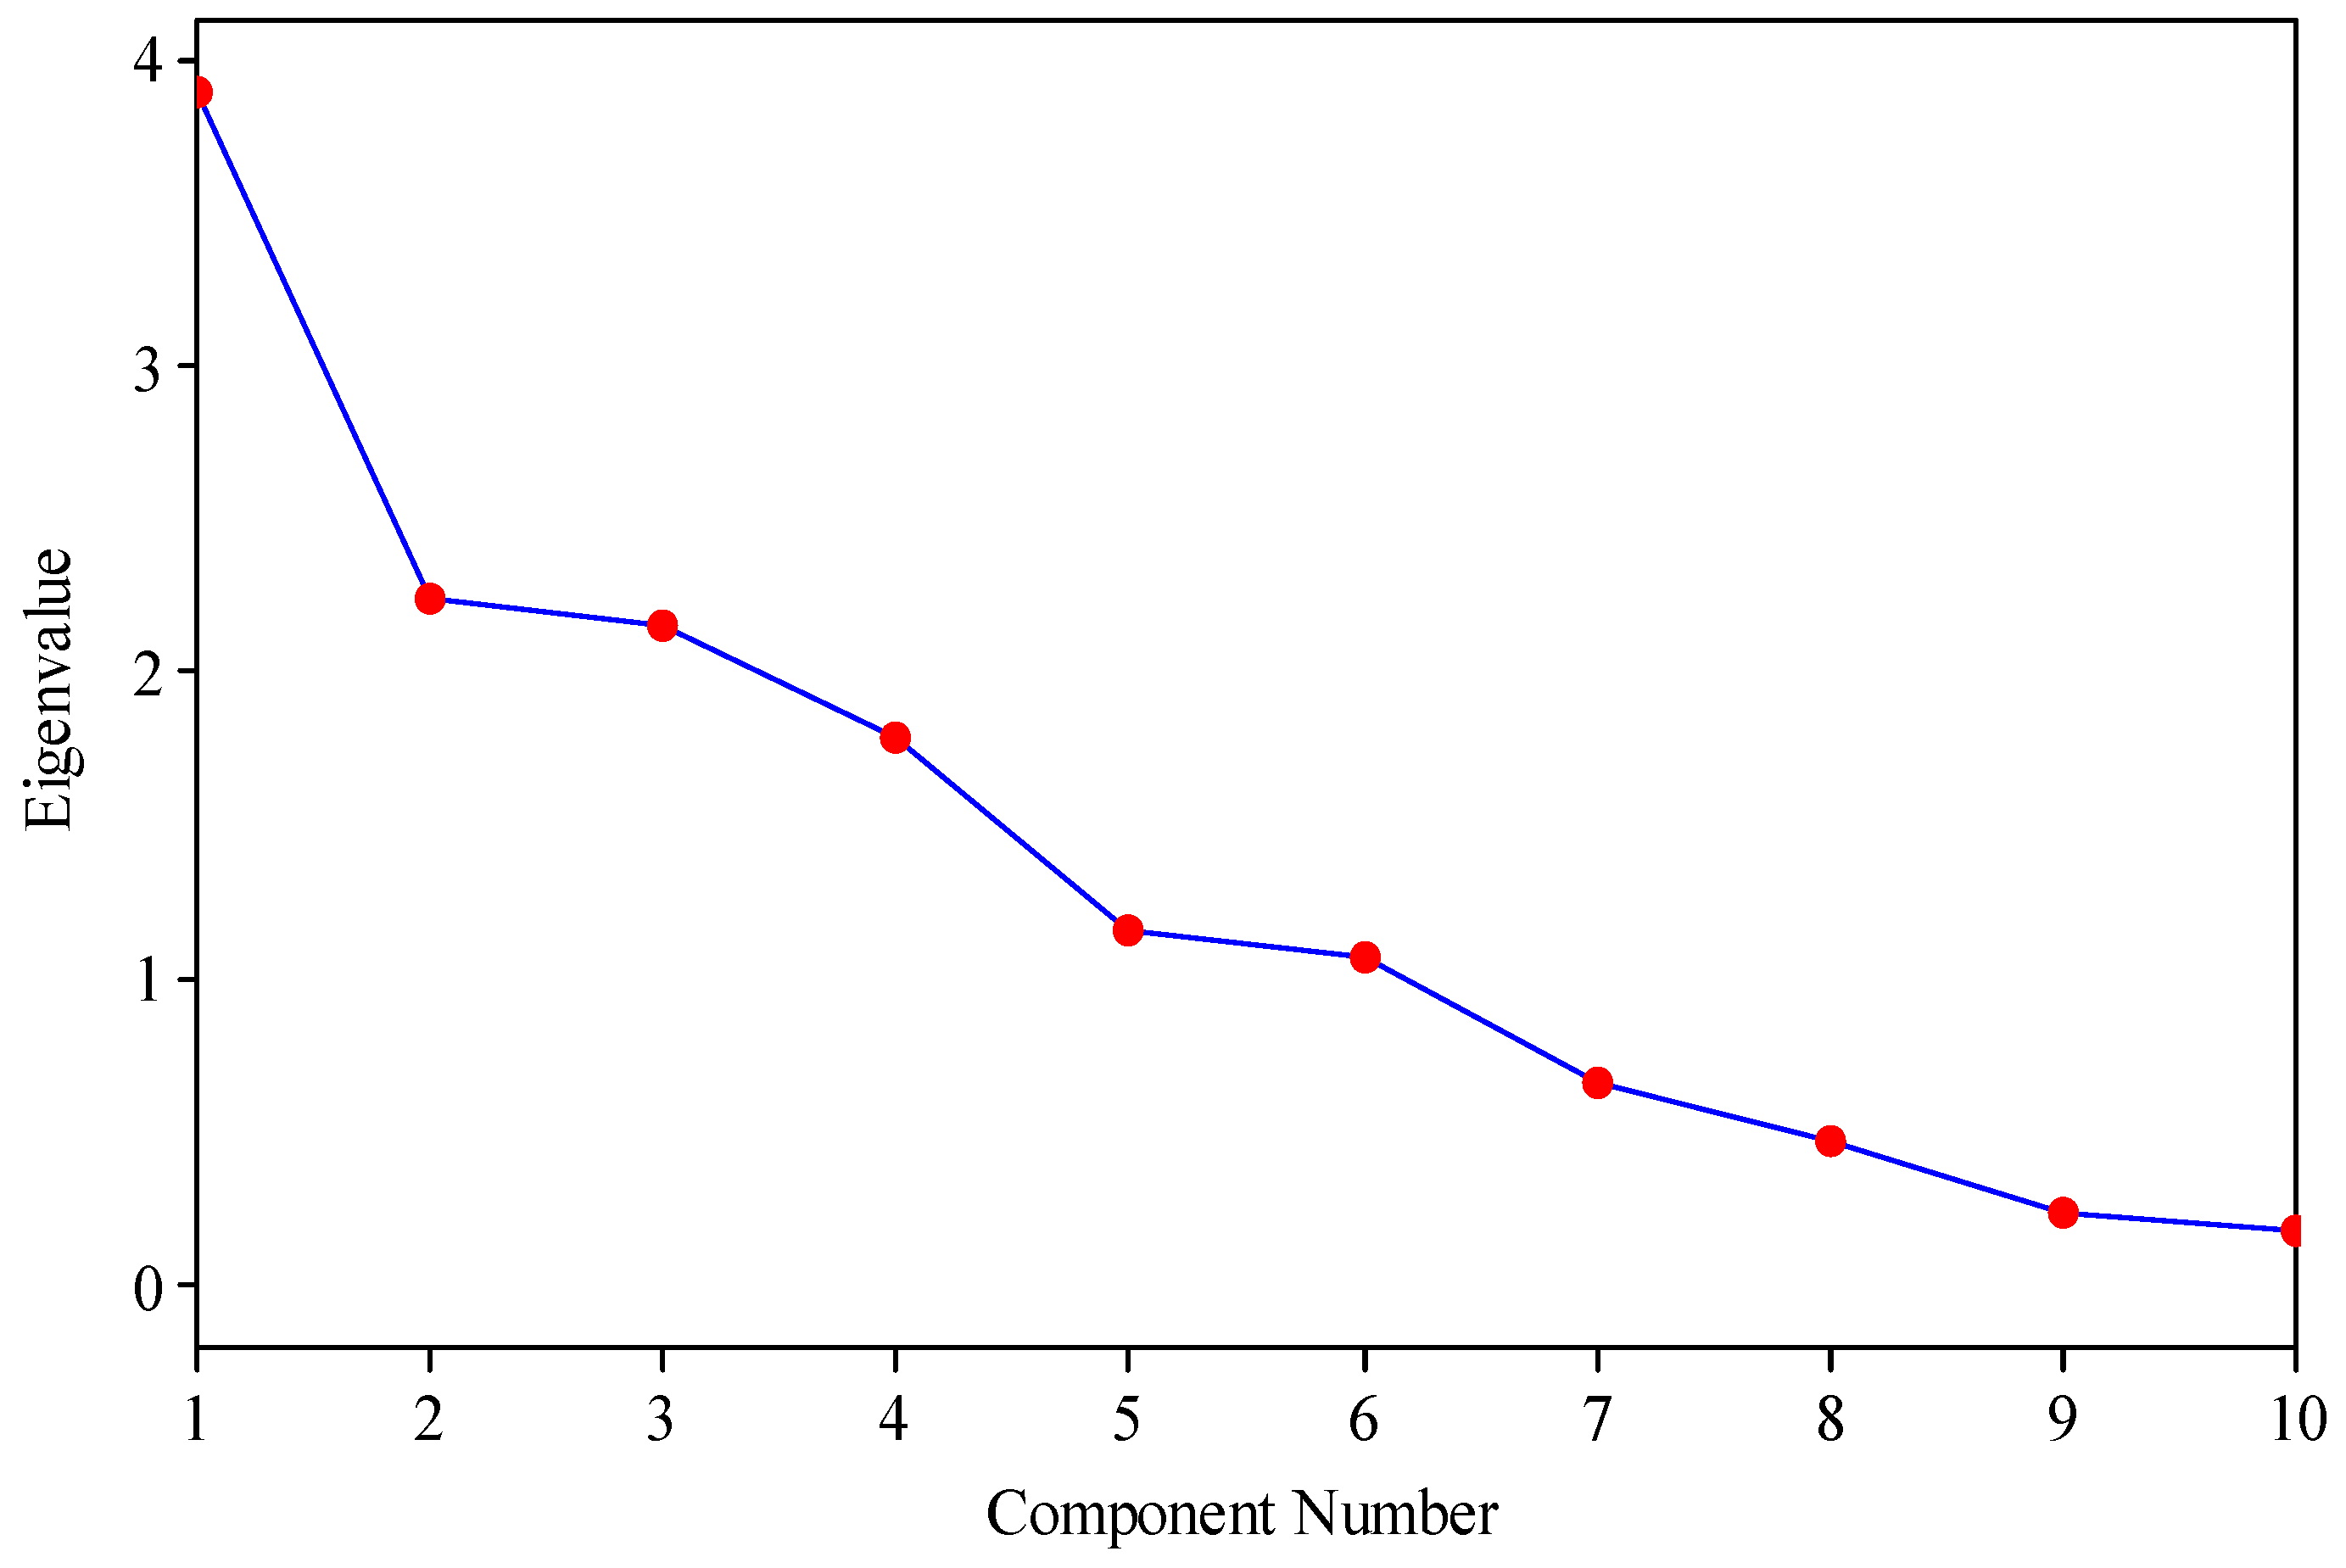
| No | Eigenvalues | % Exp. Var. | Cum. % Exp. Var. |
|---|---|---|---|
| 1 | 3.90 | 28.23 | 28.23 |
| 2 | 2.24 | 16.21 | 44.44 |
| 3 | 2.15 | 15.59 | 60.03 |
| 4 | 1.79 | 12.93 | 72.95 |
| 5 | 1.16 | 8.38 | 81.33 |
| 6 | 1.06 | 7.67 | 89.00 |
| 7 | 0.65 | 4.73 | 93.73 |
| 8 | 0.47 | 3.41 | 97.13 |
| 9 | 0.23 | 1.67 | 98.80 |
| 10 | 0.17 | 1.20 | 100.00 |
Disclaimer/Publisher’s Note: The statements, opinions and data contained in all publications are solely those of the individual author(s) and contributor(s) and not of MDPI and/or the editor(s). MDPI and/or the editor(s) disclaim responsibility for any injury to people or property resulting from any ideas, methods, instructions or products referred to in the content. |
© 2023 by the authors. Licensee MDPI, Basel, Switzerland. This article is an open access article distributed under the terms and conditions of the Creative Commons Attribution (CC BY) license (https://creativecommons.org/licenses/by/4.0/).
Share and Cite
Demir, C.; Yildiz, E.; Gurbuz, O. Profile Phenolic Compounds in Spanish-Style and Traditional Brine Black Olives (‘Gemlik’ Cv.) Provided from Different Regions of Türkiye. Processes 2023, 11, 2412. https://0-doi-org.brum.beds.ac.uk/10.3390/pr11082412
Demir C, Yildiz E, Gurbuz O. Profile Phenolic Compounds in Spanish-Style and Traditional Brine Black Olives (‘Gemlik’ Cv.) Provided from Different Regions of Türkiye. Processes. 2023; 11(8):2412. https://0-doi-org.brum.beds.ac.uk/10.3390/pr11082412
Chicago/Turabian StyleDemir, Cansu, Elif Yildiz, and Ozan Gurbuz. 2023. "Profile Phenolic Compounds in Spanish-Style and Traditional Brine Black Olives (‘Gemlik’ Cv.) Provided from Different Regions of Türkiye" Processes 11, no. 8: 2412. https://0-doi-org.brum.beds.ac.uk/10.3390/pr11082412