Article

Influence of Fluid Properties on Intensity of Hydrodynamic Cavitation and Deactivation of Salmonella typhimurium

1
Sabanci University Nanotechnology Research and Application Center, 34956 Tuzla, Istanbul, Turkey
2
Faculty of Engineering and Natural Science, Sabanci University, 34956 Tuzla, Istanbul, Turkey
3
Center of Excellence for Functional Surfaces and Interfaces for Nano-Diagnostics (EFSUN), Sabanci University, Orhanli, 34956 Tuzla, Istanbul, Turkey
4
Department of Biomedical Engineering and Health Systems, KTH Royal Institute of Technology, SE-141 57 Stockholm, Sweden
*
Author to whom correspondence should be addressed.
Submission received: 1 February 2020 / Revised: 3 March 2020 / Accepted: 8 March 2020 / Published: 10 March 2020

Abstract

:
In this study, three microfluidic devices with different geometries are fabricated on silicon and are bonded to glass to withstand high-pressure fluid flows in order to observe bacteria deactivation effects of micro cavitating flows. The general geometry of the devices was a micro orifice with macroscopic wall roughness elements. The width of the microchannel and geometry of the roughness elements were varied in the devices. First, the thermophysical property effect (with deionized water and phosphate-buffered saline (PBS)) on flow behavior was revealed. The results showed a better performance of the device in terms of cavitation generation and intensity with PBS due to its higher density, higher saturation vapor pressure, and lower surface tension in comparison with water. Moreover, the second and third microfluidic devices were tested with water and Salmonella typhimurium bacteria suspension in PBS. Accordingly, the presence of the bacteria intensified cavitating flows. As a result, both devices performed better in terms of the intensity of cavitating flow with the presence of bacteria. Finally, the deactivation performance was assessed. A decrease in the bacteria colonies on the agar plate was detected upon the tenth cycle of cavitating flows, while a complete deactivation was achieved after the fifteenth cycle. Thus, the proposed devices can be considered as reliable hydrodynamic cavitation reactors for “water treatment on chip” applications.

1. Introduction

A sudden pressure drop in fluidic systems, such as centrifugal pumps, hydro turbines, and diesel engine injectors, leads to local pressures lower than the saturation vapor pressure of the working fluid, which triggers the phase change phenomenon known as cavitation. The destructive effects on the turbomachinery as a result of cavitating flows, as well as methods for prevention of cavitation, have attracted much attention. Numerical and experimental methods have aided the researchers for these purposes. For instance, Deng et al. [1] developed a numerical model to characterize cavitation in centrifugal pump impellers in transporting water and diesel. They could include the effects of viscosity and surface tension in their proposed model. In another study, Escaler et al. [2] studied cavitating flows in hydro turbines and its negative instability effect on the performance due to the draft tube swirl. They also presented different types of cavitation, namely leading edge cavitation, traveling bubble cavitation, draft tube swirl, inter-blade vortex cavitation, and Von Karman vortex cavitation. The above-mentioned studies proved the destructive potential of hydrodynamic cavitation, which could be utilized in different applications as well.
The advances in small scale bubble generation and the confirmation of the massive energy release upon bubble collapse caused a paradigm shift. Many researchers have already started to exploit the energy released upon the collapse of cavitation bubbles in different applications such as energy harvesting [3,4], water treatment [5,6], biological applications such as urinary stone treatment [7], food industry [8], and heat transfer [9,10].
According to the thermodynamic phase diagram [11], phase change phenomena happen as a result of temperature increase (boiling) or pressure drop (cavitation) in fluidic systems. Sudden pressure drop happens as the fluid experiences a sudden decrease in the cross-sectional area of the channel due to the existence of a small flow restrictive element such as orifice [12] or venturi [13], which could lead to hydrodynamic cavitation, while the propagation of acoustic waves in the bulk of the fluid forming low-pressure nodes [14] could trigger acoustic cavitation.
In hydrodynamic cavitation, different parameters such as thermophysical properties of the working fluid, geometrical dimensions, and surface roughness alter the flow behavior in fluidic systems. The generation of cavitating flows in microfluidic devices has been receiving increasing attention. As a result of research efforts in this emerging field, there are already parametric studies in the literature. For instance, Ghorbani et al. [15] studied the effect of various lateral wall roughness element geometries in micro orifices fabricated on silicon. They could show that the equilateral triangle roughness elements increased the intensity of cavitating flows and assisted the development of twin cavities along the channel. In this study, they concluded that small roughness elements and shorter total length raised the intensity. In another study, Carpenter et al. [16] studied the effect of different geometrical cavitation generators on the emulsification of oil in water. They fabricated seven different geometries, including both orifice plate and venturi pipe, and could prove the direct dependence of geometry on the size of generated droplets. The generated nanoemulsion of mustard oil in water was significantly stable after their experiments under thermal stress and centrifugal condition. They could also demonstrate that hydrodynamic cavitation was 11 times more energy-efficient compared to ultrasonication. The thermophysical properties of the working fluid also play a crucial role. Hence, many studies concentrated on these parameters [17,18]. Since the generation of hydrodynamic cavitating flows in microfluidic devices is rather cheap, and this type of reactors are easy to scale up, they have received considerable attention in the literature. The stationary sections of these reactors and their easy fabrication process flows increase the popularity and efficiency of these reactors.
All the above-mentioned studies would have a larger impact if they could be implemented in industrial or clinical applications. For instance, Gevari et al. [3] utilized intensified cavitating flows by means of Perfluoropentane (PFC5) droplet addition to the working fluid to harvest more energy from the heat generation upon bubble collapse via micro thermoelectric generators. Dular et al. [6] used the energy of collapsing bubbles for water and wastewater treatment. They could demonstrate the effectiveness of cavitating flows on removal and deactivation of microorganisms available in water sources. They could successfully remove various organisms such as bacteria, viruses, pharmaceutical pollutions, and algae from the water. Various studies on water treatment application with hydrodynamic cavitation have manifested the importance of finding a cheap and easy method to remove microorganisms from water, such as bacteria [19,20].
Salmonella enterica subsp. enterica, serovar typhimurium (S. typhimurium) is a Gram-negative bacterium, which abundantly exists in the intestines of humans and mammals. S. typhimurium causes toxic syndromes through the intake of contaminated water or food products such as fruit juice, milk, yogurt, cheese, and salad [21,22]. The origin of the toxication is lipopolysaccharides (LPS) located on bacterial membranes. LPSs are composed of Lipid A and oligosaccharide antigen units (O-antigens and Core-antigens), which constitute almost 75% of the bacterial membrane surface. O-antigens are positioned at the edge of the LPS units, and they are the principal target of antibodies produced by immune system cells. LPSs contribute to the conformational change of the bacterial surface and can make the bacteria unrecognizable by the immune system cells, and eventually, the biological system becomes infected by the bacteria. The existence of bacteria in main water or food sources might cause severe health problems if not treated effectively and continuously. Developing countries suffer from a lack of clean water sources [23] due to the increasing growth of the population and the process of urbanization. As old pipelines running to open channels of drain water are highly susceptible to contamination, water quickly becomes contaminated at gathering parts in most of the cases [24]. Some processes involved in water treatment are physical and chemical processes, including filtration, slow sand filter (SSF), and cavitation.
Regarding the cavitation method, numerous new-fangled systems were considered. To set an example, Panda et al. [25] provided a liquid whistle hydrodynamic cavitation reactor (LWHCR) for the treatment of dicofol, known as a hazardous pollutant due to its troublemaking endocrine features. In the abovementioned study, major parameters, including the initial concentration of the pollutant, pH, and temperature, were studied. Following this, Parthasarathy et al. [26] explored LWHCR as a system for producing submicron emulsions using the hydrodynamic-assisted emulsification process. Initial pressure and distance between the blade and orifice plate were the parameters examined in this study. In another study, Tang et al. [27] improved high-pressure LWHCR for the generation of highly stable water-in-oil-in-water emulsions for the controlled release of ferrous fumarate extensively used for the treatment of a common type of anemia, namely, iron deficiency.
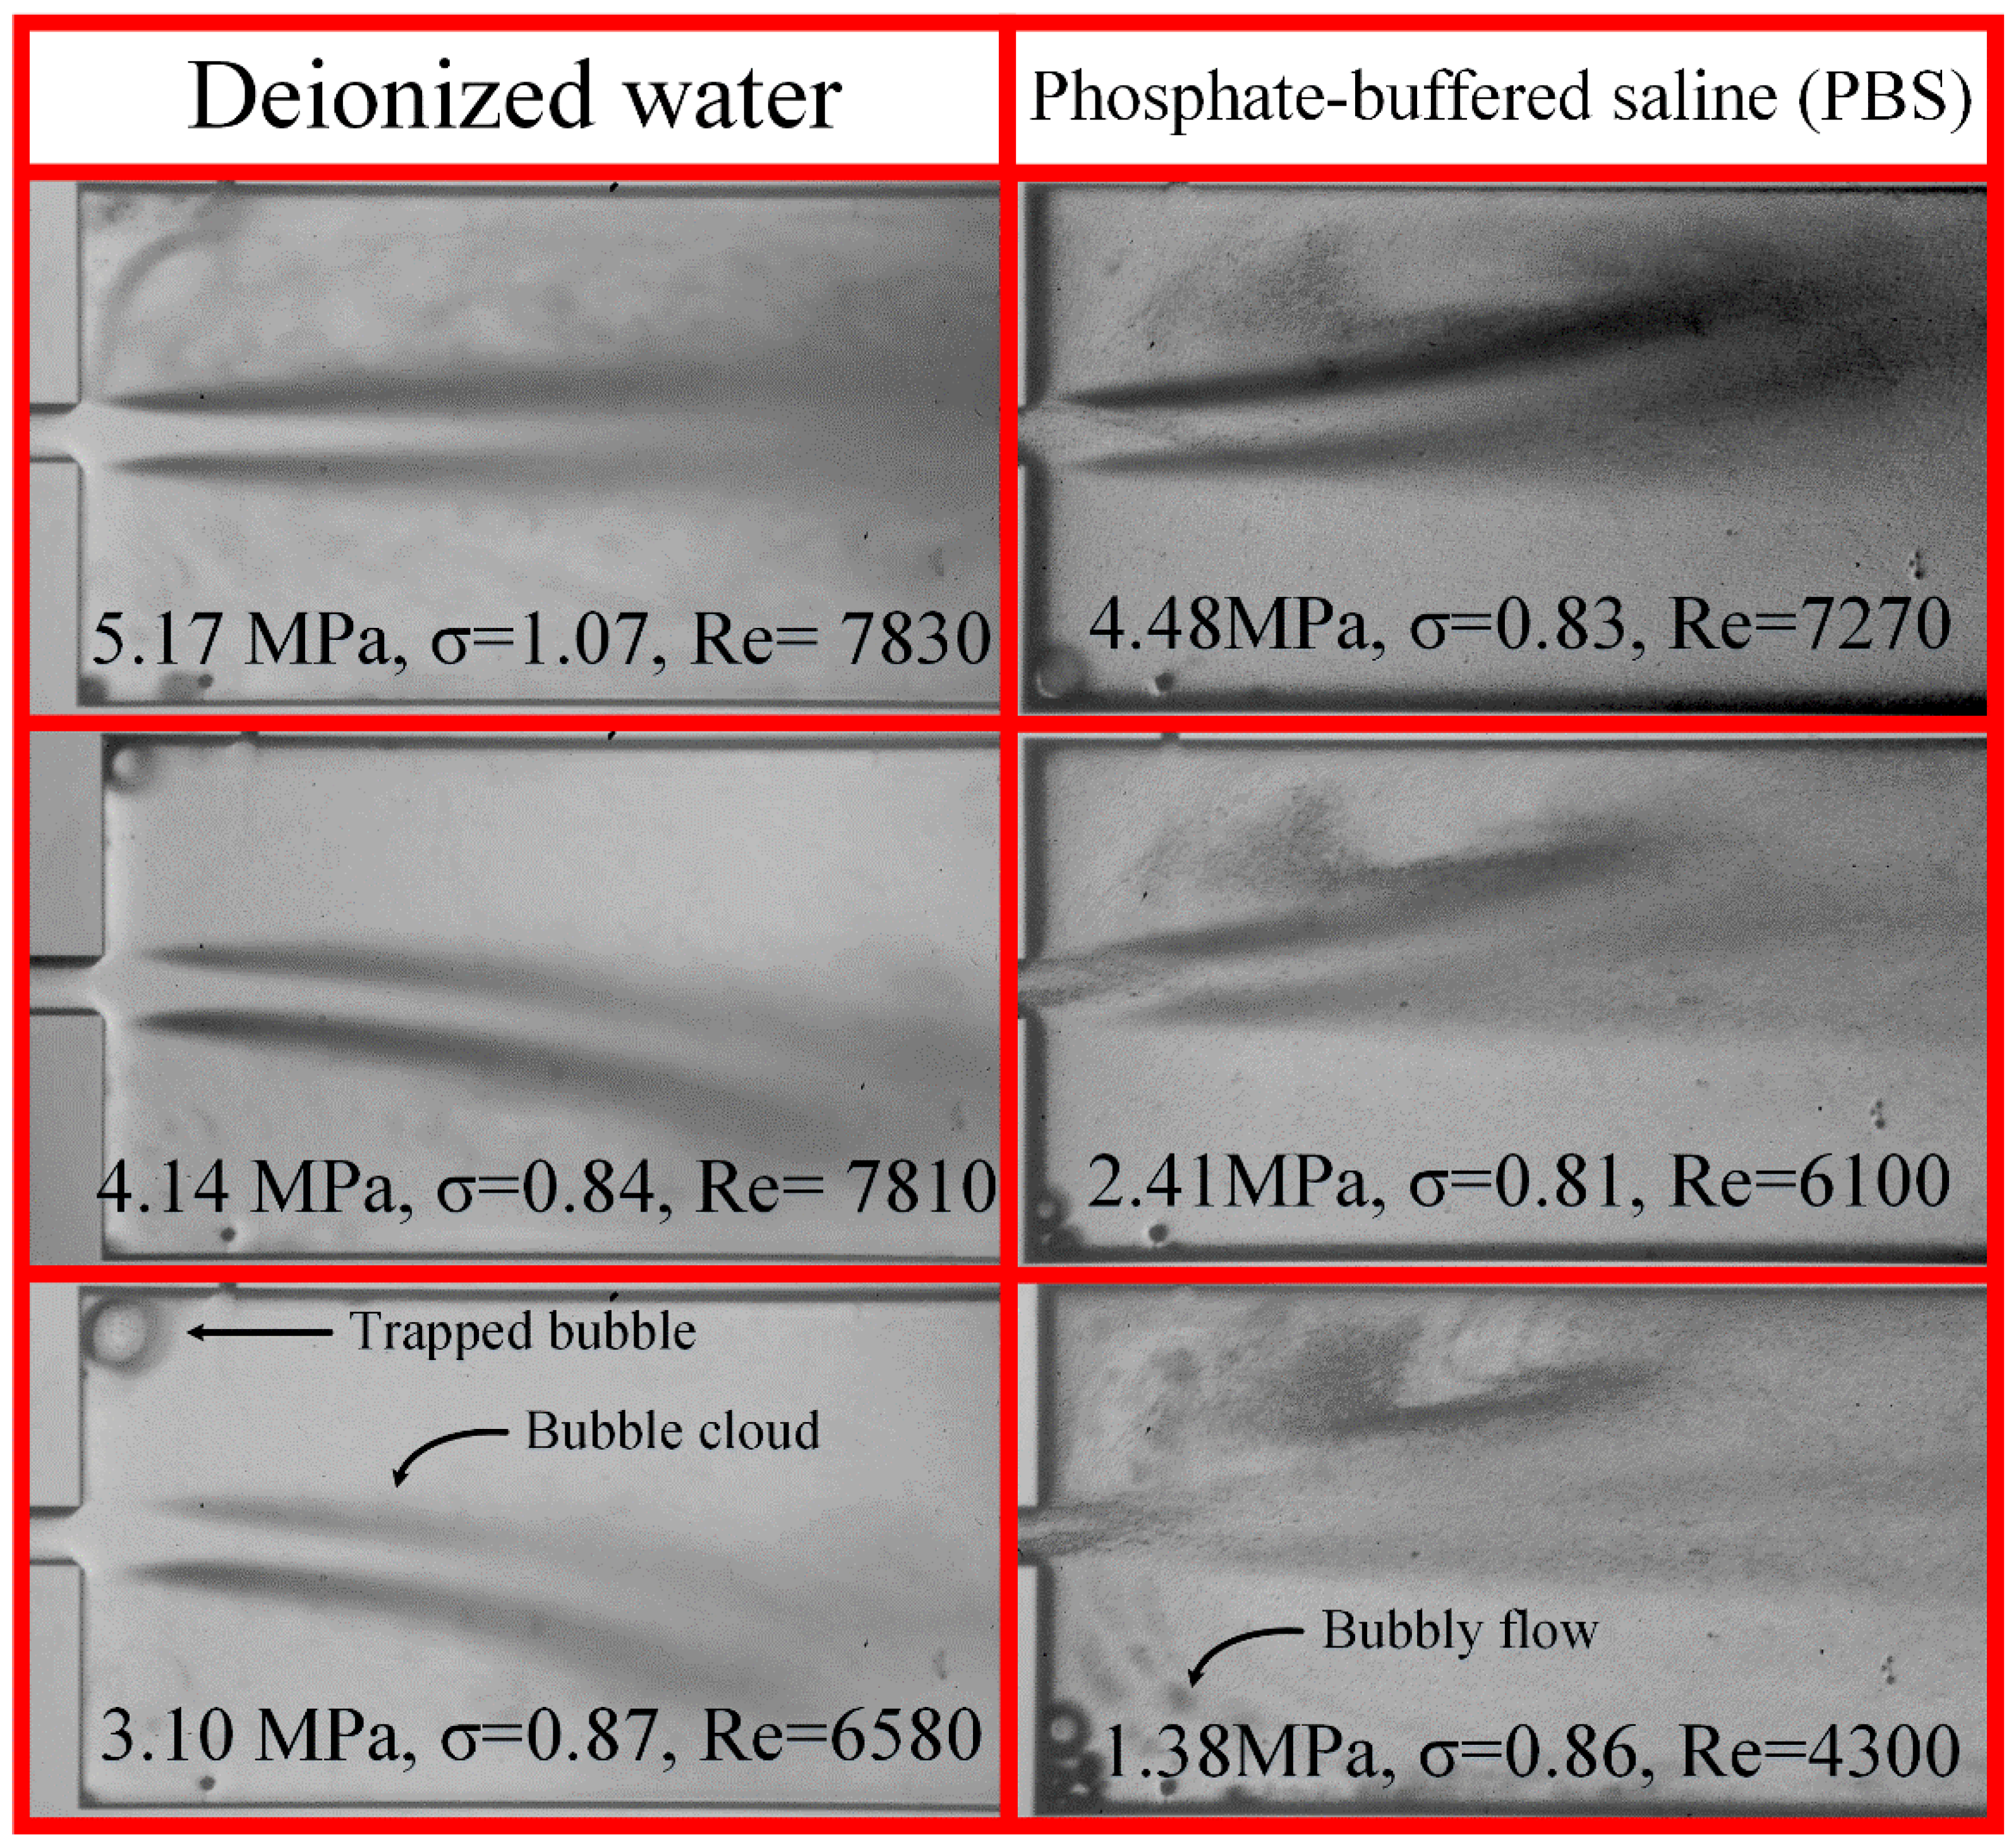
In this study, hydrodynamic cavitation is achieved as a result of a sudden decrease in the cross-sectional area of the fluid path, which gives rise to a sudden increase in the velocity of the working fluid. Three microfluidic devices are fabricated using conventional microfabrication methods on silicon and are bonded to the glass. The microfluidic devices withstand high-pressures (up to 8.30 MPa). First, the effect of the thermophysical properties of the working fluid (using deionized water and phosphate-buffered saline (PBS)) is studied in the microfluidic devices, and the flow behavior is compared for the case of water and PBS. Cavitation number, Reynolds number, cavitation flow rate, and tensile strength of the working fluid are parameters to analyze the flow behavior. The presence of bacteria, i.e., S. typhimurium acts as a solid interface in the working fluid to enhance heterogeneous bubble nucleation. In the last section of this study, a suspension of this bacteria in PBS is prepared and is used as the working fluid. Cavitating flows are visualized in the presence of the bacteria. Finally, the deactivation performance of the device is assessed on one of the microfluidic devices.
As a result, this study focuses on hydrodynamic cavitation from two perspectives: first, the effects of the thermophysical properties of working fluids on cavitating flows, and second, the effect of energy release upon bubble collapse on the activity of bacteria. The high deactivation efficiency of the proposed device is also presented and discussed.

2. Materials and Methods

The microfluidic devices used in the experiments housed micro orifices etched in silicon and covered with glass. The designed and assembled experimental setup in this study introduced the working fluid to the system at an inlet pressure, and the high-speed camera recorded flow patterns during the experiments. Pressure sensors were also installed to measure the pressures at three locations (inlet, nozzle entrance, and extension). The system performance with different working fluids, namely, water, PBS, and suspension of PBS/bacteria, were obtained and compared.
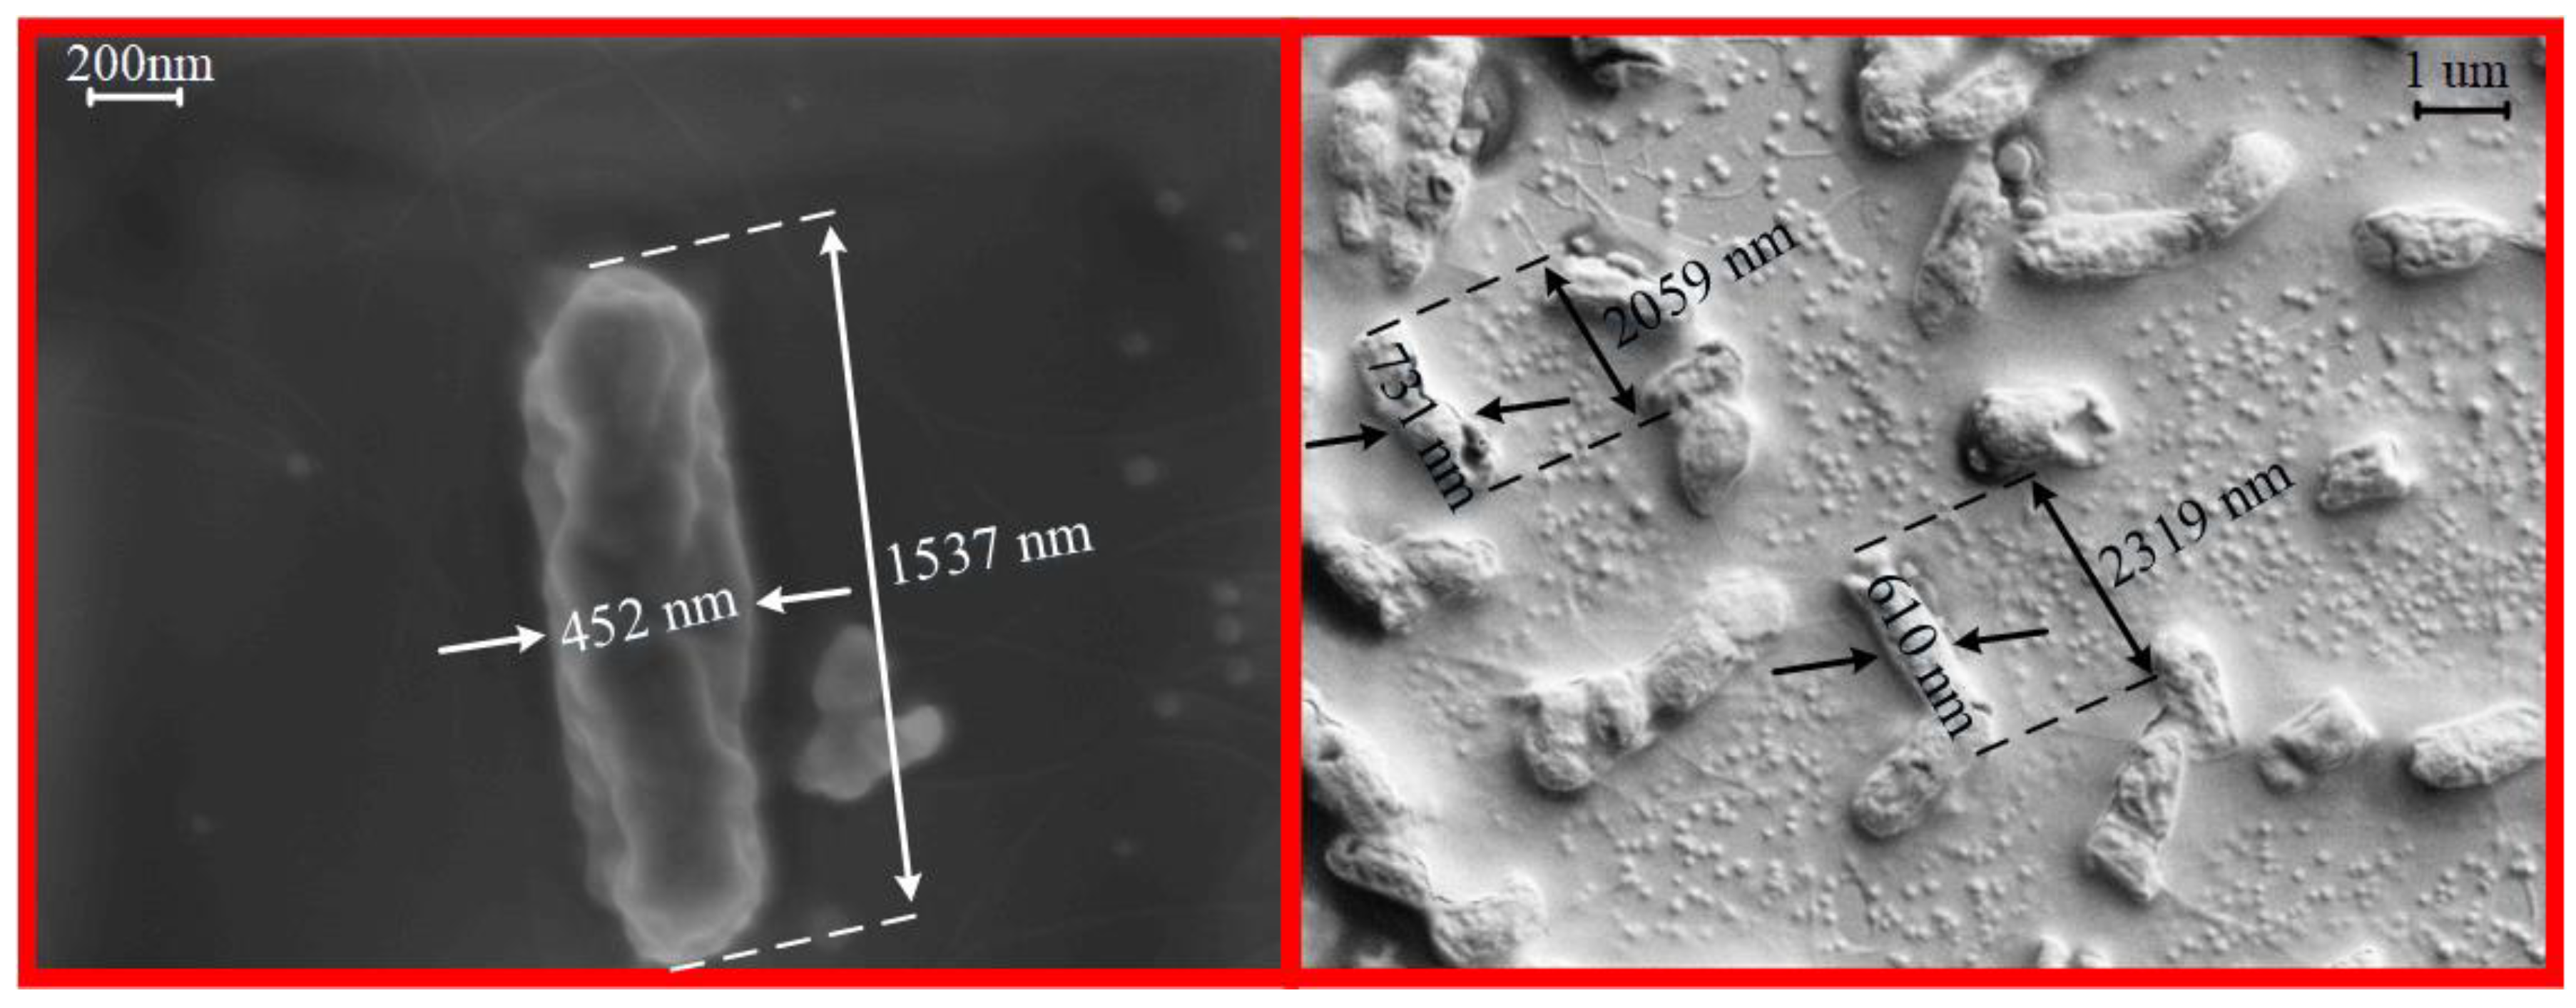
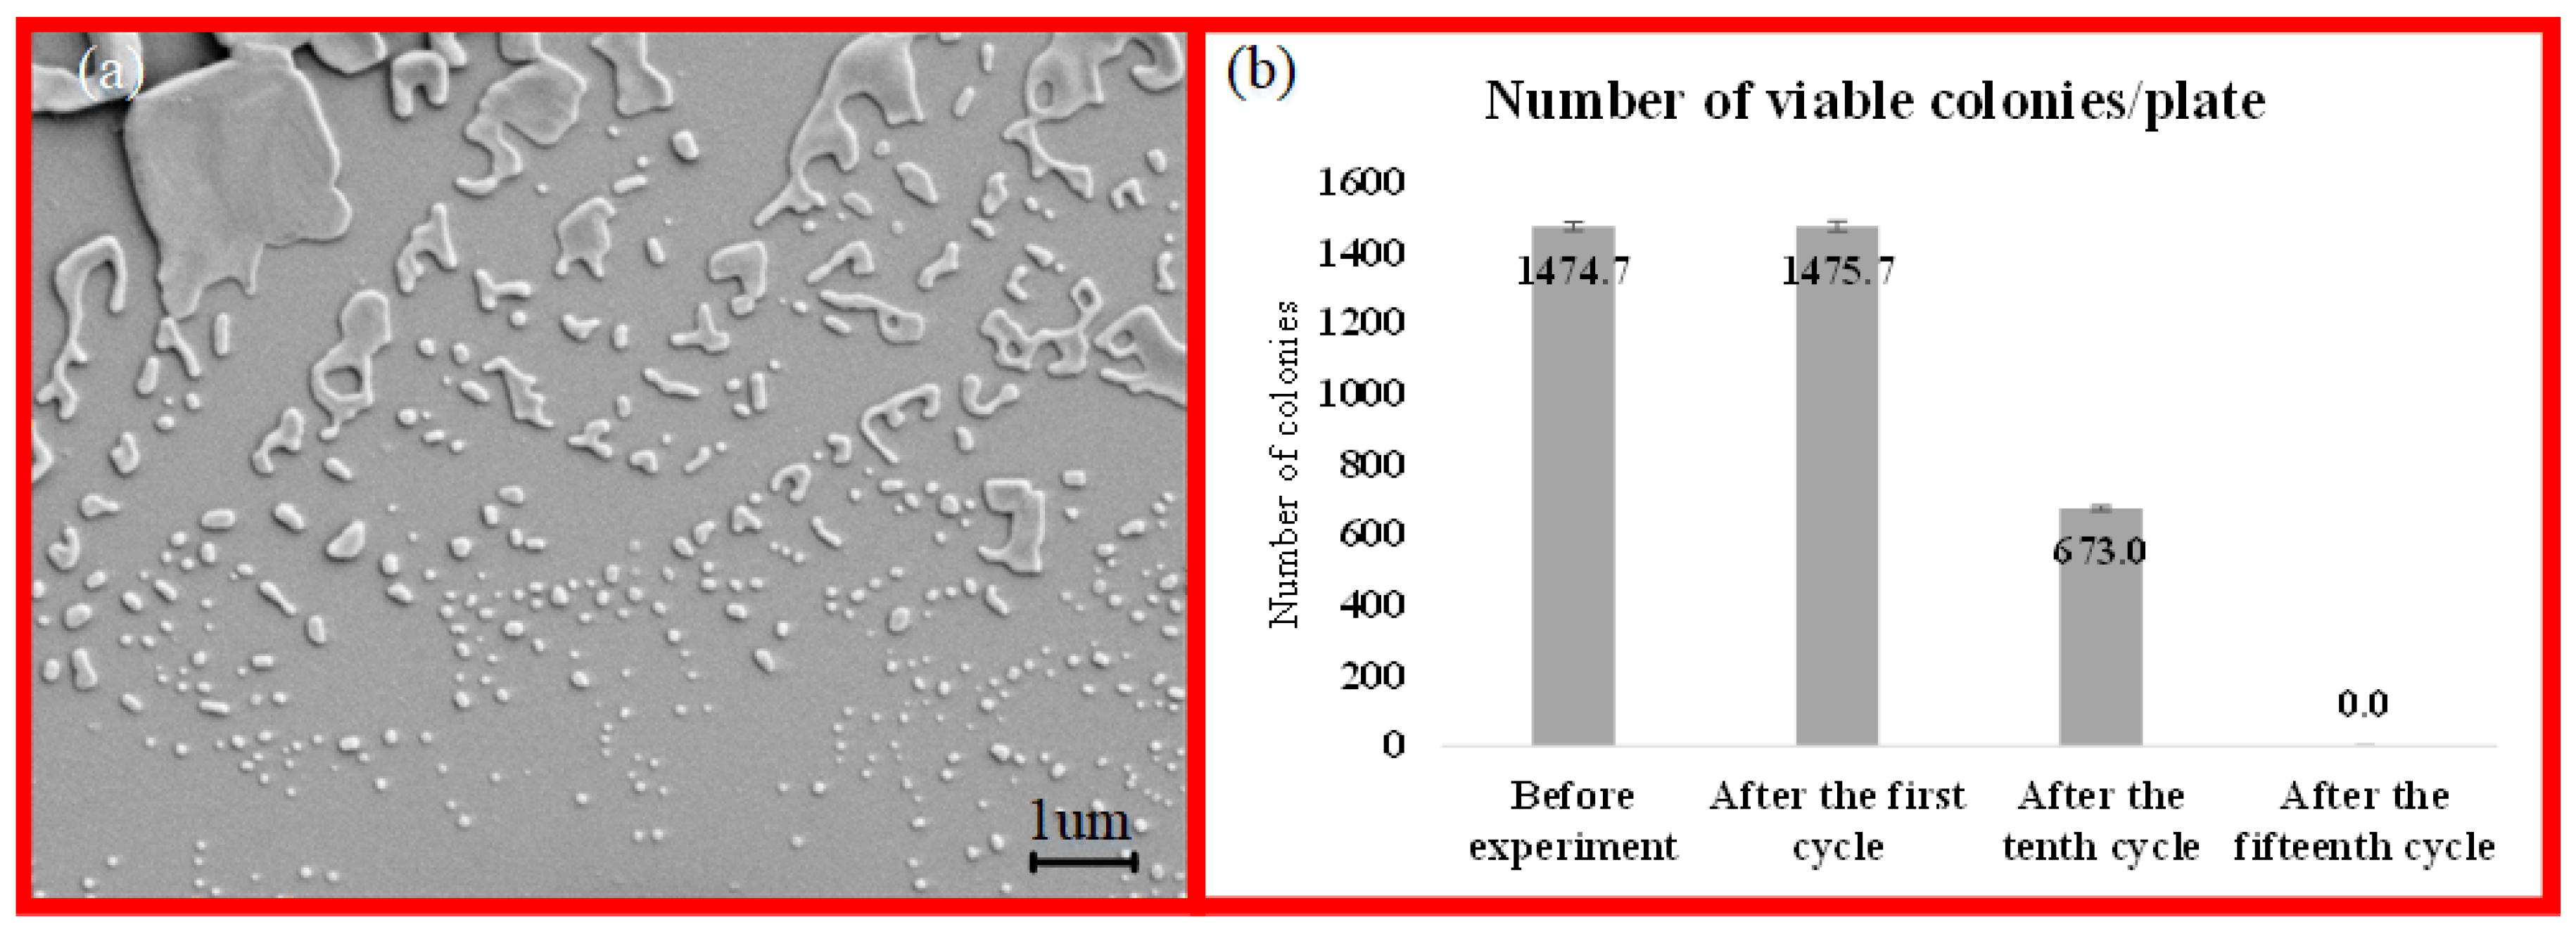
The effect of the presence of S. typhimurium bacteria on cavitating flow patterns and deactivation effect of collapsing bubbles (on the Salmonella typhimurium bacteria suspended in sterile phosphate-buffered saline (PBS)) were assessed in this study. The scanning electron microscopy (SEM) method was also implemented to monitor the physical morphology of the bacteria.

2.1. Microfluidic Devices Geometry

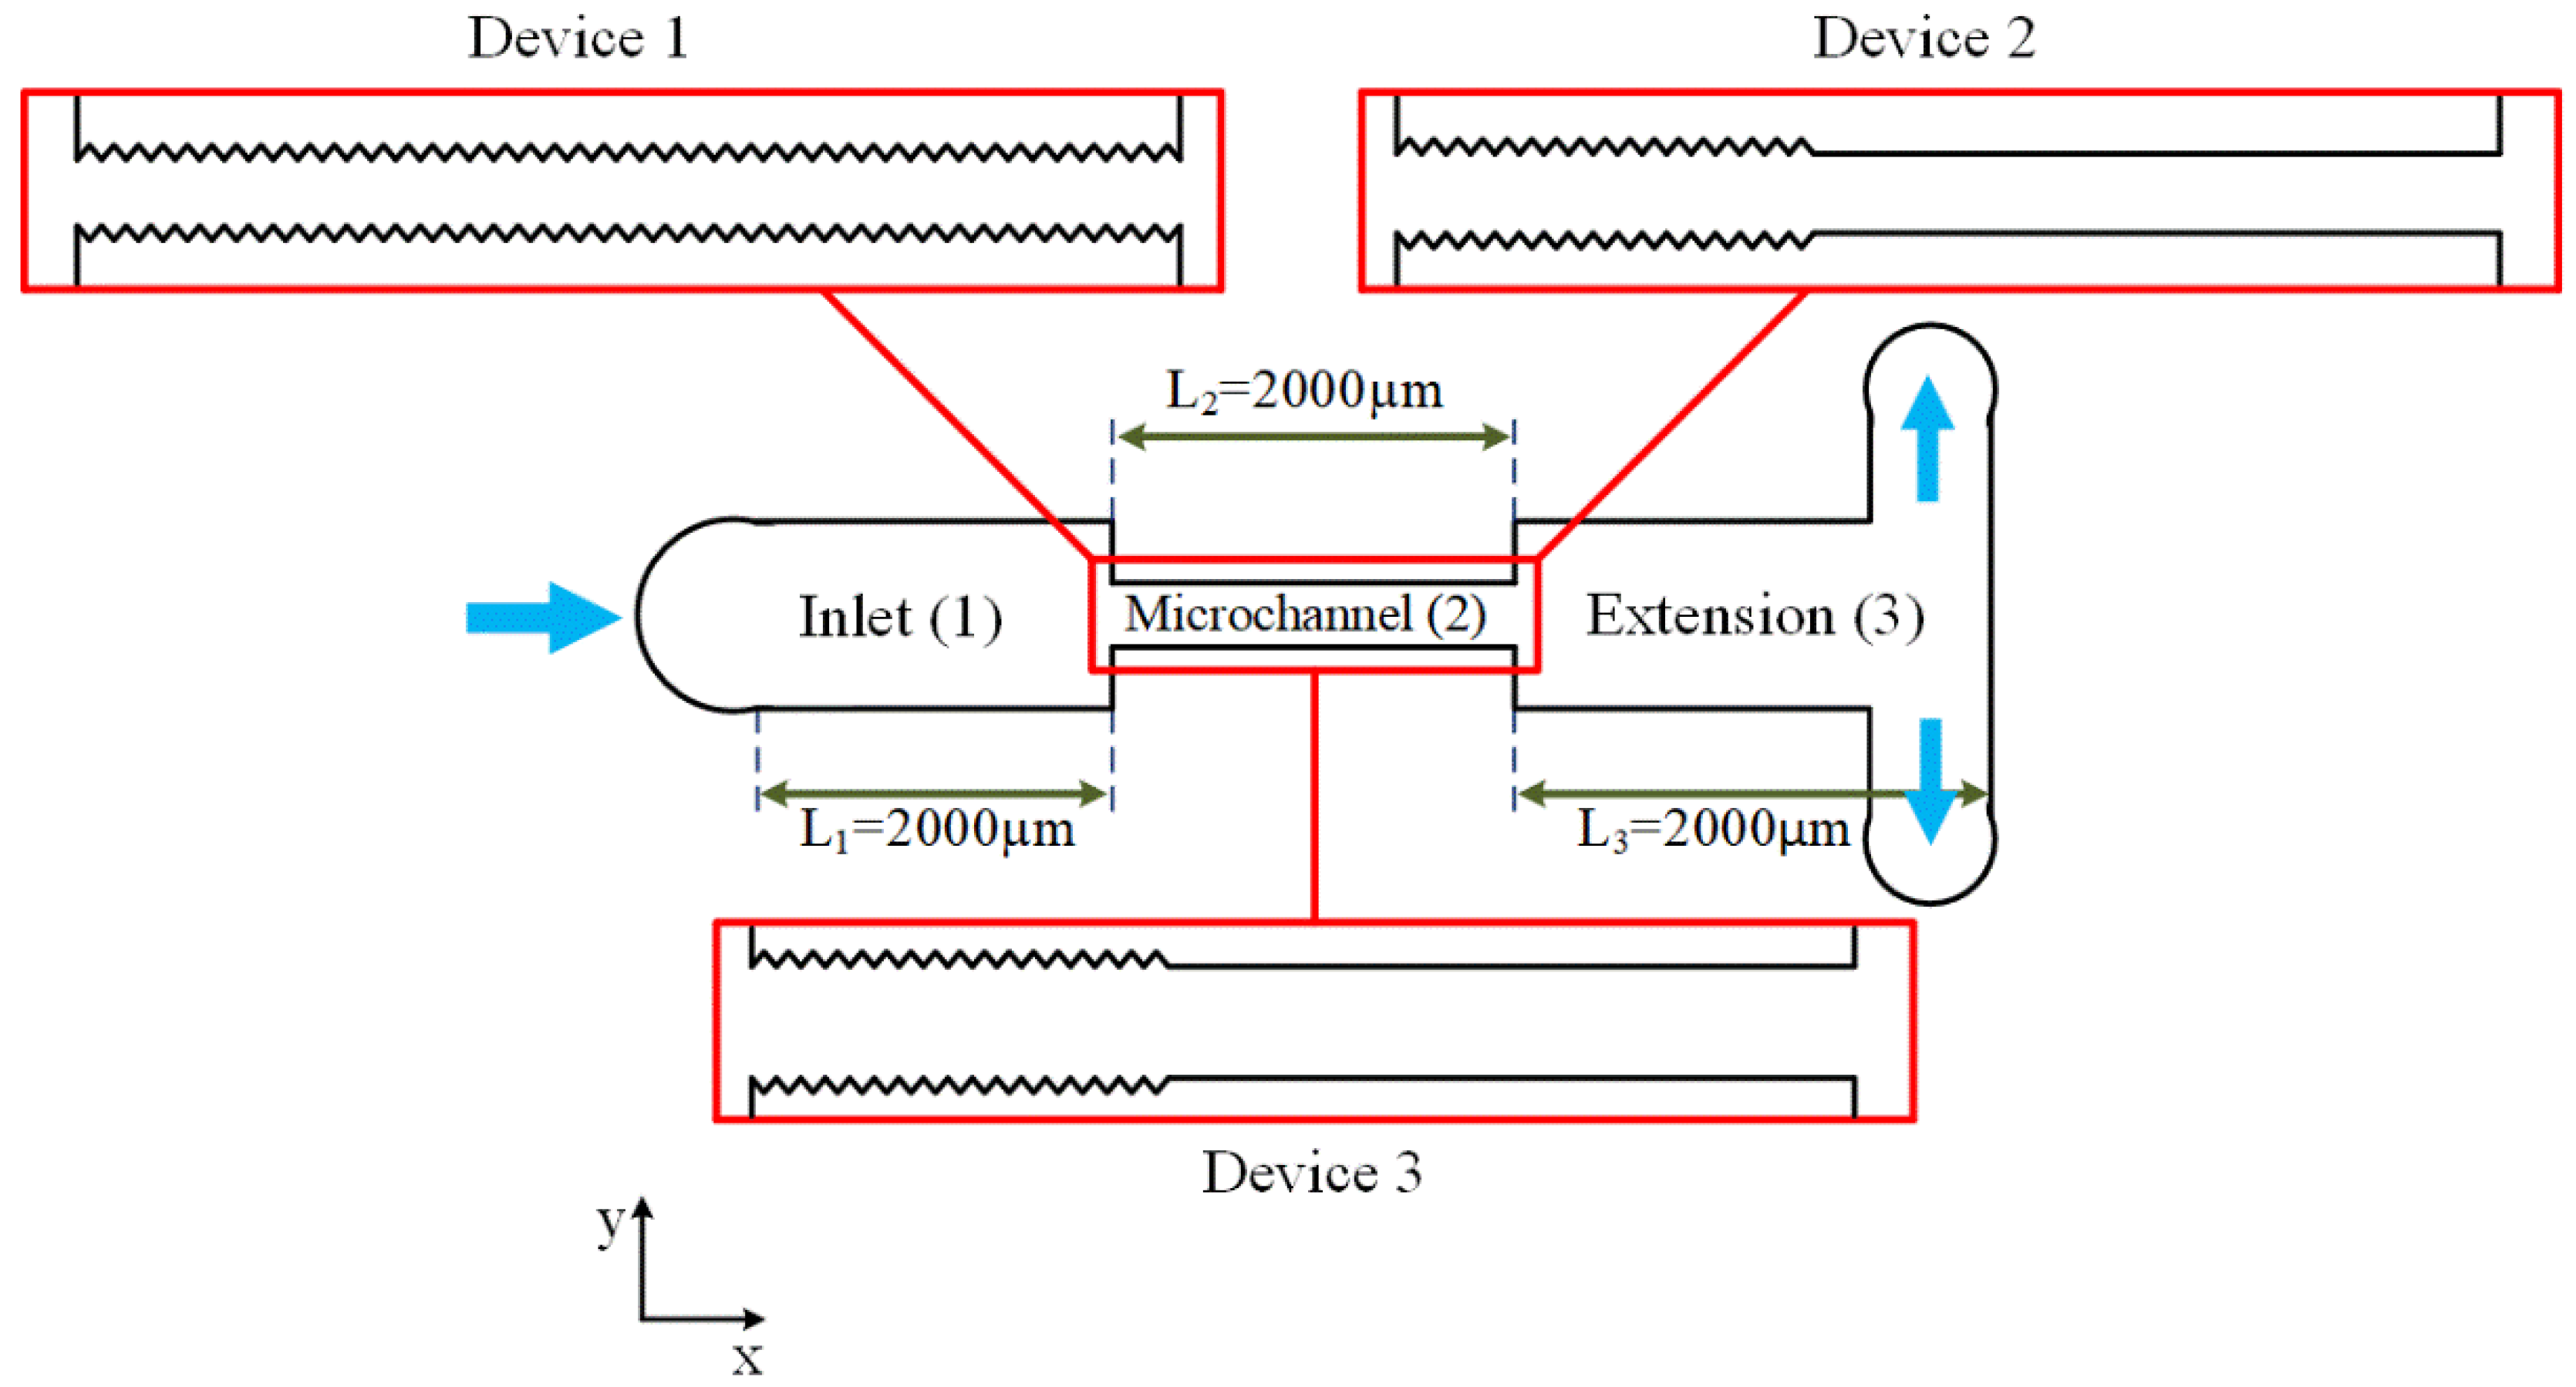
Three microfluidic devices with different geometries were employed in the experiments to study cavitating flows. As shown in Figure 1, the microfluidic devices consisted of three main sections, namely, inlet, microchannel, and extension. The length of all sections was 2000 µm, while the width of the inlet and extension were 900 µm. Three narrow channels connected to the inlet, microchannel, and extension sections of the microfluidic devices acted as pressure ports to measure the static pressure of the working fluid at these points. According to our previous studies, engineered lateral roughness elements (equilateral triangles) were included on the microchannel walls to intensify cavitating flows in the microfluidic devices [15]. The geometry of the roughness elements was studied, and it was shown that smaller wall roughness elements, in terms of height, and shorter elements, in terms of total length, resulted in both earlier inception of cavitating flows in the microchannel section and easier formation of twin cavities along the microchannel [15]. The small roughness elements enhanced the heterogeneous nucleation of bubbles in the microfluidic devices [28]. It was also demonstrated that the narrower microchannel section leads to more intense cavitating flows and lower energy requirement to reach the developed cavitating flow regime [15].
In the first part of this study, the performance of the microfluidic devices (with water and PBS as the working fluids) were studied separately, and the suitable device for the second section was chosen based on the experimental results.
In the second part of this study, the effects of bacteria presence in PBS on the flow patterns, as well as the effects of cavitation bubble collapse on bacteria deactivation, were investigated. Since the bacteria agglomerated at the inlet of the microchannel and clogged the device, the geometry of the microfluidic device was different in this part. In addition, in order to have more intense cavitating flows, the width of the microchannel section should be increased. On the other hand, as stated above, the shorter total length of the roughness elements leads to a lower energy requirement of the system, which increases the working efficiency of the whole device. As a result, the microfluidic devices used in this section were 152 and 400 µm in width and 50 µm in depth, resulting in hydraulic diameters of 75.24 and 88.8 µm, respectively. The height of the roughness elements was 1.5 and 3 µm for the second and third devices, respectively, covering one-third of the microchannel. Figure 1 and Table 1 include the dimensions and configurations of all the three devices used in this study.

2.2. Microfluidic Device Fabrication

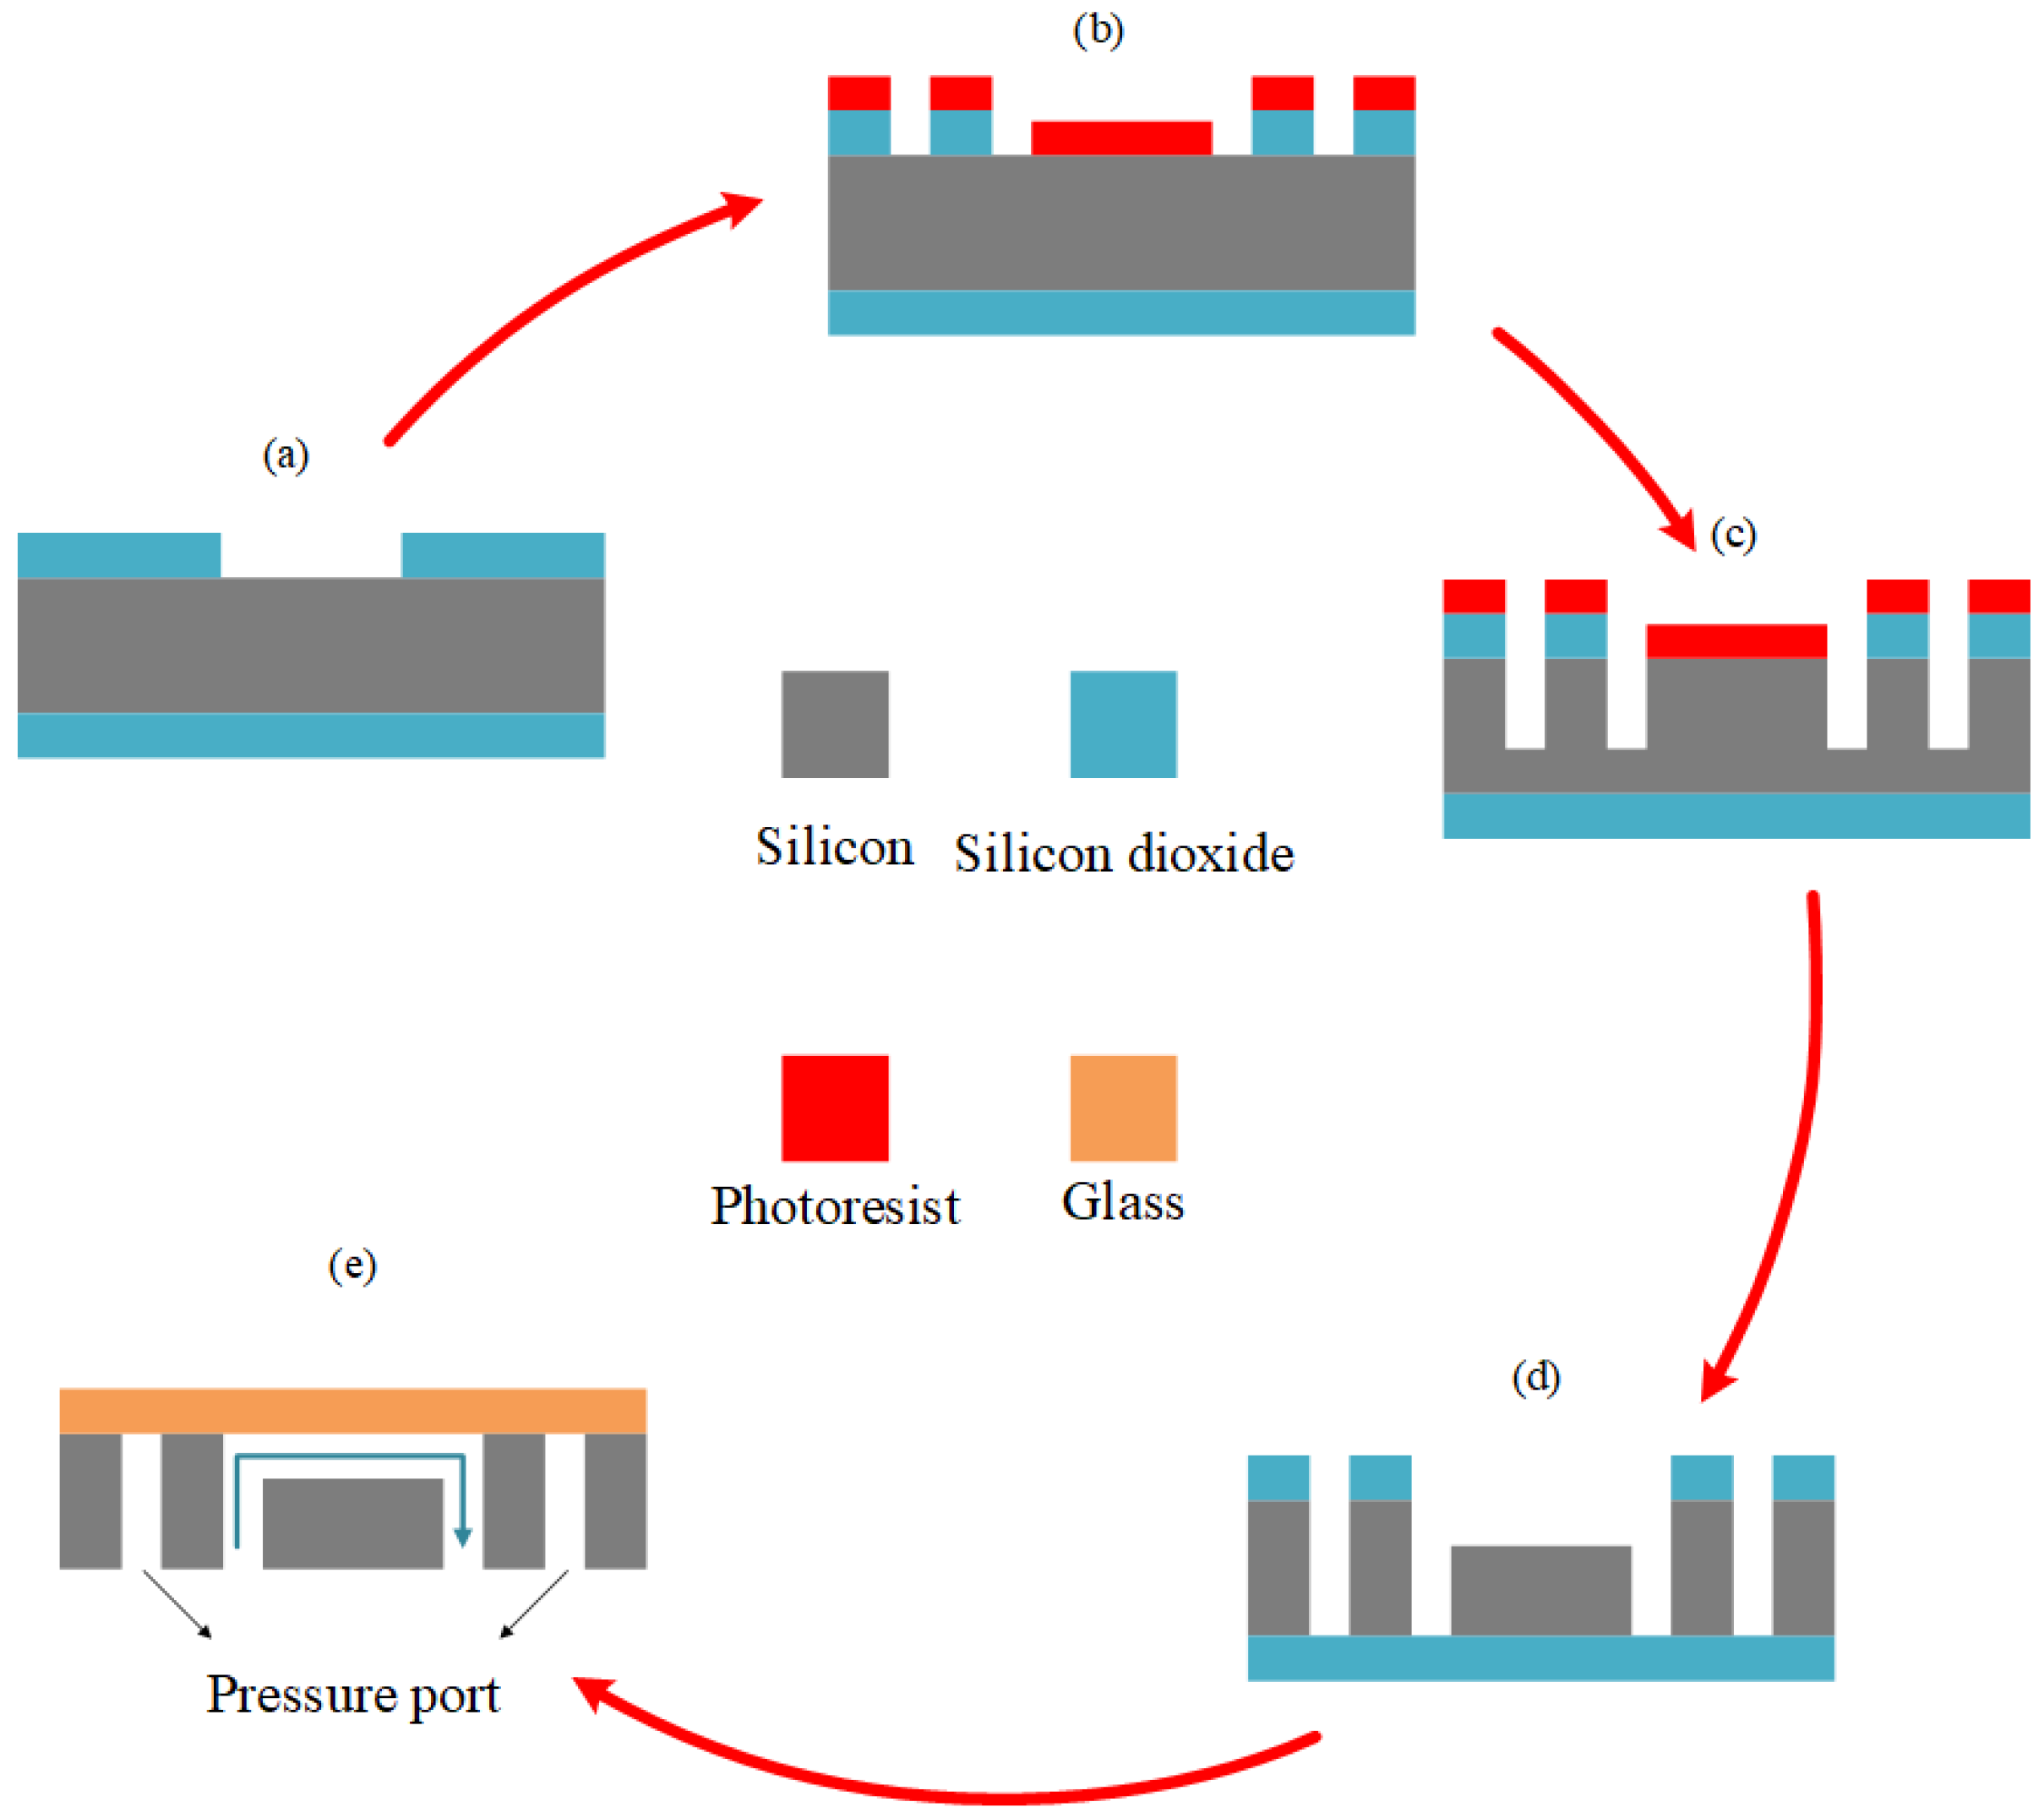
Since the experiments were performed at high pressures, the microfluidic devices were made of silicon and were bonded to glass to withstand high pressures. For this purpose, a 500 nm thick layer of SiO2 was thermally grown and deposited on both sides of a <100> silicon wafer. The pattern of the microfluidic device was transferred on the surface of the substrate using MLA 150 maskless aligner photolithography machine with high resolution on a 2-µm thick layer of photoresist (AZ-ECI) as a positive photoresist. The employed software for the designs was Layout Editor. The exposure energy for photolithography was 320 mJ/cm2. The SiO2 layer was dry-etched, and the residual photoresist was stripped off the surface (Figure 2a). The second photolithography was performed using a second mask to open inlet, outlets, and pressure ports of the microfluidic device. A second dry etching of SiO2 (Figure 2b) followed by 320 µm deep reactive ion etching (D-RIE) of silicon leads to Figure 2c. Thereafter, the photoresist on top was removed, and another 50-µm deep dry etching of silicon was performed (Figure 2d). The initially grown layers of SiO2 were removed by the wet etching process, and the geometry of the whole device, including the inlet, outlets, and pressure ports openings, was achieved. An anodic bonding process was also employed to bond Borofloat 33 glass to the silicon substrate after cleaning (Figure 2e).

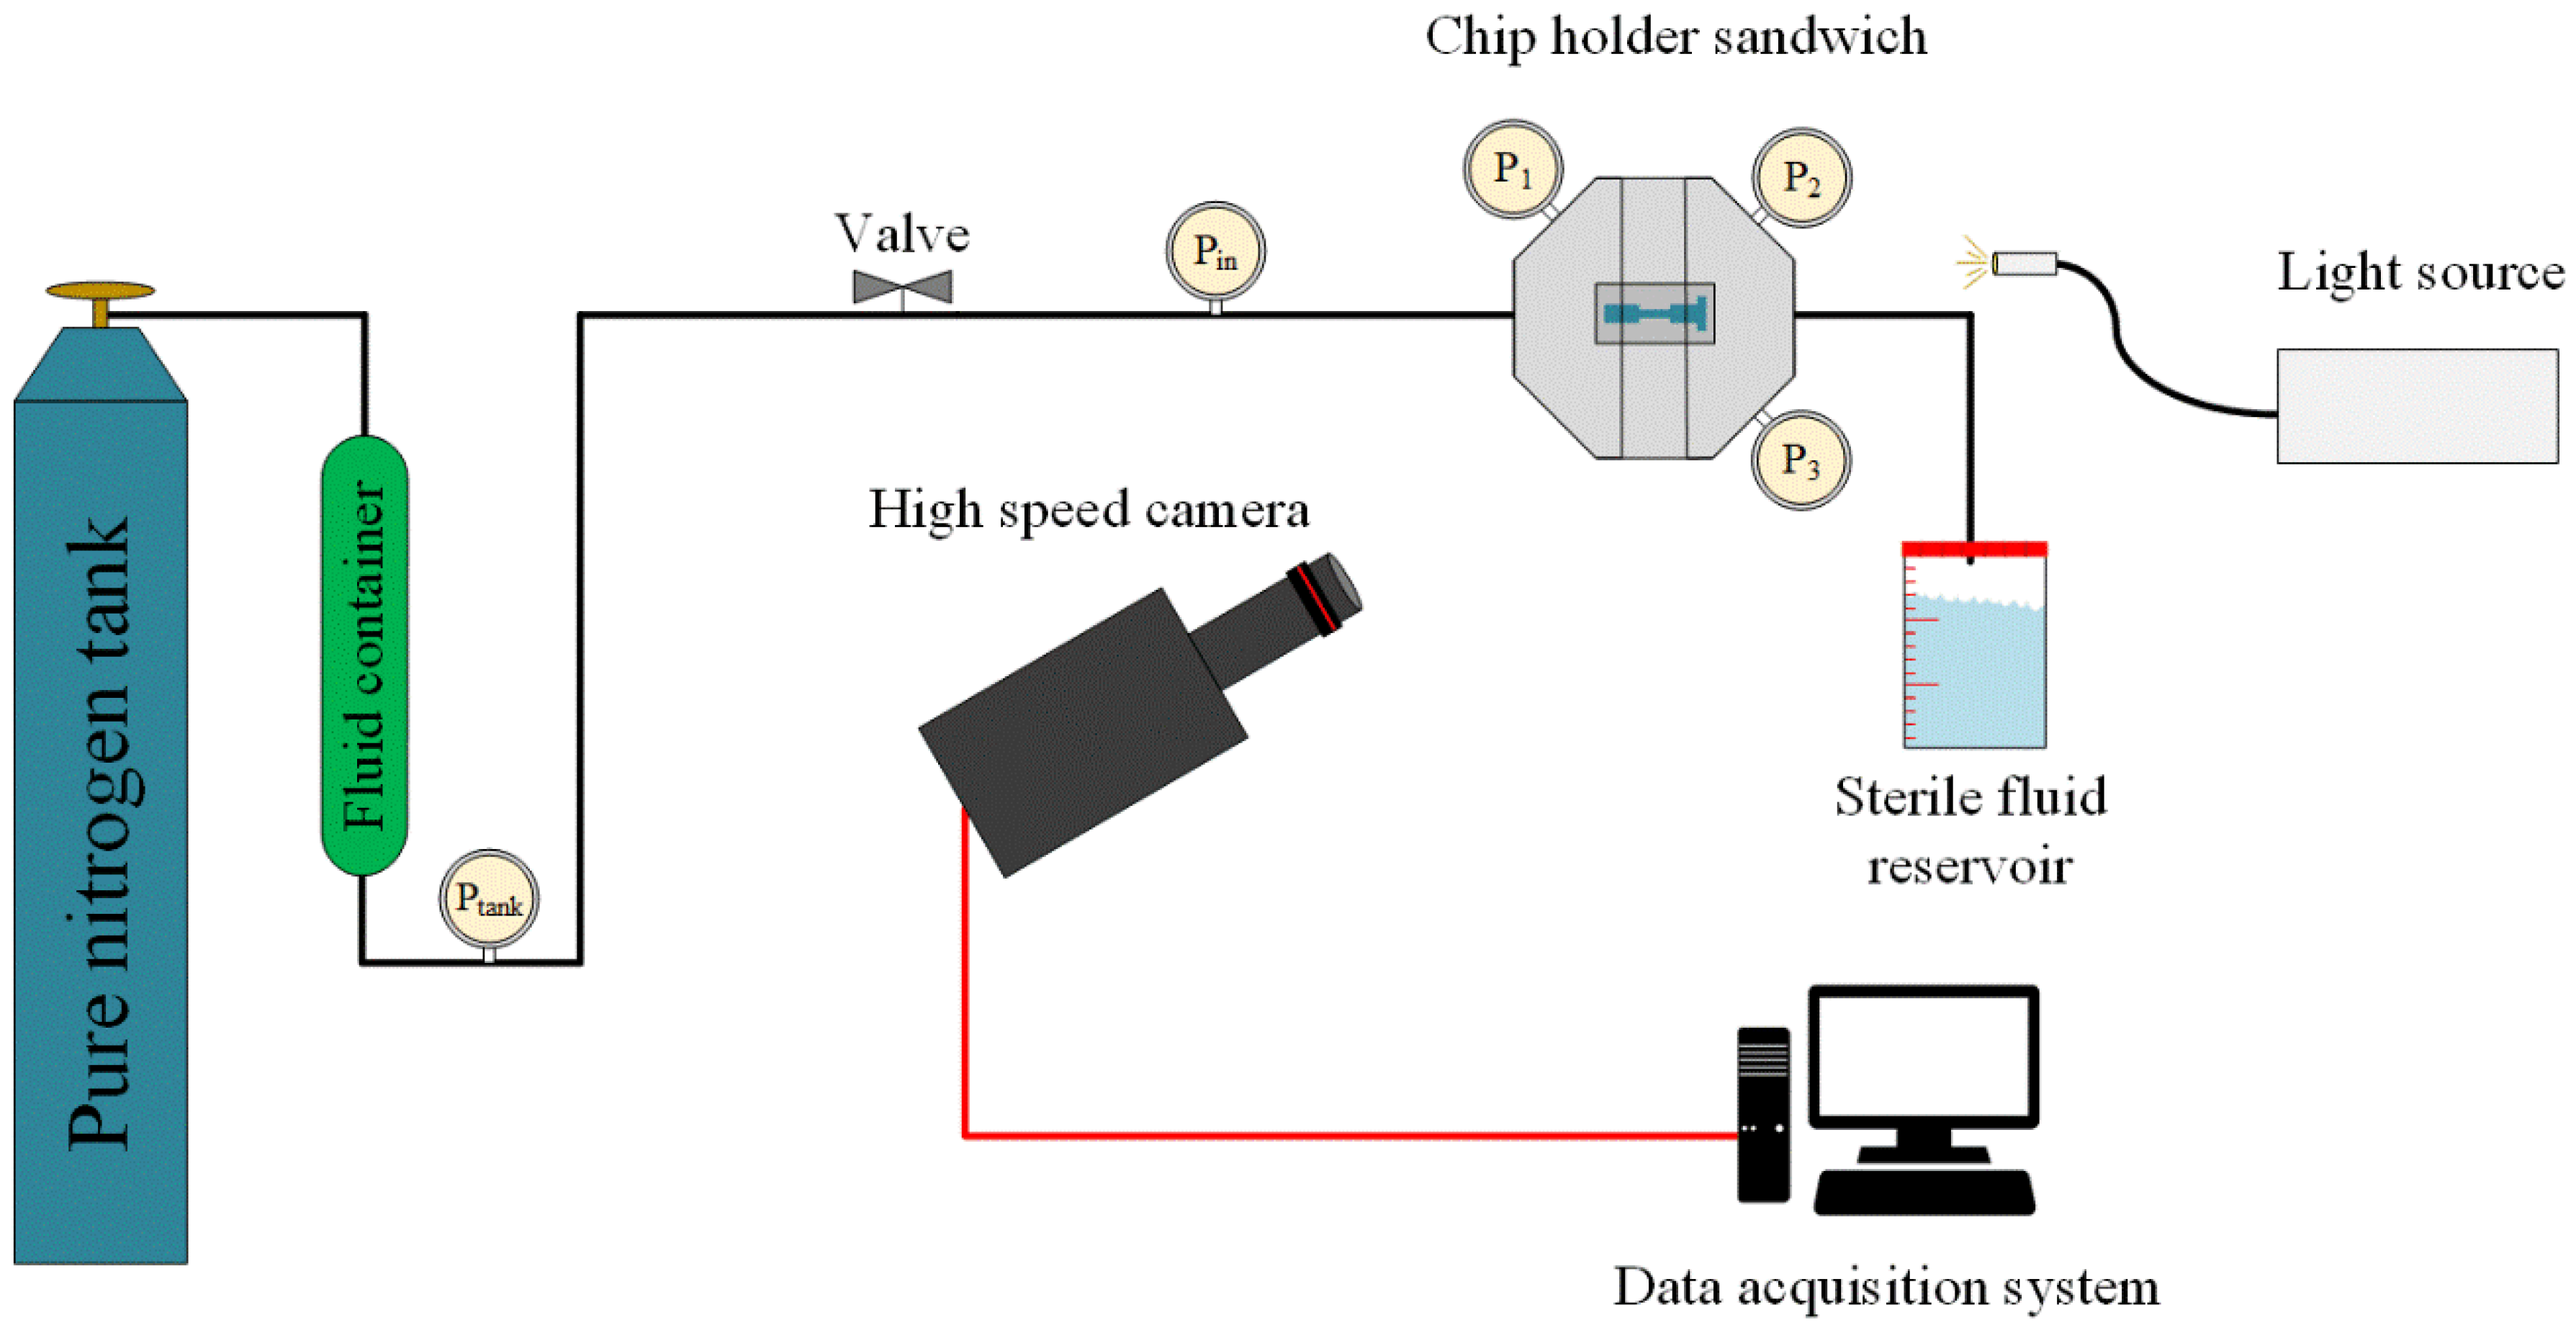
2.3. The Experimental Setup of the Fluidic System

The working fluids (water, PBS, PBS/bacteria suspension) were kept in a stainless steel fluid container (Swagelok, Erbusco, Italy), which was connected to a high-pressure pure nitrogen tank (Linde Gas, Gabze, Kocaeli, Turkey) from the top, which drove the fluid into the system via proper fittings and stainless steel piping (Swagelok, Erbusco BS, Italy). A needle fine control valve (Swagelok, Erbusco BS, Italy) was installed to control the flow and inlet pressure during the experiments. The microfluidic device was installed and sandwiched on a homemade aluminum package, which facilitated flow visualization. The homemade package consisted of one inlet, which was connected to the fluid container and one outlet, where the fluid exiting the microfluidic device could leave the system. Three pressure sensors (Omega, Manchester, UK, with accuracy value of ±0.25% and the range of up to 3000 psi) were installed to measure P1, P2, and P3 (Figure 3). Micro O-rings and tight connections were used to avoid any leakage in the system. A double-shutter CMOS high-speed camera (Phantom v310 with a resolution of 1280 × 800 pixels and a pixel size of 0.02 mm, along with a macro camera lens (type K2 DistaMax) with the focal length of 50 mm and f-number of 1.2) was used to record the flow patterns during the experiments. The package was installed at 20 cm distance from the camera so that it would be in the focal area. A point halogen light source was used to provide the required background light for better visualization of the flow patterns. The volume flow rate of the system (as measured for each data point and the velocity of the working fluid inside the microfluidic device by dividing a reference volume of the exiting fluid by the elapsed time for this volume to leave the system) was utilized for Reynolds and cavitation numbers calculation. Figure 3 shows the schematic of the experimental setup, which was constructed in similar lines with our previous studies (with minor changes such as the removal of the filter) [18].
The PBS/bacteria suspension was collected in sterile biological sample containers upon exiting the microfluidic device and was restored for the next cycle of cavitating flow. Sterile serological pipettes were used to reload the sample into the fluid container in the last part of the experiments (deactivation effects of cavitating flows). The experiments were performed in one shot, and the excess bacteria were kept at 4 °C until they were loaded into the system.
The uncertainties in experimental parameters are given in Table 2. They were provided by the manufacturer’s specification sheets or were obtained using the propagation of the uncertainty method presented in the study of Kline and McClintock [29].

2.4. Bacteria Culturing

Bacteria cultures were prepared from −80 °C glycerol stocks and used freshly for each assay. Salmonella enterica subsp. enterica serovar typhimurium (ATCC®14028™) was cultured in Luria–Bertani broth (LB) medium (10 g tryptone, 5 g yeast extract, 5 g NaCl, Sigma, Munich, Germany), until the logarithmic growth phase (around 108 CFU/mL) was reached. Bacteria were incubated at 37 °C for 16 h in a shaker at 220 rpm. Growth medium was centrifuged at 5000 rpm for 5 min, the supernatant was removed, and the pellet was washed once with PBS and was dispersed in sterile PBS buffer before cavitation experiments. Agar plates were prepared from LB medium supplemented with agar (Sigma, Munich, Germany) and incubated under similar conditions without shaking.
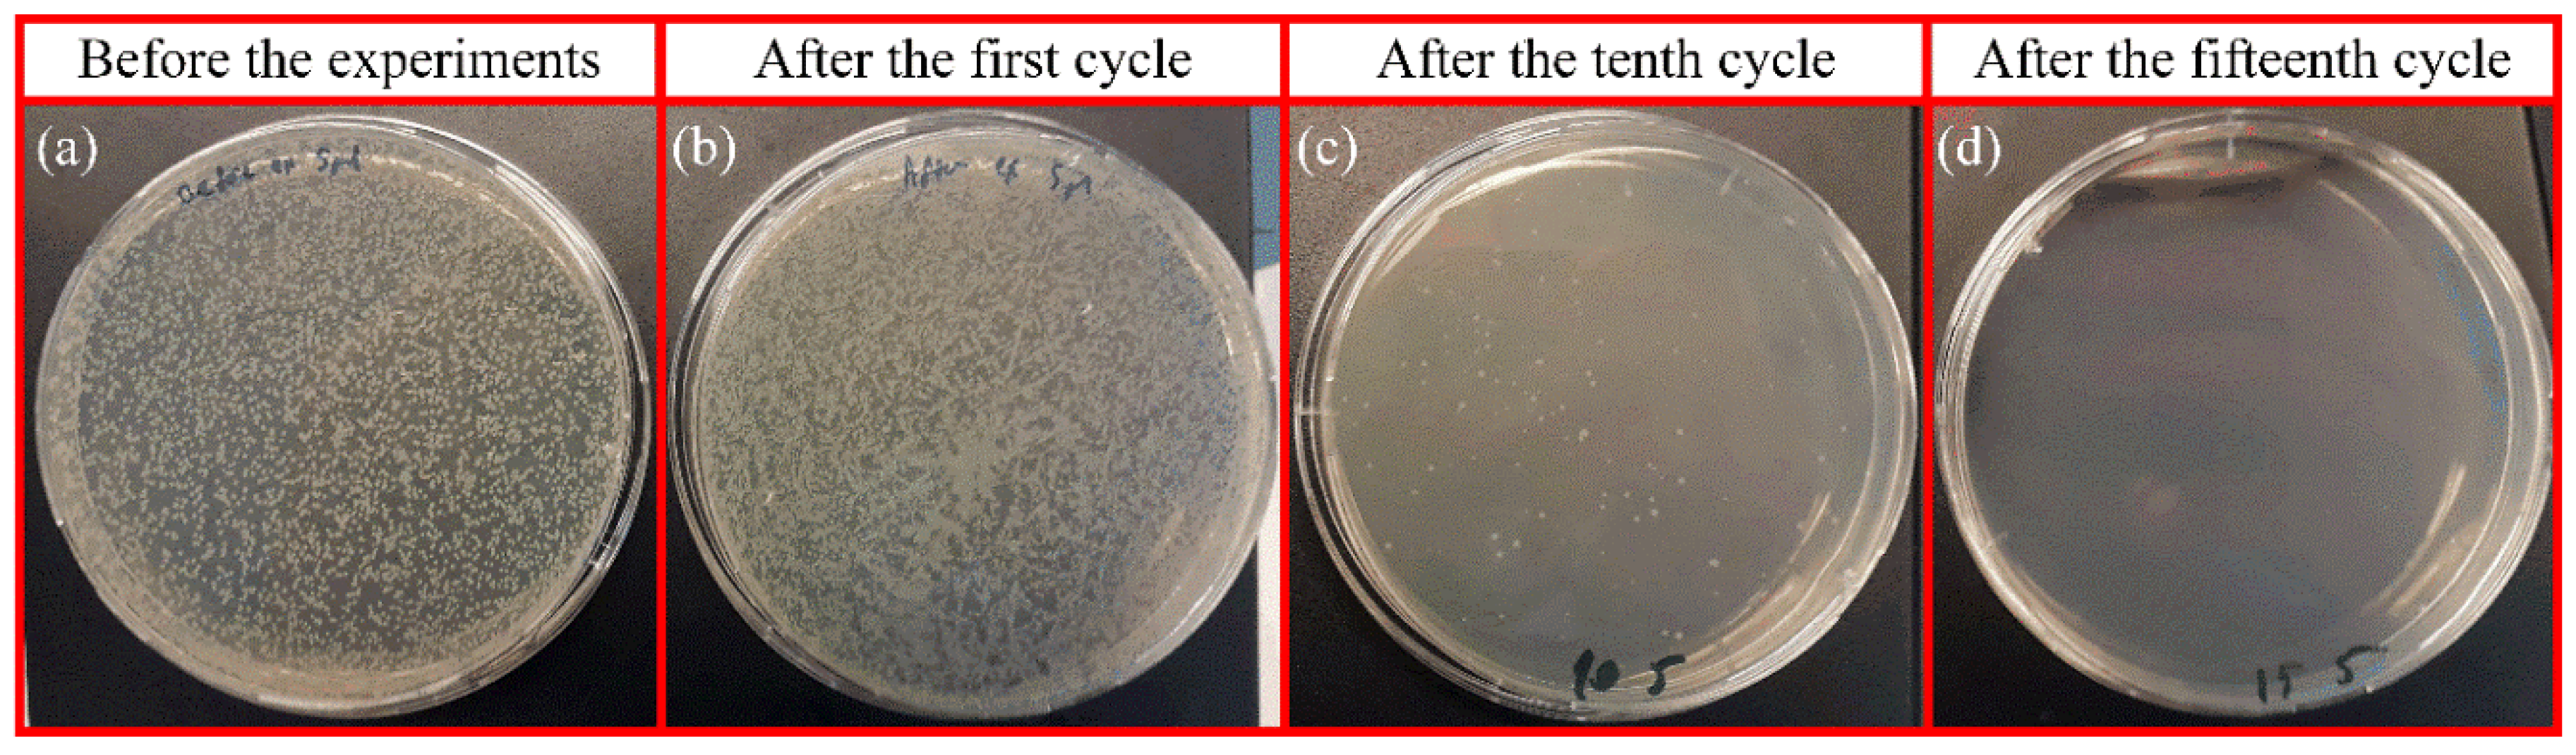
The bacteria suspension was diluted by 1000 mL PBS to obtain a concentration of 105 CFU/mL before cavitation assay. Then, 100 µl bacteria suspension was kept as a positive control to spread on agar plates. After the cavitation process, collected samples and control samples were diluted to 1:10 with sterile PBS. The diluted bacterial suspensions were spread over the LB agar medium by using sterile glass beads. The plates were placed in an incubator at 37 °C overnight, under dark condition. After incubation, the plates were observed for evaluation of the antibacterial effect.
The number of viable bacterial colonies was calculated using the ImageJ software, v.152.a. All Petri dish images were combined in one PNG file and adjusted for brightness/contrast. Every plate image was then converted into an 8-bit image, and threshold corrections were applied. Finally, the particle analysis tool was applied to all dishes under identical analysis conditions to obtain the number of colonies per plate.

2.5. SEM Sample Preparation

Further understanding of bacteria morphology, including size and shape, was investigated by scanning electron microscopy (SEM, Leo Supra 35VP, Oberkochen, Germany) using an acceleration voltage of 3 kV. In order to provide a sample for SEM analysis, 10 µl of the sample was drop-casted on a silicon wafer and was left to dry at room temperature for 3 h. The sample was coated by gold-palladium alloy to avoid any surface charge of the bacteria and to make the surface homogeneous for image processing.

3. Theory

In order to characterize hydrodynamic cavitation, the main two parameters are employed: cavitation number and flowrate. Cavitation number is usually used to represent the intensity of cavitating flows in a fluidic system. The cavitation number is expressed as [28]
σ = ( P P v a p ) 0.5 ρ V 2
where P is the inlet pressure, P1 in this study, Pvap is the saturation vapor pressure of the working fluid, ρ is the density of the working fluid, and V is the (velocity in the orifice, maximum velocity) of the fluid along the microchannel. P1 is measured using the pressure sensor in the experimental setup, and Pvap and ρ are read from the available look-up tables for each working fluid. The volumetric flow rate of the system is measured during the experiments at each inlet pressure, while the value of the velocity is calculated at the beginning of the microchannel (orifice), where the fluid has the maximum velocity.
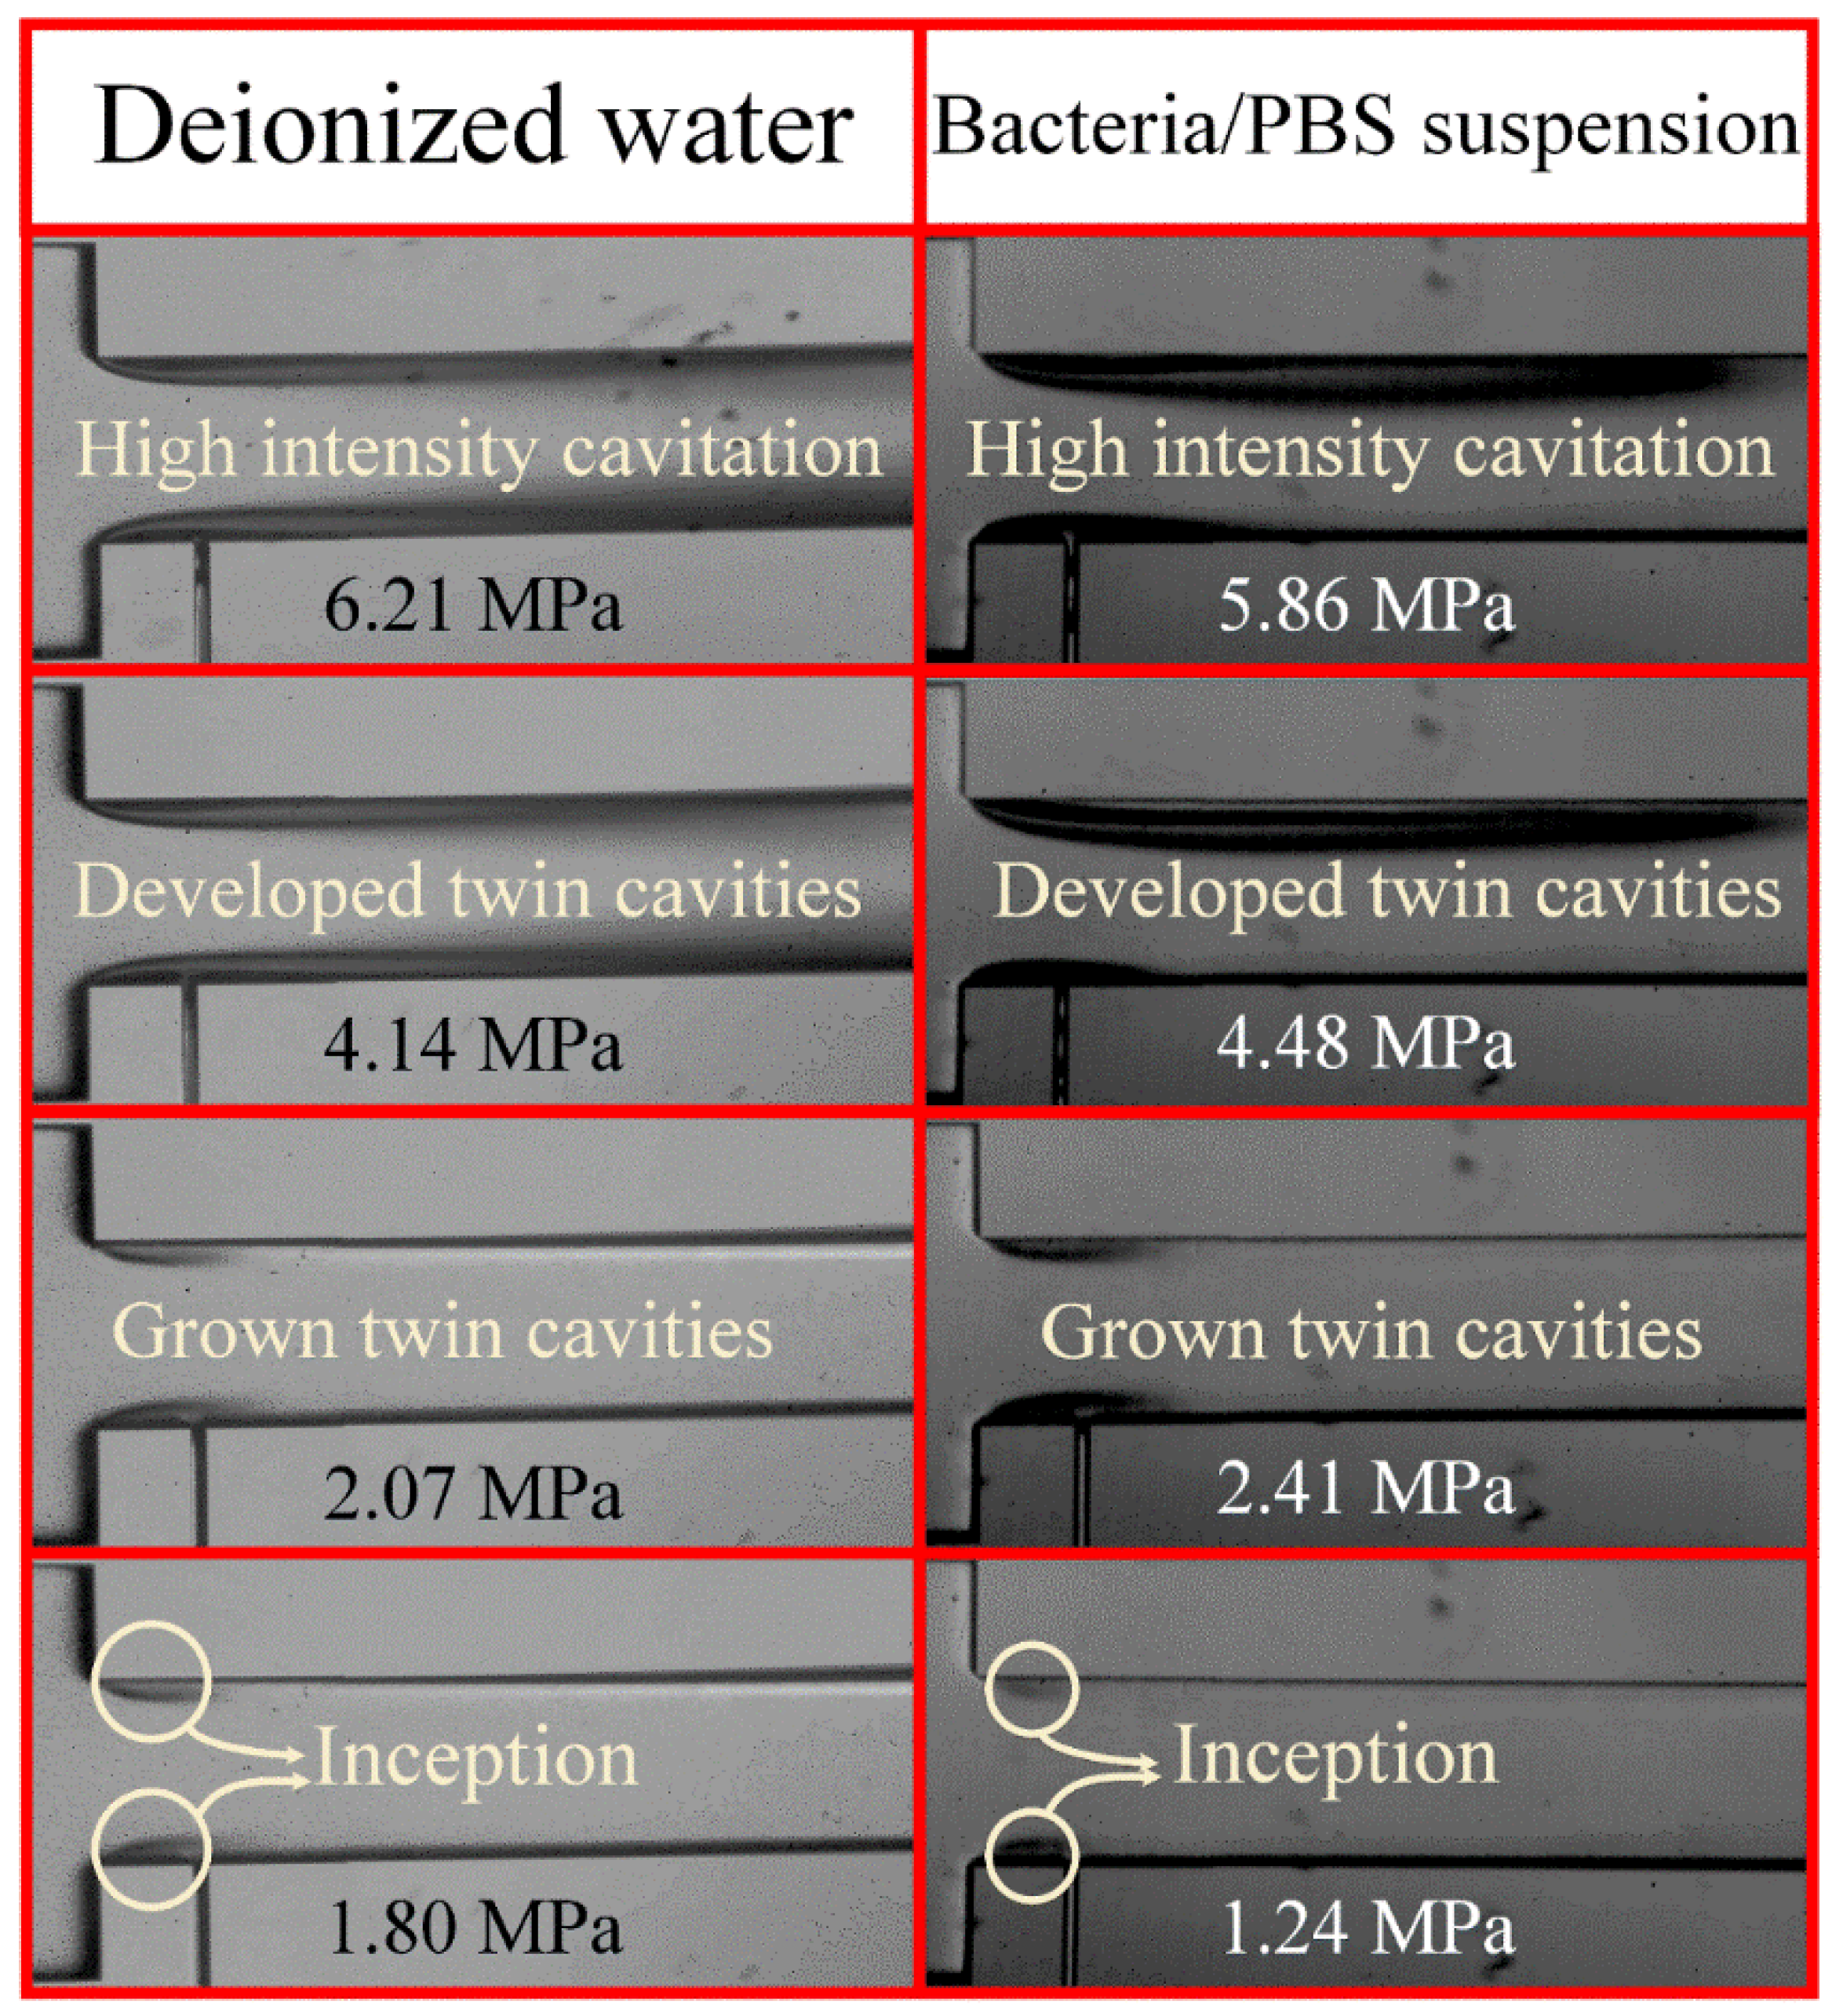
The inlet pressure is gradually increased during the experiments so that the transition between flow patterns could be observed and accurate images could be recorded by the high-speed camera. According to Equation (1), the cavitation number decreases with an increase in the inlet pressure, and the inception occurs either in the microchannel (orifice) or in the extension of the microfluidic devices. The decreasing trend in the cavitation number continues, and the twin cavities emerge and move along the microchannel until the supercavitation condition becomes visible. At this point, the intensity of the cavitating flow reaches its maximum in the device. Beyond this point, the flow rate becomes saturated, and the velocity cannot be increased anymore with the inlet pressure. This leads to an increase in the cavitation number, which marks the choked flow condition. Thus, inception, developed cavitating flow, and supercavitation are observed during the experiments.
Cavitation flowrate is the critical flow rate, at which the inception of the cavitating flow is detected in the microfluidic device. Cavitation flowrate is expressed as [30]
Q c a v = W × H [ 1 ρ × P o u t P v a p W w C d 1 ] 1 2
where W and w are the width of the inlet and microchannel, respectively. Cd is the discharge coefficient of the device, which was explained and discussed in detail in our previous study [8]. Equation (2) displays the effect of the thermophysical properties of the working fluid on the cavitation flowrate. The saturation vapor pressure directly affects this value, while the density has an adverse relationship with cavitation flowrate, which underlines the importance of the working fluid type on flow behavior.
In addition, the tensile strength of the working fluid, which is an indicator of its resistance against forming cavities in the bulk of fluid, could also be used to explain the flow patterns. The tensile strength of the working fluid is given as Equation (3) [11]
Δ P C = P v a p P = 2 S R C
where ΔPC is the pressure difference between the bubble and the surroundings, S is the surface tension, and RC is the critical radius of the bubbles before collapsing. The lower tensile strength of the working fluid leads to earlier inception of the cavitating flow. Equation (3) emphasizes the importance of surface tension of the working fluid on the nucleation of bubbles encountering a low-pressure region.
Besides the mentioned parameters to characterize cavitating flows and Reynolds number, Equation (4) is an important dimensionless number in any fluidic system to characterize the flow pattern inside the channels [31]
R e = ρ V D h μ
where ρ and µ are the density and dynamic viscosity of the working fluid, respectively. The corresponding values are listed in Table 3 for water and PBS. On the other hand, V is the velocity of the fluid flow, and Dh is the hydraulic diameter of the channel. Dh for rectangular microchannels with side values of a and b is calculated as [31]
D h = 2 a b a + b
Due to the small size and slow fluid flow in most of the microfluidic systems, the Reynolds number is very small, and the fluid shows a laminar behavior in the microscale channels. However, the Reynolds number is high enough to lead to turbulent flow behavior as a result of the high velocity of the fluid inside the system. The Reynolds number in these experiments is calculated at the beginning of the microchannel, where the velocity is at its maximum value. A Reynolds number of above 4000 shows a turbulent flow behavior in fluidic systems [31].

4. Results and Discussion

4.1. Water and PBS Flow Pattern Analysis

Keeping all the abovementioned parameters in mind, the first microfluidic device (with a 100-µm wide microchannel and lateral wall roughness elements of 1 µm size covering the whole microchannel area) was tested with water to detect the flow patterns. The inlet pressure was gradually increased, and the fluid flow patterns were monitored with the high-speed camera in intervals of 350 kPa. The inception of cavitating flows occurred first in the extension and then in the microchannel area. The inception at the extension was visible at 3.10 MPa for the case of water.
Commercial phosphate-buffered saline (PBS) (Pan Biotech Co., Aidenbach, Germany) was used as the working fluid in the same microfluidic device to reveal the effect of thermophysical properties of the working fluid. The inception of cavitating flows happened at a lower inlet pressure (2.41 MPa) compared with the case of water. Table 3 includes the thermophysical properties of water and PBS.
From the tensile strength point of view, PBS has a smaller surface tension compared to water. As a result, the tensile strength of the working fluid is lower than the case of water, according to Equation (3). The density of PBS, on the other hand, is lower than water at 25 °C, which leads to a lower cavitation flowrate according to Equation (2). The positive effects of both density and surface tension result in a lower inception pressure for cavitating flows. Figure 4 shows the flow patterns and cavitation numbers of the first microfluidic device for the cases of water and PBS.
As shown in Figure 4, PBS tends to generate bubbly flow (consists of larger bubbles with lower intensity) rather than a bubble cloud (consisting of smaller bubbles with higher intensity). The lower surface tension of PBS is the reason for this difference at low pressures [32]. In addition, the inception of cavitating flow in the nozzle is not obtained at any pressure for PBS, although it happened at 3.10 MPa for the case of water (not shown in Figure 4). On the other hand, the intensity of cavitating flows for PBS is more than the case of water at the same inlet pressure. This can be clearly recognized from the more intense dark lines in the extension for the case of PBS, as seen in Figure 4. It should be noted that since the flow velocity in the microfluidic device is high, the oscillation of the twin cavities is inevitable in the extension, which is the reason for the curved gas phase in the extension. In addition, due to the high velocity of the fluid in the microchannels, the Reynolds numbers are high enough for the fluid to exhibit fully turbulent behavior. The increase in inlet pressure leads to an increase in flow velocity. According to Equation (1), cavitation number decreases under this condition. However, when the microfluidic device has the choked flow condition, the velocity does not increase with inlet pressure. As a result, the cavitation number increases beyond this point. This trend can be seen in Figure 4 for both working fluids. The lowest recorded cavitation number for this device corresponds to the supercavitation flow pattern. The increasing trend beyond this value implies the choked flow regime in this microfluidic device. As mentioned before, the cavitation number is an indicator of the intensity of the cavitating flow. It could be observed that the same intensity of the cavitating flow is obtained at a lower inlet pressure for the case of PBS. Almost the same cavitation number of 0.86 was obtained for both cases at pressures of 1.38 MPa and 3.10 MPa for the cases of PBS and water, respectively. The same behavior can be observed for developed flows at higher pressures, where the pressures corresponding to the same intensity of cavitating flows (cavitation number of about 0.8) were 4.14 MPa and 2.41 MPa for the cases of water and PBS, respectively.
In order to characterize the microfluidic devices (with both water and PBS) and choose the best device for the next step (deactivation of bacteria), the other two microfluidic devices with a microchannel width of 152 µm and 400 µm were tested. Figure 5 shows the flow patterns for the second and third devices for the cases of water and PBS.
As expected and explained in Section 2.4, the velocity of the fluid flow is high enough to have fully turbulent behavior in the microchannel. The Reynolds numbers in Figure 5 are all above 4000. The cavitation number was also calculated for the second and third devices at different inlet pressures. The results show that the intensity of cavitating flow for PBS is more than the intensity for water, which can be concluded from the experimental results of the second device at the highest inlet pressure. As can be seen, the Reynolds numbers are almost the same, while the cavitation numbers are different, which is due to the difference between the thermophysical properties of the working fluids. Likewise, in the third device, the flow shows fully turbulent behavior based on the calculated Reynolds numbers. As shown in Figure 5, the cavitation numbers in this device are lower than those in the second device, which implies more intense cavitating flows in the microchannel. As a result, the third device is a more suitable candidate for bacteria deactivation. Thus, this microfluidic device is considered in the following section.

4.2. Bacteria/PBS Suspension Flow Pattern Analysis

The nucleation of cavitating bubbles in a fluidic system could be categorized as homogeneous and heterogeneous nucleation. In homogeneous nucleation, bubbles form in the bulk of fluid at the nucleation sites. From a microscopic point of view, the molecules with high kinetic energy as a result of high energy physical collisions with other molecules are susceptible in a fluid to phase change at low-pressure regions. On the other hand, surface tension, as discussed in Section 3, plays a crucial role in homogeneous nucleation. Heterogeneous nucleation, on the other hand, occurs on the interface of solid and liquid phases, such as in the vicinity of the walls in the microfluidic device. This kind of nucleation could also originate from sub-micron size contaminations such as solid particles in the working fluid. The inevitable presence of external particles in fluidic systems (even after using filters) has made homogeneous nucleation studies challenging for researchers.
In this part of the experiments, the suspended S. typhimurium in PBS acts as the external solid particles in the fluid and forms the interface of liquid and solid to enhance the intensity of cavitating flows. The irregular shape of the bacteria with a porous surface intensifies cavitating flows in the microfluidic devices. Figure 6 shows the SEM images of the bacteria before the experiments. The nominal length of S. typhimurium bacteria ranges from 1000 to 2500 nm according to SEM images. As can be seen in this figure, they are rod-shaped. It is worth mentioning that flagella around bacteria are obvious and noticeable in the 200 nm-scale images of Figure 6.
Since the width of the microfluidic device used in the previous section is small, the bacteria would agglomerate at the nozzle entrance and block the microfluidic device. The high-pressure fluid could also lead to the explosion of the device. To overcome this problem, the width of the microfluidic device was first raised to 152 µm and then to 400 µm in the following section. On the other hand, based on our previous study, the shorter total length of the lateral roughness elements leads to lower energy requirements to obtain high-intensity cavitating flows. As a result, the lateral roughness elements cover one-third of the microchannel length in the proposed microfluidic devices.
In order to run the experiments with bacteria, the fluidic system had to be cleaned and sterilized. For this purpose, 100% bleach was passed through the system several times for 30 min. Then, 70% ethanol was used to clean the fluidic system for 30 min by passing it through the system. At the end, autoclaved water was used to sterilize the system for 30 min before using the bacteria suspension. The serological pipettes were used to load the sample to the fluid container before the tests. After loading the bacteria suspension, the inlet pressure was gradually increased to monitor the flow behavior with the high-speed camera.
The inception of cavitating flow was recorded at 1.86 MPa for the second microfluidic device, while the same flow pattern was obtained at 2.96 MPa for the case of water. The inception of cavitation flow and the cavity movement along the microchannel area for the case of water are more intense than the bacteria suspension case. This is due to tensile strength change due to the presence of bacteria in the working fluid. Another difference between the flow patterns lies in the development of the cavitating flow in the microchannel area. The developed cavitating flow happened at 4.48 MPa for the case of water, whereas it never happens for the case of bacteria. This is despite the fact that the intensity of cavitating flow in the extension is more for the case of bacteria but not in the microchannel. Figure 7 compares the flow patterns of the second device for the cases of water and bacteria suspension.
Because of the frequent clogging of the device with bacteria, especially at the entrance of the microchannel area, the third device with the mentioned geometrical dimensions was tested with the same bacteria suspension. The inception of cavitating flows was recorded at 1.03 MPa in the microchannel area for this device, while the inception pressure for the case of water was 2.06 MPa. Figure 8 shows the flow patterns of the cases of water and bacteria suspension along the channel. As can be seen, the intensity of cavitating flows is more in the case of bacteria suspension compared to water. Due to safety considerations, the tests with bacteria suspension were not performed at pressures higher than 5.65 MPa. The cavitation number, as explained via Equation (1), depends on the inlet pressure, saturation vapor pressure, velocity, and density of the working fluid. As a result, increasing the inlet pressure leads to a decrease in the cavitation number. Under the choked flow condition, where the flow rate in the microfluidic device is saturated, the velocity does not increase with the inlet pressure. As a result, the cavitation number increases beyond this point.

4.3. Deactivation Effects of Hydrodynamic Cavitation on the Bacteria Suspended in PBS

The cavitation bubbles carry a potential energy relative to the size of the bubbles, as demonstrated in Equation (6) [33]
E p o t = 4 3 π R 3 ( P P v a p )
where R is the radius of the generated bubbles, and P is the static pressure of the working fluid. The carrying potential energy by each bubble is converted to heat, vibration, noise, and shock wave upon collapse, thereby generating high pressure and temperature local points. The released energy by the bubbles affects the viability of the bacteria suspended in the working fluid. In order to study this effect, the exiting fluid from the microfluidic device was collected in a sterile container and was reloaded to the fluid container by sterile serological pipettes for several times, and the viability study was performed after the first, tenth, and fifteenth cycles.
In order to determine the antibacterial activity of the cavitation processes, bacteria suspensions collected before and after the cavitation flow assays were plated on the Luria-Bertani (LB) agar medium at 1:10 dilution and incubated overnight in order to check for the bacterial growth on the cavitated and the control samples.
The clogging problem happened for the second device as well. As a result, the deactivation effect of cavitating flow was only investigated in the third device under the developed flow condition obtained at the inlet pressure of 4.48 MPa. Figure 9a shows the complete growth of bacteria on the control agar plate before the experiment and also after the first cycle of cavitating flow in the microfluidic device (Figure 9b). The bacteria seem intact as a result of the cavitating flow after the first cycle, and the number of colonies does not change considerably. This is due to the short exposure of bacteria to collapsing bubbles after the first cycle. However, Figure 9c demonstrates a significant decrease in the number of bacteria colonies after the tenth cycle, while Figure 9d demonstrates complete deactivation of the bacteria after the fifteenth cycle. Each cycle of the cavitating flow took less than 3 min for 250 mL of the bacteria suspension. A bacteria deactivation efficiency of 100% can be attained with this device within 45 min of system operation.
SEM analysis of the sample after the cavitation assay (Figure 10a), which was prepared on a silicon substrate using the same methodology explained in Section 2.5, agrees with Figure 9d, where no bacteria colony is visible on the agar plate after 15 cycles. Figure 10b displays bacteria colony numbers, which were determined by using the digital image analysis software ImageJ [34]. The data were presented as the mean of three software-based bacterial colony measurements. As can be seen, the colony number decreases with the number of cycles, which suggests the effectiveness of the “cavitation on chip” concept in deactivation.

5. Conclusions

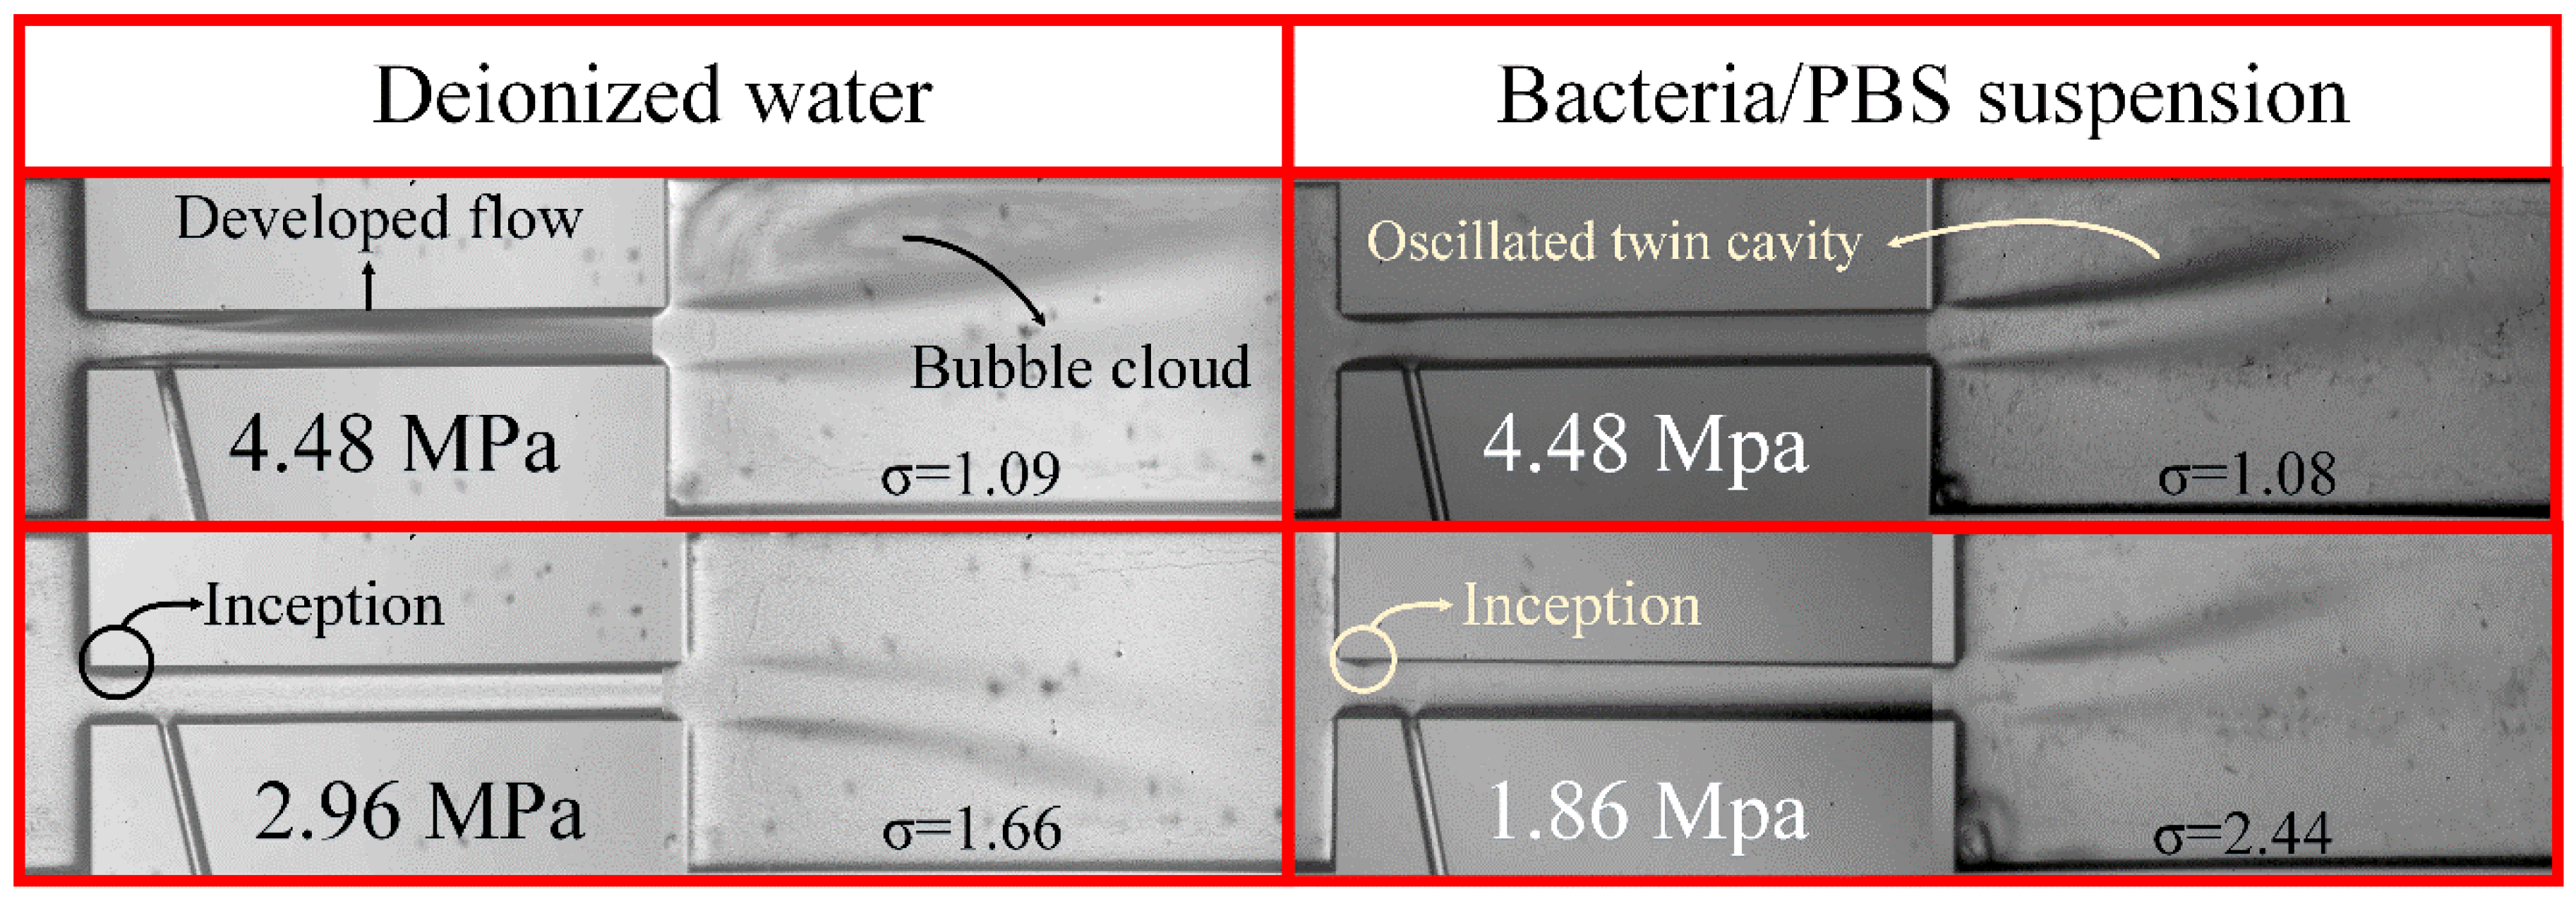
In the first part of this study, water and PBS were tested as the working fluids in the fabricated microfluidic devices, and the differences in the flow behavior were discussed with the perspective of thermophysical differences. The results confirm the importance of surface tension and density of the working fluid for the nucleation of cavitating bubbles. The inception of hydrodynamic cavitation at the inlet happened at 2.41 MPa for the case of PBS, while it occurred at 3.10 MPa for the case of water. The tendency of PBS to form bubbly flow rather than bubble cloud was also recognized. The intensity of cavitating flows in the extension of the microfluidic devices was also another difference between the working fluids in this study. PBS led to a more intense cavitation flow regime in the extension compared to the case of water.
The second part of this study is dedicated to the effect of the presence of S. typhimurium in the working fluid on the flow patterns. The irregular shape of the bacteria in the working fluid acted as a solid interface, which promoted the inception of cavitation by increasing the heterogeneous nucleation sites. The energy released upon the collapse of the cavitating bubbles had an impact on the viability of the bacteria in the working fluid. The viability test on the suspended bacteria in the fluid exhibited a significant decrease in the colony number of bacteria after experiments. A deactivation efficiency of 100% was attained in the designed microfluidic devices.
A change in the design of the microfluidic devices, such as putting more micro-orifices on one chip, could further augment the output of the system. On the other hand, in some applications such as energy harvesting, intensifying the cavitating flow in microfluidic devices is of great importance. Reaching developed cavitating flows at lower inlet pressures could increase the efficiency of energy harvesting systems. Hence, using bacteria (non-toxic species) in the working fluid with this purpose could be a solution to raise the efficiency of energy harvesting systems, which are based on the “hydrodynamic cavitation on chip” concept. The major advantages of the proposed system are the low cost of fabrication and high bacteria deactivation efficiency.
The proposed concept in the study could be well utilized for energy harvesting as well as for water treatment. Since bacteria are found abundant in nature, and their culture is not a very costly procedure, they could be considered as strong candidates in energy harvesting systems to enhance performance. The species of the bacteria could be changed in this regard to ensure a safe and more environmentally-friendly platform. In addition, the design of such microfluidic devices could be further optimized.

Author Contributions

Conceptualization, M.G. and M.Y.; Methodology, M.T.G., M.G., A.K., and M.Y.; Software, M.T.G., M.T., A.P.; Validation, M.T.G., M.G., M.Y., and A.K.; Formal Analysis, M.T.G., M.G., A.K., and M.Y.; Investigation, M.T.G., M.G., A.K., and M.Y.; Resources, M.G., A.K., and M.Y.; Data Curation, M.T.G., M.G., A.K.; Writing—Original Draft Preparation, M.T.G., M.T., M.G., and A.K.; Writing—Review and Editing, M.T.G., M.G., A.K., A.P., M.T., and M.Y.; Visualization, M.T.G., M.T., and A.P.; Supervision, M.G., M.Y., and A.K.; Project Administration, M.G.; Funding Acquisition, M.G., A.K. All authors have read and agreed to the published version of the manuscript.

Funding

This study was supported by TUBITAK (The Scientific and Technological Research Council of Turkey) Support Program for Scientific and Technological Research Project Grant No. 217M869 and the Sabanci University Internal Project Grant No. I.A.CF-18-01877. Equipment utilization support from the Sabanci University Nanotechnology Research and Applications Center (SUNUM) is gratefully appreciated.

Conflicts of Interest

The authors declare no conflict of interest.

References

  1. Deng, S.S.; Li, G.D.; Guan, J.F.; Chen, X.C.; Liu, L.X. Numerical study of cavitation in centrifugal pump conveying different liquid materials. Results Phys. 2019, 12, 1834–1839. [Google Scholar] [CrossRef]
  2. Escaler, X.; Egusquiza, E.; Farhat, M.; Avellan, F.; Coussirat, M. Detection of cavitation in hydraulic turbines. Mech. Syst. Sig. Process. 2006, 20, 983–1007. [Google Scholar] [CrossRef] [Green Version]
  3. Gevari, M.T.; Ghorbani, M.; Svagan, A.J.; Grishenkov, D.; Kosar, A. Energy harvesting with micro scale hydrodynamic cavitation-thermoelectric generation coupling. AIP Adv. 2019, 9, 105012. [Google Scholar] [CrossRef]
  4. Ghorbani, M.; Mohammadi, A.; Motezakker, A.R.; Villanueva, L.G.; Leblebici, Y.; Koşar, A. Energy Harvesting in Microscale with Cavitating Flows. ACS Omega 2017, 2, 6870–6877. [Google Scholar] [CrossRef]
  5. Šarc, A.; Stepišnik-Perdih, T.; Petkovšek, M.; Dular, M. The issue of cavitation number value in studies of water treatment by hydrodynamic cavitation. Ultrason. Sonochem. 2017, 34, 51–59. [Google Scholar] [CrossRef]
  6. Dular, M.; Griessler-Bulc, T.; Gutierrez-Aguirre, I.; Heath, E.; Kosjek, T.; Klemenčič, A.K.; Oder, M.; Petkovšek, M.; Rački, N.; Ravnikar, M.; et al. Use of hydrodynamic cavitation in (waste) water treatment. Ultrason. Sonochem. 2016, 29, 577–588. [Google Scholar] [CrossRef]
  7. Ghorbani, M.; Sozer, C.; Alcan, G.; Unel, M.; Ekici, S.; Uvet, H.; Koşar, A. Biomedical device prototype based on small scale hydrodynamic cavitation. AIP Adv. 2018, 8, 35108. [Google Scholar] [CrossRef]
  8. Albanese, L.; Ciriminna, R.; Meneguzzo, F.; Pagliaro, M. Beer-brewing powered by controlled hydrodynamic cavitation: Theory and real-scale experiments. J. Clean. Prod. 2017, 142, 1457–1470. [Google Scholar] [CrossRef] [Green Version]
  9. Karimzadehkhouei, M.; Ghorbani, M.; Sezen, M.; Şendur, K.; Pınar Mengüç, M.; Leblebici, Y.; Koşar, A. Increasing the stability of nanofluids with cavitating flows in micro orifices. Appl. Phys. Lett. 2016, 109, 104101. [Google Scholar] [CrossRef]
  10. Gevari, M.T.; Abbasiasl, T.; Niazi, S.; Ghorbani, M.; Kosar, A. Direct and indirect thermal applications of hydrodynamic and acoustic cavitation: A review. Appl. Therm. Eng. 2020, 171, 115065. [Google Scholar] [CrossRef]
  11. Christopher, E.B. Cavitation and Bubble Dynamics Christopher; California-New York Calif. Inst. Technol: Pasadena, CA, USA, 1995. [Google Scholar]
  12. Ghorbani, M.; Sadaghiani, A.K.; Villanueva, L.G.; Koşar, A. Hydrodynamic cavitation in microfluidic devices with roughened surfaces. J. Micromech. Microeng. 2018, 28, 075016. [Google Scholar] [CrossRef]
  13. Simpson, A.; Ranade, V.V. Modelling of hydrodynamic cavitation with orifice: Influence of different orifice designs. Chem. Eng. Res. Des. 2018, 136, 698–711. [Google Scholar] [CrossRef] [Green Version]
  14. Yusof, N.S.M.; Babgi, B.; Alghamdi, Y.; Aksu, M.; Madhavan, J.; Ashokkumar, M. Physical and chemical effects of acoustic cavitation in selected ultrasonic cleaning applications. Ultrason. Sonochem. 2016, 29, 568–576. [Google Scholar] [CrossRef] [PubMed]
  15. Ghorbani, M.; Deprem, G.; Ozdemir, E.; Motezakker, A.R.; Villanueva, L.G.; Koşar, A. On “Cavitation on Chip” in Microfluidic Devices With Surface and Sidewall Roughness Elements. J. Microelectromech. Syst. 2019, 28, 890–899. [Google Scholar] [CrossRef]
  16. Carpenter, J.; George, S.; Saharan, V.K. Low pressure hydrodynamic cavitating device for producing highly stable oil in water emulsion: Effect of geometry and cavitation number. Chem. Eng. Process. 2017, 116, 97–104. [Google Scholar] [CrossRef]
  17. Ghorbani, M.; Aghdam, A.S.; Gevari, M.T.; Koşar, A.; Cebeci, F.Ç.; Grishenkov, D.; Svagan, A.J. Facile hydrodynamic cavitation ON CHIP via cellulose nanofibers stabilized perfluorodroplets inside layer-by-layer assembled SLIPS surfaces. Biochem. Eng. J. 2020, 382, 122809. [Google Scholar] [CrossRef]
  18. Gevari, M.T.; Shafaghi, A.H.; Villanueva, L.G.; Ghorbani, M.; Koşar, A. Engineered Lateral Roughness Element Implementation and Working Fluid Alteration to Intensify Hydrodynamic Cavitating Flows on a Chip for Energy Harvesting. Micromachines 2020, 11, 49. [Google Scholar] [CrossRef] [Green Version]
  19. Doltade, S.B.; Dastane, G.G.; Jadhav, N.L.; Pandit, A.B.; Pinjari, D.V.; Somkuwar, N.; Paswan, R. Hydrodynamic cavitation as an imperative technology for the treatment of petroleum refinery effluent. J. Water Process Eng. 2019, 29, 100768. [Google Scholar] [CrossRef]
  20. Jain, P.; Bhandari, V.M.; Balapure, K.; Jena, J.; Ranade, V.V.; Killedar, D.J. Hydrodynamic cavitation using vortex diode: An efficient approach for elimination of pathogenic bacteria from water. J. Environ. Manag. 2019, 242, 210–219. [Google Scholar] [CrossRef]
  21. Tanner, S.A.; Chassard, C.; Rigozzi, E.; Lacroix, C.; Stevens, M.J. Bifidobacterium thermophilum RBL67 impacts on growth and virulence gene expression of Salmonella enterica subsp. enterica serovar Typhimurium. BMC Microbiol. 2016, 16, 46. [Google Scholar] [CrossRef]
  22. Fàbrega, A.; Vila, J. Salmonella enterica serovar Typhimurium skills to succeed in the host: Virulence and regulation. Clin. Microbiol. Rev. 2013, 26, 308–341. [Google Scholar] [CrossRef] [PubMed] [Green Version]
  23. Bhunia, R.; Ramakrishnan, R.; Hutin, Y.; Gupte, M.D. Cholera outbreak secondary to contaminated pipe water in an urban area, West Bengal, India, 2006. Indian J. Gastroenterol. 2009, 28, 62–64. [Google Scholar] [CrossRef] [PubMed]
  24. Kulinkina, A.V.; Mohan, V.R.; Francis, M.R.; Kattula, D.; Sarkar, R.; Plummer, J.D.; Naumova, E.N. Seasonality of water quality and diarrheal disease counts in urban and rural settings in south India. Sci. Rep. 2016, 6, 20521. [Google Scholar] [CrossRef] [PubMed] [Green Version]
  25. Panda, D.; Manickam, S. Hydrodynamic cavitation assisted degradation of persistent endocrine-disrupting organochlorine pesticide Dicofol: Optimization of operating parameters and investigations on the mechanism of intensification. Ultrason. Sonochem. 2019, 51, 526–532. [Google Scholar] [CrossRef]
  26. Parthasarathy, S.; Siah Ying, T.; Manickam, S. Generation and optimization of palm oil-based oil-in-water (O/W) submicron-emulsions and encapsulation of curcumin using a liquid whistle hydrodynamic cavitation reactor (LWHCR). Ind. Eng. Chem. Res. 2013, 52, 11829–11837. [Google Scholar] [CrossRef]
  27. Tang, S.Y.; Sivakumar, M. A novel and facile liquid whistle hydrodynamic cavitation reactor to produce submicron multiple emulsions. AIChE J. 2013, 59, 155–167. [Google Scholar] [CrossRef]
  28. Brennen, C.E. Cavitation and Bubble Dynamics; Cambridge University Press: New York, NY, USA, 2014. [Google Scholar]
  29. Kline, S.J. Describing uncertainty in single sample experiments. Mech. Eng. 1953, 75, 3–8. [Google Scholar]
  30. Medrano, M.; Zermatten, P.J.; Pellone, C.; Franc, J.P.; Ayela, F. Hydrodynamic cavitation in microsystems. I. Experiments with deionized water and nanofluids. Phys. Fluids 2011, 23, 127103. [Google Scholar] [CrossRef]
  31. Young, D.F.; Munson, B.R.; Okiishi, T.H.; Huebsch, W.W. A Brief Introduction to Fluid Mechanics; John Wiley & Sons: Upper Saddle River, NJ, USA, 2010. [Google Scholar]
  32. Mishra, C.; Peles, Y. Cavitation in flow through a micro-orifice inside a silicon microchannel. Phys. Fluids 2005, 17, 013601. [Google Scholar] [CrossRef]
  33. Ward, B.; Emmony, D.C. The energies and pressures of acoustic transients associated with optical cavitation in water. J. Mod. Opt. 1990, 37, 803–811. [Google Scholar] [CrossRef]
  34. Choudhry, P. High-throughput method for automated colony and cell counting by digital image analysis based on edge detection. PLoS ONE 2016, 11, e0148469. [Google Scholar] [CrossRef] [PubMed] [Green Version]
Figure 1. The geometry of the microfluidic devices (Devices 1, 2, and 3) with lateral roughness elements.
Processes 08 00326 g001
Figure 2. Microfabrication process flow, (a) silicon dioxide layer after the first lithography and dry etching, (b) the second lithography to open the inlet, outlets, and pressure ports followed by a silicon dioxide dry etching, (c) the first deep reactive ion etching of silicon, (d) the photoresist stripping and the second deep reactive ion etching of silicon, and (e) anodic bonding of the substrate to the glass lead.
Processes 08 00326 g002
Figure 3. The schematic of the experimental setup including the high-pressure nitrogen tank to push the fluid in the system, the fluid container, chip holder sandwich to install the microfluidic device, sterile fluid reservoir to collect the exiting fluid, point light source, high-speed camera, data acquisition system, and proper piping and valves.
Processes 08 00326 g003
Figure 4. Cavitation number and flow patterns of the first microfluidic device for the case of water and PBS.
Processes 08 00326 g004
Figure 5. Reynolds and cavitation numbers and flow patterns of the second and third microfluidic devices for the cases of water and PBS.
Processes 08 00326 g005
Figure 6. SEM imaged of the bacteria before the experiments.
Processes 08 00326 g006
Figure 7. The flow pattern of the second device working with water and bacteria suspension (merged images from high speed camera).
Processes 08 00326 g007
Figure 8. The fluid flow pattern of water and bacteria suspension in the third microfluidic device.
Processes 08 00326 g008
Figure 9. Bacteria colonies on the agar plates exposed to developed cavitating flow at inlet pressure of 4.48 MPa (a) complete growth of the bacteria before the experiments, (b) no significant change in the number of colonies after the first cycle of the cavitation (approximately 3 min), (c) a significant decrease in the number of active colonies after the tenth cycle of the hydrodynamic cavitation (approximately 30 min), (d) complete deactivation of the bacteria after the fifteenth cycle of the experiments (approximately 45 min).
Processes 08 00326 g009
Figure 10. (a) SEM analysis of the sample after the cavitation assay, (b) the quantitative data of the bacteria colony number.
Processes 08 00326 g010
Table 1. Geometrical dimensions of all three devices (all the values are in micrometer) and the range of the working flowrates.
L1W1L2W2L3W3Height of RoughnessLength of RoughnessWorking Flowrates (mL/min)Working Pressures (MPa)
Device 12000900200010020009001L218.1–28.51.38–5.17
Device 22000900200015220009001.51/3L224–38.71.86–6.20
Device 320009002000400200090041/3L251–88.21.24–4.48
Table 2. Uncertainties in experimental parameters.
UncertaintyError
Cavitation number±6.5%
Reynolds number±5.7%
Flow rate±1.4%
Pressure drop±0.3%
Discharge coefficient ±1.9%
Microchannel width±0.2 μm
Table 3. Thermophysical properties of DI water and PBS.
DI WaterPBS
Density (ρ; kg/m3)998.21060
Surface tension (γ; mN/m)72.269.5
Saturation vapor pressure (Pvap; kPa)2.332.27
Dynamic viscosity (µ; Pa.s)8.9 × 10−49.04 × 10−4

