Thermal Behavior of a Rod during Hot Shape Rolling and Its Comparison with a Plate during Flat Rolling


School of Mechanical Engineering, Tongmyong University, Busan 48520, Korea
Processes 2020, 8(3), 327; https://0-doi-org.brum.beds.ac.uk/10.3390/pr8030327
Submission received: 12 February 2020
/
Revised: 2 March 2020
/
Accepted: 6 March 2020
/
Published: 10 March 2020
(This article belongs to the Special Issue Process Modeling in Pyrometallurgical Engineering)
Abstract
:The thermal behavior of a rod during the hot shape rolling process was investigated using the off-line hot rolling simulator and numerical simulation. Additionally, it was compared with a plate during the flat rolling process to understand the thermal behavior of the rod during the hot rolling process in more detail. The temperature of the rod and plate during the hot rolling process was measured at several points with thermocouples using the rolling simulator, and then the measured temperature of each region of a workpiece was analyzed with numerical simulation. During hot rolling process, the temperature distribution of the rod was very different from the plate. The temperature deviation of the rod with area was much higher than that of the plate. The variation in effective stress of the rod along the circumferential direction can induce the temperature difference with area of the rod, whereas the plate had a relatively lower temperature deviation with area due to the uniform effective stress on the surface area. The heat generation by plastic deformation during the forming process also increased the temperature deviation of the rod with area, whereas strain distribution of the plate during flat rolling contributed to the uniformity of temperature of the plate with area. The higher temperature deviation of the rod along the circumferential and radial directions during the shape rolling process can increase the possibility of occurrence in surface defects compared to the plate during flat rolling.
1. Introduction
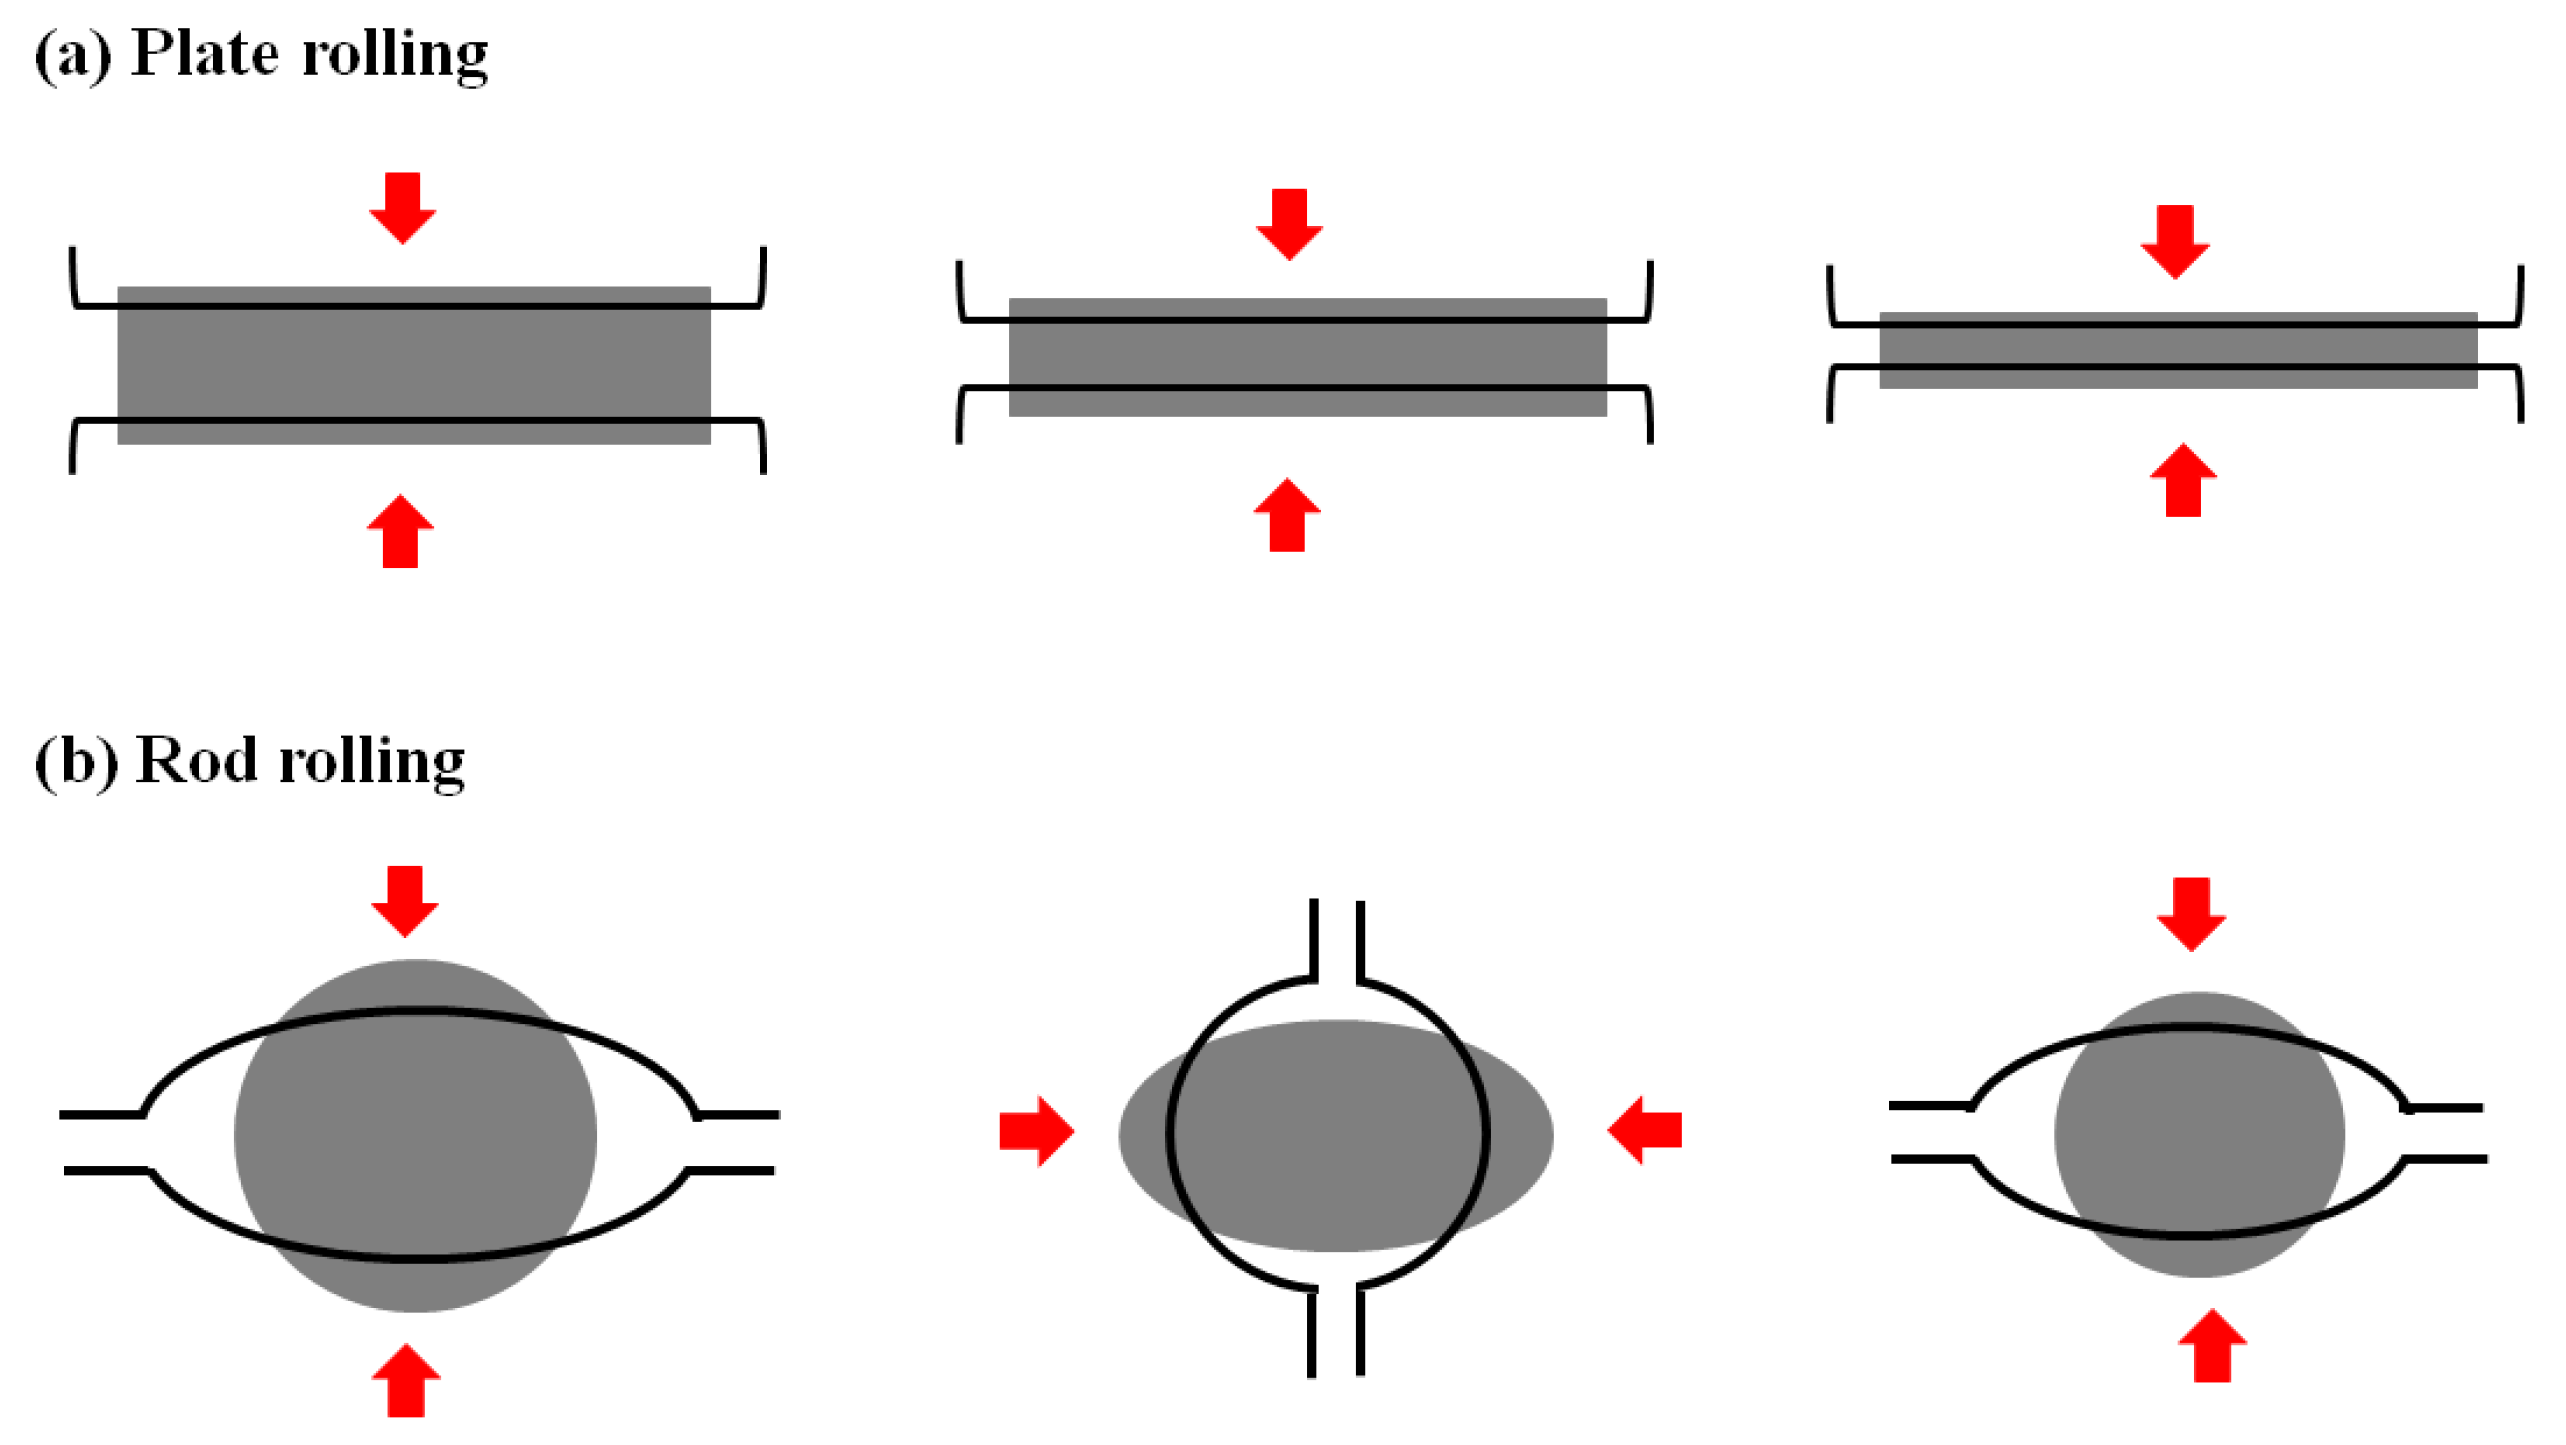
Most steel products are manufactured by the hot rolling process because the hot rolling process is one of the most efficient plastic forming processes in metal forming industries. In this process, the initial large and thick material, which is called slab, bloom, and billet, is changed to the desired shape by passing through two counter-rotating rolls in the temperature range of 900–1200 °C. Many researchers have been devoted to measuring and predicting the temperature of steels during the hot rolling process to improve the quality of hot-rolled products because the thermal history of steel has a strong influence on the quality of final products [1,2,3,4,5,6]. Typically, the hot rolling process is categorized into two groups: flat rolling and shape rolling. Plate and strip are made via the flat rolling process, whereas wire, rod, and bar are manufactured via the shape rolling process. The deformation behavior and thermal history of a rod during the shape rolling process are more complex than those of a plate during the flat rolling process because the rod experiences three-dimensional (3D) deformation during the shape rolling process, as shown in Figure 1. In contrast, the plate is deformed under the plain strain condition, i.e., two-dimensional (2D) deformation. This different deformation behavior between the two processes may induce different thermal history between plate and rod, leading to the different microstructures and mechanical properties between the two processes.
During the last three decades, there have been considerable studies on the temperature of the hot rolling process. Most of the researchers have analyzed the rolling temperature of a workpiece on the basis of the numerical simulations such as finite difference method (FDM) and finite element method (FEM), and then the numerical results were validated by experimental measurement with optical pyrometers. Meanwhile, in the 1990s, several researchers investigated the temperature distribution of a plate during flat rolling using thermocouples in pilot rolling mills [7,8,9,10,11,12,13]. They investigated the effects of rolling speed, reduction ratio of height, oxide scale on the surface, and lubrication conditions on temperature distribution of the plate, and reported that the cooling rate of the plate along the height direction is different. It should be noted that most of the studies aforementioned were concentrated on the strip and plate during the flat rolling process.
In contrast, a little attention has been paid to the thermal behavior of shaped products during the hot rolling process because the prime concern of industrial shape rolling mills is to produce many products with an appropriate cross-sectional shape as fast as possible. In addition, considerable research on the thermal history of the rod was developed on the basis of the approach of plate rolling. Komori and Kato [14] analyzed the temperature distribution of a rod during the hot rolling process with roll shape using the combination of FEM and FDM. They showed that the roll velocity and friction coefficient greatly influences the temperature distribution at the roll–rod interface. They also reported that temperature distribution of the rod is dependent on the roll shape—square-diamond pass and oval-round pass have a different pattern of temperature distribution. Using the four-pass hot rod rolling experiments with low carbon steel, Said et al. [15] reported that 3D modeling is highly necessary to accurately predict the roll force, torque, and temperature of a rod during the shape rolling process. Yuan et al. [16] simulated the temperature and deformation of the rod during multi-pass rod rolling by 3D FEM, and the predicted temperature was compared with the measured temperature with a pyrometer. Xue and Liu [17] developed the 2D numerical model for calculating the temperature distribution of the rod during the multi-pass hot rolling process. Despite the 2D simulation, the calculation time was very short because the constitutive equation was not solved by iterative scheme. The results were validated by FEM simulation and industrial measurement. Serajzadeh et al. [18] developed a mathematical model based on FEM and phase transformation to predict temperature and microstructure distributions of a steel rod. They showed that the rolling speed affects the temperature of the rod. The increase in the rolling speed leads to a lower temperature drop at the surface area of the rod due to the reduced heat transfer between roll and rod stemming from the shorter contact time. Serajzadeh [19] also developed a mathematical 2D model that considered the various process parameters such as caliber shape and rolling speed. Kown et al. [1] studied the temperature distribution of the rod during hot rolling using 3D FEM analysis and experimental measurement. They insisted that the temperature in the surface area drastically decreases during rolling and recovers right after rolling due to the heat redistribution within the rod.
Meanwhile, steel wire, rod, and bar manufacturing industries have suffered from the several surface defect problems during hot rolling process: surface flaw, decarburization, and abnormal grain growth [20,21]. On the basis of the author’s experiences, these surface defects are strongly related to the uneven temperature distribution of the rod during the shape rolling process in comparison with the plate during the flat rolling process [1,22]. Consequently, it is necessary to investigate the detailed temperature distribution of the rod during the hot rod rolling process. In addition, comparative study on the thermal behavior between rod and plate is necessary in order to completely understand the thermal behaviors and the formation of surface defects of the rod during the shape rolling process. On the basis of literature reviews, numerical simulation was mainly used to understand the thermal behaviors of the rod because it is difficult to measure the temperature of the rod during the hot rolling process. Additionally, most of the experimental studies were conducted using the radiation-type pyrometers and thermal cameras to measure the temperature of the rod. However, there are the following five limitations or errors in measuring the temperature of the rod during the hot rolling process:
(i) Pyrometer cannot measure the rod temperature at the rolling time due to the existence of facilities around rolls; thus, only equalized temperature along the radial direction of workpiece is measured, stemming from the rapid rebound of surface temperature. That is, the sharp temperature drop at the surface area by the roll contact cannot be detected.
(ii) During hot rod rolling, measurement errors are generated due to the severe rolling conditions such as the high rolling speed, the vibration of the rod, and the evaporation of coolant for the rolls.
(iii) The measured radiation energy of the rod by pyrometers tends to be lower than that of the actual value, owing to the shape of the round rod, indicating that pyrometers should be carefully validated to measure the shaped materials compared to the flat materials [23].
(iv) Radiation-type pyrometers measure the only surface temperature of a workpiece. Therefore, we cannot understand the temperature distribution of a workpiece along the radial direction.
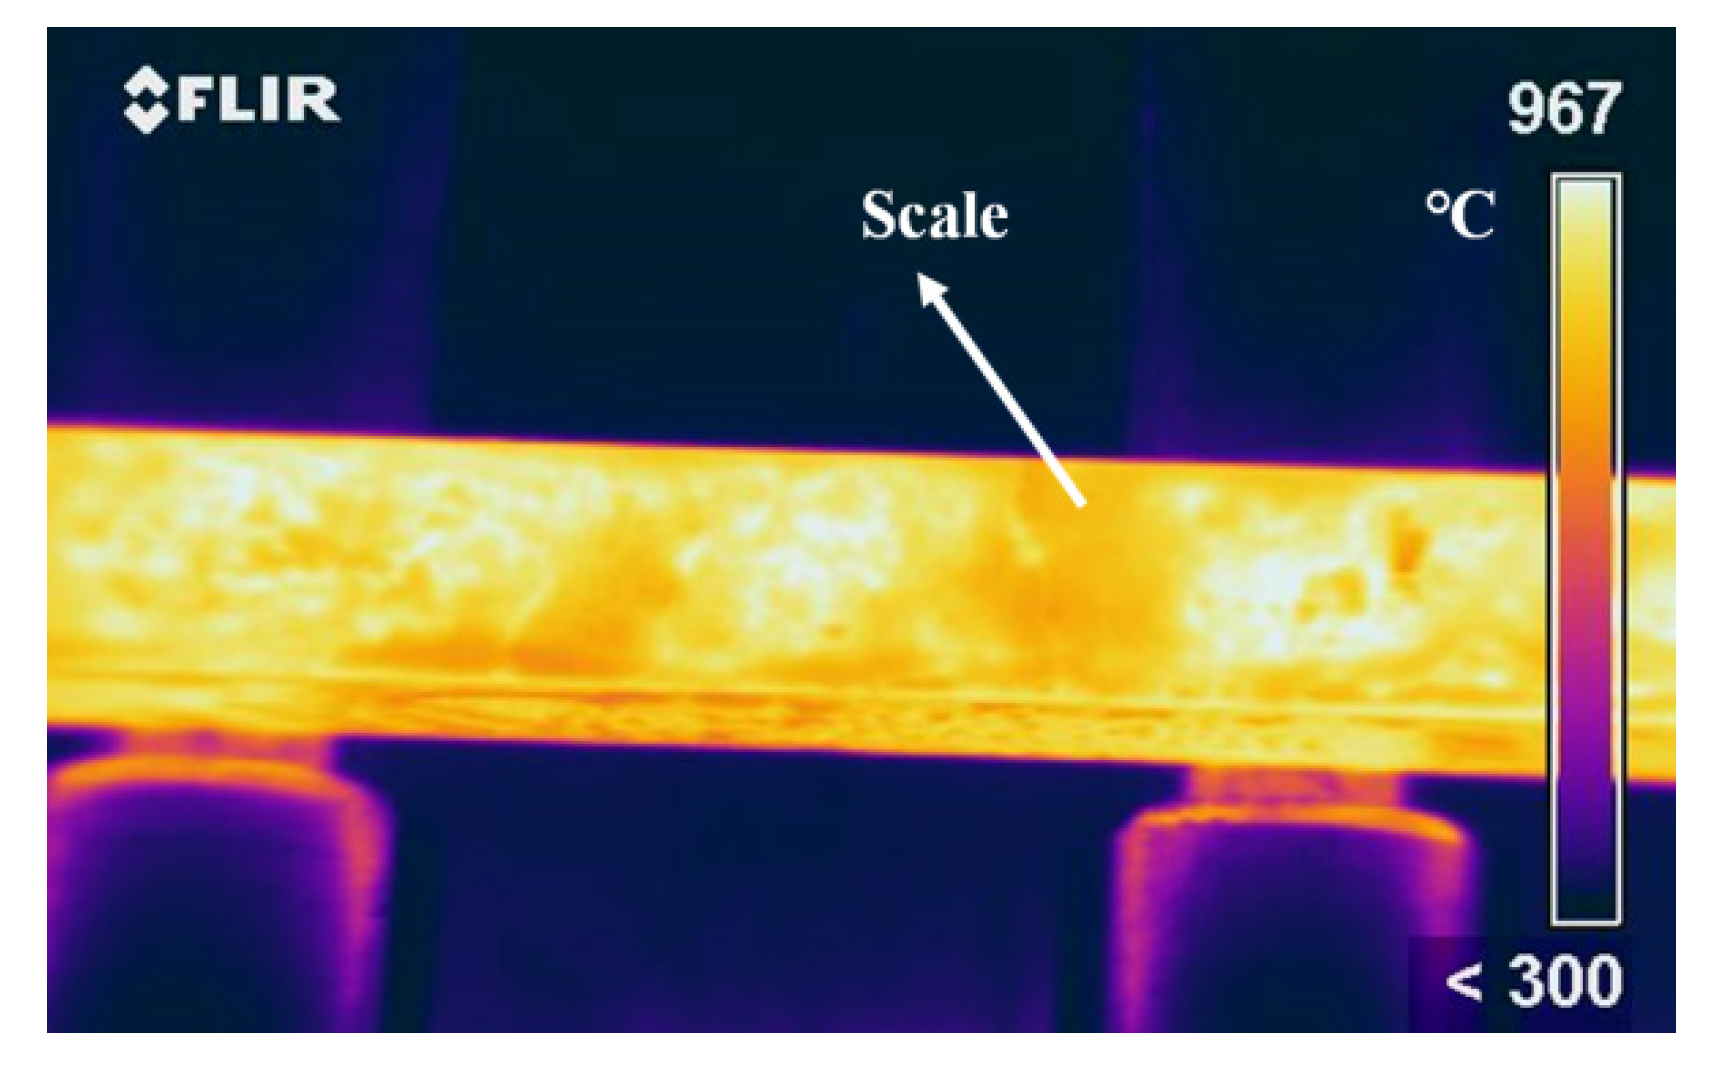
(v) The radiation energy is highly dependent on the surface conditions of the rod. The rod has various oxide scales according to the process conditions and chemical compositions. In other words, measuring the surface temperature is not easy due to the thick oxide scales as shown in Figure 2.
Accordingly, measuring the accurate temperature of the rod with area is not easy. In addition, many researchers measured temperature of the rod at only one point, such as measuring the temperature of the plate. As shown in Figure 1b, the surface of the rod experiences different conditions of heat transfer with area, which is very different from the plate rolling. For instance, one location of the surface strongly makes contact with roll and other location of the surface softly makes contact with roll, which can produce different thermal behaviors of the rod along the circumferential direction, leading to different microstructures and mechanical properties along the circumferential direction of the rod. This different thermal history of the rod with area can induce the surface flaw during hot rod rolling [1]. Consequently, it is necessary to understand the thermal behavior of the rod during the hot rolling process to solve the quality problems in wire, rod, and bar industries and to produce high quality products. Overall, it is insufficient to measure the temperature by pyrometers and to measure the temperature at only the center and surface areas in order to understand the thermal behaviors of the rod during the shape rolling process due to the complex roll contact of the rod during the process. This is totally different from the plate during the flat rolling process, as shown in Figure 1. To the best of the author’s knowledge, no study has been attempted to measure the rod temperature during shape rolling in detail, although several works exist that focus upon plate rolling.
Therefore, temperature of the rod was measured using thermocouples at several points via off-line rolling simulator in order to understand the thermal behavior of the rod during hot shape rolling process in more detail, which can help to improve the surface properties of the rod, for instance through surface flaw, decarburization, and abnormal grain growth, during the shape rolling process. For comparison purposes, temperature of the plate was also measured during the flat rolling process. Then, the measured temperature of the rod and plate with thermocouples was analyzed using a numerical simulation.
2. Experimental Procedure and Numerical Simulation
2.1. Experiment Using Off-line Rolling Simulator
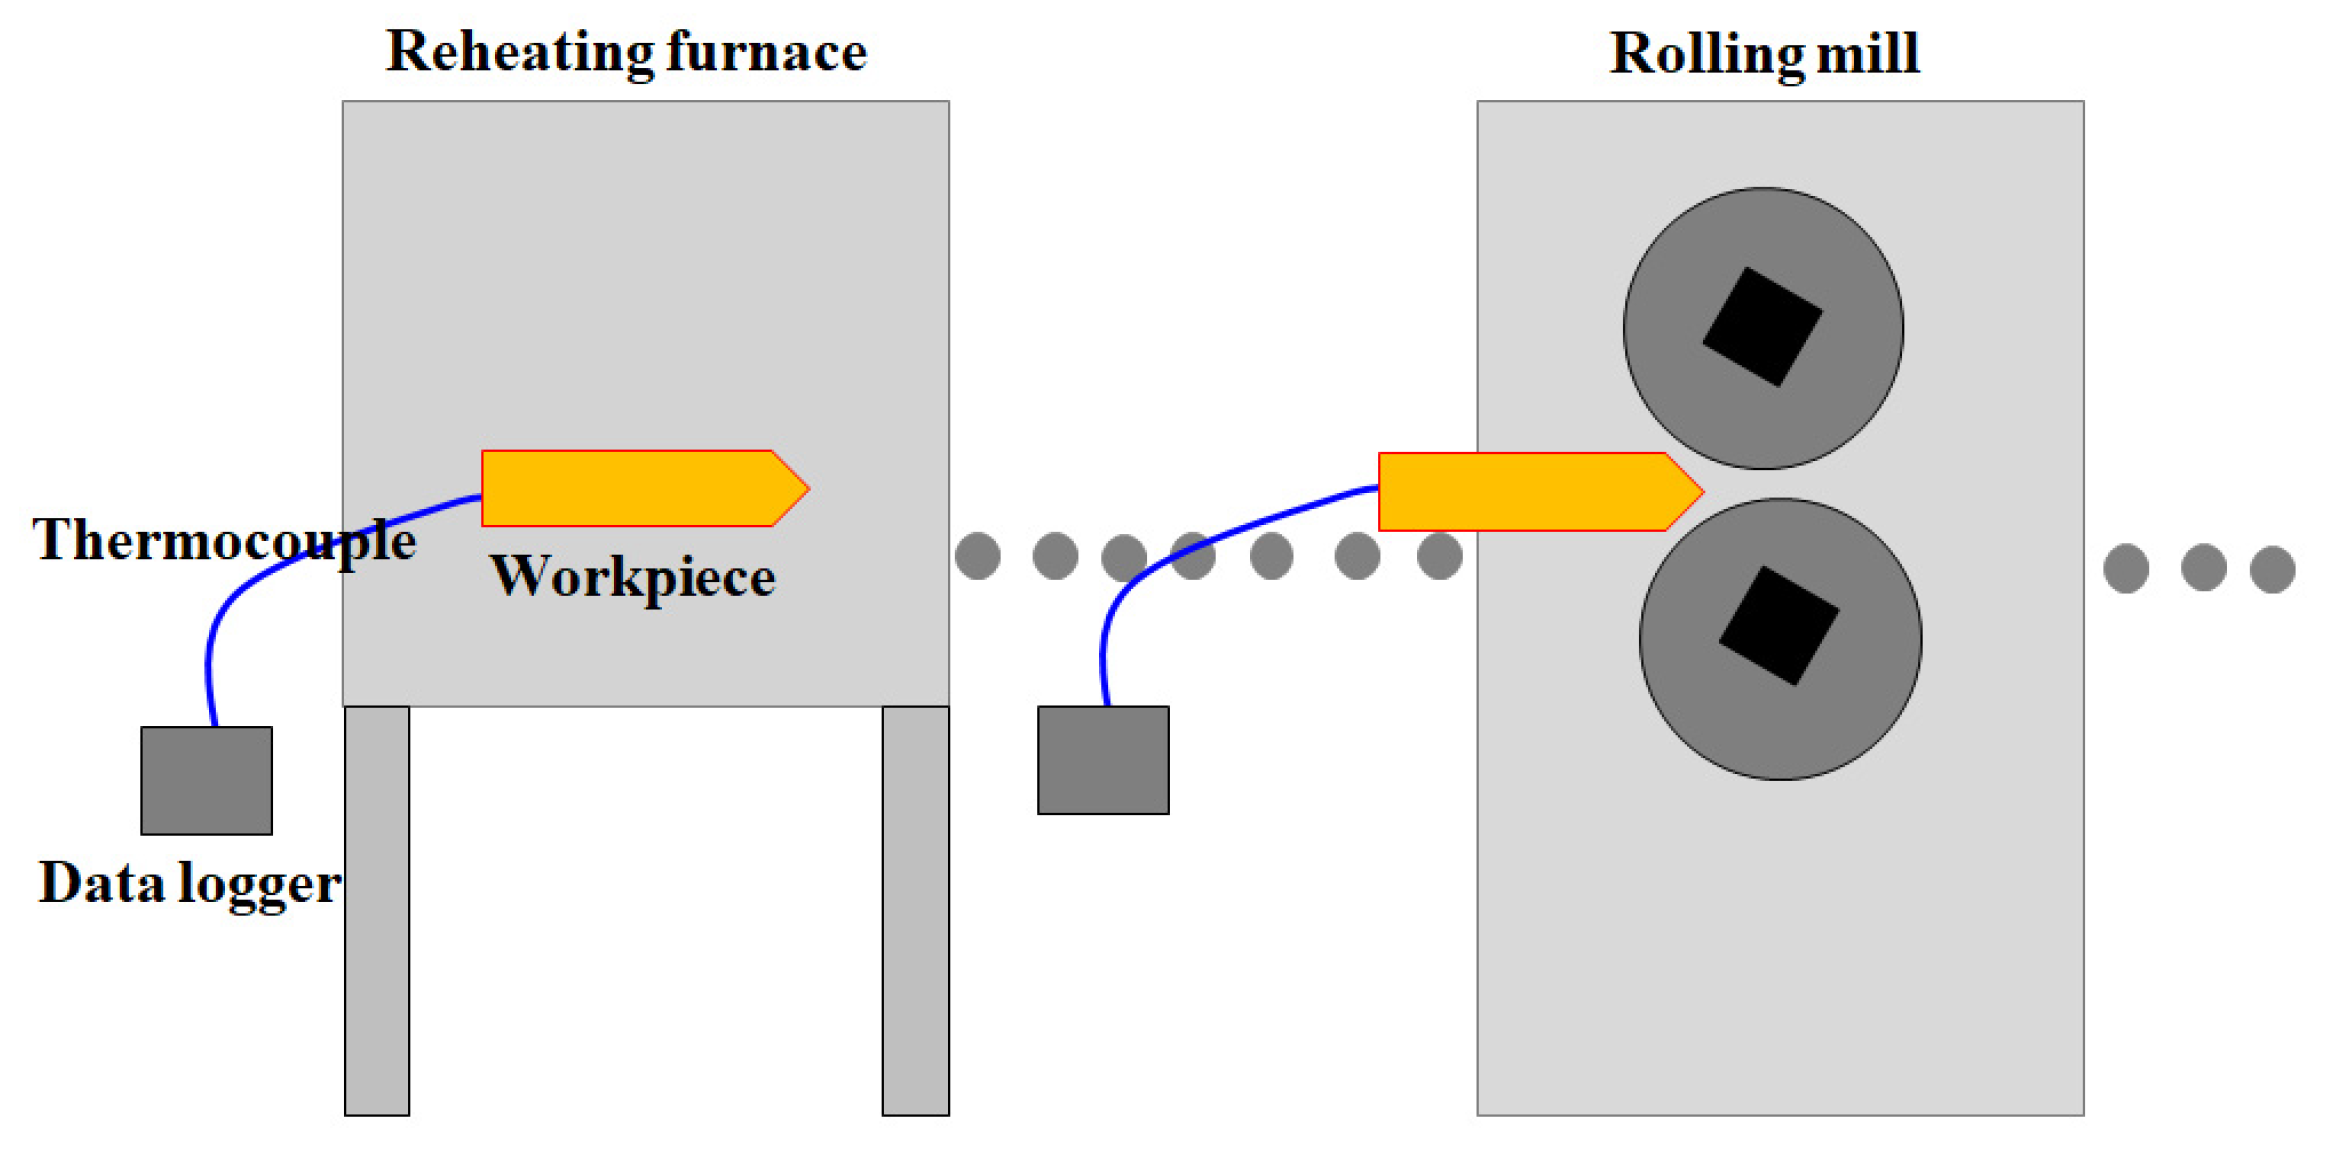
In order to understand the thermal histories of the rod and plate with area, a simulator for the hot rolling process was used. The rolling simulator mainly consisted of a couple of rolls, guide for workpiece, roller conveyor, and reheating furnace, as shown in Figure 3. Prior to the hot rolling test, the workpiece with four thermocouples was placed in a box-type reheating furnace. An oxide scale formation on the surface of a workpiece was suppressed using nitrogen gas in the reheating furnace. When the workpiece was heated to the final temperature of 1150 °C, it stayed for an additional 20 min for a homogenization. Then, the workpiece was withdrawn from the reheating furnace and rolled without lubrication.
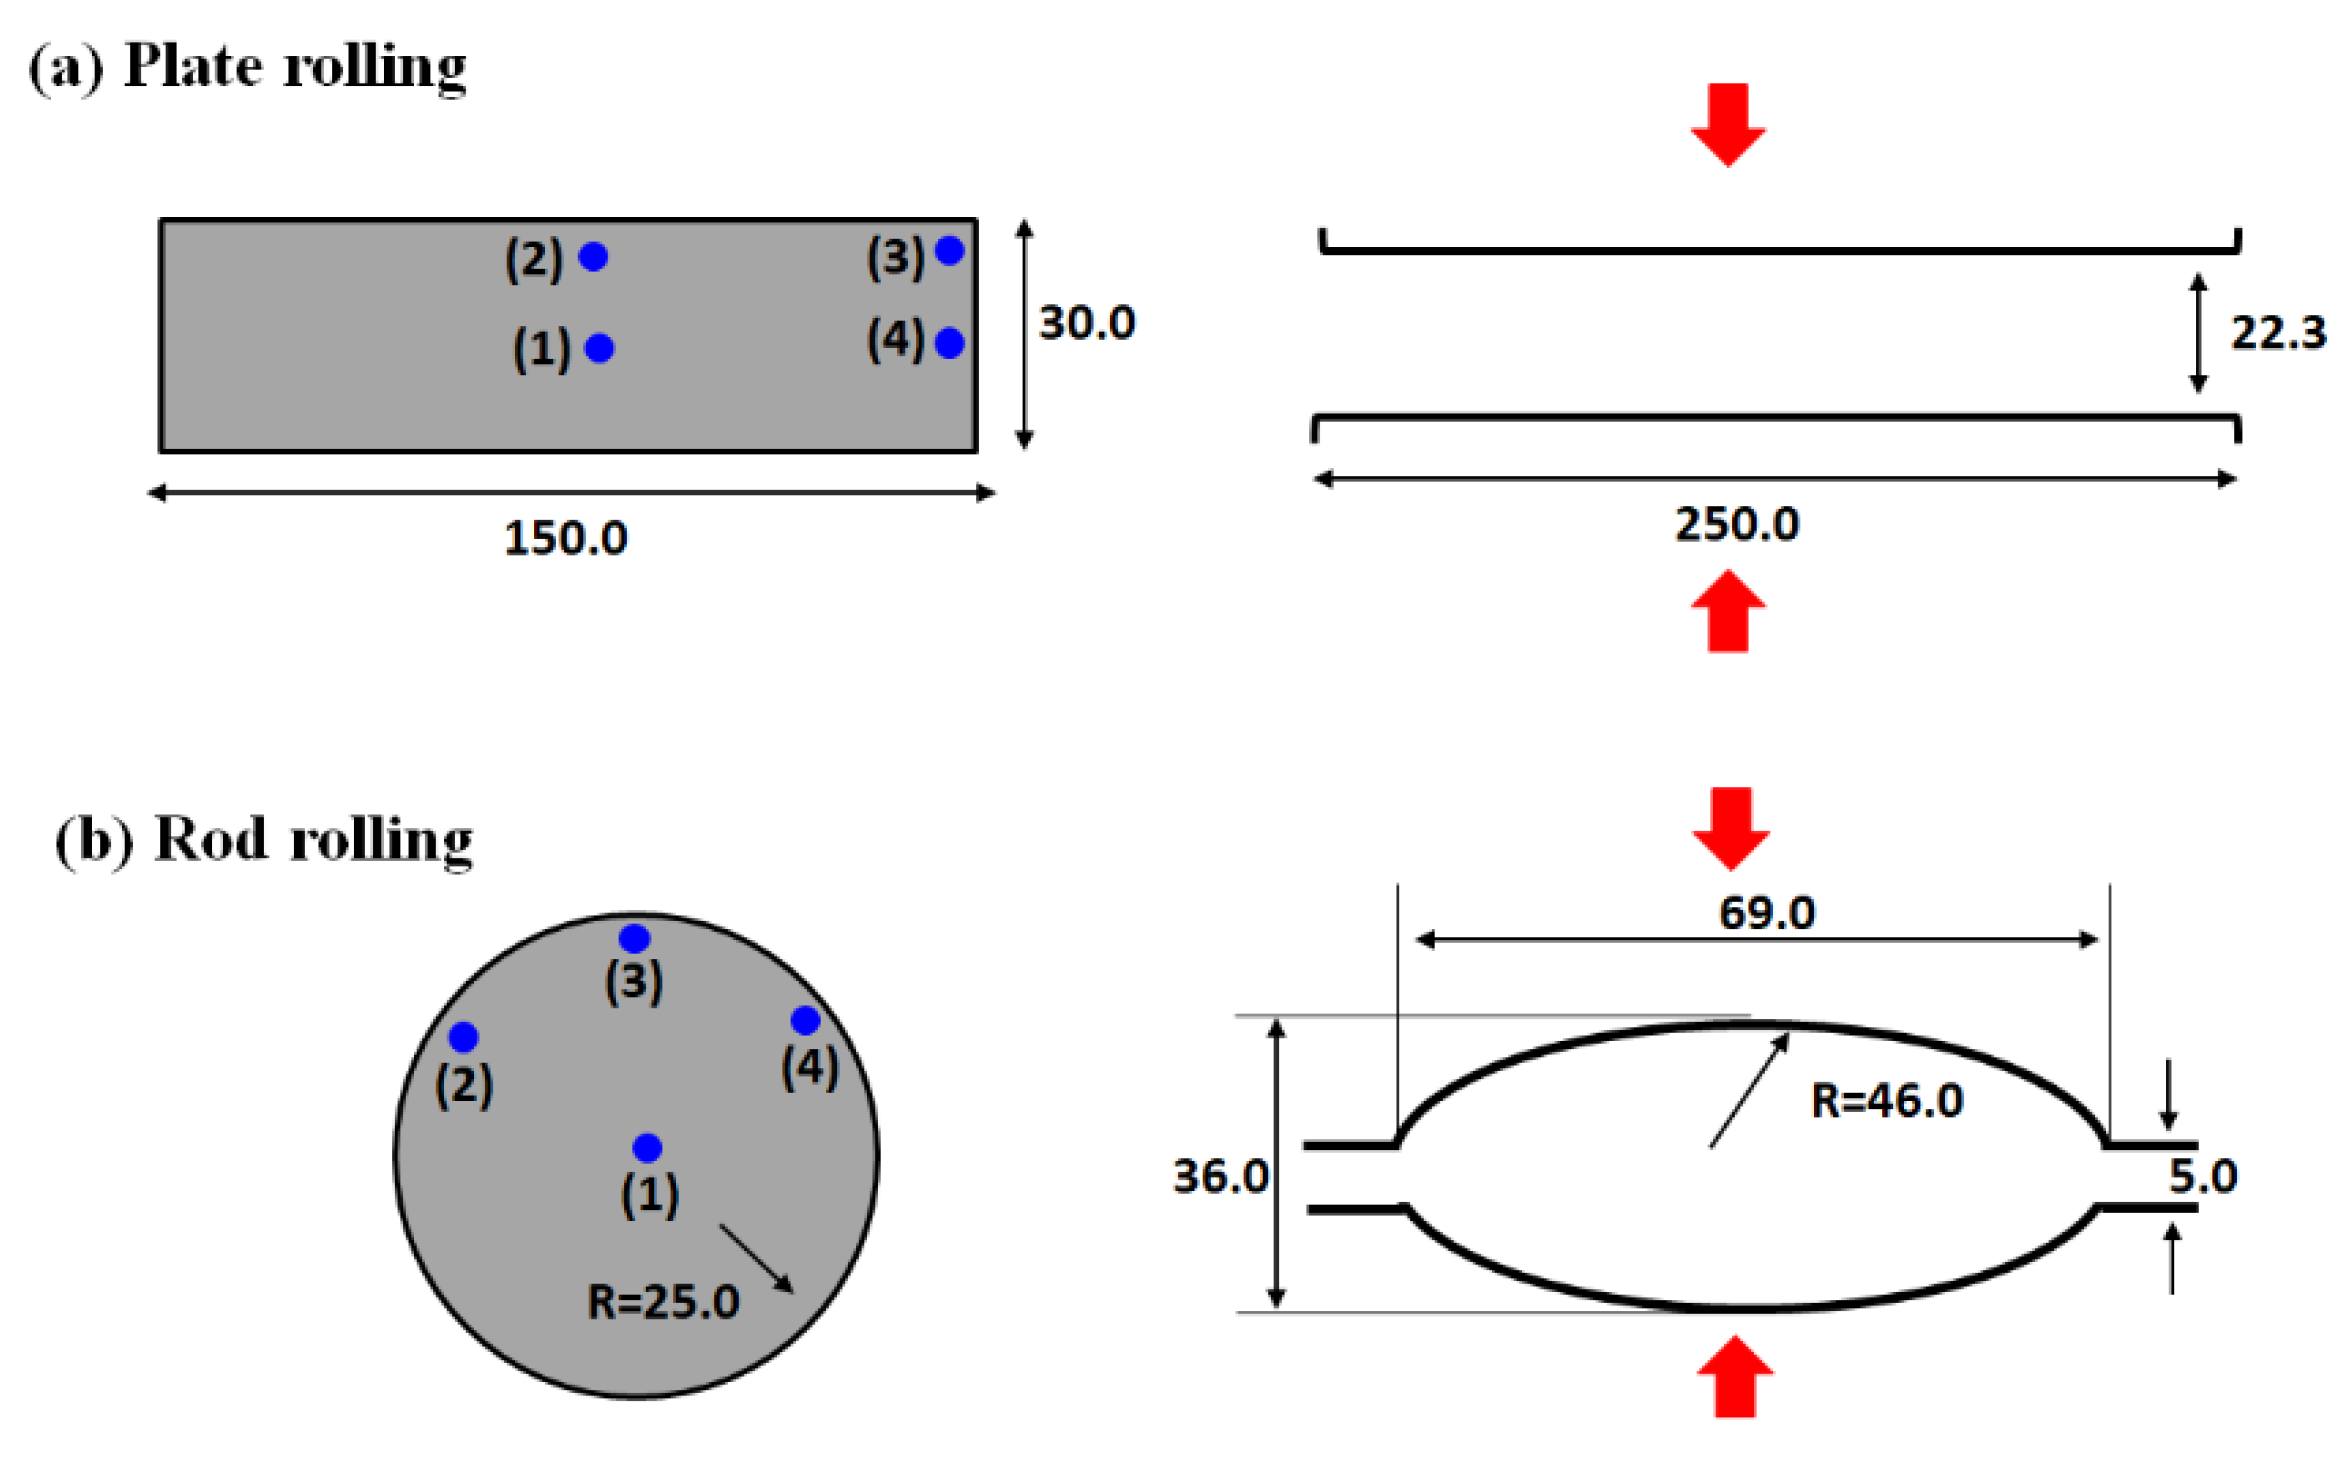
For the flat rolling test, a rectangular plate of 150 × 30 mm was selected for an initial workpiece and it was hot-rolled using the flat rolls, as shown in Figure 4a. The round specimen with a diameter of 50 mm was also hot-rolled using the oval groove, as shown in Figure 4b. The ductile casting iron (DCI) rolls of 400 mm in diameter were rotated at a speed of 10 RPM. Plain low carbon steel, AISI 1020, was used and the analyzed chemical composition in weight percent was Fe-0.2C-0.4Mn. The specific operating conditions are summarized in Table 1. The caliber roll was designed to have a reduction of area (RA) per pass of 20%, which is a general rolling condition in hot rod rolling industries. RA per pass was calculated using the following equation:
where Ao and Af are the areas of initial and final cross section, respectively. The reduction of height of a plate during flat rolling was selected to have a same average effective strain with the rod during shape rolling. The average effective strain of a rod during shape rolling was calculated using the model proposed by Lee et al. [24] that is based on the equivalent rectangle approximation method, which transforms a non-rectangular cross section shape into a rectangular shape, and the average effective strain (εp) is calculated as follows:
where ε1 and ε2 are simply obtained by calculating the reduction ratio of width and height in equivalent rectangle approximation, respectively. In case of plate rolling, the ratio of ε1 and ε2 is very small in nature, and thus the average effective strain is represented as follows:
where ε2 is calculated by the reduction ratio of height as follows:
where Hi and Hf are the height of initial and final plate, respectively. The final height of a plate was chosen using Equation (3), as shown in Figure 4a.
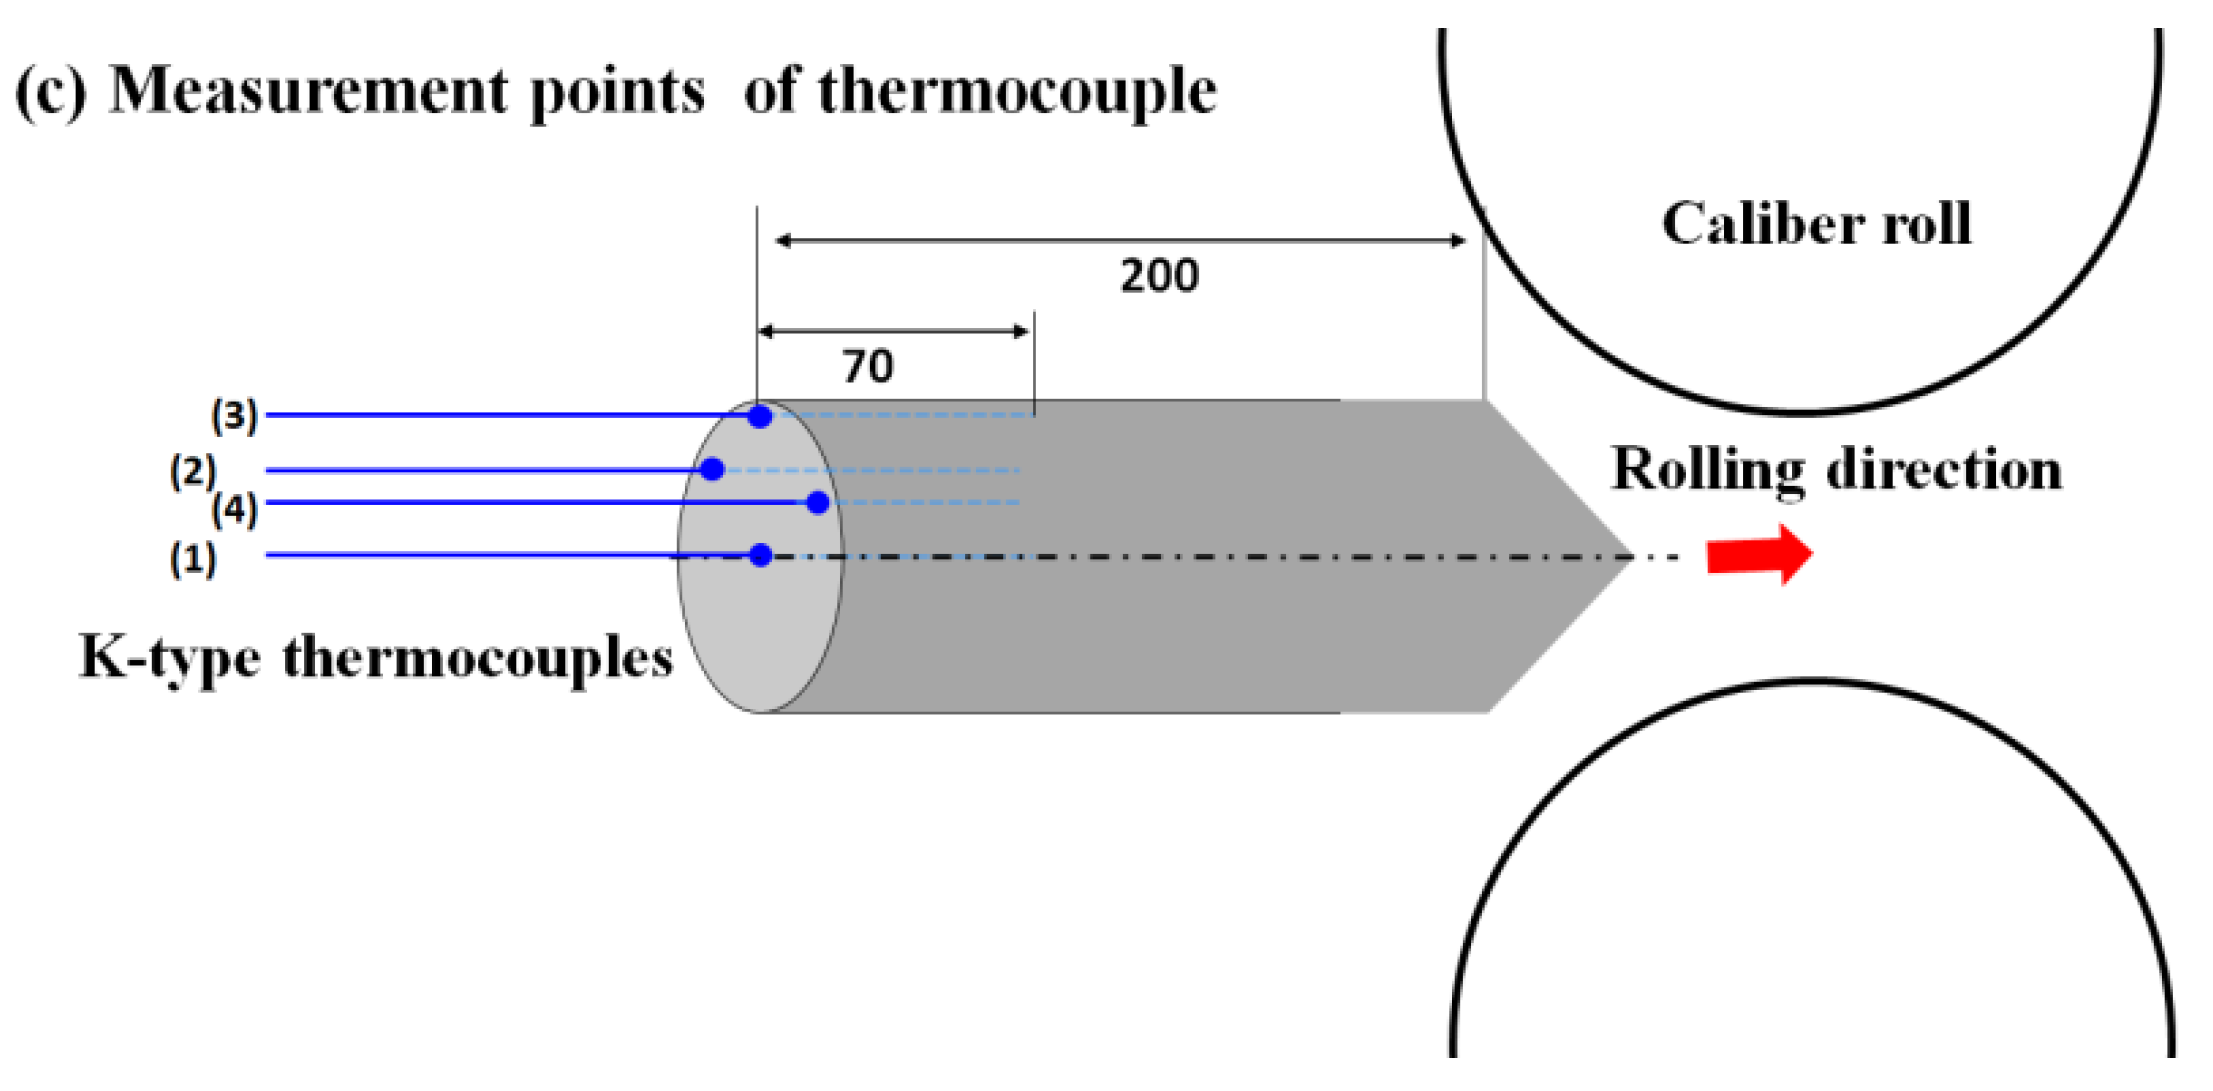
Figure 4a,b shows the schematic description of the measurement points of temperature using thermocouples in workpieces. Four points were measured at the each process using chromel–alumel (K-type) thermocouples with an Inconel sheath. The response time of the thermocouple was improved by decreasing its diameter; therefore, 1.0 mm diameter thermocouple was selected, although it was easily breakable during the experiment under the severe working conditions such as the hot rolling test. Thermocouples were embedded in the 70 mm deep hole drilled from the tail end of a workpiece, as shown in Figure 4c, to easily handle the workpiece during the rolling test and to minimize the thermal disturbance on the surface of a workpiece [23]. One thermocouple was located at the center, and three of them were placed as close the surface as possible, i.e., the thermocouples of the surface were located at 1.5 mm from the outer surface. A multi-channel data recorder gathered temperature data during the test with a sampling time of 0.2 s. Because the thermocouples that are embedded in the surface region were easy to burn out during the hot rolling test, each test was repeated three times to ensure reliability and repeatability.
2.2. Numerical Simulation
DEFORM FE commercial software was used in simulating the 3D complex distributions of temperature and strain in both rod and plate. The roll for rolling process was considered as a rigid body, and the workpiece was assumed to be isotropic material. The basic equation governing the temperature distribution of a workpiece during hot rolling is represented as follows:
where ρ, Cp, k, and Q are the density, specific heat capacity, thermal conductivity of a workpiece, and volumetric rate of heat generation arising from the plastic deformation, respectively. Thermal properties of a workpiece such as thermal conductivity and specific heat were chosen from the library data provided by DEFORM FE software. That is, k and ρCp values were approximately 31 W·m−1K−1 and 4.3 N·mm−2K−1, respectively. To solve the above governing equation, the boundary conditions for a workpiece are expressed as follows:
where ε, σ, Ta, and TR are emissivity, Stefan–Boltzmann constant, ambient temperature, and roll temperature, respectively. Ambient and roll temperature is 25 °C, and ε is assumed to be 0.7. hconv and hcond are the convective heat transfer coefficient and conductive heat transfer coefficient, respectively, which is discussed in the next section. The shear friction coefficient of 0.6 was selected in the roll-workpiece interface [10,25,26], and other process parameters were identical to the experimental conditions, as given in Figure 4 and Table 1.
To shorten the calculation time, the quarter of full geometry was modeled stemming from the symmetrical condition of the rod and plate rolling processes, and a section of 500 mm in length was simulated. The caliber rolls had 400 mm in diameter, and the rolling speed was set as 10 RPM. The brick-type mesh was used, and the total number of mesh elements in the workpiece was approximately 21,600.
3. Results
3.1. Measured Temperature of a Workpiece with Area
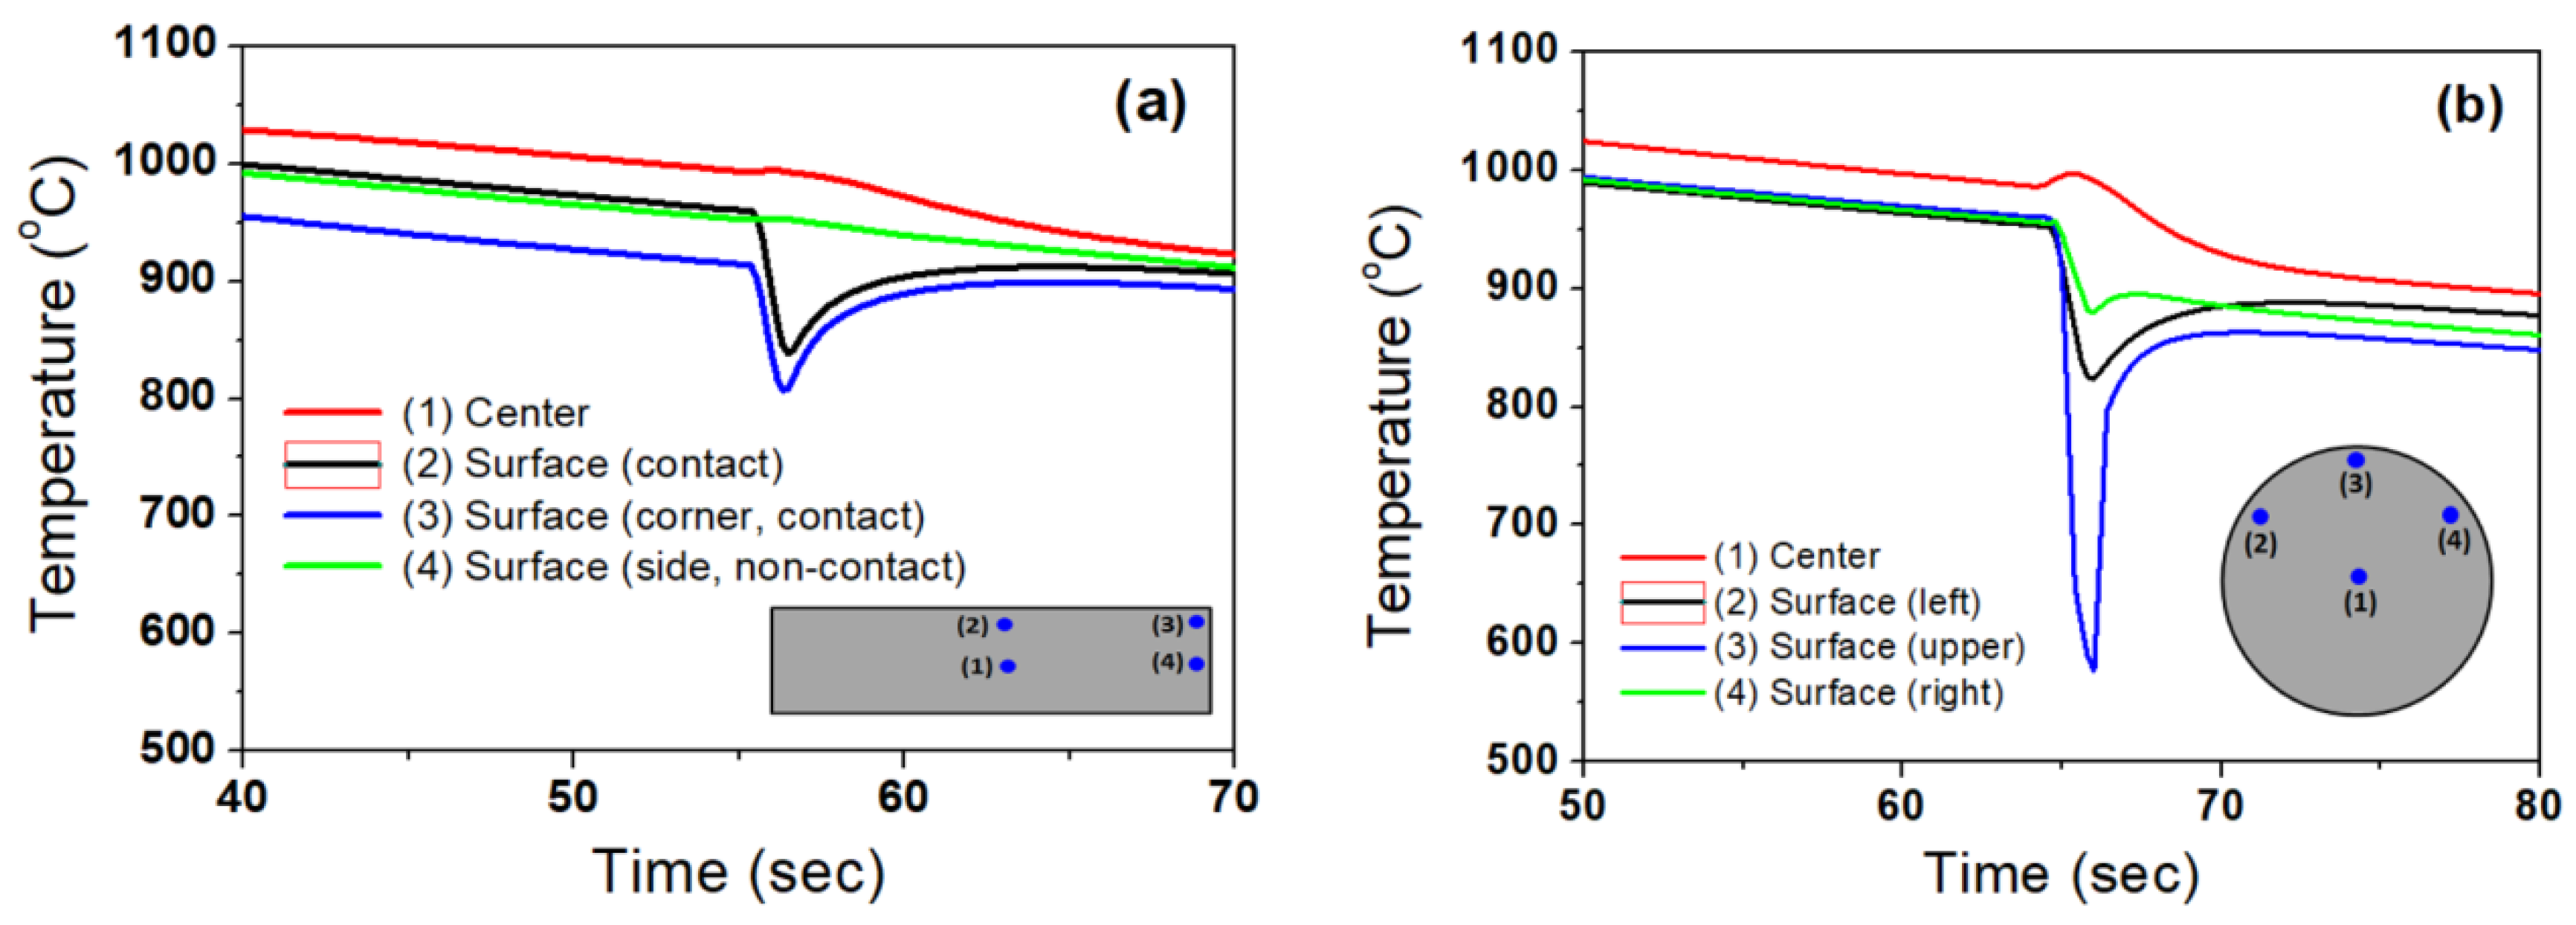
Figure 5a represents the measured temperature profiles of the plate with area during flat rolling. Temperature of all the surface areas decreased when the plate was extracted from the reheating furnace; in particular, the temperature of corner area decreased fast due to the higher radiation heat transfer. In contrast, the surface areas were cooled slowly compared to the corner area, stemming from their geometric condition of the radiation heat transfer, i.e., flat plane. The center area of the plate was cooled slowly because the size of the initial workpiece was relatively large. When the workpiece was contacted with the cold roll, the upper surface and corner areas of the plate cooled very sharply due to the higher conduction heat transfer between the roll and plate. On the other hand, the non-contact surface, i.e., side, was cooled slowly because no conduction heat transfer occurred between the roll and plate in this area. Meanwhile, the temperature of the center slightly increased due to the heat generation by the plastic deformation. After passing through the rolling section, the temperatures of all the areas were equalized due to the higher thermal conductivity of the workpiece. That is, the center area with a higher temperature acted as a heat source for the surface areas with a lower temperature.
Figure 5b shows the temperature profiles of the rod with area during shape rolling, i.e., round-oval pass. The upper surface area, i.e., the hard contact surface, was cooled very fast. In other words, the lowest temperature of the rod was lower than 600 °C. This was a very surprising result considering the location of thermocouple in the surface—the surface indicated 1.5 mm from the outer surface. It is reasonable to induce that the temperature of the outer hard contact surface could be dropped below 500 °C. This low temperature at the rod surface was very different from the result of the plate during flat rolling, which is discussed in the next section. Ideally, the surface area at the right side had a similar temperature profile to the surface area at the left side, but they had somewhat different temperature profiles because the rod may not have rolled symmetrically in this study. That is, the temperature discrepancy between the right side surface and left side surface can be attributed to the error in alignment of a workpiece during the shape rolling process, which is frequently observed in an industrial rod rolling process. All the surface temperatures were recovered after rolling, owing to the redistribution of heat within the rod. Meanwhile, the center temperature of the rod increased when the rod passed through the roll bite, which was the result of the heat generation by plastic work. It is worth noting that the rod exhibited a higher temperature rise compared to the plate at the center area during the rolling process.
On the basis of the comparison study of temperature profiles of the plate and rod with area, it was found that the temperature profiles were very different between the two rolling processes. The rod had a higher temperature deviation with area in comparison with the plate. In particular, the surface temperature of the rod was very different along the circumferential direction during shape rolling. For instance, the temperature of the outer surface could be dropped below 500 °C at the hard contact area of the rod with rolls, which can make different microstructures and mechanical properties among surface areas [2,27]. Furthermore, it could induce surface defects of a rod during shape rolling, i.e., surface flaws [1,28], abnormal grain growths [29], decarburizations, and martensite transformations in the surface area. Accordingly, it is necessary to analyze the rod temperature for at least the following four regions in order to fully understand the thermal behavior of the rod during hot shape rolling: center, hard contact surface, soft contact surface, and non-contact surface. This means that the 1D or 2D approaches, which are generally used in plate rolling, were insufficient to describe the thermal behaviors of a rod during shape rolling. Overall, the center area had the maximum temperature in the both processes, and the minimum temperature appeared in the corner area during plate rolling and in the hard roll contact area during shape rolling.
3.2. Temperature Distribution of Workpiece by Numerical Simulation
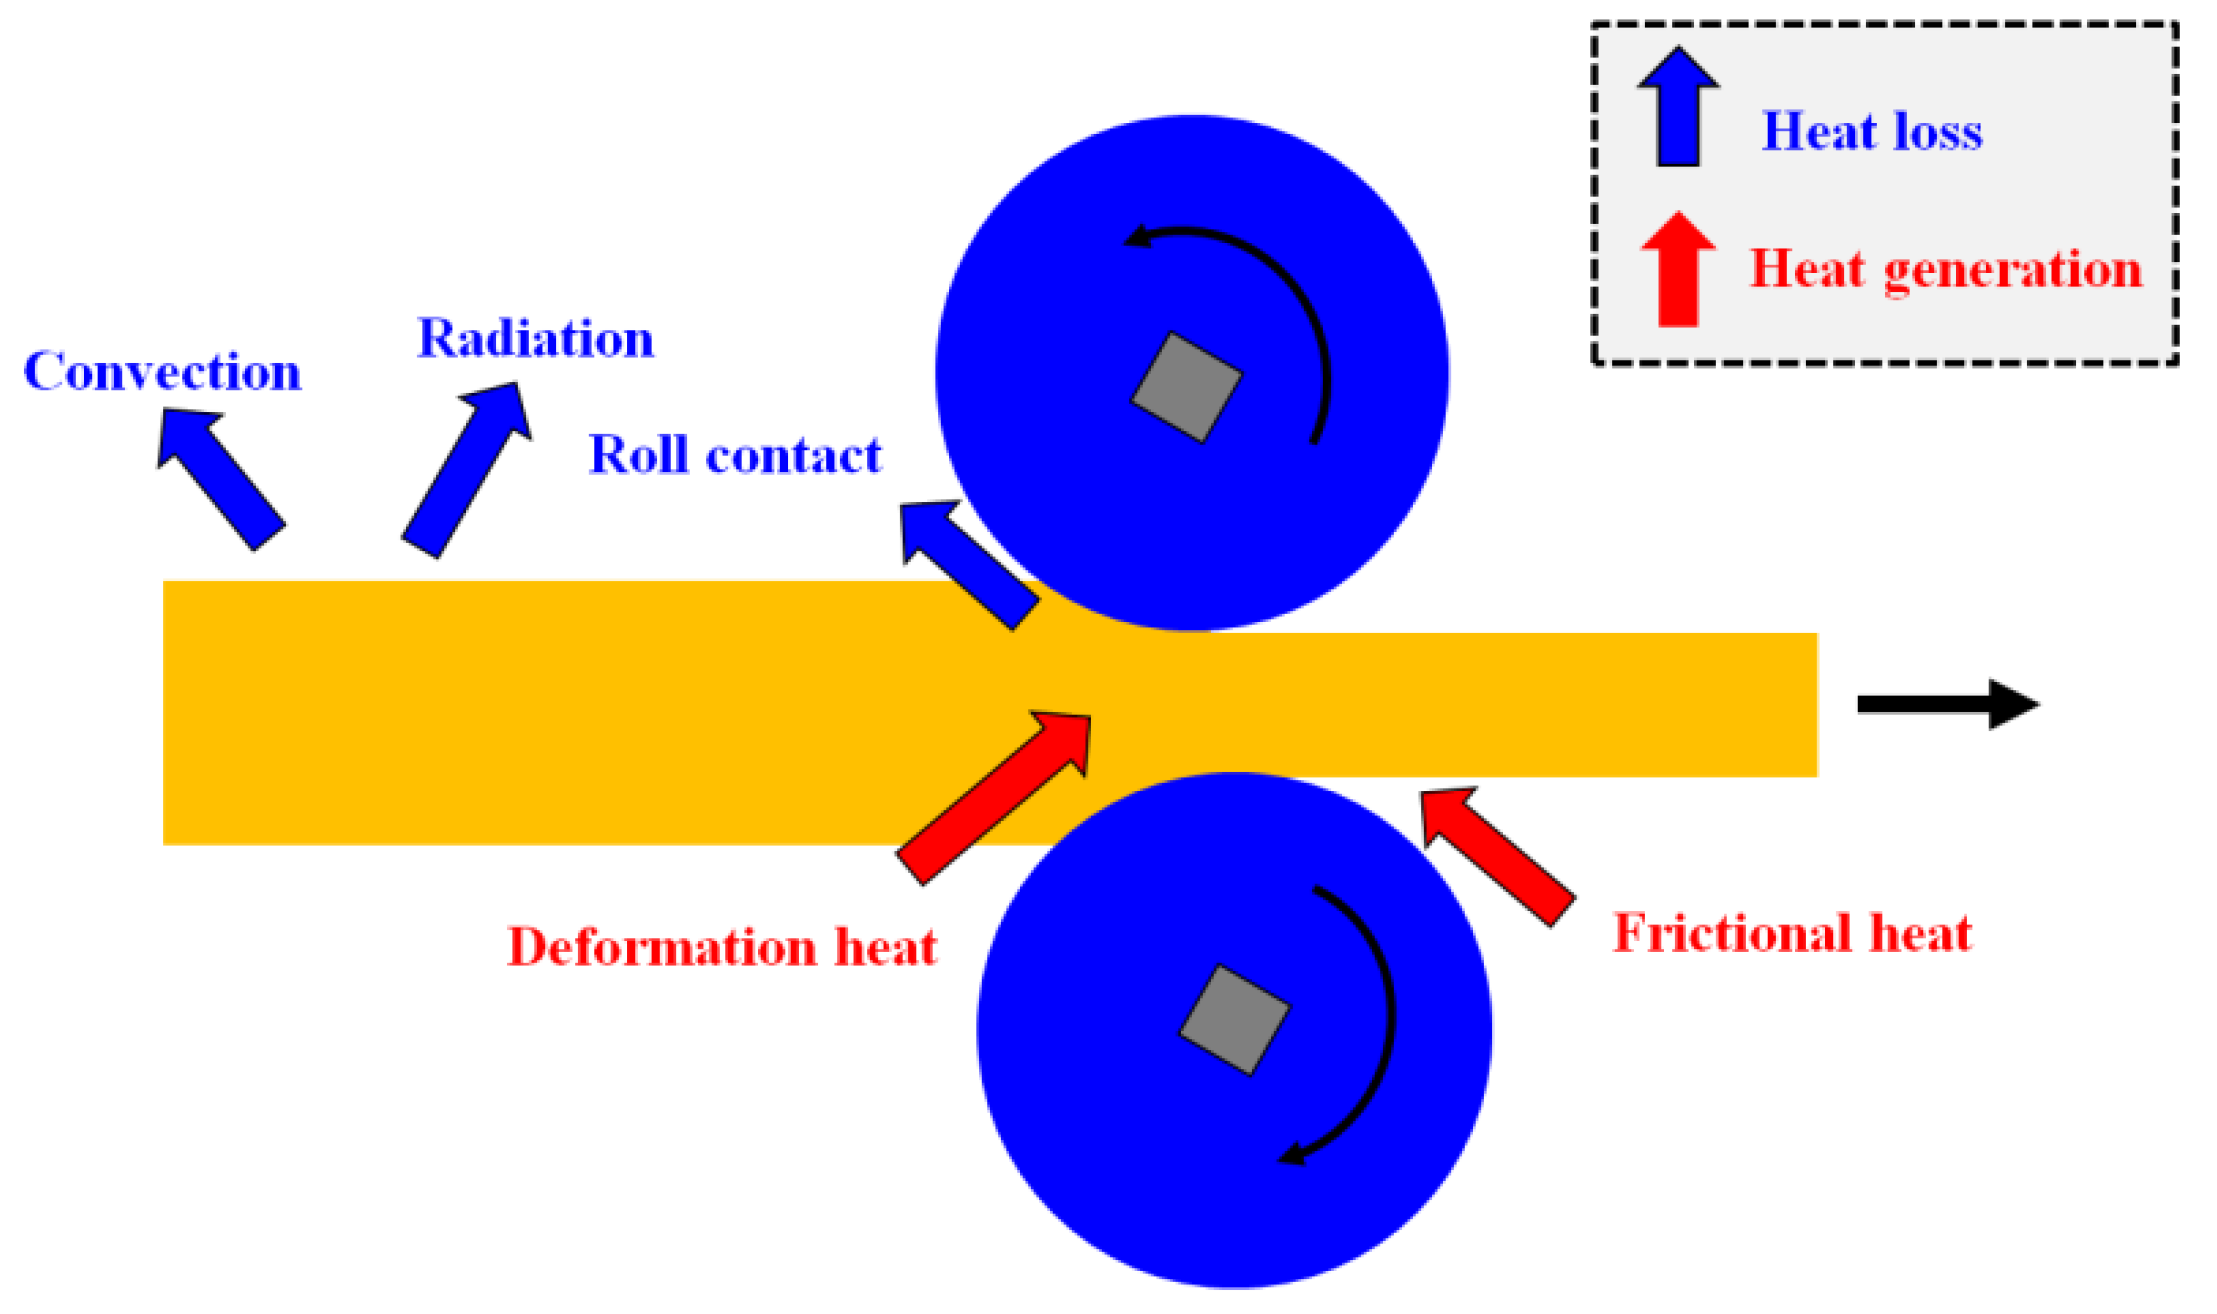
To have more useful information on the thermal behavior of the rod during shape rolling, a numerical simulation was conducted. During the hot rolling process, heat is transferred with several mechanisms as shown in Figure 6, which is summarized as follows:
(i) The heat of a workpiece is dissipated by radiation because the temperature of the workpiece is relatively high during the hot rolling process, for instance, 800–1200 °C.
(ii) Forced convection heat transfer takes the heat from a workpiece because the workpiece moves during the hot rolling process. Additionally, the workpiece loses the heat by natural convection heat transfer via the derived air flow originated from the density difference of air between the surface of a workpiece and ambient.
(iii) The contact between the hot workpiece and cold rolls makes a strong conduction heat transfer; therefore, the surface area of a workpiece is chilled in a very short time as the workpiece contacts the rolls.
(iv) Heat is generated in the deformation zone, i.e., roll bite zone, due to the plastic deformation.
(v) Frictional stress between workpiece and roll produces heat.
All the heat transfer mechanisms need to be carefully considered to understand the thermal behavior of a workpiece and to improve the prediction accuracy of temperature in a workpiece. It is well known that heat transfer coefficient is dependent on several process parameters such as rolling speed, reduction ratio, lubrication condition, surface roughness of workpiece and roll, size and shape of a workpiece, and roll shape, which is the main reason why several researchers have used different values of parameter to simulate the hot rolling process, as summarized in Table 2. In this study, because the author was interested in the temperature distribution of plate and rod in the roll bite, the temperature near the roll bite was simulated during plate rolling and rod rolling. The contact heat transfer coefficient of 24 kW·m−2K−1 was chosen to simulate the temperature distribution of both rod and plate, owing to the similar roll shape and process conditions in reference [2]. It should be noted that the rod and plate had a different heat transfer coefficient because of the different roll shape. However, it is difficult to find the optimum heat transfer coefficients of the two processes due to the limited experiments in this study. Accordingly, the same heat transfer coefficient was chosen for the two processes on the basis of the literature review (Table 2), and then the thermal behavior of the two processes was qualitatively compared.
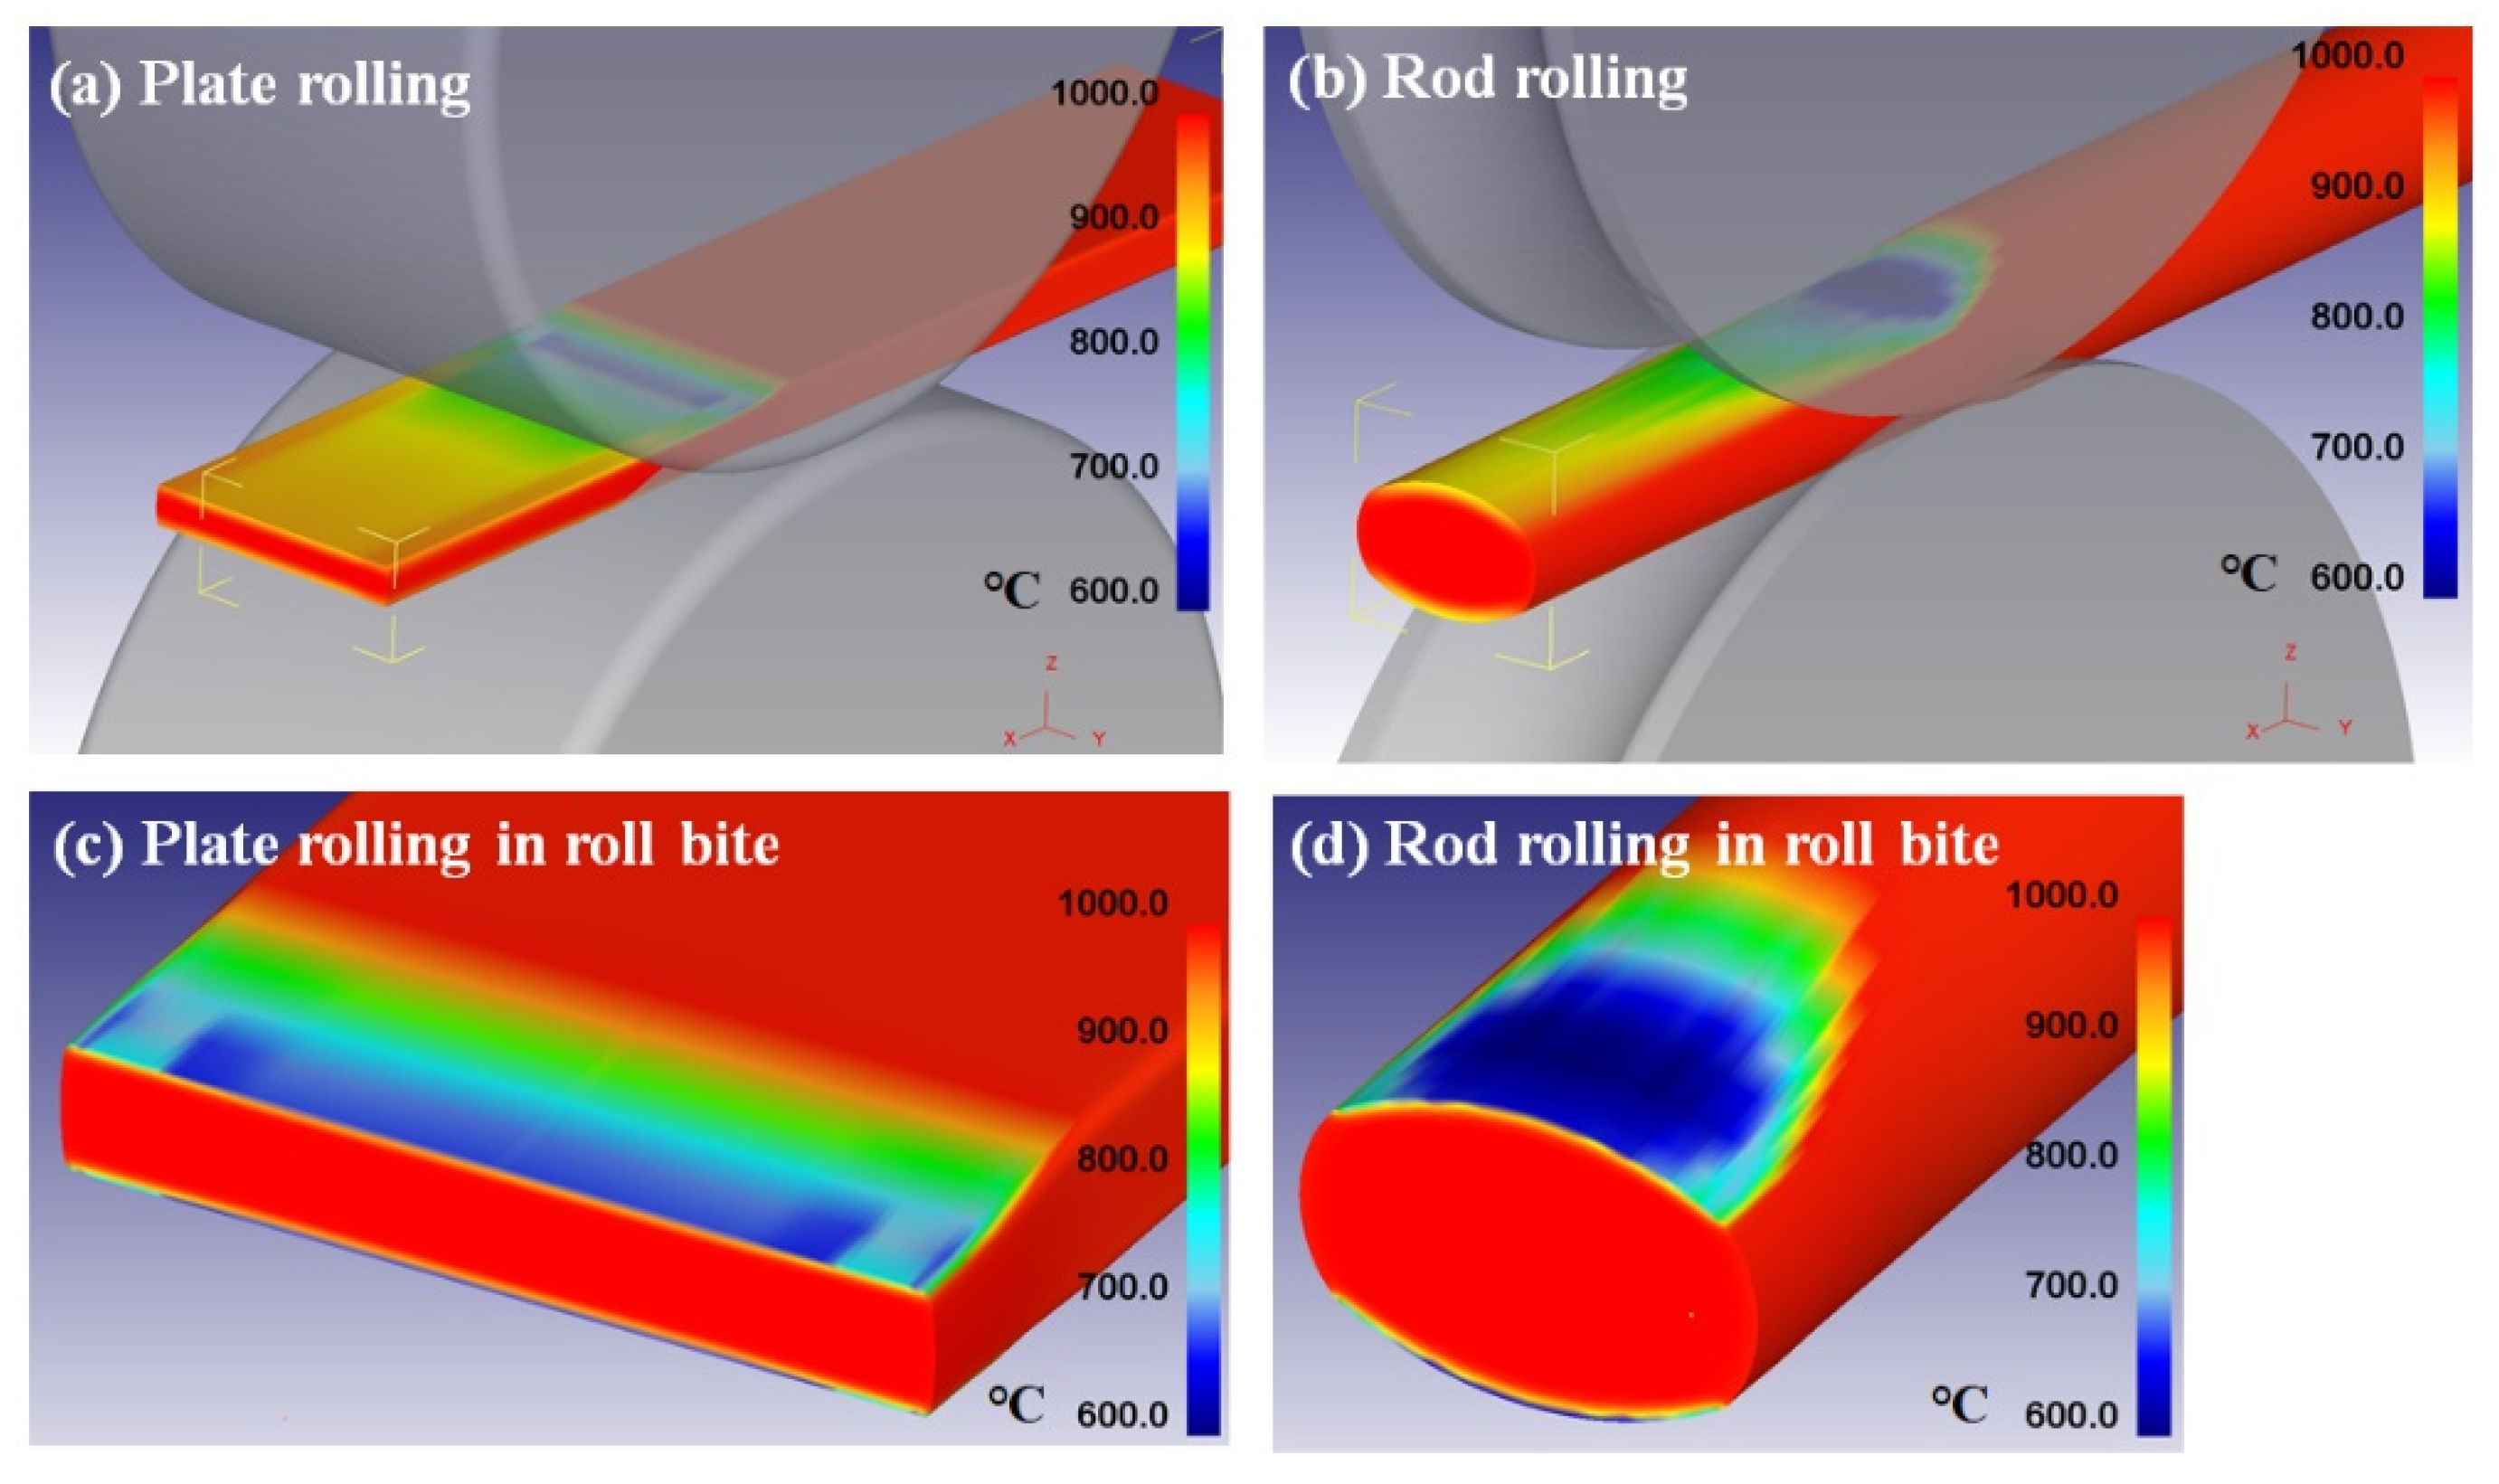
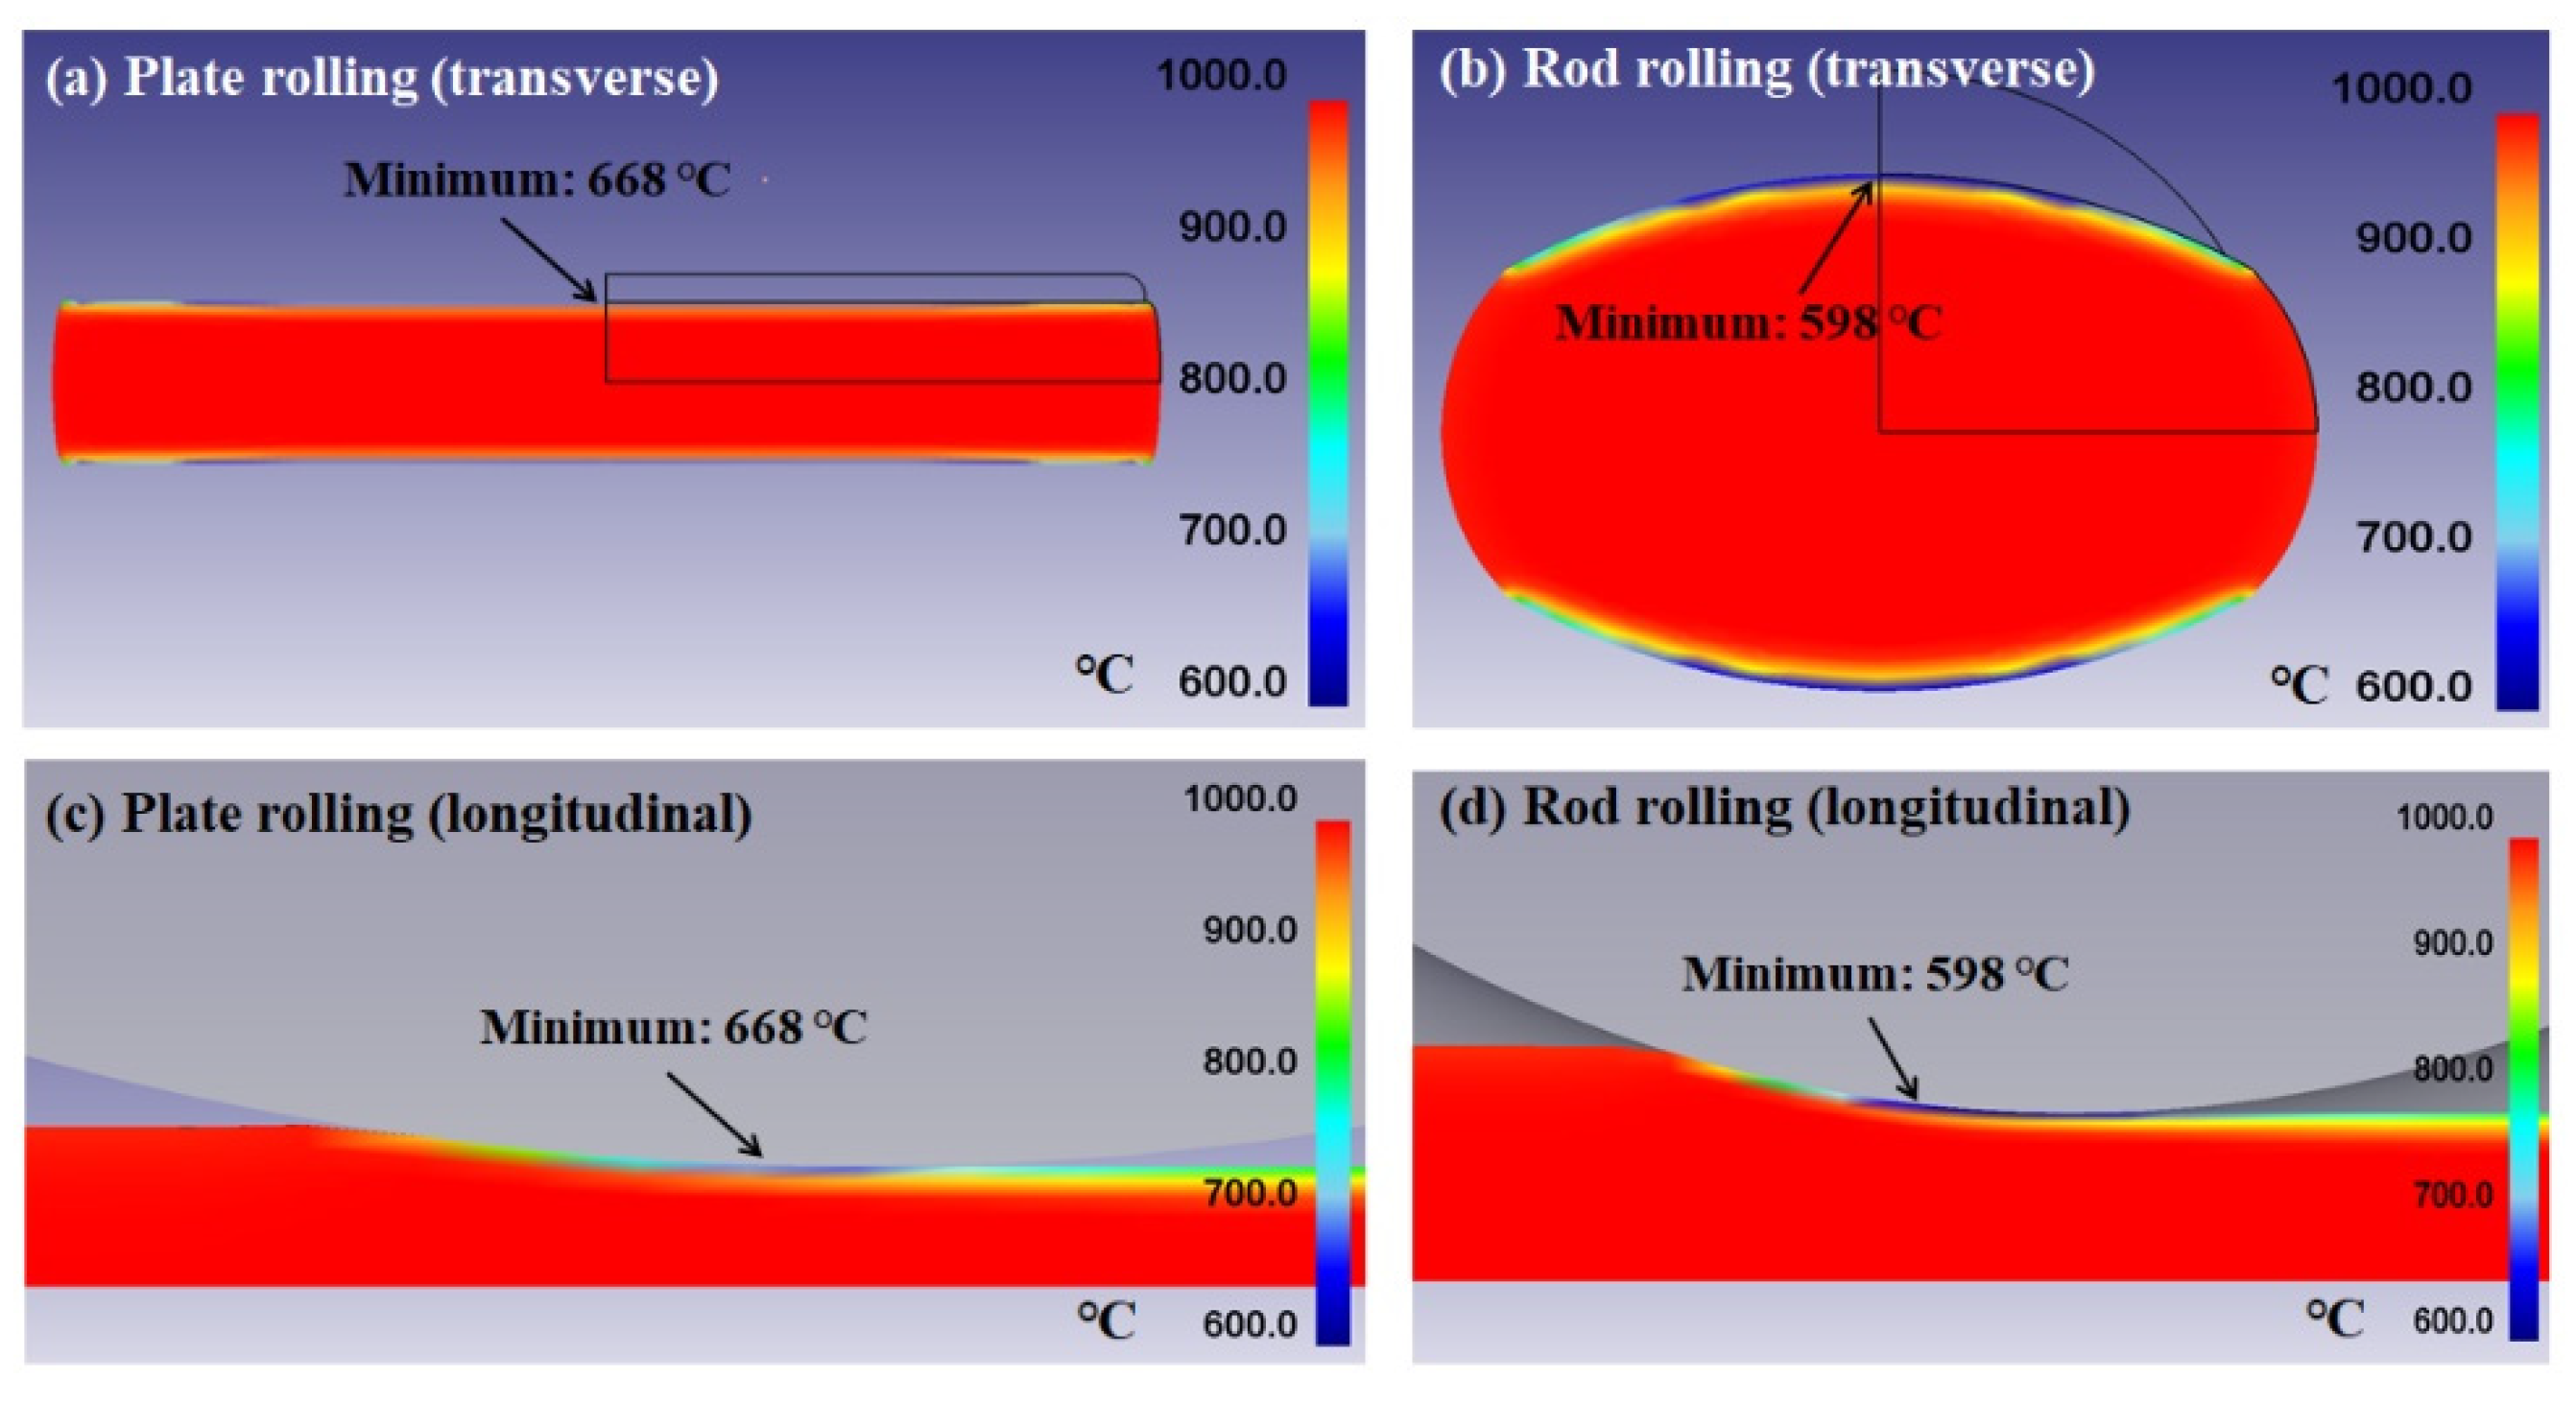
Figure 7 shows the temperature distribution of the rolled workpieces calculated by the FE numerical analysis. Temperature was varied with rolling process and area. The center area had the highest temperature and the surface area tended to have the lowest temperature during hot rolling, which is consistent with the measured temperature profiles using thermocouples (Figure 5). In both rolling processes, the hard contact surface area with roll had the lowest temperature due to the high conduction heat transfer by roll contact, whereas the center area had the highest temperature originating from the relatively small heat loss during hot rolling process. The surface temperature was different between the plate and rod. The upper surface and lower surface of the plate had similar temperatures, whereas the rod had a temperature variation along the circumferential direction of the surface area. For more detailed information, the temperature distribution in the cross section of the rolled workpiece near the roll bite is presented in Figure 8. It is clear that the surface of the rod had a different temperature along the circumferential direction, which meant that the hard contact surface and soft contact surface with rolls experienced different thermal histories. The maximum temperature was similar between the two processes, but the minimum temperature was different in plate and rod—the minimum temperature of the plate was 668 °C, and that of the rod was 598 °C. Therefore, the temperature difference of the rod with area was higher than that of the plate, which is consistent with the result of measured temperature profiles using thermocouples. However, the deviation in temperature between the results of simulation and experiment was in existence. For instance, the surface temperature of the rod was estimated at 500 °C on the basis of the experiment, but the surface temperature of the rod was 598 °C from the numerical simulation, which was closely related to the selected heat transfer coefficient for the numerical simulation. That is, the heat transfer coefficient in this rolling condition was higher than the selected value of 24 kW·m−2K−1.
4. Discussion
The most interesting point of the present study is the fact that the rod rolling process caused higher temperature deviation of the rod with area in comparison with the plate rolling. In particular, the rolled rod experienced very low temperature at the surface area.
4.1. Effect of Conduction Heat Transfer in the Workpiece-roll Interface
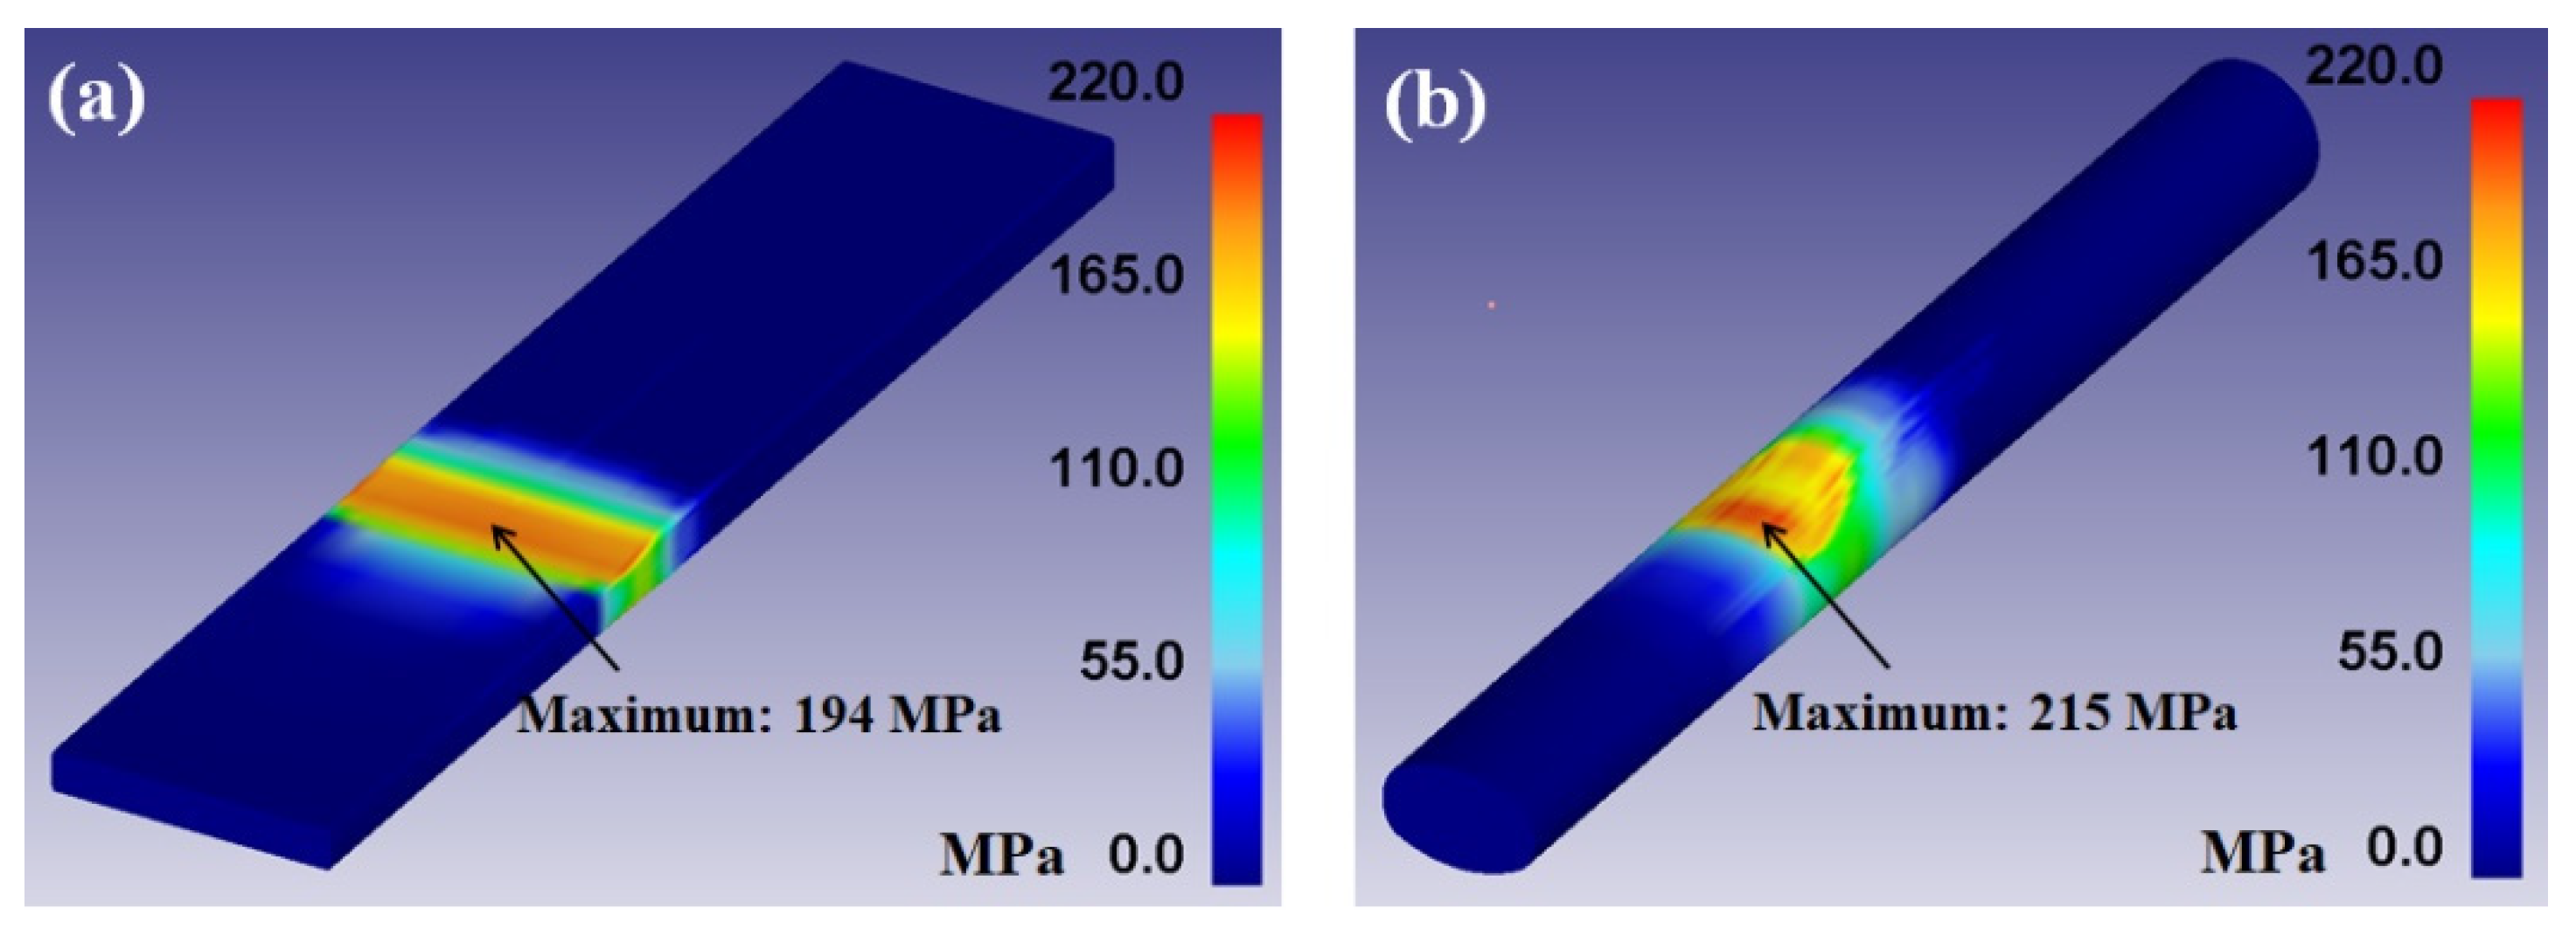
It is well known that the conduction heat transfer between the cold roll and hot workpiece is proportional to the contact pressure [8,37]. That is, the heat transfer coefficient by the roll contact increased along the arc of roll contact and reached the steady-state maximum values, and then decreased until the separation of the workpiece and roll [7]. Figure 9 shows the distribution of effective stress during plate and rod rolling processes. The plate had a uniform distribution of effective stress in the surface area. In contrast, the rod exhibited an inhomogeneous distribution of effective stress on the surface area—the upper surface area had the maximum value, and the effective stress gradually decreased along the circumferential direction from the upper surface. This different behavior of effective stress on the surface area between flat rolling and shape rolling made a different contact heat transfer coefficient between the two processes, leading to the different thermal history. In other words, the higher contact pressure in the upper surface of the rod during shape rolling led to the higher temperature drop in the upper surface area and the inhomogeneous temperature distribution along the circumferential direction of the rod. It is worth mentioning that the contact heat transfer coefficient also depended on rolling speed [7], reduction ratio [9], scale formation on the surface [35], and lubrication condition [7,36]. However, the effect of roll shape was only considered in this study because the other process parameters were set as identical in the two processes.
4.2. Effect of Heat Generation due to Plastic Deformation
The heat generation by the plastic deformation during rolling process affects the thermal behavior of a workpiece, which means that the temperature distribution of workpiece depends on the strain distribution of a workpiece with area. The temperature rise by plastic deformation was typically described as the following equation [38]:
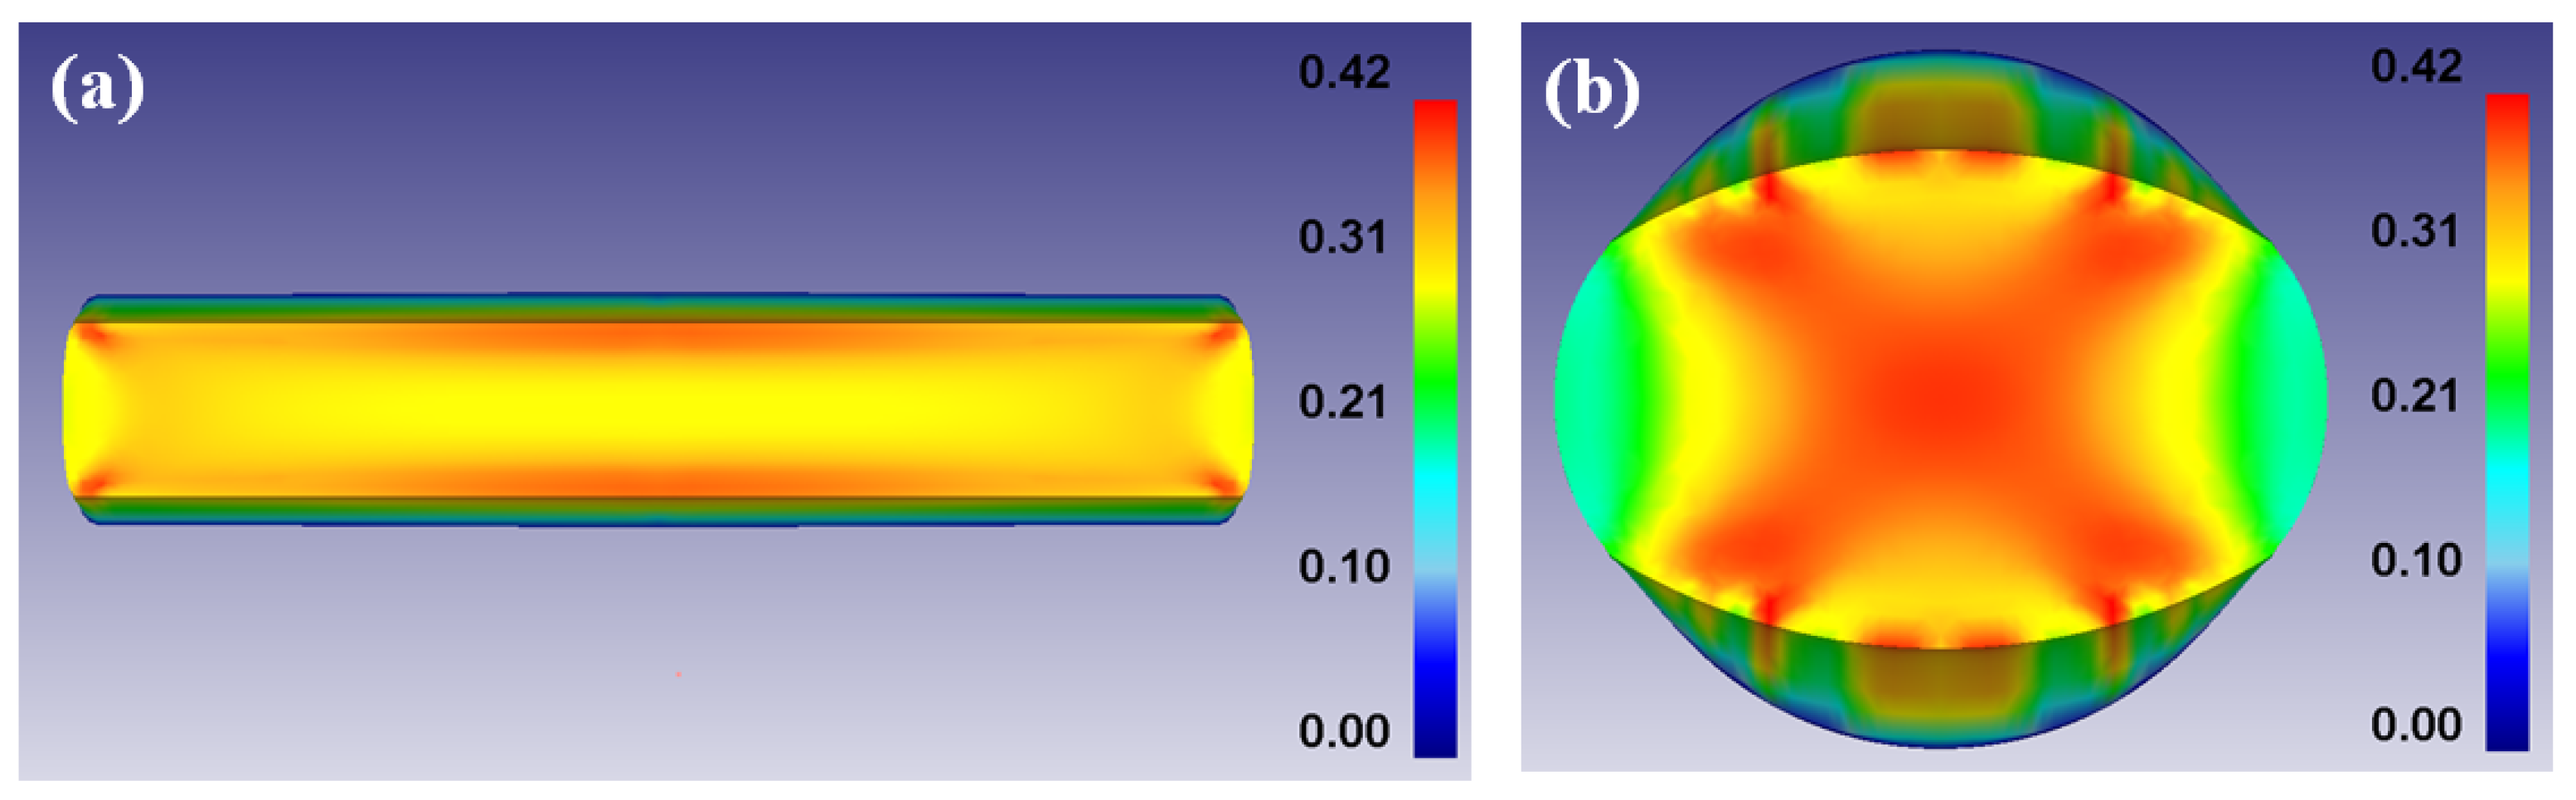
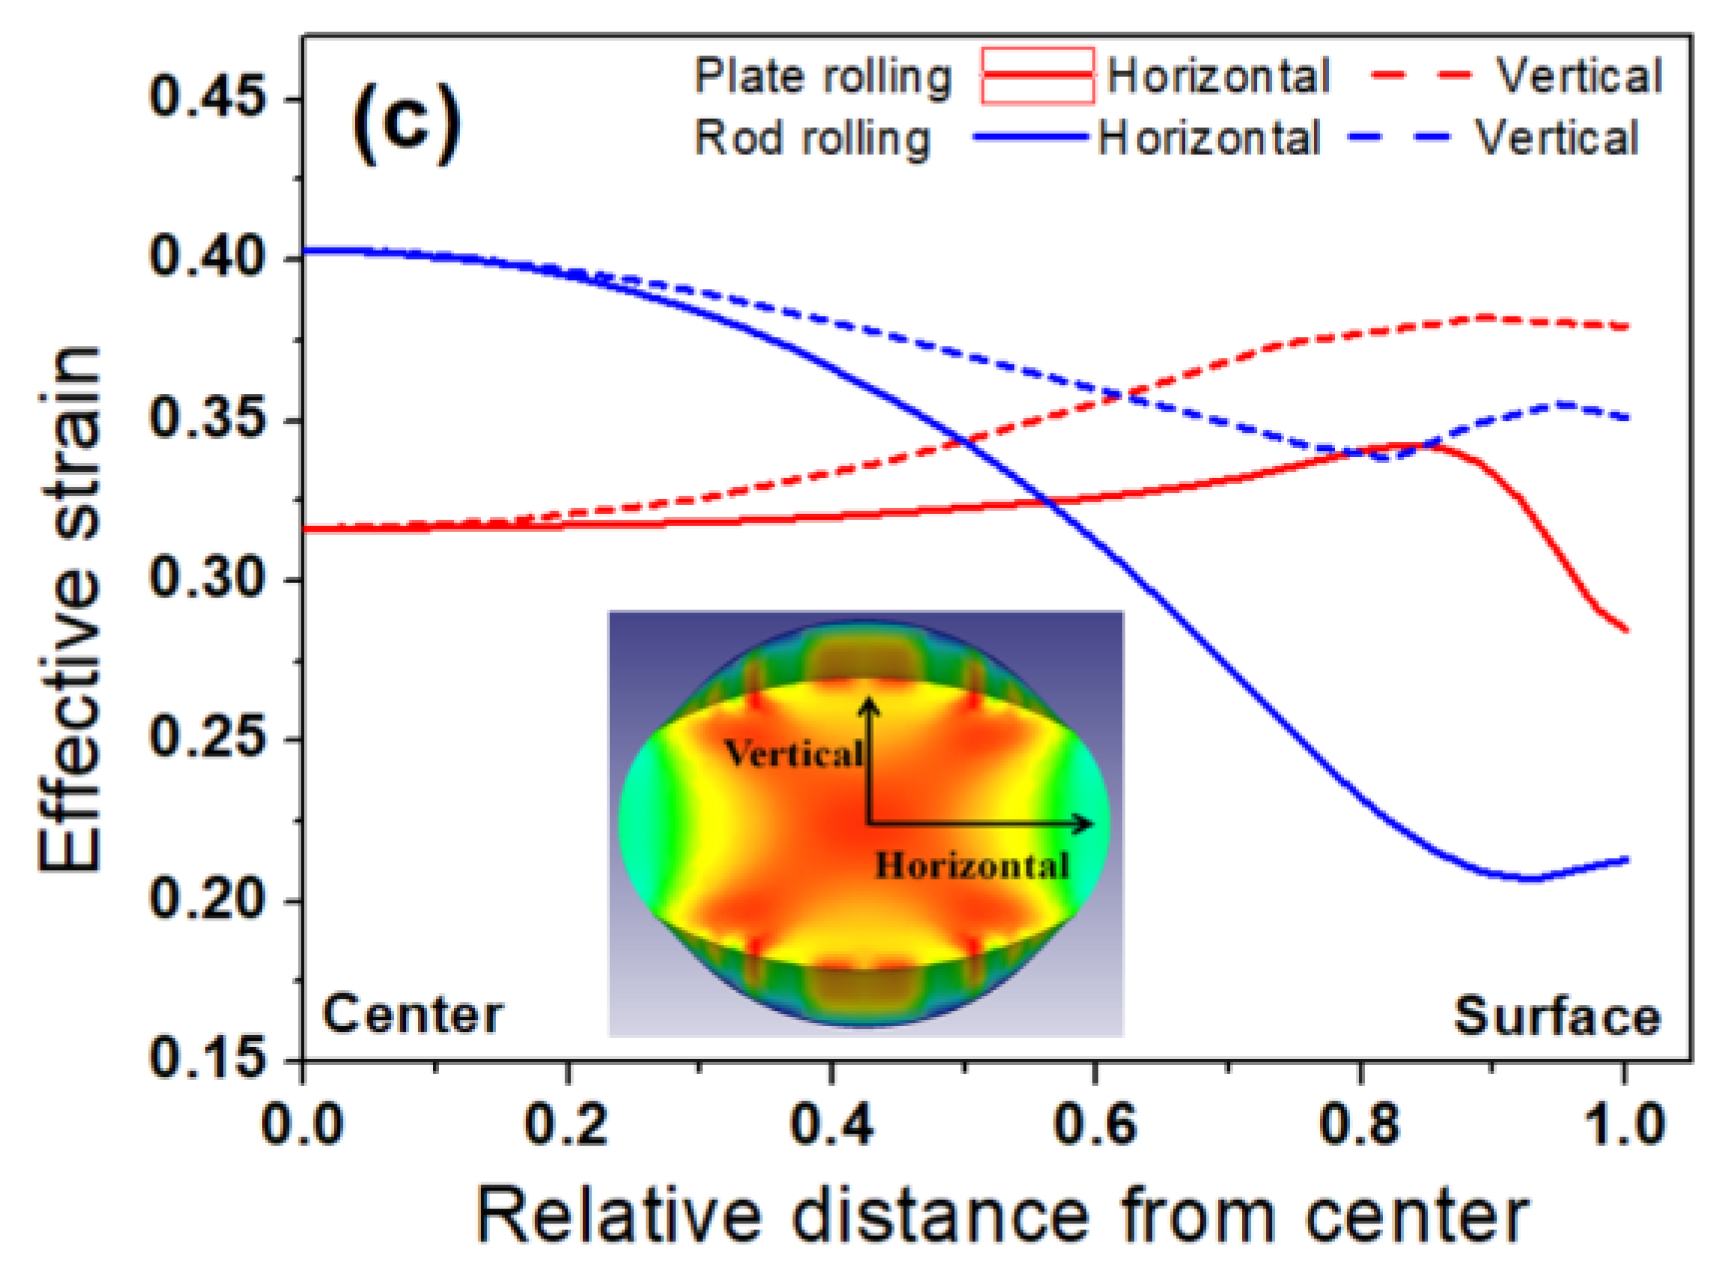
where β and ΔT are the fraction coefficient between deformation work and heat energy and temperature rise, respectively. As given in Table 2, the fraction of deformation energy converted to heat energy is generally assumed to be 0.9 because only a small amount of deformation energy is stored within the workpiece as elastic energy. Because the temperature rise of a workpiece is highly related to the amount of plastic deformation according to Equation (7), the effective strain distribution of both plate and rod was evaluated, as shown in Figure 10a,b. It was clearly shown that the strain distribution of the plate was more homogeneous than that of the rod. Additionally, the pattern of effective strain distribution was totally different between the two processes. In the plate, the surface area had the maximum strain value and the center area had the minimum [39]. On the other hand, the center area had the maximum strain and the surface area had the minimum during shape rolling, which was well described in the profiles of effective strain along the horizontal and vertical directions of the two processes (Figure 10c). The higher effective strain in the center area of the rod during shape rolling can make a higher temperature rise in the center area, as shown in Figure 5b. Meanwhile, the relatively lower effective strain in the center area of the plate during flat rolling induced the lower temperature rise in the center area (Figure 5a). Comparing the distribution of effective strain in the plate, the rod had a higher temperature deviation with area because the temperature rise in the center area of the rod was higher than that of the plate. Overall, the center temperature of the rod became higher by the temperature rise due to the higher plastic deformation, whereas the surface temperature of the rod became lower by the hard contact with roll. This can make a higher temperature deviation of the rod with area during the shape rolling process. In contrast, strain distribution of the plate during flat rolling contributed to the uniformity of temperature distribution of the plate with area because the surface area had a higher effective strain during the flat rolling process.
The frictional stress in the roll–workpiece interface also increased temperature of a workpiece during the forming process, and the amount of temperature rise can be different between the two processes. Further experiments are necessary to reveal the frictional effect on temperature rise with rolling process, which is one of the valuable research topics in the field of forming industries. Overall, the higher temperature deviation of the rod along the circumferential and radial directions can induce the surface defects such as surface flaw, abnormal grain growth, and decarburization during the shape rolling process. In contrast, the influence of temperature deviation of the plate on surface defects is relatively weak during the flat rolling process.
5. Conclusions
On the basis of the comparative studies on the temperature distribution of a workpiece during hot plate rolling and rod rolling via an off-line simulator and numerical simulation, the following major conclusions were drawn:
1. The temperature distribution of the rod during shape rolling is different from that of the plate during flat rolling. The temperature deviation of the rod with area during shape rolling is much higher in comparison with the plate during flat rolling.
2. The measured temperature at the hard contact surface of the rod with roll is lower than 600 °C, whereas that of the plate is approximately 800 °C.
3. The higher variation in effective stress of the rod along the circumferential direction can induce the higher temperature difference with area of the rod compared to the plate during flat rolling.
4. The heat generation by the plastic deformation during forming process also increases the temperature deviation of the rod with area compared to the plate—higher effective strain at the center area of rod raises the temperature at center area of the rod. In contrast, strain distribution of the plate during flat rolling contributes to the uniformity of temperature distribution of the plate with area.
Funding
This work was supported by the National Research Foundation of Korea (NRF) grant, funded by the Korean government (MSIT) (NRF-2018R1D1A1B07050103).
Conflicts of Interest
The author declares no conflict of interest.
References
- Kwon, H.C.; Lee, H.W.; Kim, H.Y.; Im, Y.T.; Park, H.D.; Lee, D.L. Surface wrinkle defect of carbon steel in the hot bar rolling process. J. Mater. Process. Technol. 2009, 209, 4476–4483. [Google Scholar] [CrossRef]
- Lee, H.W.; Kwon, H.C.; Im, Y.T.; Hodgson, P.D.; Zahiri, S.H. Local austenite grain size distribution in hot bar rolling of AISI 4135 steel. ISIJ Int. 2005, 45, 706–712. [Google Scholar] [CrossRef] [Green Version]
- Laasraoui, A.; Jonas, J.J. Prediction of temperature distribution, flow stress and microstructure during the multipass hot rolling of steel plate and strip. ISIJ Int. 1991, 31, 95–105. [Google Scholar] [CrossRef] [Green Version]
- Nioi, M.; Pinna, C.; Celotto, S.; Swart, E.; Farrugia, D.; Husain, Z.; Ghadbeigi, H. Finite element modelling of surface defect evolution during hot rolling of Silicon steel. J. Mater. Process. Technol. 2019, 268, 181–191. [Google Scholar] [CrossRef]
- Li, Y.; Cao, J.; Qiu, L.; Kong, N.; He, A.; Zhou, Y. Effect of strip edge temperature drop of electrical steel on profile and flatness during hot rolling process. Adv. Mech. Eng. 2019, 11, 1–11. [Google Scholar] [CrossRef] [Green Version]
- Pesin, A.; Pustovoytov, D. Research of edge defect formation in plate rolling by finite element method. J. Mater. Process. Technol. 2015, 220, 96–106. [Google Scholar] [CrossRef]
- Devadas, C.; Samarasekera, I.V.; Hawbolt, E.B. The thermal and metallurgical state of steel strip during hot rolling: Part 1. Characterization of heat transfer. Metall. Trans. A 1991, 22A, 307–319. [Google Scholar] [CrossRef]
- Chen, W.C.; Samarasekera, I.V.; Hawbolt, E.B. Fundamental phenomena governing heat transfer during rolling. Metall. Trans. A 1993, 24A, 1307–1320. [Google Scholar] [CrossRef]
- Chen, B.K.; Thomson, P.F.; Choi, S.K. Temperature distribution in the roll-gap during hot flat rolling. J. Mater. Process. Technol. 1992, 30, 115–130. [Google Scholar] [CrossRef]
- Serajzadeh, S.; Taheri, A.K.; Nejati, M.; Izadi, J.; Fattahi, M. An investigation on strain inhomogeneity in hot strip rolling process. J. Mater. Process. Technol. 2002, 128, 88–99. [Google Scholar] [CrossRef]
- Karagiozis, A.N.; Lenard, J.G. Temperature distribution in a slab during hot rolling. J. Eng. Mater. Technol. 1988, 110, 17–21. [Google Scholar] [CrossRef]
- Hlady, C.O.; Brimacombe, J.K.; Samarasekera, I.V.; Hawbolt, E.B. Heat transfer in the hot rolling of metals. Metall. Mater. Trans. B 1995, 26B, 1019–1027. [Google Scholar] [CrossRef]
- Shirizly, A.; Lenard, J.G. The effect of scaling and emulsion delivery on heat transfer during the hot rolling of steel strips. J. Mater. Process. Technol. 2000, 101, 250–259. [Google Scholar] [CrossRef]
- Komori, K.; Kato, K. Analysis of temperature distribution in caliber rolling of a bar. JSME Int. J. 1989, 32, 208–216. [Google Scholar] [CrossRef] [Green Version]
- Said, A.; Lenard, J.G.; Ragab, A.R.; Abo Elkhier, M. The temperature, roll force and roll torque during hot bar rolling. J. Mater. Process. Technol. 1999, 88, 147–153. [Google Scholar] [CrossRef]
- Yuan, S.Y.; Zhang, L.W.; Liao, S.L.; Jiang, G.D.; Yu, Y.S.; Qi, M. Simulation of deformation and temperature in multi-pass continuous rolling by three-dimensional FEM. J. Mater. Process. Technol. 2009, 209, 2760–2766. [Google Scholar] [CrossRef]
- Xue, J.; Liu, M. A new control volume-based 2D method for calculating the temperature distribution of rod during multi-pass hot rolling. ISIJ Int. 2013, 53, 1836–1840. [Google Scholar] [CrossRef] [Green Version]
- Serajzadeh, S.; Mirbagheri, H.; Taheri, A.K. Modelling the temperature distribution and microstructural changes during hot rod rolling of a low carbon steel. J. Mater. Process. Technol. 2002, 125, 89–96. [Google Scholar] [CrossRef]
- Serajzadeh, S. Prediction of microstructural changes during hot rod rolling. Int. J. Mach. Tools Manuf. 2003, 43, 1487–1495. [Google Scholar] [CrossRef]
- Choi, S.; Lee, Y. An approach to predict the depth of the decarburized ferrite layer of spring steel based on measured temperature history of material during cooling. ISIJ Int. 2014, 54, 1682–1689. [Google Scholar] [CrossRef] [Green Version]
- Hwang, J.K. Effects of process conditions, material properties, and initial shape of flaw on the deformation behavior of surface flaw during wire drawing. ISIJ Int. 2019, 59, 2052–2061. [Google Scholar] [CrossRef]
- Kim, H.Y.; Kwon, H.C.; Lee, H.W.; Im, Y.T.; Byon, S.M.; Park, H.D. Processing map approach for surface defect prediction in the hot bar rolling. J. Mater. Process. Technol. 2008, 205, 70–80. [Google Scholar] [CrossRef]
- Hwang, J.K. The temperature distribution and underlying cooling mechanism of steel wire rod in the Stelmor type cooling process. Appl. Therm. Eng. 2018, 142, 311–320. [Google Scholar] [CrossRef]
- Lee, Y.; Kim, H.J.; Hwnag, S.M. Analytic model for the prediction of mean effective strain in rod rolling process. J. Mater. Process. Technol. 2001, 114, 129–138. [Google Scholar] [CrossRef]
- Kwon, H.C.; Lee, Y.; Kim, S.Y.; Woo, J.S.; Im, Y.T. Numerical prediction of austenite grain size in round-oval-round bar rolling. ISIJ Int. 2003, 43, 676–683. [Google Scholar] [CrossRef] [Green Version]
- Awais, M.; Lee, H.W.; Im, Y.T.; Kwon, H.C.; Byon, S.M.; Park, H.D. Plastic work approach for surface defect prediction in the hot bar rolling process. J. Mater. Process. Technol. 2008, 201, 73–78. [Google Scholar] [CrossRef]
- Bontcheva, N.; Petzov, G. Total simulation model of the thermo-mechanical process in shape rolling of steel rods. Comput. Mater. Sci. 2005, 34, 377–388. [Google Scholar] [CrossRef]
- Son, I.H.; Lee, J.D.; Choi, S.; Lee, D.L.; Im, Y.T. Deformation behavior of the surface defects of low carbon steel in wire rod rolling. J. Mater. Process. Technol. 2008, 201, 91–96. [Google Scholar] [CrossRef]
- Ochiai, I.; Ohba, H.; Hida, Y.; Nagumo, M. Effect of precipitation behavior of AlN on abnormal growth of ferrite grains in low-carbon steel wires. Tetsu-to-Hagane 1984, 70, 2001–2008. [Google Scholar] [CrossRef] [Green Version]
- Na, D.H.; Lee, Y. A study to predict the creation of surface defects on material and suppress them in caliber rolling process. Int. J. Precis. Eng. Manuf. 2013, 14, 1727–1734. [Google Scholar] [CrossRef]
- Nalawade, R.S.; Puranik, A.J.; Balachandran, G.; Mahadik, K.N.; Balasubramanian, V. Simulation of hot rolling deformation at intermediate passed and its industrial validity. Int. J. Mech. Sci. 2013, 77, 8–16. [Google Scholar] [CrossRef]
- Kim, S.Y.; Im, Y.T. Three-dimensional finite element analysis of non-isothermal shape rolling. J. Mater. Process. Technol. 2002, 127, 57–63. [Google Scholar] [CrossRef]
- Bagheripoor, M.; Bisadi, H. Effects of rolling parameters on temperature distribution in the hot rolling of alumimum strips. Appl. Therm. Eng. 2011, 31, 1556–1565. [Google Scholar] [CrossRef]
- Zhou, S.X. An integrated model for hot rolling of steel strips. J. Mater. Process. Technol. 2003, 134, 338–351. [Google Scholar] [CrossRef]
- Li, Y.H.; Sellars, C.M. Comparative investigations of interfacial heat transfer behaviour during hot forging and rolling of steel with oxide scale formation. J. Mater. Process. Technol. 1998, 80, 282–286. [Google Scholar] [CrossRef]
- Wu, J.; Liang, X.; Tang, A.; Pan, F. Interfacial heat transfer under mixed lubrication condition for metal rolling: A theoretical calculation study. Appl. Therm. Eng. 2016, 106, 1002–1009. [Google Scholar] [CrossRef]
- Malinowski, Z.; Lenard, J.G.; Davies, M.E. A study of the heat-transfer coefficient as a function of temperature and pressure. J. Mater. Process. Technol. 1994, 41, 125–142. [Google Scholar] [CrossRef]
- Curtze, S.; Kuokkala, V.T. Dependence of tensile deformation behavior of TWIP steels on stacking fault energy, temperature and strain rate. Acta Mater. 2010, 58, 5129–5141. [Google Scholar] [CrossRef]
- Ding, J.; Zhao, Z.; Jiao, Z.; Wang, J. Central infiltrated performance of deformation in ultra-heavy plate rolling with large deformation resistance gradient. Appl. Therm. Eng. 2016, 98, 29–38. [Google Scholar] [CrossRef]
Figure 1.
Schematic description of (a) plate and (b) rod during the rolling processes.

Figure 2.
Thermal image of billet during hot rod rolling using an infrared thermo-camera.

Figure 3.
Schematic description of the off-line hot rolling simulator in this study.

Figure 4.
Schematic description showing the roll design and the measurement points of temperature using thermocouples: (a) cross section of flat rolling, (b) cross section of rod rolling, and (c) cross section of the longitudinal direction of the rod.
Figure 4.
Schematic description showing the roll design and the measurement points of temperature using thermocouples: (a) cross section of flat rolling, (b) cross section of rod rolling, and (c) cross section of the longitudinal direction of the rod.


Figure 5.
Measured temperature profiles of (a) the plate during flat rolling and (b) the rod during shape rolling with area.
Figure 5.
Measured temperature profiles of (a) the plate during flat rolling and (b) the rod during shape rolling with area.

Figure 6.
Schematic description showing the heat transfer mechanisms in a workpiece during the hot rolling process.
Figure 6.
Schematic description showing the heat transfer mechanisms in a workpiece during the hot rolling process.

Figure 7.
Comparison of contour maps of temperature during plate rolling and rod rolling.

Figure 8.
Comparison of contour maps of temperature in the roll bite during plate rolling and rod rolling.
Figure 8.
Comparison of contour maps of temperature in the roll bite during plate rolling and rod rolling.

Figure 9.
Contour maps of effective stress of (a) plate and (b) rod during the hot rolling process.

Figure 10.
Contour maps of effective strain of (a) plate, (b) rod, and (c) comparison of profiles of effective strain along the horizontal and vertical directions of a workpiece.
Figure 10.
Contour maps of effective strain of (a) plate, (b) rod, and (c) comparison of profiles of effective strain along the horizontal and vertical directions of a workpiece.


Table 1.
Process parameters of hot rolling test using the off-line simulator in this experiment.
| Parameters | Value | |
|---|---|---|
| Workpiece | Material | AISI 1020 |
| Initial temperature of workpiece | 1150 °C | |
| Rolling mill | Rolling speed | 10 RPM |
| Roll diameter | 400 mm | |
| Temperature of roll | 21 °C | |
| Process conditions | Reduction ratio of height of plate | 25.5% |
| RA per pass of rod | 20.2% | |
| Surrounding temperature | 21 °C |
Table 2.
Process parameters and values for heat transfer during the hot rolling process.
| Contact Conduction (kWm−2K−1) | Convection (Wm−2K−1) | Ratio of Mechanical Work to Heat | Rolling Type | Reference |
|---|---|---|---|---|
| 5 | 10 | - | Shape rolling | [30] |
| 10 | 10 | - | Shape rolling | [31] |
| 24 | 2.33 | 0.9 | Round-oval | [2] |
| 72 | 2.33 | 0.9 | Square-diamond | [2] |
| 4.8 | 30 | - | Shape rolling | [32] |
| 40 | 10 | - | Flat rolling | [33] |
| 45–85 | - | 0.85–0.95 | Flat rolling | [10] |
| 54–71 | - | - | Flat rolling | [34] |
| 7.6–17.6 | - | - | Flat rolling | [35] |
| 20–45 | Flat rolling | [36] |
© 2020 by the author. Licensee MDPI, Basel, Switzerland. This article is an open access article distributed under the terms and conditions of the Creative Commons Attribution (CC BY) license (http://creativecommons.org/licenses/by/4.0/).
Share and Cite
MDPI and ACS Style
Hwang, J.-K. Thermal Behavior of a Rod during Hot Shape Rolling and Its Comparison with a Plate during Flat Rolling. Processes 2020, 8, 327. https://0-doi-org.brum.beds.ac.uk/10.3390/pr8030327
AMA Style
Hwang J-K. Thermal Behavior of a Rod during Hot Shape Rolling and Its Comparison with a Plate during Flat Rolling. Processes. 2020; 8(3):327. https://0-doi-org.brum.beds.ac.uk/10.3390/pr8030327
Chicago/Turabian StyleHwang, Joong-Ki. 2020. "Thermal Behavior of a Rod during Hot Shape Rolling and Its Comparison with a Plate during Flat Rolling" Processes 8, no. 3: 327. https://0-doi-org.brum.beds.ac.uk/10.3390/pr8030327
Note that from the first issue of 2016, this journal uses article numbers instead of page numbers. See further details here.