Article

Tetracycline Induces the Formation of Biofilm of Bacteria from Different Phases of Wastewater Treatment

by
Tereza Stachurová
1,*,
Kateřina Malachová
1,
Jaroslav Semerád
2,3,
Meta Sterniša
4,
Zuzana Rybková
1 and
Sonja Smole Možina
4
1
Department of Biology and Ecology, Faculty of Science, University of Ostrava, Chittussiho 10, CZ-710 00 Ostrava, Czech Republic
2
Institute of Microbiology of the Czech Academy of Sciences, Vídeňská 1083, CZ-142 20 Prague 4, Czech Republic
3
Institute for Environmental Studies, Faculty of Science, Charles University, Benátská 2, CZ-128 01 Prague 2, Czech Republic
4
Department of Food Science and Technology, Biotechnical Faculty, University of Ljubljana, Jamnikarjeva 101, SI-1000 Ljubljana, Slovenia
*
Author to whom correspondence should be addressed.
Submission received: 26 July 2020 / Revised: 9 August 2020 / Accepted: 10 August 2020 / Published: 14 August 2020
(This article belongs to the Special Issue Application of Microorganisms in Wastewater Treatment)

Abstract

:
The study monitored the effect of tetracycline on bacterial biofilm formation and compared biofilm formation by resistant bacterial strains in different phases of the wastewater treatment process in wastewater treatment plant (WWTP). The crystal violet staining method was used to evaluate the biofilm formation. Biofilm-related bacterial properties were characterized by hydrophobicity, autoaggregation and motility tests. The relative abundance of tetracycline resistance genes (tetW, tetM, tetO, tetA and tetB) in wastewaters were subsequently quantified using qPCR. The results show that the isolates from the nitrification tank produce biofilm with up to 10 times greater intensity relative to the isolates from the sedimentation tank. In isolates of Aeromonas sp. from the nitrification tank, increased biofilm production in the occurrence of tetracycline from a concentration of 0.03125 µg/mL was observed. The tetW gene showed the highest relative abundance out of all the tested genes. From the sampling points, its abundance was the highest in the sedimentation tank of the WWTP. Based on these results, it can be assumed that resistant bacteria are able to form a biofilm and sub-inhibitory tetracycline concentrations induce biofilm formation. WWTPs thus represent a reservoir of antibiotic resistance genes and contribute to the spread of resistance in the natural environment.

Graphical Abstract

1. Introduction

Wastewater treatment plants (WWTPs) are known to be important sources of antibiotic resistance bacteria (ARB) and antibiotic resistance genes (ARGs). ARGs and ARB are continuously released into the environment and can transfer antibiotic resistance to susceptible microorganisms [1]. WWTP treatment processes are ideal environments for the development and spread of antibiotic resistance because a large number of bacteria are constantly exposed to antibiotics in low concentrations [2].
There are many microorganisms present in the wastewater, such as bacteria, viruses, protozoa or fungi [3]. Some bacteria are significant for the spread of resistance. A study on the spread of antibiotic resistance has shown strains that become multi-resistant, such as Acinetobacter spp., Aeromonas spp. and Pseudomonas spp. [4,5]. These are embodied in the microbial communities in municipal WWTPs and should receive special attention [6]. For example, an increase in antibiotic resistant Acinetobacter spp. in WWTPs was shown by Zhang et al. (2009) [7]. Studies, which usually focus on antibiotic resistance in the aquatic environment, have addressed wastewater or drinking water, but do not reflect the situation in biofilms. These play an important part as a reservoir for ARGs and could be considered biological indicators of antibiotic resistance pollution [8,9].
Biofilms are complex, massively packaged multicellular communities of microorganisms affixed to a base from a produced polymeric matrix consisting in particular of lipids, proteins, polysaccharides, extracellular DNA and water [10]. Bacteria in biofilms are defined by genetic and physiological differentiation and increased resistance to detrimental environmental influences including xenobiotics and toxic compounds [11]. Since the cells are inserted in a self-produced polymeric matrix, biofilms are extremely resistant to antibiotics. Biofilm cells are characterized by greater genetic transformation frequencies than planktonic cells. Biofilms survive in the presence of concentrations of antibiotics 102–104 times larger than the minimum inhibitory concentration (MIC) in comparison with the planktonic bacteria of the same species [12]. Previous studies have shown that bacterial strains of Thauera, Comamonas, Azonexus, Simplicispira and other genera are capable to produce a biofilm on the walls of the sewers [13,14].
In this work, special attention was paid to bacterial resistance to tetracycline antibiotics. Tetracycline antibiotics are one of the most important groups of antibiotics used in veterinary and human medicine [15]. Tetracyclines have a broad spectrum of activity against Gram-positive and Gram-negative bacteria, therefore they are widely used. Tetracyclines can be excreted incompletely from the body, that is why they are potentially dangerous for the environment [16]. Due to their extensive use, tetracycline antibiotics have been detected in the terrestrial and aquatic environments: groundwater, surface waters, wastewater, municipal sewage, soil and sediments [17,18,19]. As tetracycline residues can enter the food chain secondarily from water and soil, they represent a great environmental burden [20].
For those reasons, WWTPs are apparently unable to remove the tetracycline antibiotics effectively [21]. Deblonde et al. (2011) have detected residual concentrations of tetracycline up to 2.37 μg/L in the effluents of WWTPs [22]. Kulkarni et al. (2017) have detected tetracycline concentration of up to 23.6 ng/mL in effluent samples from the WWTP in the USA [23]. There are reliable studies on the relationship between the occurrence of residual concentrations of tetracycline antibiotics and the antibiotic resistance microorganisms [24]. Tetracycline antibiotics promote the proliferation of antibiotic resistant microorganisms, which can cause a major public health problem. Biofilms represent the huge ARG reservoir in the aquatic environment and play an important part in the ARG exchange [25]. The protective mechanisms of biofilms are responsible for the resistance, which is related to the presence of antibiotic resistance genes in bacterial genomes or extrachromosomal elements. The result is an overall increased resistance of biofilms to antimicrobial compounds [26]. Salcedo et al. (2014) have observed that sub-inhibitory concentrations of tetracycline and cephradine induce biofilm formation and enhance the transfer rate of pB10 plasmid among the biofilm biomass (in E. coli and P. aeruginosa strains) at 2–5 times faster rates in comparison with no antibiotic treatment [12]. Many studies have shown that bacteria in biofilms frequently exchange ARGs [25,26]. For example, Zhang et al. (2009) have found that tet genes migrate rapidly to biofilms where they persist longer than in adjacent waters [7].
The aim of our study was first to determine the presence of tetracycline antibiotic and tet ARGs in wastewater from nitrification and sedimentation tanks of WWTP and to isolate tetracycline-resistant bacteria. Afterwards, these bacteria were characterized (enzyme activity, aggregation, hydrophobicity, motility and growth) and their biofilm capacity in the growth medium and in sterilized wastewater was determined. For selected strains, we performed a molecular identification, determined their susceptibility to tetracycline, evaluated the influence of sub-inhibitory tetracycline concentration on the biofilm formation and determined tet ARGs.

2. Materials and Methods
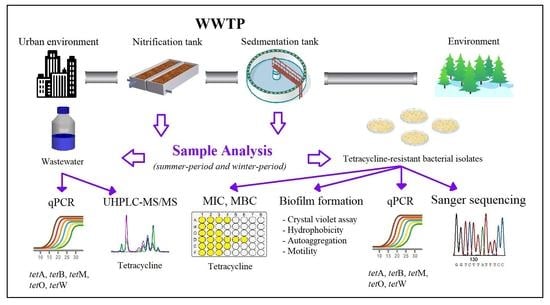
2.1. Sampling Sites

Wastewater samples were collected in June 2018 and December 2018 from the nitrification and sedimentation tanks of the urban WWTP. The wastewaters were mixed samples from five different sampling points of each tank. The final effluent is discharged into the Odra river in the Moravian-Silesian Region of the Czech Republic. The wastewater treatment at this plant includes mechanical treatment, chemical treatment, biological treatment and secondary sedimentation. The population equivalent (PE) of the WWTP is 638,850 inhabitants. The influent consists of mixtures of municipal and industrial wastewaters. The biochemical oxygen demand (BOD) of the inflow is 208 mg/L and the outflow is 14.7 mg/L. The daily peak flow is 2134 L/s and the cleaning effect is 92.9%. A volume of 2 L of each sample was collected in sterilized plastic containers and transported to the laboratory.

2.2. Determination of Tetracycline Content in Wastewater

The tetracycline content in wastewater samples collected in the nitrification and sedimentation tanks of the WWTP was analyzed by ultra-performance liquid chromatography, combined with triple quadrupole mass spectrometry (UHPLC-MS/MS). The samples (1 L) were processed and analyzed as described in Svobodová et al. (2018) [27]. The detection limit for antibiotic was 0.05 ng/L.

2.3. DNA Extraction and Quantification of ARGs in Wastewater

For the DNA extraction, wastewater samples (six replicates for each sample) were filtered (0.22 µm pore size membrane filters, Pall Corporation, Mexico City, Mexico, USA) and filters were stored at −80 °C until use. As for the nitrification tank wastewater, 10 mL were filtered, but in case of the sedimentation tank wastewater, the sample volume had to be increased to 100 mL to obtain a sufficient amount of DNA. The filters were incubated overnight with a suspension of 1 M CaCO3 and the DNA was extracted according to Stach et al. (2001) [28]. The concentration and purity of the DNA samples were measured with the Nanophotometer P300 (IMPLEN, BioTech, Munich, Germany) (Supplementary Table S1). The DNA samples were stored at −20 °C until use.
The tetracycline resistance genes tetA, tetB, tetM, tetO and tetW were quantified in the bacterial DNA samples using primers the qPCR method summarized in Supplementary Table S2. The primer sequences were taken from previous studies [29,30,31]. For the reaction mixtures, 18 µL Xceed qPCR SG 2x Mix Lo-ROX (Institute of Applied Biotechnologies, Prague, Czech Republic) and 2 µL DNA were used. The gene quantities were normalized against the content of the 16S rDNA gene in the samples.
Standard curves were generated from ten-fold serial dilutions of pMOS plasmids containing the target fragments of ARGs and 16S rDNA. For each PCR assay, the PCR amplification efficiency (E) was calculated using the standard curve according to the equation:
E = 10 ( 1 s l o p e ) 1 × ( 100 %   e f f i c i e n c y = 1 )

2.4. Isolation of Bacterial Strains Resistant to Tetracycline

The plating of the wastewater samples was carried out within 1 day after the sampling. The resistant bacteria isolates growing on tryptic soy agar (TSA, Biolife, Milano, Italy) supplemented with 0.02 µg/mL tetracycline (Fluka BioChemika, Buchs, China). Isolates were randomly selected. A total of 40 isolates were tested, 10 from each group designated as: NT-W (nitrification tank, winter-period), ST-W (sedimentation tank, winter-period), NT-S (nitrification tank, summer-period) and ST-S (sedimentation tank, summer-period). Bacterial isolates were Gram stained.

2.5. Characterization of Bacterial Strains

2.5.1. Growth Conditions and Standardized Inoculum Preparation

Bacterial isolates were preserved in tryptic soy broth (TSB, Biolife, Milano, Italy) with 10% glycerol (Kemika, Zagreb, Croatia) as frozen stock at −80 °C. Subsequently, the bacterial isolates for all tests were revitalised on TSA by overnight incubation at 30 °C and inoculated in TSB, where they grew overnight at 30 °C (incubator; SP109; Kambič, Semič, Slovenia). A standardized inoculum was prepared from an overnight culture to obtain a final concentration of 4.7–5.2 log CFU/mL. The inoculum was prepared in TSB or sterilized wastewater from nitrification and sedimentation tanks.

2.5.2. Enzymatic Activity

A lecithinase activity was detected on nutrient agar (500 mL) (BioLife, Italy) supplemented with egg yolk emulsion (25 mL) (BioLife, Italy). Plates were incubated at 30 °C for 24 h. The formation of a white precipitate around or beneath the inoculum spot revealed lecithinase formation [32]. A lipase activity was detected on plates with Tween. Plates (peptone (10 g/L), NaCl (5 g/L), agar (15 g/L) and Tween 80 (10 g/L) were incubated at 30 °C for 24 h. The lipase activity was observed by the appearance of a turbid halo around the inoculation [33]. A haemolytic activity was determined using blood agar plates (Blood Agar, Oxoid, Hampshire, England). Plates were incubated at 30 °C for 24 h. The haemolytic activity was observed by the appearance of haemolysis zones [34].

2.5.3. Crystal Violet Assay for Determination of Biofilm Formation in TSB

A flat-bottomed 96-well polystyrene microtiter plate (Thermo Scientific Nunc, Waltham, MA, USA) was inoculated with 200 μL standardized inoculum in TSB of each isolate. As a negative control, we used 200 μL of sterile TSB added in eight wells of each microtiter plate. The crystal violet assay has already been described [35,36]. After 24 h incubation at 30 °C, the supernatant was removed from each well and the plate was washed three times with 200 μL of distilled water. The plate was dried at 60 °C for 15 min and dyed with 200 μL of 0.1% crystal violet (CV, Merck, Darmstadt, Germany) 15 min. Then the CV was removed and the plate was washed with 200 μL of distilled water three times again. The plate was dried at 60 °C for 15 min. CV was dissolved by addition of 200 μL 96% ethanol (Merck, Germany) and the plate was mixed at 500 rpm for 5 min. The absorbance was measured at 584 nm on a microplate reader (Varioskan Lux, Thermo Fischer Scientific, Waltham, MA, USA). Biofilm formers were defined: OD584 < 0.1, non-producers (NP); OD584 = 0.1–1.0, weak producers (WP); OD584 = 1.1–3.0, moderate producers (MP); and OD584 > 3.0, strong producers (SP) [37].

2.5.4. Crystal Violet Assay for Determination of Biofilm Formation in Wastewater

A flat-bottomed 96-well polystyrene microtiter plate was inoculated with 200 μL of standardized inoculum in wastewater from nitrification or sedimentation tanks. As a negative control, we used 200 μL of sterile wastewater. The next steps of the crystal violet assay and the definition of biofilm formation capacity were performed as described for the determination of biofilm formation in TSB.

2.5.5. Autoaggregation Test

Autoaggregation was determined according to previous studies [36]. Bacterial cells from overnight culture were centrifuged at 3000 rpm for 5 min, then washed twice and resuspended in Phosphate Buffer Saline (PBS) to obtain a final optical density of 1 at 600 nm. The absorbance of the upper phase of cell suspension was measured at times 0 h, 5 h and 24 h at 600 nm with the microplate reader. Autoaggregation was determined as the autoaggregation percentage (%AA) using the formula:
% A A = [ 1 ( A t / A 0 ) ] × 100
where A0 was the absorbance measured at 0 h and At was the absorbance measured after 5 h or 24 h of the incubation.

2.5.6. Hydrophobicity Test

Bacterial adherence to xylene was determined in a xylene-water system as described by Kurinčič et al. (2016) [35]. Bacteria were cultivated in TSB until the early log growth phase, centrifuged for 5 min at 3000 rpm and washed twice in PBS buffer. The growth curves, according to which the log phases of all tested bacterial isolates were determined, are given in Supplementary Figure S1 and Table S3. The pellet was diluted in PBS to optical density of 1 at 600 nm. 0.5 mL of 12.5% (v/v) p-xylene (Kemika, Zagreb, Croatia) was added to 3.5 mL of the cell suspension and vortexed for 2 min. The suspension was incubated for 20 min at room temperature. The absorbance was measured at 620 nm with a spectrophotometer (Lambda Bio+; Perkin Elmer, Boston, MA, USA). The hydrophobicity was determined as a hydrophobicity percentage (%H) using the formula:
% H = [ 1 ( A / A 0 ) ] × 100
where A0 was the absorbance of the cell suspension (before separation) and A was the absorbance of an aqueous phase after 20 min incubation (after separation). These percentages defined the degree of hydrophobicity as hydrophilic (<20%), moderately hydrophobic (20–50%) and hydrophobic (>50%) [38].

2.5.7. Motility Test

The swimming motility was determined according to O’May and Tufenkji (2011) [39]. A total or 1 μL of bacterial overnight culture was placed in medium with 0.3% (w/v) agar (Biolife, Italy). The zones were measured (in mm) after 24 h at 30 °C. The motility defined as − negative (0 mm); + positive (1–23.3 mm); ++ moderately positive (23.4–46.5 mm); +++ medium positive (46.6–69.9 mm); ++++ strong positive (≥70 mm).

2.6. Microdilution Method–Determination of Tetracycline MIC and MBC for Selected Isolates and the Influence of Sub-Inhibitory Tetracycline Concentrations on Growth and Biofilm Formation

In microtiter plate, 2-fold serial dilutions of tetracycline were prepared and standardized inoculum in TSB was added to the same volume of obtain a final volume of 200 μL and tetracycline concentrations of 0.03125–4 µg/mL. The negative control was TSB; the positive control was a standardized inoculum. The contents of each well were mixed at 650 rpm for 1 min before incubation at 30 °C for 24 h. After incubation, the absorbance was measured at 600 nm and MIC was defined as the lowest concentration at which no change in optical density was observed. To determine the minimal bactericidal concentration (MBC), after the incubation, 10 µL of bacterial suspension was inoculated on TSA and incubated at 30 °C for 24 h. The crystal violet assay described above was used to determine the influence of tetracycline on biofilm formation.

2.7. Identification of Selected Isolates

Two bacterial isolates were selected from each group as per their biofilm production. For identification, the selected bacterial isolates were cultivated in 10 mL of TSB overnight at 30 °C and 100 rpm. Genomic DNA was isolated from the cultures using UltraClean Microbial DNA Isolation Kit (MOBIO Laboratories, Carlsbad, CA, USA) and 16S rDNA gene fragments were amplified using the universal bacterial primers 1378R (5′-CGGTGTGTACAAGGCCCGGGAACG-3′) and 984F (5′-AACGCGAAGAACCTTAC-3′). Amplification started with an initial denaturation at 95 °C for 2 min, followed by 35 cycles of denaturation at 95 °C for 45 s, annealing at 55 °C for 30 s and elongation at 72 °C for 1 min, and the final extension step at 72 °C for 10 min [40]. The PCR products were detected by electrophoresis on an 1% agarose gel in 1xTAE buffer, and gel cleaned. The concentration and purity of the DNA were measured on NanoDrop (NanoPhotometr P300, BioTech, Munich, Germany). Sequencing was carried out by SeqMe s.r.o. (Dobříš, Czech Republic) using primers 1378R and 984F. The sequences were analyzed by the BLASTn program and the closest hits were downloaded from the NCBI database (www.ncbi.nlm.nih.gov/).

2.8. Detection of ARGs of Selected Isolates

Tetracycline resistance genes tetA, tetB, tetM, tetO and tetW were detected in the selected bacterial isolates using primers and the PCR method summarized in Supplementary Table S2. Genomic DNA was isolated from the cultures using UltraClean Microbial DNA Isolation Kit (MOBIO Laboratories, CA, USA). Primer sequences and conditions were taken from previous studies [29,30,31].

2.9. Statistical Analysis

Experiments were performed in a minimum of triplicates, and the data are presented as means ± standard deviation. The Pearson correlation test was used to calculate the correlation between the biofilm formation, autoaggregation, hydrophobicity and motility. p < 0.05 was considered as statistically significant. The Growthcurver package was used to calculate the growth curves of samples. All statistical analyses were executed using the program R (R Core Team, 2016, version 3.4.0).

3. Results and Discussion

3.1. Quantification of Tetracycline in Wastewater

The concentration of the antibiotic tetracycline was determined with UHPLC-MS/MS in wastewater samples from nitrification and sedimentation tanks of the WWTP. Tetracycline was detected by repeated evaluation in the nitrification tank at a mean concentration of 0.945 ± 0.743 ng/L and in the sedimentation tank at a mean concentration of 1.177 ± 0.844 ng/L. Residues of tetracycline from urban and agricultural effluents are frequently detected in surface waters, groundwater, soil and sediments and are generally present at relatively low concentrations (ng or µg per L) [16]. Tetracycline was detected in both tanks, but was higher in the sedimentation tank, which could make this tank a larger generator of the tetracycline resistance. Increased tetracycline concentration in the sedimentation tank was also found in another WWTP in the Czech Republic (unpublished). Kim et al. (2013) found a similar increase in oxytetracycline concentration from the nitrification tank (0.2 ng/L) to the sedimentation tank (1.1 ng/L) of the WWTP [41]. In contrast, Jia et al. (2009) investigated tetracycline in the influent (16.5 ng/L), effluent (1.9 ng/L) and in the river (2.1 ng/L) receiving the treated effluent, in the city of Beijing in China [42]. However, higher values found in the study by Jia et al. (2009) are probably given by the high population density. It is difficult to explain satisfactorily the reasons for certain differences between the various phases of the recipient’s treatment process, but it is evident that the technologies currently used in the WWTPs are not sufficiently efficient at removing most antibiotics. However, the confirmed presence of tetracycline residues in wastewater can increase the resistance load among bacteria.

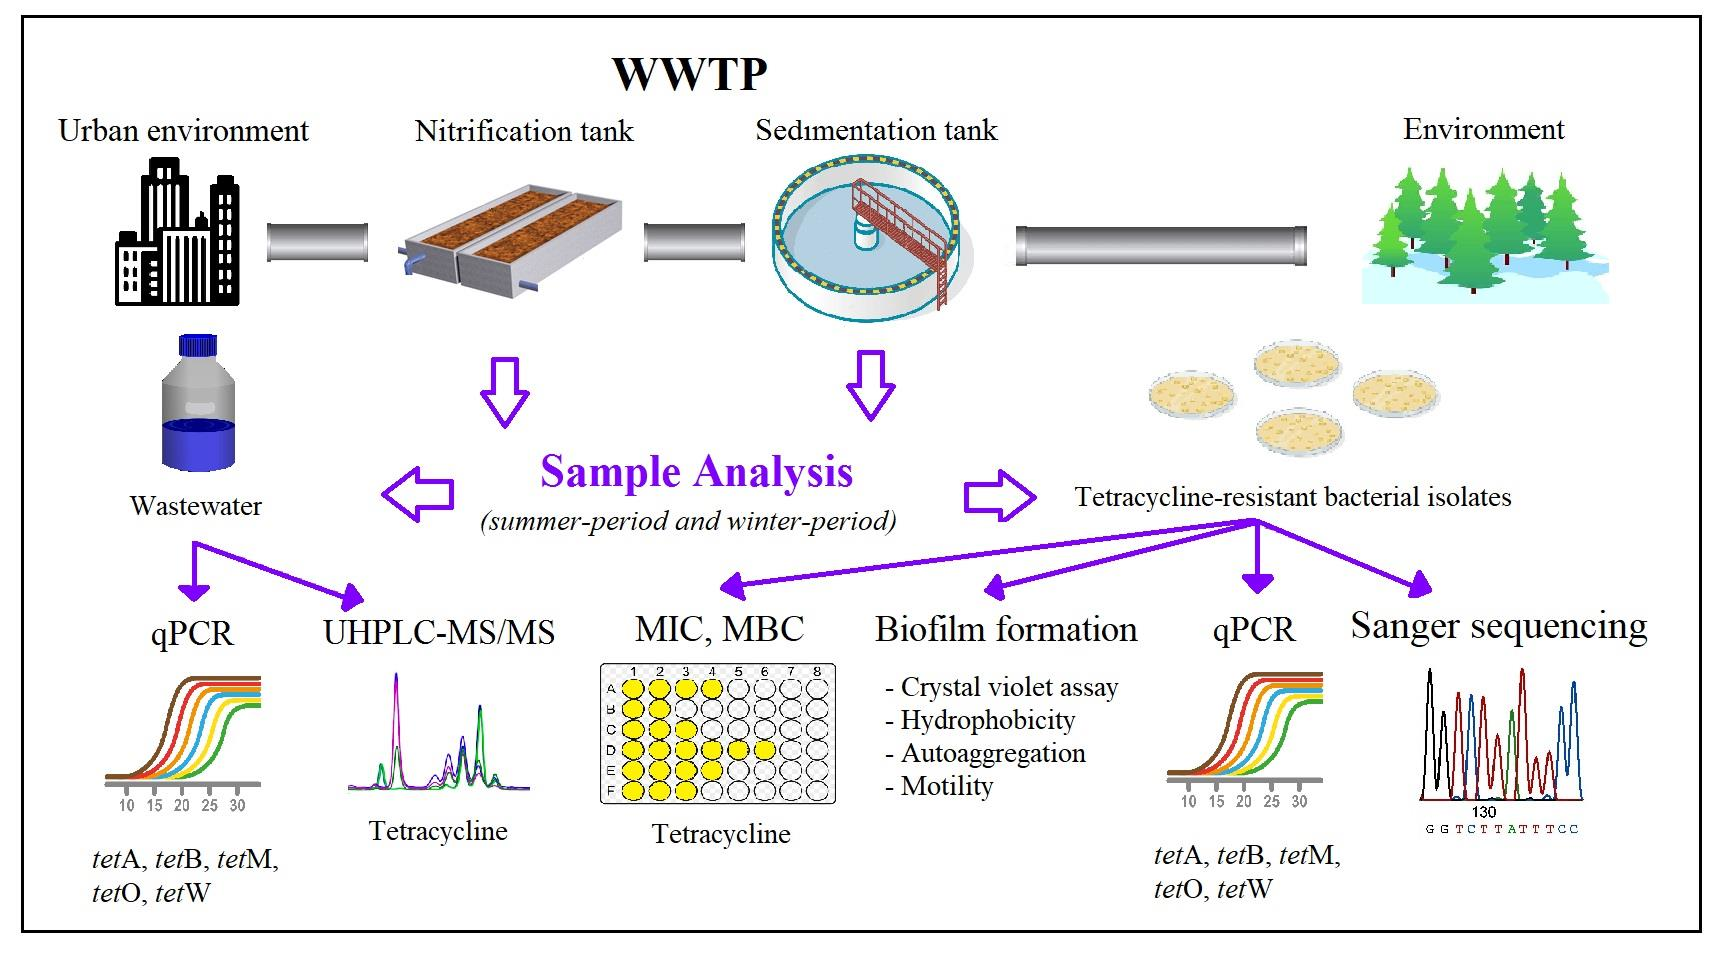
3.2. Quantification of ARGs in Wastewater

It is necessary to monitor not only the presence of ARB, but also of ARGs. The diverse bacterial communities of systems in WWTPs could provide ideal conditions for the horizontal gene transfer of ARGs [43]. The persistence and mobility of ARGs in WWTPs increases the risk of ARGs transfer to different bacterial species and thus the diversity of resistant bacteria in the environment and the health risk to humans during different activities [44]. For those reasons, special attention has been paid to the occurrence of tetracycline resistance genes in nitrification and sedimentation tanks of the WWTP as a potential reservoir of ARGs. High R2 values (0.996–0.998) and high efficiencies (97.39–99.05%) obtained from the standard curves showed the sensitivity and linearity of the quantification of ARGs in all qPCR assays (Supplementary Table S4). Two of the five tested genes (tetA, tetB, tetM, tetO and tetW) were detected in the samples. The tetW showed a higher relative abundance in the sedimentation tank than in the nitrification tank of the WWTP (Figure 1). In contrast to tetW, the tetB gene showed higher abundance values in the nitrification tank than in the sedimentation tank of the WWTP.
The results of this study showed that the tetW gene was the most abundant ARG in the wastewater of the WWTP. The tetW gene forms one homology group and contains 53% G+C [45] and encodes a ribosomal protection protein that confers resistance to tetracycline [46]. Tetracyclines inhibit the accommodation of the aminoacyl-tRNA (aa-tRNA) into the ribosomal A site and therefore prevent the addition of new amino acids to the growing polypeptide [47]. It was demonstrated that tRNA binding to the A site, which is normally inhibited by tetracycline is actually protected in the presence of Tet-protein. Thus, it appears that tetW confers tetracycline resistance by releasing tetracycline from the ribosome, thereby freeing the ribosome from the inhibitory effects of the drug, so that the aa-tRNA can bind to the A site, and protein synthesis can continue [47]. The fact that tetW is dominant within the tet genes was also confirmed by Czekalski et al. (2014) [48]. Screening of freshwater lake sediments showed that the tetracycline gene abundance generally decreased from tetW over tetM to tetB, which is consistent with the results of this study. In this study, other tetracycline resistance genes, tetA, tetM and tetO, were below the detection limit. Svobodová et al. (2018) came to a remarkably similar result [27]. Of the five tet genes (tetW, tetO, tetA, tetB and tetM) observed in six WWTPs in central and western Bohemia, only tetW was found at all the sampling locations. Higher abundance of the tetW gene could be associated with higher tetracycline levels in wastewater from the sedimentation tank. A similar result was obtained in the study by Liu et al. (2019), in which the relative abundance of the tet genes increased from an anaerobic tank to a secondary settling tank of the WWTP in southern China [49].

3.3. Characterization of Bacterial Strains Isolated from Wastewater

3.3.1. Enzymatic Activity

Inorganic and organic nutrients in water and sediments are biochemically recycled by microbial enzymes. In biofilms in which the largest part of microbial biomass is concentrated, these immobilized enzymes are of great importance [50]. They can be used as indicators of microbial diversity and provide an overview of environmental changes [51].
All tetracycline-resistant isolates were Gram-negative and showed a diverse enzymatic activity (Table 1). Of the 40 isolates, 29 showed lipase activity and 22 lecithinase activity. The fact that more than half of the bacteria we identified were lipophilic is consistent with the conclusions of other studies [52]. Lipase, a hydrolytic enzyme, has antimicrobial and antifouling properties [53]. As expected, most strains exhibited gamma-hemolytic activity, with the exception of four strains with alpha-hemolytic and five strains with beta-hemolytic activity. Hemolysins are known to be putative virulence factors that contribute to the bacterial pathogenesis [54]. Beta and alpha hemolysins are the most important in biofilm pathogenesis [55]. The production of enzymes, including hemolysin, lipase and lecithinase, is a well-known fact among biofilm producers, especially P. aeruginosa [56]. However, the enzymatic activities in biofilm-forming bacteria in wastewater are less understood virulence factors and their importance for pathogenicity requires new, more rigorous studies.

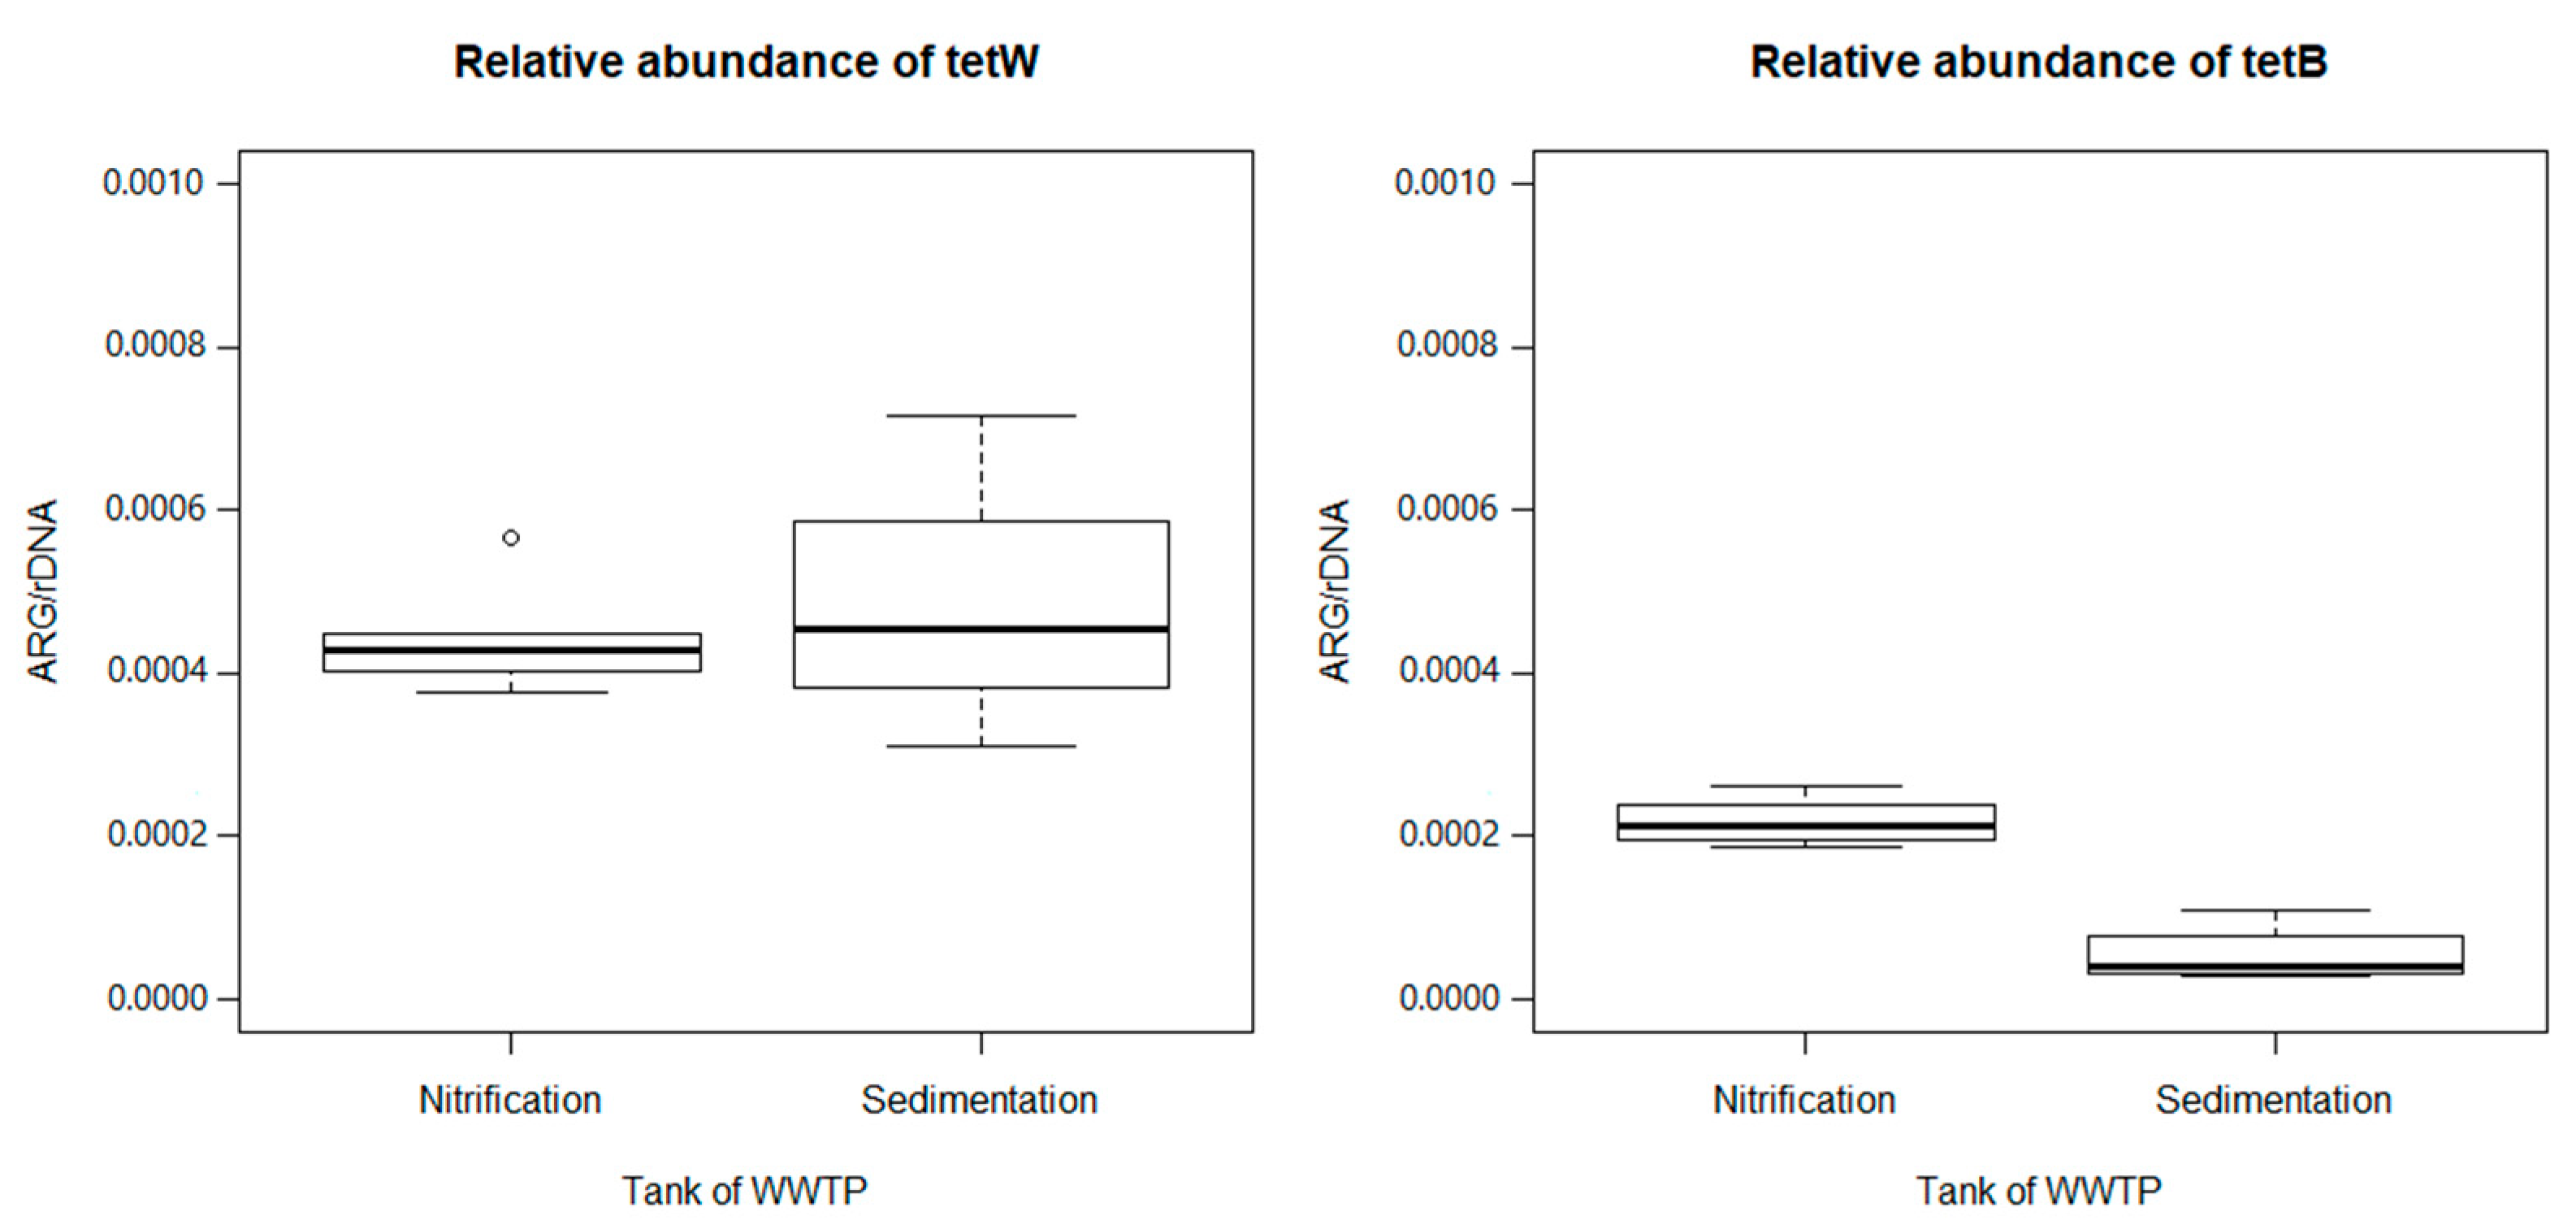
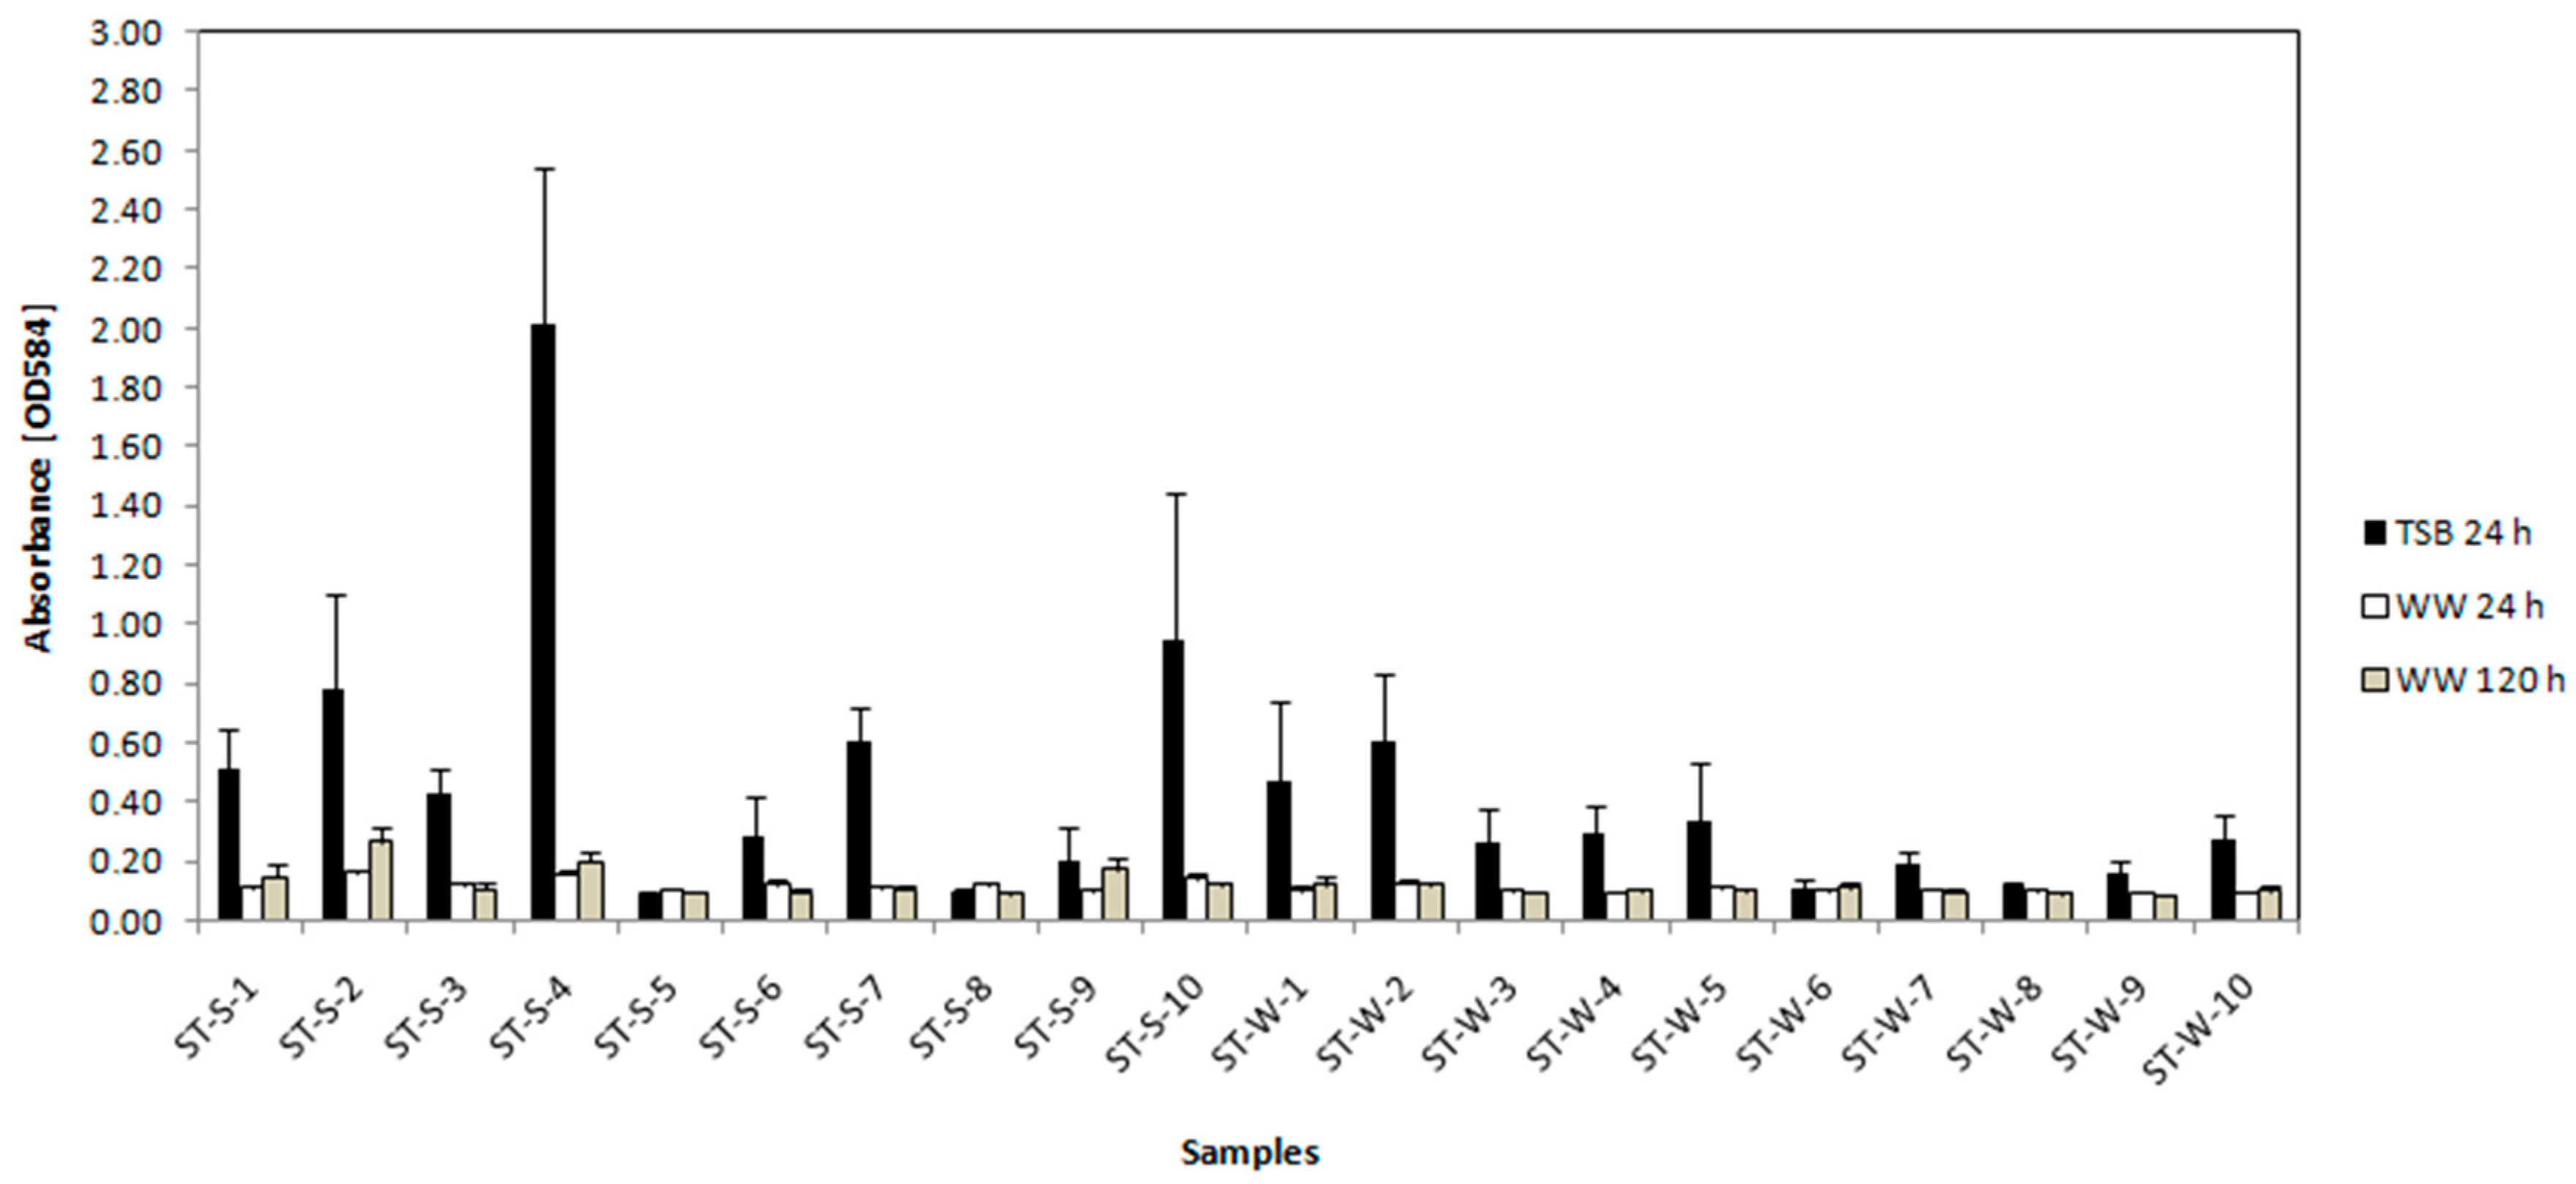
3.3.2. Crystal Violet Assay for Determination of Biofilm Formation

The biofilm formation of tetracycline-resistant strains obtained by isolation from wastewaters was determined by the crystal violet assay. The nutrient medium provides ideal living conditions with sufficient nutrients to determine whether the strains are generally capable of biofilm formation. The results obtained showed that most of the tetracycline-resistant isolates (38) analyzed could form biofilm after 24 h incubation in TSB (Figure 2 and Figure 3). Six bacterial isolates of the nitrification tank were moderate biofilm producers in TSB medium (NT-W-1, NT-W-3, NT-W-6, NT-W-7, NT-W-9 and NT-W-10) (Figure 2). The isolate ST-S-4 from the sedimentation tank was a moderate biofilm producer and the isolates ST-S-5 and ST-S-8 were non-producers (Figure 3). Other isolates were classified as weak biofilm producers. Biofilm formation was most consistent in the bacterial isolates from the nitrification tank obtained in the winter-period compared to the bacterial isolates from the summer-period in TSB (Figure 2). On the contrary, more biofilm was formed by bacterial isolates from the sedimentation tank from summer-period compared to winter-period in TSB (Figure 3). Abdulina et al. (2019) showed that active biofilm is formed in wastewater treatment plants regardless of the season [57]. Bacterial isolates from the nitrification tank were better biofilm formers compared to bacterial isolates from the sedimentation tank in TSB (Figure 2 and Figure 3). Li et al. (2011), in contrast, found that bacteria from the sedimentation tank were larger biofilm producers than bacteria from the nitrification tank, which may be related to the ongoing sedimentation in the sedimentation tank [58]. Due to the observed differences in the ability of isolates to form a biofilm in the nitrification tank and in the sedimentation tank and the results published by Li et al. (2011), it would be appropriate to further investigate whether or not the tank type plays a role in biofilm formation.
Subsequently, resistant isolates were also tested for biofilm formation in wastewater to simulate the aquatic environment in the WWTP tanks. Isolates from the nitrification tank were tested in the nitrification wastewater (Figure 2) and isolates from the sedimentation tank in the sedimentation wastewater (Figure 3). The isolates from the nitrification tank were mostly weak biofilm producers after 24 h and 120 h incubation in the nitrification wastewater. Only the isolates NT-S-3 and NT-W-7 were moderate biofilm producers after 24 h incubation in the nitrification wastewater (Figure 2). On the contrary, the sedimentation wastewater did not induce biofilm formation after 24 and 120 h in the bacterial isolates from the sedimentation tank of WWTP. Three bacterial isolates from the sedimentation tank were non-producers of biofilm after 24 h incubation in the sedimentation wastewater (ST-W-4, ST-W-9 and ST-W-10) and seven after 120 h incubation (ST-S-5, ST-S-6, ST-S-8, ST-W-3, ST-W-7, ST-W-8 and ST-W-9) (Figure 3); this finding corresponds to the results of biofilm formation in TSB. Other tetracycline-resistant isolates from the sedimentation tank were weak biofilm producers after 24 h and 120 h incubation in the sedimentation wastewater. A correlation was observed between biofilm formation in TSB and biofilm formation in the sedimentation wastewater from summer-period and winter-period after 24 h and 120 h incubation (p < 0.05), respectively (Table 2). Isolates NT-S-3, NT-S-4, NT-S-6, NT-W-7 and NT-W-10 induced biofilm formation after 24 h incubation in nitrification wastewater compared to 120 h incubation (Figure 2). This may be related to quorum sensing, i.e., the accumulation of a large number of cells which are then dispersed again in the medium [59]. Interestingly, the isolates NT-S-3 and NT-S-10 were capable to create more biofilm after 24 h incubation in nitrification wastewater compared to TSB (Figure 2). It was found that the carbon sources and other nutrients present in the nitrification tank of the WWTP influenced quorum sensing signals, which have a strong effect on biofilm formation and stability [60].

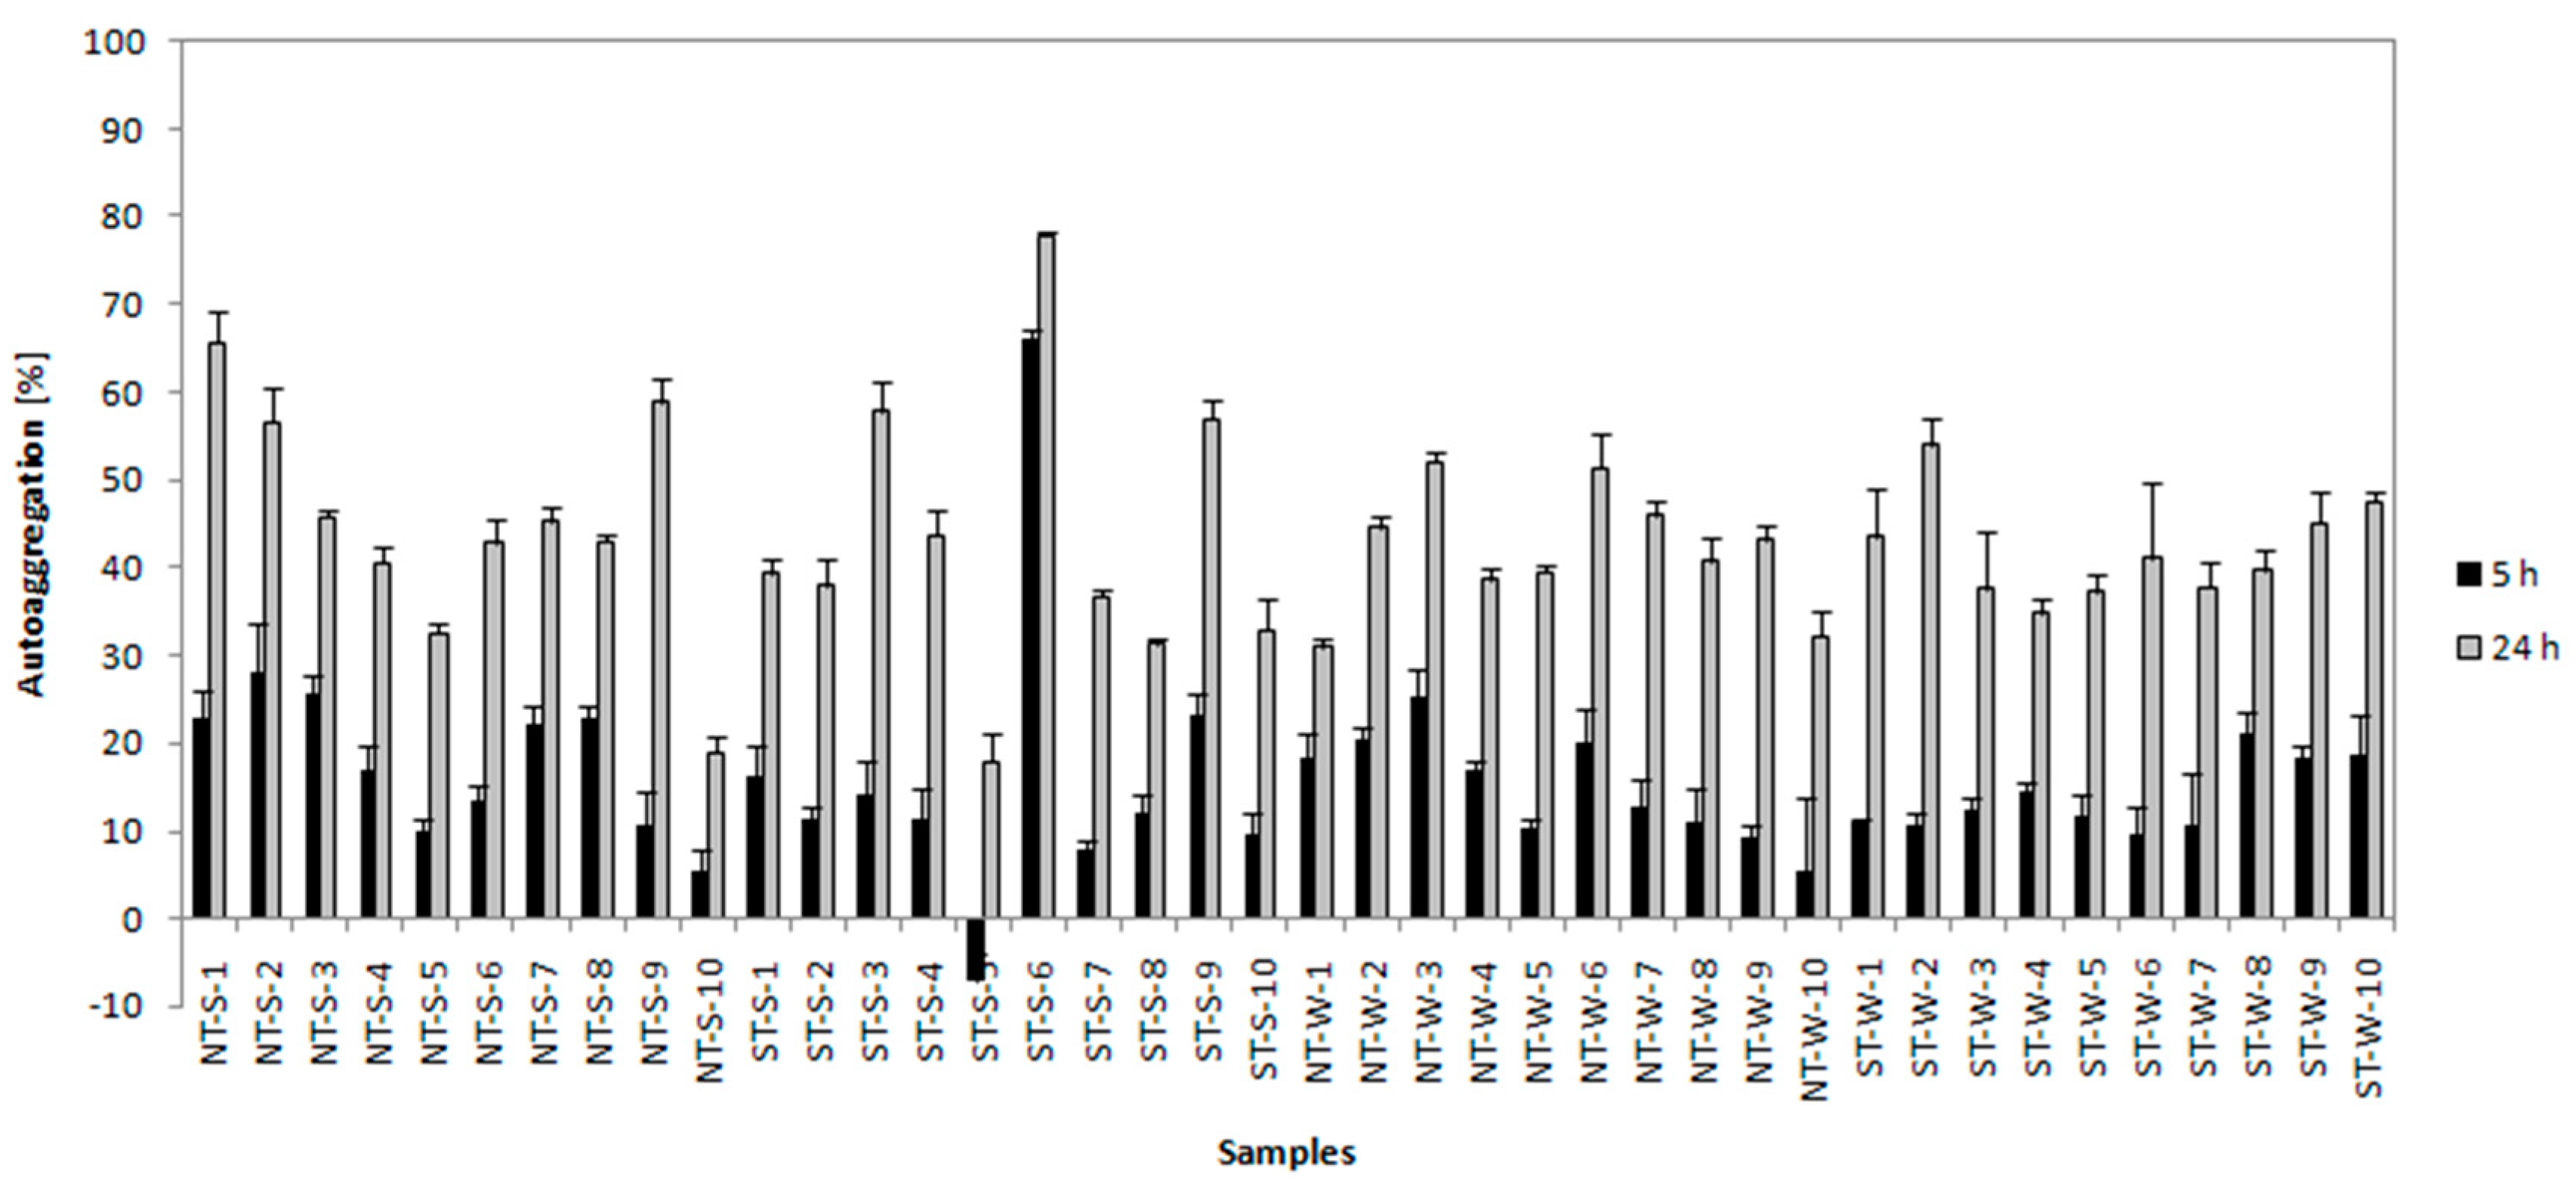
3.3.3. Autoaggregation Test, Hydrophobicity Test and Motility

The bacterial hydrophobicity (Figure 4), autoaggregation (Figure 5) and motility (Table 1) and their importance for the biofilm formation of tetracycline-resistant isolates was investigated further. Several studies have confirmed that the hydrophobic properties of bacteria can be an important factor in biofilm formation [61]. The hydrophobicity of 14 bacterial isolates was described as moderately hydrophobic at 30 °C, while other 26 isolates were described as hydrophilic at the same temperature (Table 2). The hydrophobicity of bacterial isolates from the sedimentation tank was significantly higher than the hydrophobicity of isolates from the nitrification tank. Only one isolate sampled from the nitrification tank in winter had moderately hydrophobic cell-surface properties (NT-W-3). However, a correlation between hydrophobicity and autoaggregation after 5 h and 24 h incubation for NT-W samples (samples from the nitrification tank sampled in winter-period) was observed (p < 0.05) (Table 2).
The aggregation of bacteria is one of the essential processes that plays an important part both in biofilm formation and in different environmental interactions [10]. All investigated strains showed increasing autoaggregation from 5 to 24 h (Figure 5). Most strains were characterized as moderately aggregating. Among the biofilm-forming isolates, the greatest autoaggregation was monitored in NT-W-3 and NT-W-6. Two bacterial strains (NT-S-10 and ST-S-5) were characterized by weak autoaggregative properties (<20%). Noteworthy, a strong autoaggregating phenotype (>70%) was observed for ST-S-6; however, this strain was defined as weak biofilm producer. Simões et al. (2007) reported that some bacteria are unable to create flocs without the occurrence of other bacterial species [62]. In this study, a correlation was observed between autoaggregation after 5 h incubation and biofilm formation in wastewater after 120 h incubation for ST-W samples (samples from the sedimentation tank sampled in winter-period) (p < 0.05) (Table 2).
The bacterial motility depends on the flagella. Their presence is a decisive factor and bacteria have the ability to adhere to various surfaces, but also to form a biofilm [10]. The motility of NT-W-1 and NT-W-8 was designated as strong positive, while the isolates ST-W-3, ST-W-6, ST-S-9 and NT-W-9 were designated as non-motile (Table 1). Biofilm formation in TSB was not confirmed in non-motile isolates. A correlation was detected between motility and biofilm formation in wastewater after 120 h incubation for NT-S samples (samples from the nitrification tank sampled in summer-period) (p < 0.05), respectively (Table 2).

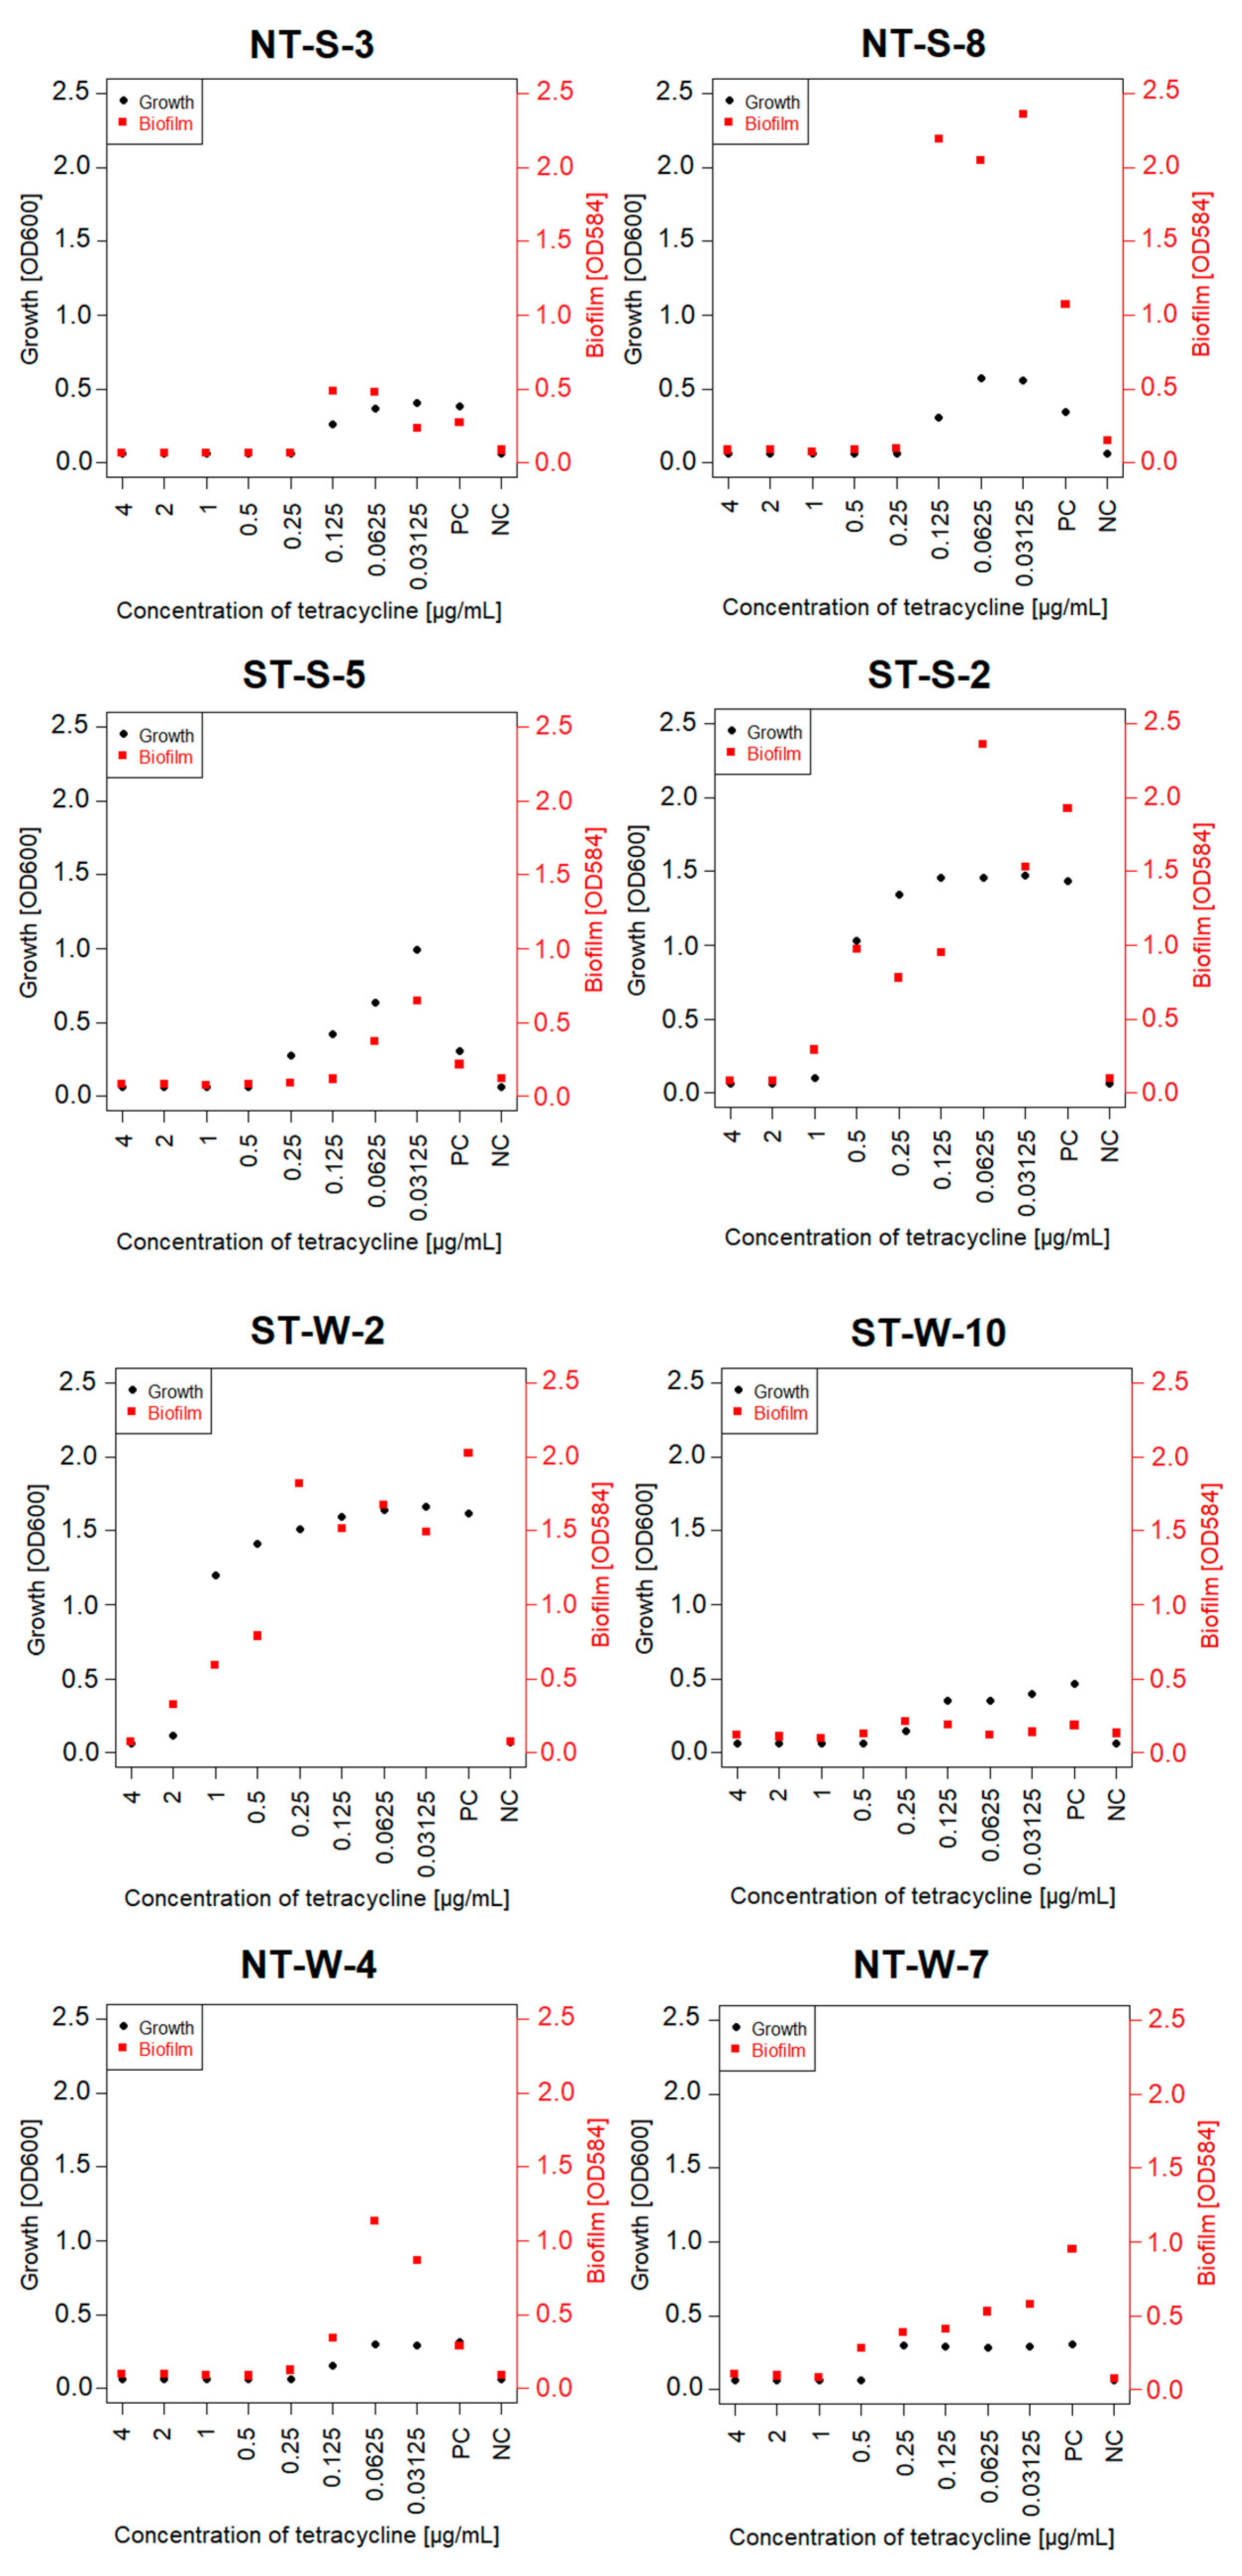
3.4. Tetracycline MIC and MBC for Selected Isolates and the Effect of Sub-Inhibitory Concentrations on Biofilm Formation

Comprehension of the dynamics of biofilms that are affected by the antibiotics is significant for the development of control strategies for wastewater treatment processes and also for tracking the evolution of resistance. It is known that increase via biofilm-specific resistance mechanisms leads to greater resistance to different antibiotics and further environmental stressors [63].
To determine the MIC and MBC of tetracycline and to investigate antibiotic-induced biofilm formation, we exposed selected bacterial isolates from each groups of samples (NT-S-3, NT-S-8, ST-S-2, ST-S-5, NT-W-4, NT-W-7, ST-W-2 and ST-W-10) to tetracycline for 24 h. The MIC and MBC values of tetracycline were determined as an evaluation of its antimicrobial activity against selected bacterial isolates from the WWTP (Table 3). MIC values for most strains were 0.25 or 0.5 µg/mL, while isolates ST-S-2 and ST-W-2 were more resistant with MIC of 2 and 4 µg/mL, respectively. MBC values for most strains were between 0.5 and 1 µg/mL, but increased to 4 and 8 µg/mL for ST-S-2 and ST-W-2, respectively. Svobodová et al. (2018) found that 67% of bacterial isolates isolated from the nitrification tanks of Czech WWTPs and 82% from those of effluent had MIC values ranging in an interval of 2–50 µg tetracycline/mL [27]. Huang et al. (2012) monitored the MIC values of antibiotics for heterotrophic bacteria from the WWTP in China [64]. For penicillin and tetracycline, the MIC values showed 16 µg/mL and for ampicillin, cephalothin and chloramphenicol 32 µg/mL. Obayiuwana et al. (2018) found high MIC values of selected antibiotics on the bacterial isolates from the hospital wastewaters in Nigeria [65]. The MIC of tetracycline was lowest among the antibiotics tested (128 µg/mL), while the values for ampicillin, amoxicillin, trimethoprim, chloramphenicol and sulfonamides were highest with 1024 µg/mL for MIC values. These results are not surprising, as antibiotics easily accumulate in sewage sludge or sediments [21]. Thereby, the presence and cumulation of not only tetracycline antibiotics in the environment could lead to negative influence in humans as well as animals.
Further, biofilm formation in the presence of tetracycline was evaluated (Figure 6). In the isolates NT-S-3, NT-S-8, NT-W-4, ST-S-2 and ST-S-5 biofilm formation was induced with sub-inhibitory tetracycline concentrations. When the isolates were supplemented with tetracycline, it was found that the concentration range from 0.25 to 4 μg/mL inhibited biofilm formation, but the concentration range from 0.03125 to 0.125 µg/mL induced biofilm formation. The tested sub-inhibitory concentrations induced biofilm formation in a higher number of bacterial isolates obtained in the summer-period compared to bacterial isolates obtained in the winter-period. Interestingly, increased bacterial growth was induced in the isolates NT-S-8 and ST-S-5 with sub-inhibitory tetracycline concentrations in the concentration range from 0.03125 to 0.0625 µg/mL. Biofilm formation in bacteria in the occurrence of tetracycline antibiotic has been detected previously [66]. Penesyan et al. (2019) confirmed that bacterial isolates from tetracycline treatments exhibit 5 to 10 times larger formation of biofilm than untreated cells [63]. It has been published that the presence of either a gentamicin or tetracycline resistance gene induces biofilm formation [67]. According to the results of this study, this can complicate the treatment of wastewater since the presence of tetracycline (even at low concentrations) promotes biofilm formation and reinforces the mechanisms of biofilm resistance. These results suggest that care should be taken in the use of antibiotics and their distribution in the environment and that the development and maturation of biofilms should be monitored.

3.5. Identification of Selected Isolates and Detection of ARGs

These selected isolates were subjected to identification by sequencing of the 16S rDNA gene fragment. The sequences of isolates NT-S-3, NT-S-8 and ST-S-2 were clustered with Aeromonas salmonicida. The isolates NT-W-4, ST-S-5 and ST-W-10 were classified as Aeromonas sp. The sequence from the isolate ST-W-2 was clustered with the sequences of Pseudomonas sp. The isolate NT-W-7 showed a sequence similar to that of Klebsiella pneumoniae (Table 3). The occurrence of Aeromonas sp. in wastewater was not surprising, as these are ubiquitously occurring aquatic bacteria that generally have high resistance to antibiotics and form biofilm [68]. The similar has been reported for other identified species and genera. Barati et al. (2016) demonstrated that 76.4% of the aquatic-borne K. pneumoniae isolates form biofilm [69]. Mahapatra et al. (2015) confirmed biofilm formation in 37 of 187 isolates from water samples, including Acinetobacter spp., Klebsiella spp., Pseudomonas spp. and others [70]. Emami et al. (2015) demonstrated that biofilm-producing isolates of Pseudomonas spp. from wastewater in Iran were more resistant to the antibiotics tested [71]. Bacterial species belonging to the genus Klebsiella and Pseudomonas are well-known opportunistic hospital pathogens with the potential to exit hospitals via effluent systems. They are a common cause of hospital-associated diseases, such as pneumonia, urinary tract infections and gastrointestinal infections [72,73]. The occurrence of these bacterial species in the environment—especially antibiotic resistant—is an important issue for the environment and public health [74]. Furthermore, there is currently a knowledge gap as to whether the presence of such species in community wastewaters poses a potential risk to human health [75].
Further, these selected isolates were tested for the occurrence of the genes tetA, tetB, tetM, tetO and tetW. The tetW gene was found in all samples. In contrast, the tetB gene was only found in the isolate NT-S-3, indicating a potential multidrug resistance in this bacterium. The tetA, tetM and tetO genes were not detected in this study (Table 3). Svobodová et al. (2018) analyzed fragments of the ARGs tetW, tetO, tetA, tetB and tetM in selected bacterial isolates from urban WWTP and only the tetW gene amplification was observed [27].

4. Conclusions

The study monitored the effect of the antibiotic tetracycline on biofilm formation by resistant bacterial strains isolated from different phases of the wastewater treatment process. Bacterial isolates from the nitrification tank produced biofilm with up to 10 times higher intensity compared to the isolates from the sedimentation tank. The biofilm formation in TSB was the most pronounced in bacterial isolates from the nitrification tank obtained during the winter-period. In accordance with this, it was found that the antibiotic tetracycline induces biofilm formation in tetracycline-resistant isolates mainly from the summer-period (from 0.03125 to 0.125 µg/mL), but also promotes bacterial growth in the same concentrations. Increased biofilm formation after influence of sub-inhibitory tetracycline concentrations was found especially in Aeromonas spp. Tetracycline-resistant bacteria in WWTP were dominated by those with MIC values of 0.25–4 µg tetracycline/mL and MBC values of 0.5–8 µg tetracycline/mL. The highest tetracycline resistance was associated with bacteria of the genus Pseudomonas.
The results demonstrated that tetW gene was the most frequently detected tetracycline resistance gene. The tetW gene occurred in the sedimentation tank at a higher abundance compared to the nitrification tank. The tetB gene was also quantified in both tanks, but at a lower abundance. UHPLC-MS/MS confirmed 1.25 times higher presence of the antibiotic tetracycline in the sedimentation tank compared to the nitrification tank of the WWTP.
In summary, this study demonstrates the induction of biofilm formation by sub-inhibitory tetracycline concentrations in tetracycline-resistant bacteria, suggesting that biofilms play an important part as reservoirs for ARGs. Bacteria can acquire a high-level resistance to various antimicrobial agents by forming a biofilm if they are supplemented with a sub-inhibitory amount of the antibiotic mixture. Removal of antibiotic compounds and ARB in WWTPs is not sufficient to prevent the spread of ARGs into the environment. The bacterial potential for the transfer of other resistance genes within biofilms and during the wastewater treatment process needs further research.

Supplementary Materials

The following are available online at https://0-www-mdpi-com.brum.beds.ac.uk/2227-9717/8/8/989/s1, Figure S1: The growth curves of tetracycline-resistant isolates from the nitrification tank (NT) and the sedimentation tank (ST) of the wastewater treatment plant for the preparation of the hydrophobicity test. The growth curves measured every 30 min 24 h at 600 nm and 30 °C, Table S1: Concentration (ng/µL) and purity (A260/A280) of DNA samples from the wastewater of the nitrification and sedimentation tanks of the wastewater treatment plant for the quantification of antibiotic resistance genes, Table S2: Primers sequences and PCR and qPCR conditions used for detection and quantification of tet genes in wastewater samples and selected bacterial isolates, Table S3: The parameters of the growth curves of tetracycline-resistant isolates from the nitrification tank (NT) and the sedimentation tank (ST) of the wastewater treatment plant for the preparation of the hydrophobicity test. The growth curves measured every 30 min 24 h at 600 nm and 30 °C, Table S4: Efficiency of qPCR assays retrieved from standard curves.

Author Contributions

Methodology, M.S. and T.S.; Investigation, T.S. and J.S.; Formal analysis, T.S.; Resources, M.S. and S.S.M.; Writing—original draft, T.S.; Writing—review and editing, M.S., K.M., S.S.M. and Z.R.; Supervision, K.M. and S.S.M. All authors have read and agreed to the published version of the manuscript.

Funding

This research was funded by SGS projects OU (ID: SGS09/PřF/2019 and SGS01/PřF/2020), ERDF “Institute of Environmental Technology—Excellent Research” (No. CZ.02.1.01/0.0/0.0/16_019/0000853), by the Center for Geosphere Dynamics (UNCE/SCI/006) and by the Slovenian Research Agency (Grant No. P4-0116).

Acknowledgments

T.S. thanks to the wastewater treatment plant Ostravské vodárny a kanalizace a.s. in the Czech Republic for providing the water samples. T.S. thanks to Alexandra Koudelová Stachurová for the correction of English.

Conflicts of Interest

The authors declare no conflict of interest.

References

  1. Manaia, C.M.; Macedo, G.; Fatta-Kassinos, D.; Nunes, O.C. Antibiotic resistance in urban aquatic environments: Can it be controlled? Appl. Microbiol. Biotechnol. 2016, 100, 1543–1557. [Google Scholar] [CrossRef] [PubMed] [Green Version]
  2. Merlin, C.; Bonot, S.; Courtois, S.; Block, J.-C. Persistence and dissemination of the multiple-antibiotic-resistance plasmid pB10 in the microbial communities of wastewater sludge microcosms. Water Res. 2011, 45, 2897–2905. [Google Scholar] [PubMed]
  3. Cyprowski, M.; Stobnicka-Kupiec, A.; Ławniczek-Wałczyk, A.; Bakal-Kijek, A.; Gołofit-Szymczak, M.; Górny, R.L. Anaerobic bacteria in wastewater treatment plant. Int. Arch. Occup. Environ. Health 2018, 91, 571–579. [Google Scholar] [CrossRef] [PubMed] [Green Version]
  4. Bonomo, R.A.; Szabo, D. Mechanisms of multidrug resistance in Acinetobacter species and Pseudomonas aeruginosa. Clin. Infect. Dis. 2006, 43, S49–S56. [Google Scholar] [CrossRef] [Green Version]
  5. Kaskhedikar, M.; Chhabra, D. Multiple drug resistance in Aeromonas hydrophila isolates of fish. Food Microbiol. 2010, 28, 157–168. [Google Scholar]
  6. Silge, A.; Schumacher, W.; Rösch, P.; Da Costa Filho, P.A.; Gérard, C.; Popp, J. Identification of water-conditioned Pseudomonas aeruginosa by Raman microspectroscopy on a single cell level. Syst. Appl. Microbiol. 2014, 37, 360–367. [Google Scholar] [CrossRef]
  7. Zhang, Y.; Marrs, C.F.; Simon, C.; Xi, C. Wastewater treatment contributes to selective increase of antibiotic resistance among Acinetobacter spp. Sci. Total Environ. 2009, 407, 3702–3706. [Google Scholar] [CrossRef]
  8. Faleye, A.C.; Adegoke, A.A.; Ramluckan, K.; Bux, F.; Stenström, T.A. Antibiotic Residue in the Aquatic Environment: Status in Africa. Open Chem. 2018, 16, 890–903. [Google Scholar] [CrossRef]
  9. Sanganyado, E.; Gwenzi, W. Antibiotic resistance in drinking water systems: Occurrence, removal, and human health risks. Sci. Total Environ. 2019, 669, 785–797. [Google Scholar] [CrossRef]
  10. Jałowiecki, L.; Żur, J.; Chojniak, J.; Ejhed, H.; Płaza, G. Properties of Antibiotic-Resistant Bacteria Isolated from Onsite Wastewater Treatment Plant in Relation to Biofilm Formation. Curr. Microbiol. 2018, 75, 639–649. [Google Scholar] [CrossRef] [Green Version]
  11. Smole Možina, S.; Klančnik, A.; Raspor, P. Mechanisms of microbial resistance in biofilms. In Biofilms in Bioengineering (Microbiology Research Advances), 2nd ed.; Simões, M., Mergulhão, F., Eds.; Nova Science Publishers: New York, NY, USA, 2013; pp. 311–332. [Google Scholar]
  12. Salcedo, D.E.; Lee, J.H.; Ha, U.H.; Kim, S.P. The effects of antibiotics on the biofilm formation and antibiotic resistance gene transfer. Desalin. Water Treat. 2014, 54, 3582–3588. [Google Scholar] [CrossRef]
  13. Satoh, H.; Odagiri, M.; Ito, T.; Okabe, S. Microbial community structures and in situ sulphate-reducing and sulphur-oxidizing activities in biofilms developed on mortar specimens in a corroded sewer system. Water Res. 2009, 43, 4729–4739. [Google Scholar] [PubMed] [Green Version]
  14. Auguet, O.; Maite, P.; Guasch-Balcells, H.; Borrego, C.M.; Gutierrez, O. Implications of downstream nitrate dosage in anaerobic sewers to control sulfide and methane emissions. Water Res. 2015, 68, 522–532. [Google Scholar] [PubMed]
  15. Van, T.T.H.; Yidana, Z.; Smooker, P.M.; Coloe, P.J. Antibiotic use in food animals worldwide, with a focus on Africa: Pluses and minuses. J. Glob. Antimicrob. Resist. 2020, 20, 170–177. [Google Scholar] [CrossRef] [PubMed]
  16. Borghi, A.A.; Palma, M.S.A. Tetracycline: Production, waste treatment and environmental impact assessment. Braz. J. Pharm. Sci. 2014, 50, 25–40. [Google Scholar] [CrossRef]
  17. Javid, A.; Mesdaghinia, A.; Nasseri, S.; Mahvi, A.H.; Alimohammadi, M.; Gharibi, H. Assessment of tetracycline contamination in surface and groundwater resources proximal to animal farming houses in Tehran, Iran. J. Environ. Health Sci. Eng. 2016, 14, 1–5. [Google Scholar] [CrossRef] [Green Version]
  18. Hubeny, J.; Buta, M.; Zieliński, W.; Harnisz, M.; Korzeniewska, E.; Nowrotek, M.; Płaza, G. The Prevalence of tet(A) and tet(M) Tetracycline Resistance Genes in Municipal Wastewater. J. Ecol. Eng. 2019, 20, 1–6. [Google Scholar] [CrossRef]
  19. Kang, Y.; Li, Q.; Yin, Z.; Shen, M.; Zhao, H.; Bai, Y.; Mei, L.; Hu, J. High diversity and abundance of cultivable tetracycline-resistant bacteria in soil following pig manure application. Sci. Rep. 2018, 8, 1489. [Google Scholar] [CrossRef] [Green Version]
  20. Granados-Chinchilla, F.; Rodríguez, C. Tetracyclines in Food and Feedingstuffs: From Regulation to Analytical Methods, Bacterial Resistance, and Environmental and Health Implications. J. Anal. Methods Chem. 2017, 2017, 1315497. [Google Scholar] [CrossRef]
  21. Daghrir, R.; Drogui, P. Tetracycline antibiotics in the environment: A review. Environ. Chem. Lett. 2013, 11, 209–227. [Google Scholar] [CrossRef]
  22. Deblonde, T.; Cossu-Leguille, C.; Hartemann, P. Emerging pollutants in wastewater: A review of the literature. Int. J. Hyg. Environ. Health 2011, 214, 442–448. [Google Scholar] [CrossRef] [PubMed]
  23. Kulkarni, P.; Olson, N.D.; Raspanti, G.A.; Rosenberg Goldstein, R.E.; Gibbs, S.G.; Sapkota, A.; Sapkota, A.R. Antibiotic Concentrations Decrease during Wastewater Treatment but Persist at Low Levels in Reclaimed Water. Int. J. Environ. Res. Public Health 2017, 14, 668. [Google Scholar] [CrossRef] [PubMed] [Green Version]
  24. Gasparrini, A.J.; Markley, J.L.; Kumar, H.; Wang, B.; Fang, L.; Irum, S.; Symister, C.T.; Wallace, M.; Burnham, C.-A.D.; Andleeb, S.; et al. Tetracycline-inactivating enzymes from environmental, human commensal, and pathogenic bacteria cause broad-spectrum tetracycline resistance. Commun. Biol. 2020, 3, 241. [Google Scholar] [CrossRef] [PubMed]
  25. Abe, K.; Nomura, N.; Suzuki, S. Biofilms: Hot spots of horizontal gene transfer (HGT) in aquatic environments, with a focus on a new HGT mechanism. FEMS Microbiol. Ecol. 2020, 96, fiaa031. [Google Scholar] [CrossRef]
  26. Balcázar, J.L.; Subirats, J.; Borrego, C.M. The role of biofilms as environmental reservoirs of antibiotic resistance. Front. Microbiol. 2015, 6, 1216. [Google Scholar] [CrossRef] [Green Version]
  27. Svobodová, K.; Semerád, J.; Petráčková, D.; Novotný, Č. Antibiotic Resistance in Czech Urban Wastewater Treatment Plants: Microbial and Molecular Genetic Characterization. Microb. Drug Resist. 2018, 24, 830–838. [Google Scholar] [CrossRef]
  28. Stach, J.E.M.; Bathe, S.; Clapp, J.P.; Burns, R.G. PCR-SSCP comparison of 16SrDNA sequence diversity in soil DNA obtained using different isolation and purification methods. FEMS Microbiol. Ecol. 2001, 36, 139–151. [Google Scholar] [CrossRef]
  29. Marti, E.; Jofre, J.; Balcazar, J.L. Prevalence of Antibiotic Resistance Genes and Bacterial Community Composition in a River Influenced by a Wastewater Treatment Plant. PLoS ONE 2013, 8, E78906. [Google Scholar] [CrossRef]
  30. Boerjesson, S.; Mattsson, A.; Lindgren, P.E. Genes encoding tetracycline resistance in a full-scale municipal wastewater treatment plant investigated during one year. J. Water Health 2010, 8, 247–256. [Google Scholar] [CrossRef]
  31. Rathnayake, I.U.; Hargreaves, M.; Huygens, F. Antibiotic resistance and virulence traits in clinical and environmental Enterococcus faecalis and Enterococcus faecium isolates. System. Appl. Microbiol. 2012, 35, 326–333. [Google Scholar] [CrossRef]
  32. Nord, C.-E.; Sjöberg, L.; Wadström, T.; Wretlind, B. Characterization of three Aeromonas and nine Pseudomonas species by extracellular enzymes and haemolysins. Med. Microbiol. Immunol. 1975, 161, 79–87. [Google Scholar] [CrossRef]
  33. Rollof, J.; Hedstrom, S.A.; Nilsson-Ehle, P. Lipolytic aktivity of Staphylococcus aureus strains from disseminated and localized infections. Acta Pathol. Microbiol. Scand. Sect. B Microbiol. 1987, 95, 109–113. [Google Scholar]
  34. Igarashi, T.; Aritake, S.; Yasumoto, T. Mechanisms underlying the hemolytic and ichthyotoxic activities of maitotoxin. Nat. Toxins 1999, 7, 71–79. [Google Scholar] [CrossRef]
  35. Kurinčič, M.; Jeršek, B.; Klančnik, A.; Smole Možina, S.; Fink, R.; Dražić, R.; Raspor, P.; Bohinc, K. Effects of natural antimicrobials on bacterial cell hydrophobicity, adhesion, and zeta potential. Arh. Hig. Rada Toksikol. 2016, 67, 39–45. [Google Scholar] [CrossRef] [PubMed] [Green Version]
  36. Sterniša, M.; Klančnik, A.; Smole Možina, S. Spoilage Pseudomonas biofilm with Escherichia coli protection in fish meat at 5 °C. J. Sci. Food Agric. 2019, 99, 4635–4641. [Google Scholar] [CrossRef] [PubMed]
  37. Rossi, C.; Chaves-López, C.; Serio, A.; Goffredo, E.; Goga, B.T.C.; Paparella, A. Influence of Incubation Conditions on Biofilm Formation by Pseudomonas Fluorescens Isolated from Dairy Products and Dairy Manufacturing Plants. Ital. J. Food Saf. 2016, 5, 5793. [Google Scholar] [CrossRef]
  38. Kadam, T.A.; Rupa, L.; Balhal, D.K.; Totewad, N.D.; Gyananath, G. Determination of the degree of hydrophobicity—A technique to assess bacterial colonization on leaf surface and root region of lotus plant. Asian J. Exp. Sci. 2009, 23, 135–139. [Google Scholar]
  39. O’May, C.; Tufenkji, N. The Swarming Motility of Pseudomonas aeruginosa Is Blocked by Cranberry Proanthocyanidins and Other Tannin-Containing Materials. Appl. Environ. Microbiol. 2011, 77, 3061–3067. [Google Scholar] [CrossRef] [Green Version]
  40. Heuer, H.; Krsek, M.; Baker, P.; Smalla, K.; Wellington, E.M. Analysis of actinomycete communities by specific amplification of genes encoding 16S rRNA and gel-electrophoretic separation in denaturing gradients. Appl. Environ. Microbiol. 1997, 63, 3233–3241. [Google Scholar] [CrossRef] [Green Version]
  41. Kim, H.; Hong, Y.; Park, J.; Sharma, V.K.; Cho, S. Sulfonamides and tetracyclines in livestock wastewater. Chemosphere 2013, 91, 888–894. [Google Scholar] [CrossRef]
  42. Jia, A.; Xiao, Y.; Hu, J.; Asami, M.; Kunikane, S. Simultaneous determination of tetracyclines and their degradation products in environmental waters by liquid chromatography–electrospray tandem mass spectrometry. J. Chromatogr. A 2009, 1216, 4655–4662. [Google Scholar] [CrossRef] [PubMed]
  43. Che, Y.; Xia, Y.; Liu, L.; Li, A.-D.; Yang, Y.; Zhang, T. Mobile antibiotic resistome in wastewater treatment plants revealed by Nanopore metagenomic sequencing. Microbiome 2019, 7, 1–13. [Google Scholar] [CrossRef] [PubMed] [Green Version]
  44. O’Flaherty, E.; Borrego, C.M.; Balcázar, J.L.; Cummins, E. Human exposure assessment to antibiotic-resistant Escherichia coli through drinking water. Sci. Total Environ. 2018, 616–617, 1356–1364. [Google Scholar] [CrossRef] [PubMed]
  45. Roberts, M.C.; Schwarz, S. Tetracycline and Chloramphenicol Resistance Mechanisms. In Antimicrobial Drug Resistance: Mechanisms of Drug Resistance, 2nd ed.; Mayers, D.G., Sobel, J.D., Ouellette, M., Kaye, K.S., Marchaim, D., Eds.; Springer International Publishing AG: Cham, Switzerland, 2009; Volume 1, pp. 183–193. [Google Scholar]
  46. Aminov, R.I.; Garrigues-Jeanjean, N.; Mackie, R.I. Molecular Ecology of Tetracycline Resistance: Development and Validation of Primers for Detection of Tetracycline Resistance Genes Encoding Ribosomal Protection Proteins. Appl. Environ. Microbiol. 2001, 67, 22–32. [Google Scholar] [CrossRef] [PubMed] [Green Version]
  47. Connell, S.R.; Tracz, D.M.; Nierhaus, K.H.; Taylor, D.E. Ribosomal Protection Proteins and Their Mechanism of Tetracycline Resistance. Antimicrob. Agents Chemother. 2003, 47, 3675–3681. [Google Scholar] [CrossRef] [Green Version]
  48. Czekalski, N.; Gascón Díez, E.; Burgmann, H. Wastewater as a point source of antibiotic-resistance genes in the sediment of a freshwater lake. ISME J. 2014, 8, 1381–1390. [Google Scholar] [CrossRef]
  49. Liu, H.; Zhou, X.; Huang, H.; Zhang, J. Prevalence of Antibiotic Resistance Genes and Their Association with Antibiotics in a Wastewater Treatment Plant: Process Distribution and Analysis. Water 2019, 11, 2495. [Google Scholar] [CrossRef] [Green Version]
  50. Miettinen, I.T.; Vartiainen, T.; Martikainen, P.J. Bacterial enzyme activities in ground water during bank infiltration of lake water. Water Res. 1996, 30, 2495–2501. [Google Scholar] [CrossRef]
  51. Carpa, R. Enzymological research on soils from different environments. Ann. Romanian Soc. Cell Biol. 2011, XVI, 44–48. [Google Scholar]
  52. Ramnath, L.; Sithole, B.; Govinden, R. Classification of lipolytic enzymes and their biotechnological applications in the pulping industry. Can. J. Microbiol. 2017, 63, 179–192. [Google Scholar] [CrossRef]
  53. McDaniel, C.S.; Wales, M.E.; Carvajal, J.C. Enzymatic Antimicrobial and Antifouling Coating and Polymeric Materials. U.S. Patent 0238811 A1, 24 September 2009. [Google Scholar]
  54. Yigit, N.; Aktas, E.; Dagistan, S.; Ayyildiz, A. Investigating Biofilm Production, Coagulase and Hemolytic Activity in Candida Species Isolated from Denture Stomatitis Patients. Eurasian J. Med. 2011, 43, 27–32. [Google Scholar] [CrossRef] [PubMed]
  55. Coelho, S.M.O.; Reinoso, E.; Pereira, I.A.; Soares, L.C.; Demo, M.; Bogni, C.; Souza, M.M.S. Virulence factors and antimicrobial resistance of Staphylococcus aureus isolated from bovine mastitis in Rio de Janeiro. Pes. Vet. Bras. 2009, 29, 369–374. [Google Scholar] [CrossRef]
  56. Tielen, P.; Kuhn, H.; Rosenau, F.; Jaeger, K.-E.; Flemming, H.-C.; Wingender, J. Interaction between extracellular lipase LipA and the polysaccharide alginate of Pseudomonas aeruginosa. BMC Microbiol. 2013, 13, 159. [Google Scholar] [CrossRef] [Green Version]
  57. Abdulina, D.R.; Kurmakova, I.N.; Bondar, E.S.; Demchenko, N.R.; Bondarenko, A.I. Seasonal Dynamics of Bacteria in Corrosive Biofilms Formed on the Surface of Wastewater Treatment Plants. J. Water Chem. Technol. 2019, 41, 44–51. [Google Scholar] [CrossRef]
  58. Li, D.; Qi, R.; Yang, M.; Zhang, Y.; Yu, T. Bacterial community characteristics under longterm antibiotic selection pressures. Water Res. 2011, 45, 6063–6073. [Google Scholar] [PubMed]
  59. Solano, C.; Echeverz, M.; Lasa, I. Biofilm dispersion and quorum sensing. Curr. Opin. Microbiol. 2014, 18, 96–104. [Google Scholar] [CrossRef] [Green Version]
  60. Shrout, J.D.; Chopp, D.L.; Just, C.L.; Hentzer, M.; Givskov, M.; Parsek, M.R. The impact of quorum sensing and swarming motility on Pseudomonas aeruginosa biofilm formation is nutritionally conditional. Mol. Microbiol. 2006, 62, 1264–1277. [Google Scholar] [CrossRef]
  61. Krasowska, A.; Sigler, K. How microorganisms use hydrophobicity and what does this mean for human needs? Front. Cell Infect. Microbiol. 2014, 4, 112. [Google Scholar] [CrossRef] [Green Version]
  62. Simões, L.C.; Simões, M.; Vieira, M.J. Biofilms interactions between distinct bacterial genera isolated from drinking water. Appl. Environ. Microbiol. 2007, 73, 6192–6200. [Google Scholar] [CrossRef] [Green Version]
  63. Penesyan, A.; Nagy, S.S.; Kjelleberg, S.; Gillings, M.R.; Paulsen, I.T. Rapid microevolution of biofilm cells in response to antibiotics. NPJ Biofilms Microbiomes 2019, 5, 34. [Google Scholar] [CrossRef] [Green Version]
  64. Huang, J.-J.; Hu, H.-Y.; Lu, S.-Q.; Li, Y.; Tang, F.; Lu, Y.; Wei, B. Monitoring and Evaluation of Antibiotic-Resistant Bacteria at a Municipal Wastewater Treatment Plant in China. Environ. Int. 2012, 42, 31–36. [Google Scholar] [CrossRef] [PubMed]
  65. Obayiuwana, A.; Ogunjobi, A.; Yang, M.; Ibekwe, M. Characterization of Bacterial Communities and Their Antibiotic Resistance Profiles in Wastewaters Obtained from Pharmaceutical Facilities in Lagos and Ogun States, Nigeria. Int. J. Environ. Res. Public Health 2018, 15, 1365. [Google Scholar] [CrossRef] [PubMed] [Green Version]
  66. Boehm, A.; Steiner, S.; Zaehringer, F.; Casanova, A.; Hamburger, F.; Ritz, D.; Keck, W.; Ackermann, M.; Shirmer, T.; Jenal, U. Second messenger signalling governs Escherichia coli biofilm induction upon ribosomal stress. Mol. Microbiol. 2009, 72, 1500–1516. [Google Scholar] [CrossRef] [PubMed]
  67. May, T.; Ito, A.; Okabe, S. Induction of Multidrug Resistance Mechanism in Escherichia coli Biofilms by Interplay between Tetracycline and Ampicillin Resistance Genes. Antimicrob. Agents Chemother. 2009, 53, 4628–4639. [Google Scholar] [CrossRef] [Green Version]
  68. Talagrand-Reboul, T.; Jumas-Bilak, E.; Lamy, B. The Social Life of Aeromonas through Biofilm and Quorum Sensing Systems. Front. Microbiol. 2017, 8, 37. [Google Scholar] [CrossRef]
  69. Barati, A.; Ghaderpour, A.; Chew, L.L.; Bong, C.W.; Thong, K.L.; Chong, V.C.; Chai, L.C. Isolation and Characterization of Aquatic-Borne Klebsiella pneumoniae from Tropical Estuaries in Malaysia. Int. J. Environ. Res. Public Health 2016, 13, 426. [Google Scholar] [CrossRef] [Green Version]
  70. Mahapatra, A.; Padhi, N.; Mahapatra, D.; Bhatt, M.; Sahoo, D.; Jena, S.; Dash, D.; Chayani, N. Study of Biofilm in Bacteria from Water Pipelines. J. Clin. Diagn. Res. 2015, 9, DC09–DC11. [Google Scholar] [CrossRef]
  71. Emami, S.; Nikokar, I.; Ghasemi, Y.; Ebrahimpour, M.; Ebrahim-Saraie, H.S.; Araghian, A.; Faezi, S.; Farahbakhsh, M.; Rajabi, A. Antibiotic Resistance Pattern and Distribution of pslA Gene Among Biofilm Producing Pseudomonas aeruginosa Isolated From Waste Water of a Burn Center. Jundishapur J. Microbiol. 2015, 8, e23669. [Google Scholar] [CrossRef] [Green Version]
  72. Brink, A.J.; Coetzee, J.; Clay, C.G.; Sithole, S.; Richards, G.A.; Poirel, L.; Nordmann, P. Emergence of New Delhi metallo-beta-lactamase (NDM-1) and Klebsiella pneumoniae carbapenemase (KPC-2) in South Africa. J. Clin. Microbiol. 2012, 50, 525–527. [Google Scholar] [CrossRef] [Green Version]
  73. Luczkiewicz, A.; Kotlarska, E.; Artichowicz, W.; Tarasewicz, K.; Fudala-Ksiaze, S. Antimicrobial resistance of Pseudomonas spp. isolated from wastewater and wastewater-impacted marine coastal zone. Environ. Sci. Pollut. Res. 2015, 22, 19823–19834. [Google Scholar] [CrossRef] [Green Version]
  74. Stoesser, N.; Mathers, A.J.; Moore, C.E.; Day, N.P.; Crook, D.W. Colistin resistance gene mcr-1 and pHNSHP45 plasmid in human isolates of Escherichia coli and Klebsiella pneumoniae. Lancet Infect. Dis. 2016, 16, 285–286. [Google Scholar] [CrossRef] [Green Version]
  75. King, T.L.B.; Schmidt, S.; Essack, S.Y. Antibiotic resistant Klebsiella spp. from hospital, hospital effluents and wastewater treatment plants in the uMgungundlovu District, KwaZulu-Natal, South Africa. Sci. Total Environ. 2020, 712, 135550. [Google Scholar] [CrossRef] [PubMed]
Figure 1. The relative abundance of ARGs (tetW and tetB) in water samples from the nitrification and sedimentation tanks of wastewater treatment plant (WWTP). Quantity was estimated by real-time PCR and related to the quantity of total bacterial 16S rDNA.
Processes 08 00989 g001
Figure 2. Biofilm formation of isolates from the nitrification tank of wastewater treatment plant incubated in tryptic soy broth (TSB) and nitrification wastewater (WW). Bacterial biofilm measured at 584 nm after 24-h and 120-h incubation at 30 °C.
Processes 08 00989 g002
Figure 3. Biofilm formation of isolates from the sedimentation tank of wastewater treatment plant incubated in tryptic soy broth (TSB) and sedimentation wastewater (WW). Bacterial biofilm measured at 584 nm after 24-h and 120-h incubation at 30 °C.
Processes 08 00989 g003
Figure 4. Hydrophobicity (%) of tetracycline-resistant isolates from the wastewater treatment plant measured at 620 nm. Samples defined the degree of hydrophobicity as hydrophilic (<20%), moderately hydrophobic (20%–50%), and hydrophobic (>50%).
Processes 08 00989 g004
Figure 5. Autoaggregation (%) of tetracycline-resistant isolates from the wastewater treatment plant measured at 600 nm after 5-h and 24-h incubation at 30 °C. Samples defined as weak autoaggregative (<20%) and strong autoaggregative (>70%).
Processes 08 00989 g005
Figure 6. Effect of different concentrations of tetracycline (µg/mL) on bacterial growth (optical density measured at 600 nm) and bacterial biofilm formation (determined with crystal violet assay measured at 584 nm) of selected isolates after 24-h incubation at 30 °C from nitrification tank (NT) and sedimentation tank (ST) of wastewater treatment plant. PC positive control (inoculum without tetracycline); NC negative control (TSB).
Processes 08 00989 g006
Table 1. Phenotypic characteristic (lipase activity, lecithinase activity and haemolytic activity; − negative; + positive) and swimming motility (− negative; + positive; ++ moderately positive; +++ medium positive; ++++ strong positive) of isolates from wastewater treatment plant after 24-h incubation at 30 °C.
SampleLipase ActivityLecithinase ActivityHemolytic ActivityMotility (Swimming)
NT-S-1++α+
NT-S-2++γ
NT-S-3++β+
NT-S-4++γ
NT-S-5++β+
NT-S-6++γ+
NT-S-7+γ
NT-S-8+γ+
NT-S-9++γ+
NT-S-10++β+
ST-S-1γ+
ST-S-2+γ+
ST-S-3++β++
ST-S-4γ++
ST-S-5++γ+
ST-S-6+γ
ST-S-7-γ
ST-S-8++γ+
ST-S-9γ
ST-S-10+γ++
NT-W-1++γ++++
NT-W-2++α+
NT-W-3+γ+
NT-W-4++γ
NT-W-5γ
NT-W-6γ+
NT-W-7++γ+
NT-W-8γ+++
NT-W-9γ
NT-W-10++β++
ST-W-1+γ
ST-W-2γ+
ST-W-3+γ
ST-W-4++α
ST-W-5+γ++
ST-W-6γ
ST-W-7++γ++
ST-W-8++γ++
ST-W-9++γ+
ST-W-10++α+
Table 2. Biofilm formation, hydrophobicity, autoaggregation and motility of isolates from the nitrification tank and sedimentation tank of wastewater treatment plant. TSB-tryptic soy broth; WW—wastewater; 5, 24 and 120 h—time of incubation; NP—non-producer. Little superscript letters in individual columns indicate correlation between parameters (p < 0.05).
SampleBiofilmHydrophobicity dAutoaggregation eMotility f
TSB aWW 24 h bWW 120 h c5 h24 h
NT-S-1WeakWeakWeakHydrophilicModerateModeratePositive c
NT-S-2WeakWeakWeakHydrophilicModerateModerateNegative c
NT-S-3WeakModerateWeakHydrophilicModerateModeratePositive c
NT-S-4WeakWeakWeakHydrophilicWeakModerateNegative c
NT-S-5WeakWeakWeakModerately hydrophobicWeakModeratePositive c
NT-S-6WeakWeakWeakModerately hydrophobicWeakModeratePositive c
NT-S-7WeakWeakWeakHydrophilicModerateModerateNegative c
NT-S-8WeakWeakWeakModerately hydrophobicModerateModeratePositive c
NT-S-9WeakWeakWeakHydrophilicWeakModeratePositive c
NT-S-10WeakWeakWeakHydrophilicWeakWeakPositive c
ST-S-1WeakWeak aWeak aHydrophilic bWeakModeratePositive
ST-S-2WeakWeak aWeak aModerately hydrophobic bWeakModeratePositive
ST-S-3WeakWeak aWeak aModerately hydrophobic bWeakModerateModerately positive
ST-S-4ModerateWeak aWeak aHydrophilic bWeakModerateModerately positive
ST-S-5NPWeak aNP aModerately hydrophobic bWeakWeakPositive
ST-S-6WeakWeak aNP aModerately hydrophobic bModerateStrongNegative
ST-S-7WeakWeak aWeak aHydrophilic bWeakModerateNegative
ST-S-8NPWeak aNP aModerately hydrophobic bWeakModeratePositive
ST-S-9WeakWeak aWeak aHydrophilic bModerateModerateNegative
ST-S-10WeakWeak aWeak aModerately hydrophobic bWeakModerateModerately positive
NT-W-1ModerateWeakWeakHydrophilic eWeakModerateStrong positive
NT-W-2WeakWeakWeakHydrophilic eModerateModeratePositive
NT-W-3ModerateWeakWeakModerately hydrophobic eModerateModeratePositive
NT-W-4WeakWeakWeakHydrophilic eWeakModerateNegative
NT-W-5WeakWeakWeakHydrophilic eWeakModerateNegative
NT-W-6ModerateWeakWeakHydrophilic eModerateModeratePositive
NT-W-7ModerateModerateWeakHydrophilic eWeakModeratePositive
NT-W-8WeakWeakWeakHydrophilic eModerateModerateMedium positive
NT-W-9ModerateWeakWeakHydrophilic eWeakModerateNegative
NT-W-10ModerateWeakWeakHydrophilic eWeakModerateModerately positive
ST-W-1WeakWeak aWeak aHydrophilicWeak cModerate cNegative
ST-W-2WeakWeak aWeak aHydrophilicWeak cModerate cPositive
ST-W-3WeakWeak aNP aHydrophilicWeak cModerate cNegative
ST-W-4WeakNP aWeak aHydrophilicWeak cModerate cNegative
ST-W-5WeakWeak aWeak aHydrophilicWeak cModerate cModerately positive
ST-W-6WeakWeak aWeak aModerately hydrophobicWeak cModerate cNegative
ST-W-7WeakWeak aNP aModerately hydrophobicWeak cModerate cModerately positive
ST-W-8WeakWeak aNP aHydrophilicWeak cModerate cModerately positive
ST-W-9WeakNP aNP aModerately hydrophobicWeak cModerate cPositive
ST-W-10WeakNP aWeak aModerately hydrophobicWeak cModerate cPositive
a—correlation between biofilm formation in the TSB and the given parameter; b—correlation between biofilm formation in wastewater after 24 h of incubation and the given parameter; c—correlation between biofilm formation in wastewater after 120 h of incubation and the given parameter; d—correlation between hydrophobicity and the given parameter; e—correlation between autoaggregation and the given parameter; f—correlation between motility and the given parameter.
Table 3. Minimum inhibitory concentration (MIC), minimum bactericidal concentration (MBC), sequence identification and detected antibiotic resistance genes (tet) of selected isolates. TET tetracycline; – negative; + positive.
SampleMIC TET [µg/mL]MBC TET [µg/mL]IdentificationtetAtetBtetMtetOtetW
NT-S-30.2500.500Aeromonas salmonicida++
NT-S-80.2500.500Aeromonas salmonicida+
ST-S-22.0004.000Aeromonas salmonicida+
ST-S-50.5001.000Aeromonas sp.+
NT-W-40.2500.500Aeromonas sp.+
NT-W-70.5001.000Klebsiella pneumoniae+
ST-W-24.0008.000Pseudomonas sp.+
ST-W-100.5000.500Aeromonas sp.+

