Article

Influence of the Lamination Process on the Wetting Behavior and the Wetting Rate of Lithium-Ion Batteries

1
Institute of Machine Tools and Production Technology, Technische Universität Braunschweig, 38106 Braunschweig, Germany
2
Battery LabFactory Braunschweig, Technische Universität Braunschweig, 38106 Braunschweig, Germany
3
Institute of Environmental and Sustainable Chemistry, Technische Universität Braunschweig, 38106 Braunschweig, Germany
*
Author to whom correspondence should be addressed.
Submission received: 30 September 2021 / Revised: 15 October 2021 / Accepted: 15 October 2021 / Published: 19 October 2021

Abstract

:
In lithium-ion battery manufacturing, wetting of active materials is a time-critical process. Consequently, the impact of possible process chain extensions such as lamination needs to be explored to potentially improve the efficiency of the electrode and separator stacking process in battery cell manufacturing. This paper addresses the research gap of the unexplored effects of lamination on the wetting rate of electrode-separator assemblies in pouch cells. Based on the triangulation of three measurement techniques (gravimetric, optical, electrochemical), a correlation between lamination and wettability of electrode-separator assemblies is experimentally demonstrated, thus providing an important research contribution.

1. Introduction

In the light of increasing CO2 emissions and their impact on the global climate, battery technology in particular, as a short-term alternative to the internal combustion engine in the automotive industry, plays a central role in climate-neutral production. The demand for battery cells, and in particular lithium-ion batteries, has been rising for years, and a further increase is forecast for the next several years [1]. These increasing demands are contrasted by various challenges on the battery cell production side: High energy and power density, low process times, reliable safety concepts, high quality, and low costs [2]. Within the process chain of battery production, these challenges can be addressed at different stages. Promising process steps to reduce process time and production costs are electrolyte filling and wetting [3]. These are quality-critical process steps since without sufficient wetting of all cell components, optimal performance of the cell is not achieved by formation, and, in the worst case, cell failure occurs [4]. In practice, this aspect leads to long storage times during the wetting process to ensure complete wetting and to avoid quality degradation during formation. Typically, storage times could take up to 24 h [3]. This is in contrast to upstream processes with high throughput, such as electrode coating at 25 to 50 m per minute, calendering at 30 to 100 m per minute, or stacking at 15 compartments per minute [2].
In order to investigate and better understand these property relationships of the wetting process, different measurement methods have been developed. On the one hand, the wetting properties of battery materials can be determined in detail as measured by optical capillary rise test in the flat plane [5] and for horizontal samples [6] or by wetting balance tests [7,8]. On the other hand, wetting can also be assessed in the cell compound. For this purpose, radiographic methods such as neutron radiography [9,10], X-rays [11], or infrared thermography [12] are used. In addition, there are first promising applications for the use of ultrasound as an inline wetting measurement method [13]. Besides, electrochemical methods provide access to investigations of the electrolyte wetting process. Above all, the measurement of the cell resistance as a function of the wetting time can provide a wide range of information about the wetting behavior of battery cells. Here, electrochemical impedance spectroscopy (EIS) can be used to determine this quantity [14,15]. The electrochemical methods can not only be used to study the influence of various cell components on electrolyte wetting, but also be for standardized inline investigations of individual battery cells within the production process. This way, storage times that occur before the cell formation can be significantly reduced, thus saving production costs. Another benefit of the electrochemical methods is that they allow the detection of microscopic wetting. Thus, the electrolyte inflow into the electrode pores can also be investigated [15]. The knowledge gained serves as a starting point for new processes [16] or material improvements [17,18,19] to accelerate wetting without having to accept quality losses.
The duration of wetting is subject to a complex relationship of different process-structure-property relationships. Although the wettability depends particularly on the material properties of the electrodes, the separator, and the electrolyte [12], other parameters such as the type of cell stack assembly (stack vs. jelly roll), which affects the diffusion path and distance, or the geometric dimensions of the electrodes can also influence the duration of wetting [20]. Likewise, process parameters of electrolyte filling, such as evacuation pressure, also influence the wetting time. In addition to material-related influences or process-related influences from the electrolyte filling process, process steps that precede electrolyte filling can also have an impact on the wettability of the cell components or the cell assembly. The process step lamination, in which the electrode and the separator suitable for lamination are joined together by applying temperature and pressure, represents such a process step. The material bond between the electrode and the separator creates an electrode-separator composite with advantageous mechanical properties such as increased bending stiffness or fixed individual components [21], advantageous electrochemical properties such as improved fast-charging properties in the cell assembly [22], and promising properties with regard to electrolyte wetting. Due to the material bond between separator and electrode, dead volume in which electrolyte accumulates can be avoided between these two layers. Additionally, due to the connection of separator and electrodes and the resulting interface between them, capillary effects can occur, which accelerate the wetting process.
While there are numerous studies on the material-specific wetting properties, the authors are not aware of any publications on the wetting properties of electrode-separator laminates. This leads to the central question for this research contribution, namely whether and to what extent lamination influences the wetting properties of the cell composite. For this purpose, various measurement methods were applied, and their results were compared with each other in order to compare the significance of the methods with regard to wetting.

2. Materials and Methods

2.1. Materials

The identical electrode material manufactured by CustomCell was used for all experiments. The cathode consisted of 95.5% NMC-622 with 3% conductive additive and 1.5% PVDF as a binder, each with a 60 µm thick active material on a double-sided coated 15 µm thick aluminum conductor. The anode was composed of 94% SMGMK1C graphite, 2%CMC, 3% SBR, and 1% C65 and had a thickness of 73 µm per layer on a 10 µm thick copper conductor. The separator was a P.E monolayer with a ceramic and PVDF coating and a total thickness of 24 µm. The additional PVDF coating on the separator surface enables lamination. The used electrolyte LP572 is a composition of 1 M LiPF6 in 30 wt.% E.C and 70 wt.% EMC with an additional 2 wt.% V.C.

2.2. Methods

With the goal of obtaining meaningful results that are as holistic as possible, data were triangulated using three different measurement methods (gravimetric, optical, and electrochemical) to determine the wetting rate of laminated electrode-separator assemblies for pouch cells. The gravimetric experiments in test series 1 (VR1) determine the wetting rate effects via the mass increase in the sample material, whereas the optical method (VR2) visually records the rise in height and the electrochemical experiments (VR3) measure the change in resistance to infer the wetting rate effects of lamination.
VR1 and VR2 were measured simultaneously with the same sample, but with different methods, whereby the electrolyte always remains at a temperature of 20 °C. Each of the experimental data points listed below was repeated three times with punched out samples of 20 mm × 40 mm in size under uniform conditions in the drying room (dew point −40 °C, 20 °C ambient temperature):
(i)
cathode—separator (non-laminated)
(ii)
cathode—separator (laminated at 120 °C, contact pressure of 5.5 Nmm−2)
(iii)
cathode—separator (laminated at 80 °C, contact pressure of 5.5 Nmm−2)
(iv)
anode—separator (non-laminated)
(v)
anode—separator (laminated at 120 °C, contact pressure of 5.5 Nmm−2)
(vi)
anode—separator—cathode as a compartment (non-laminated)
(vii)
anode—separator—cathode (laminated at 130 °C, contact pressure of 5.5 Nmm−2)
The electrode-separator laminates used in VR1 and VR2 were all laminated using the SDL 50 pro lamination system from company Polatek SL-Laminiertechnik GmbH at a feed rate of 1 mm/min by pressing the electrode and the separator with two heated rollers together to form a material bond between them.

2.2.1. Gravimetric Measurement (VR1)

The DCAT25 tensiometer from DataPhysics Instruments GmbH was used for the gravimetric measurement. As shown in Figure 1, the measuring device consists of an electronic balance with a retainer for positioning samples (i)–(vii) and a height-adjustable sample repository for the electrolyte so that the sample material is immersed in the liquid after the sample repository has moved. From the moment of immersion, the balance located at the top measures the electrolyte mass absorbed by the capillary forces in the porous cell stack material.
Using the modified Lucas-Washburn Equation, which describes the mass increase in porous media due to an infiltrated liquid by means of a root function (3), the penetration rate K can be determined experimentally.
With the use of the modified Lucas-Washburn differential Equation (1), which describes the increase in porous media by an infiltrated liquid, the time course of the rise time of the liquid can be described by a root function. A quantitative comparison can be made via the parameter wetting rate k (mm/s0.5). Experimentally, this is determined via the mass increase according to Equation (3). The parameter K (g/s0.5), directly determinable here, is called penetration rate. This is composed of the material-specific parameters of the solid sample, the effective capillary radius reff, porosity P, cross-sectional area A, the material-specific parameters of the liquid samples, surface tension σ, viscosity η, density ρ, and the contact angle θ, which depends on the interaction between the solid and liquid sample.
d h d t = r e f f ¯ · σ · cos ( θ ) 4 η h
h = k · t ,     k = r e f f ¯ · cos ( θ ) · σ 2 η
m = h ρ · A · P = K · t ,     K = k · A · P · ρ = r e f f ¯ · A 2 · P 2 · cos ( θ ) · ρ 2 · σ 2 η
For the experiment, a self-developed, 3D-printed sample holder was used, which allows multilayer material combinations to be measured simultaneously (Figure 1). For this purpose, two plastic parts were printed, which fixed the respective samples with six magnets and a force of 750 mbar on a glass plate with a large-area recess. The force thus applied corresponds to the regular differential pressure of the pouch cell to its ambient pressure after filling and sealing.

2.2.2. Optical Measurement (VR2)

The optical measurement runs simultaneously to VR1, accordingly it uses the identical tensiometer test setup, but extends it to include a camera installation for optical sensing of the dispersion of the electrolyte in the sample material. The camera was mounted laterally in such a way that it focused perpendicularly on the glass surface of the sample holder on the separator side since, consequently, the substrate of the underlying active material could be photographed in sharp focus. The only very slight loss of visibility due to the plastic holder of the self-manufactured sample holder enables precise recording of the geometric distribution of the electrolyte over the entire glass surface. In this process, the camera (monochrome camera from company IDS Imaging Development Systems GmbH) registered one image per second, and the exposure of the tensiometer was sufficient. Subsequently, both qualitative and quantitative evaluation of the optically determined rise height as a function of time was performed, which can be averaged according to the centroid of the wetted surface and thus provides optical conclusions about the wetting rate in the lamination process. Quantitatively, the evaluation was based on the grayscale values of the photos, which were then set in relation to the visible sample area, while qualitatively, the wetting front was additionally categorized on the basis of the criteria straight-/v-/u-shaped as well as left/right-heavy.
The evaluation of the average height over the centroid of the area is done by summing the wetted pixels nwetted, multiplying the number of pixels by the pixel size APixel, (here: (0.08467 mm)2) to then divide the resulting wetted area by the sample width w (20 mm) (see Equation (4)).
In the case of the non-laminated compound, the separator and the cathode have different wetting rates; yet, for the evaluation in the compound, the determination of a common averaged rise height havg (as a purely theoretical quantity) is necessary. This value is calculated by mathematically averaging the pore volume fraction of the materials (electrode ele and separator sep) relative to the total pore volume, where the pore volume is the product of porosity P, sample height h, and sample cross-area A of the sample in the sample holder (Equation (5)). The common pore volume Pavg is calculated relative to the proportion of the entire area Aavg (Equation (6)).
h = A P i x e l · i = w e t t e d n i w
h a v g = 1 A a v g · P a v g i = e l e , s e p h i · A i · P i
P a v g = i = e l e , s e p A i · P i A a v g ,     A a v g = i = e l e , s e p A i

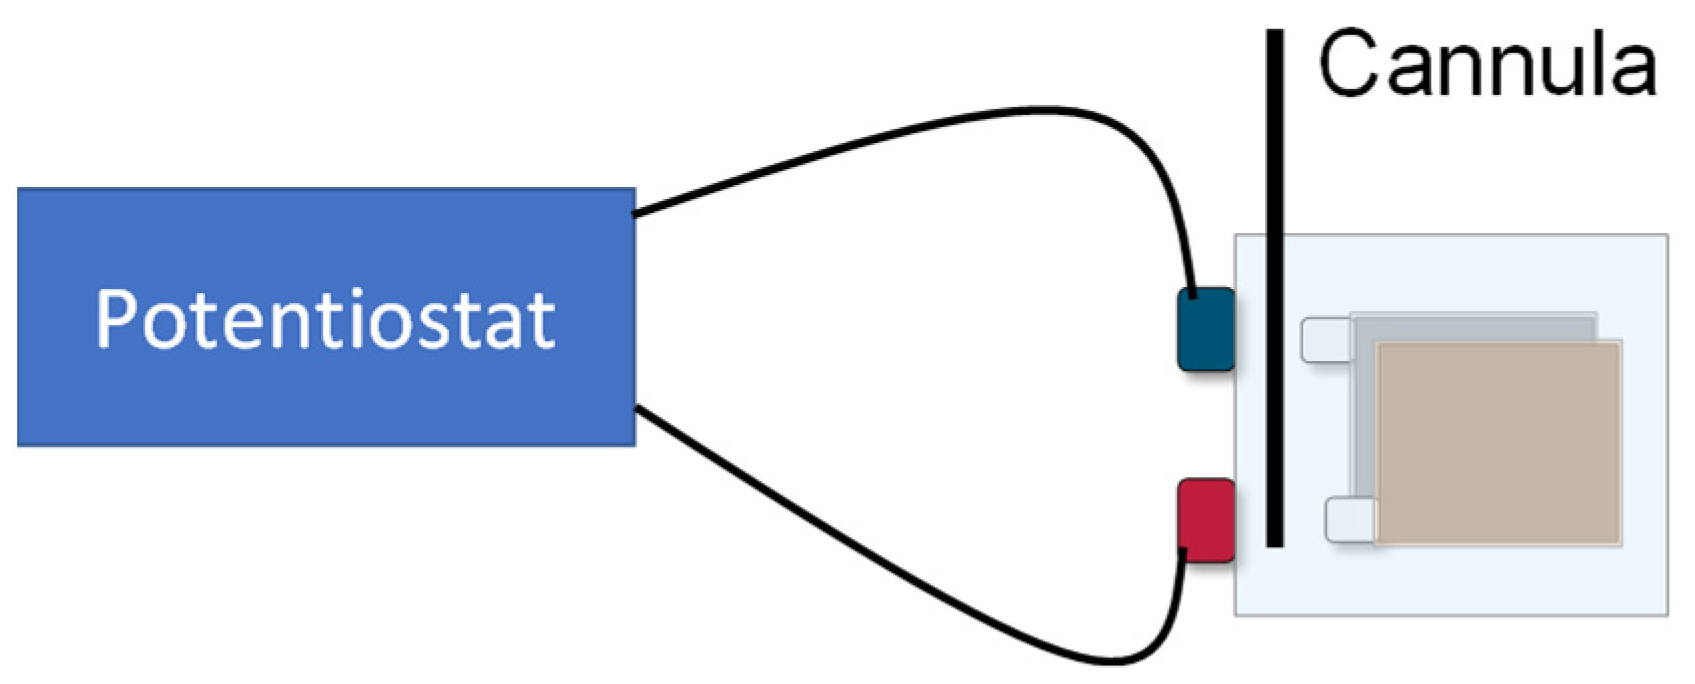
2.2.3. Electrochemical Measurement (VR3)

The third series of experiments had a different experimental setup from VR1 and VR2: For the electrochemical measurement, entire cathode sheets with separators were prepared in BLB1-format (cathode 45 × 65 mm2, anode 50 × 70 mm2) and laminated at a contact pressure of 5.5 Nmm−2 at 80 °C and at 120 °C. These cathode-separator compounds were then assembled with an anode to form single-layer pouch cells. Again, three cells were measured per experimental data point:
(i)
cathode—separator (non-laminated)
(ii)
cathode—separator (laminated at 80 °C, contact pressure of 5.5 Nmm−2)
(iii)
cathode—separator (laminated at 120 °C, contact pressure of 5.5 Nmm−2)
The cells had a special design with one unsealed edge. This way, the samples could be connected to a potentiostat (SP 150 from Biologic SAS) before the electrolyte filling. The electrochemical investigations were performed inside a glovebox with an argon atmosphere. Following preliminary investigations, the electrolyte was added to the outmost position of the cells. For each cell, 1 mL LP572 was used. The electrolyte was filled using a cannula, which was inserted to the lower edge of the cells (cf. Figure 2).
Simultaneously with the electrolyte filling, electrochemical impedance measurements were started to investigate the wetting progress. The impedance of the cells was measured in the potentiostatic mode every 30 s within a frequency range of 10 kHz down to 1 Hz. The various frequencies were logarithmically spaced and six points per decade were recorded. Each frequency was measured twice and averaged to suppress experimental noise. As an early formation of the cells must be avoided, a low excitation amplitude of 5 mV was applied. The investigations were carried out at ambient temperature.

3. Results

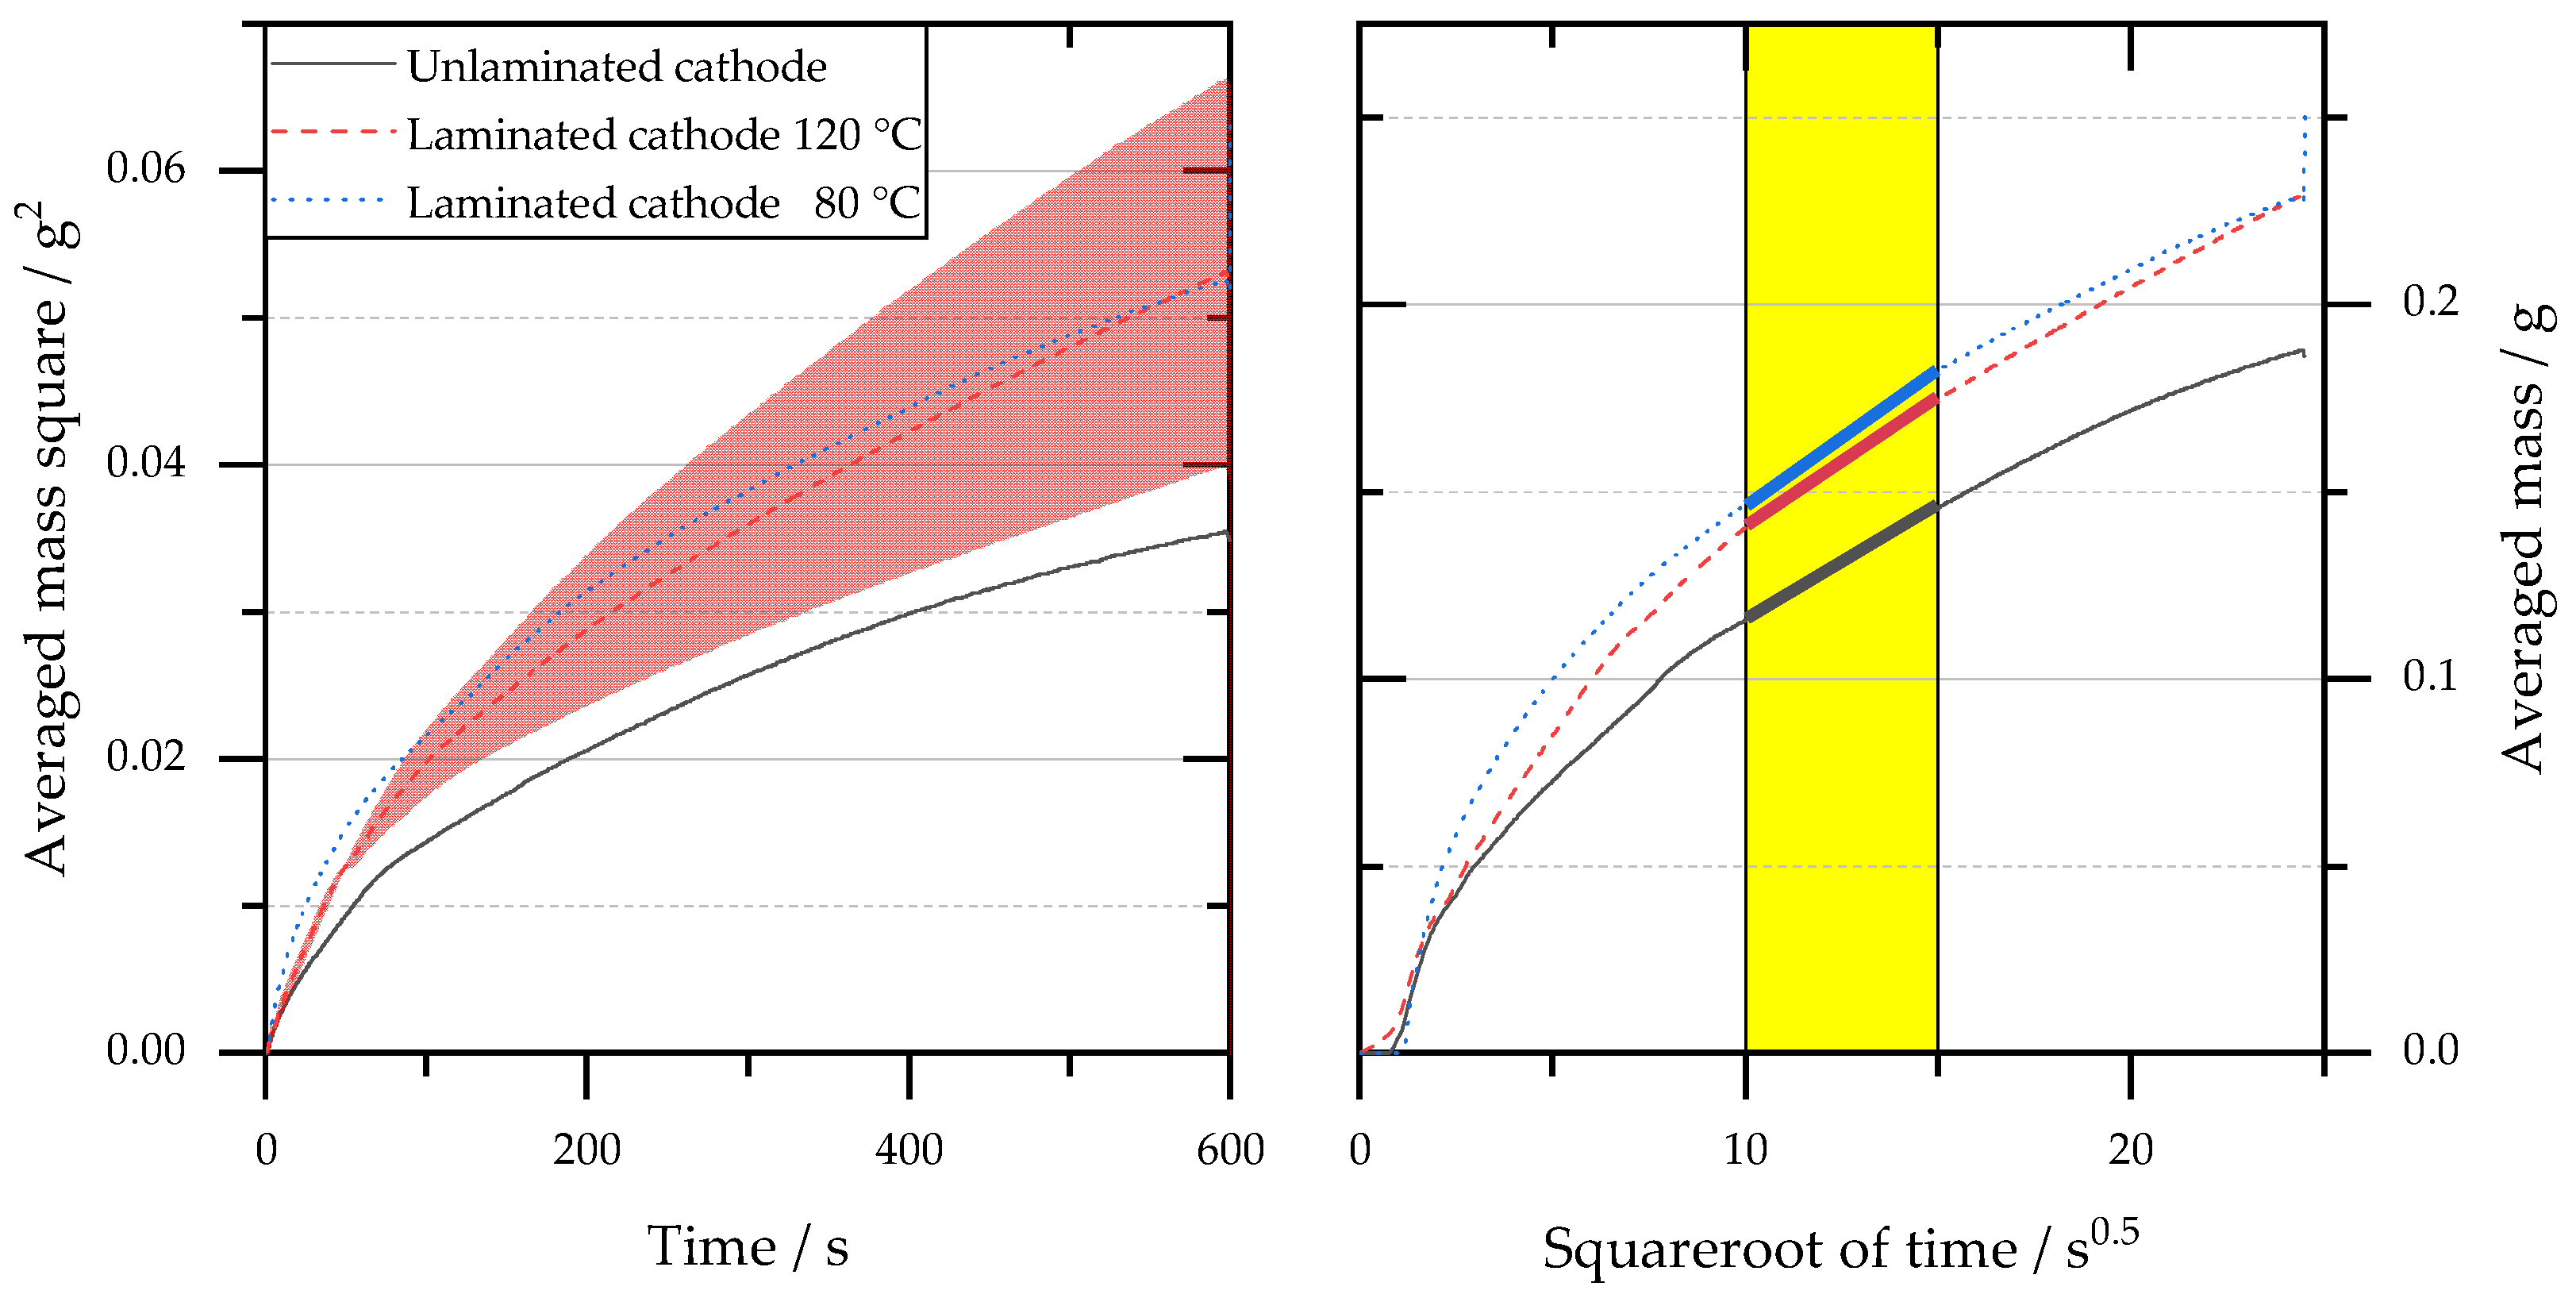
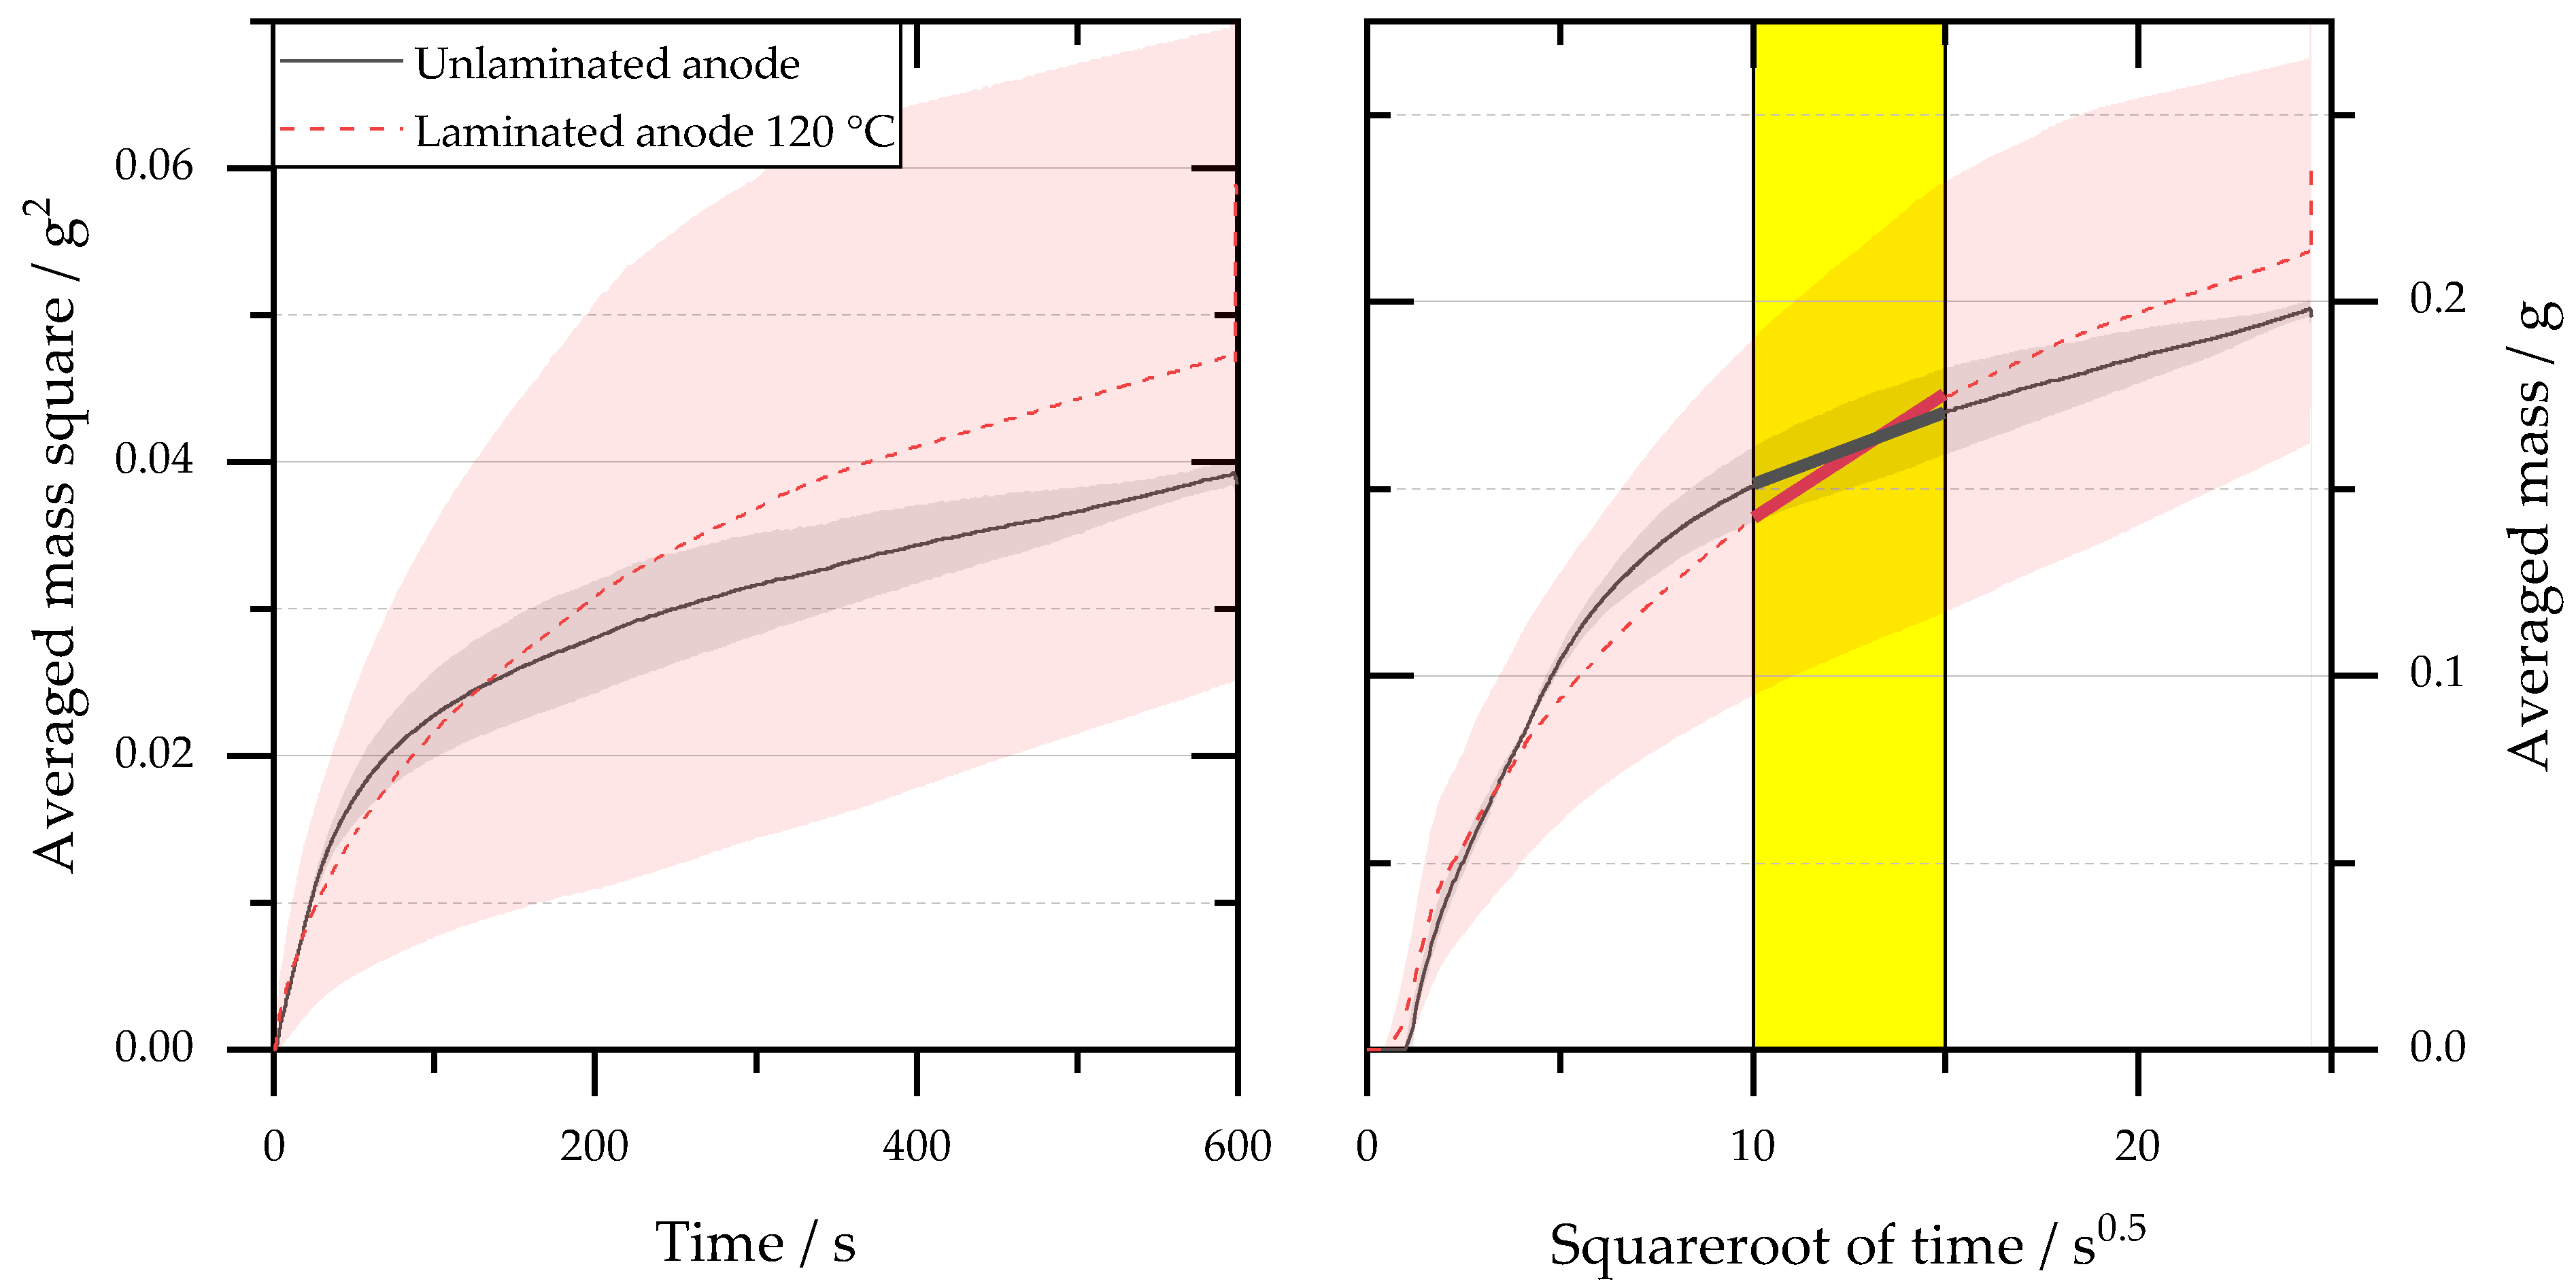
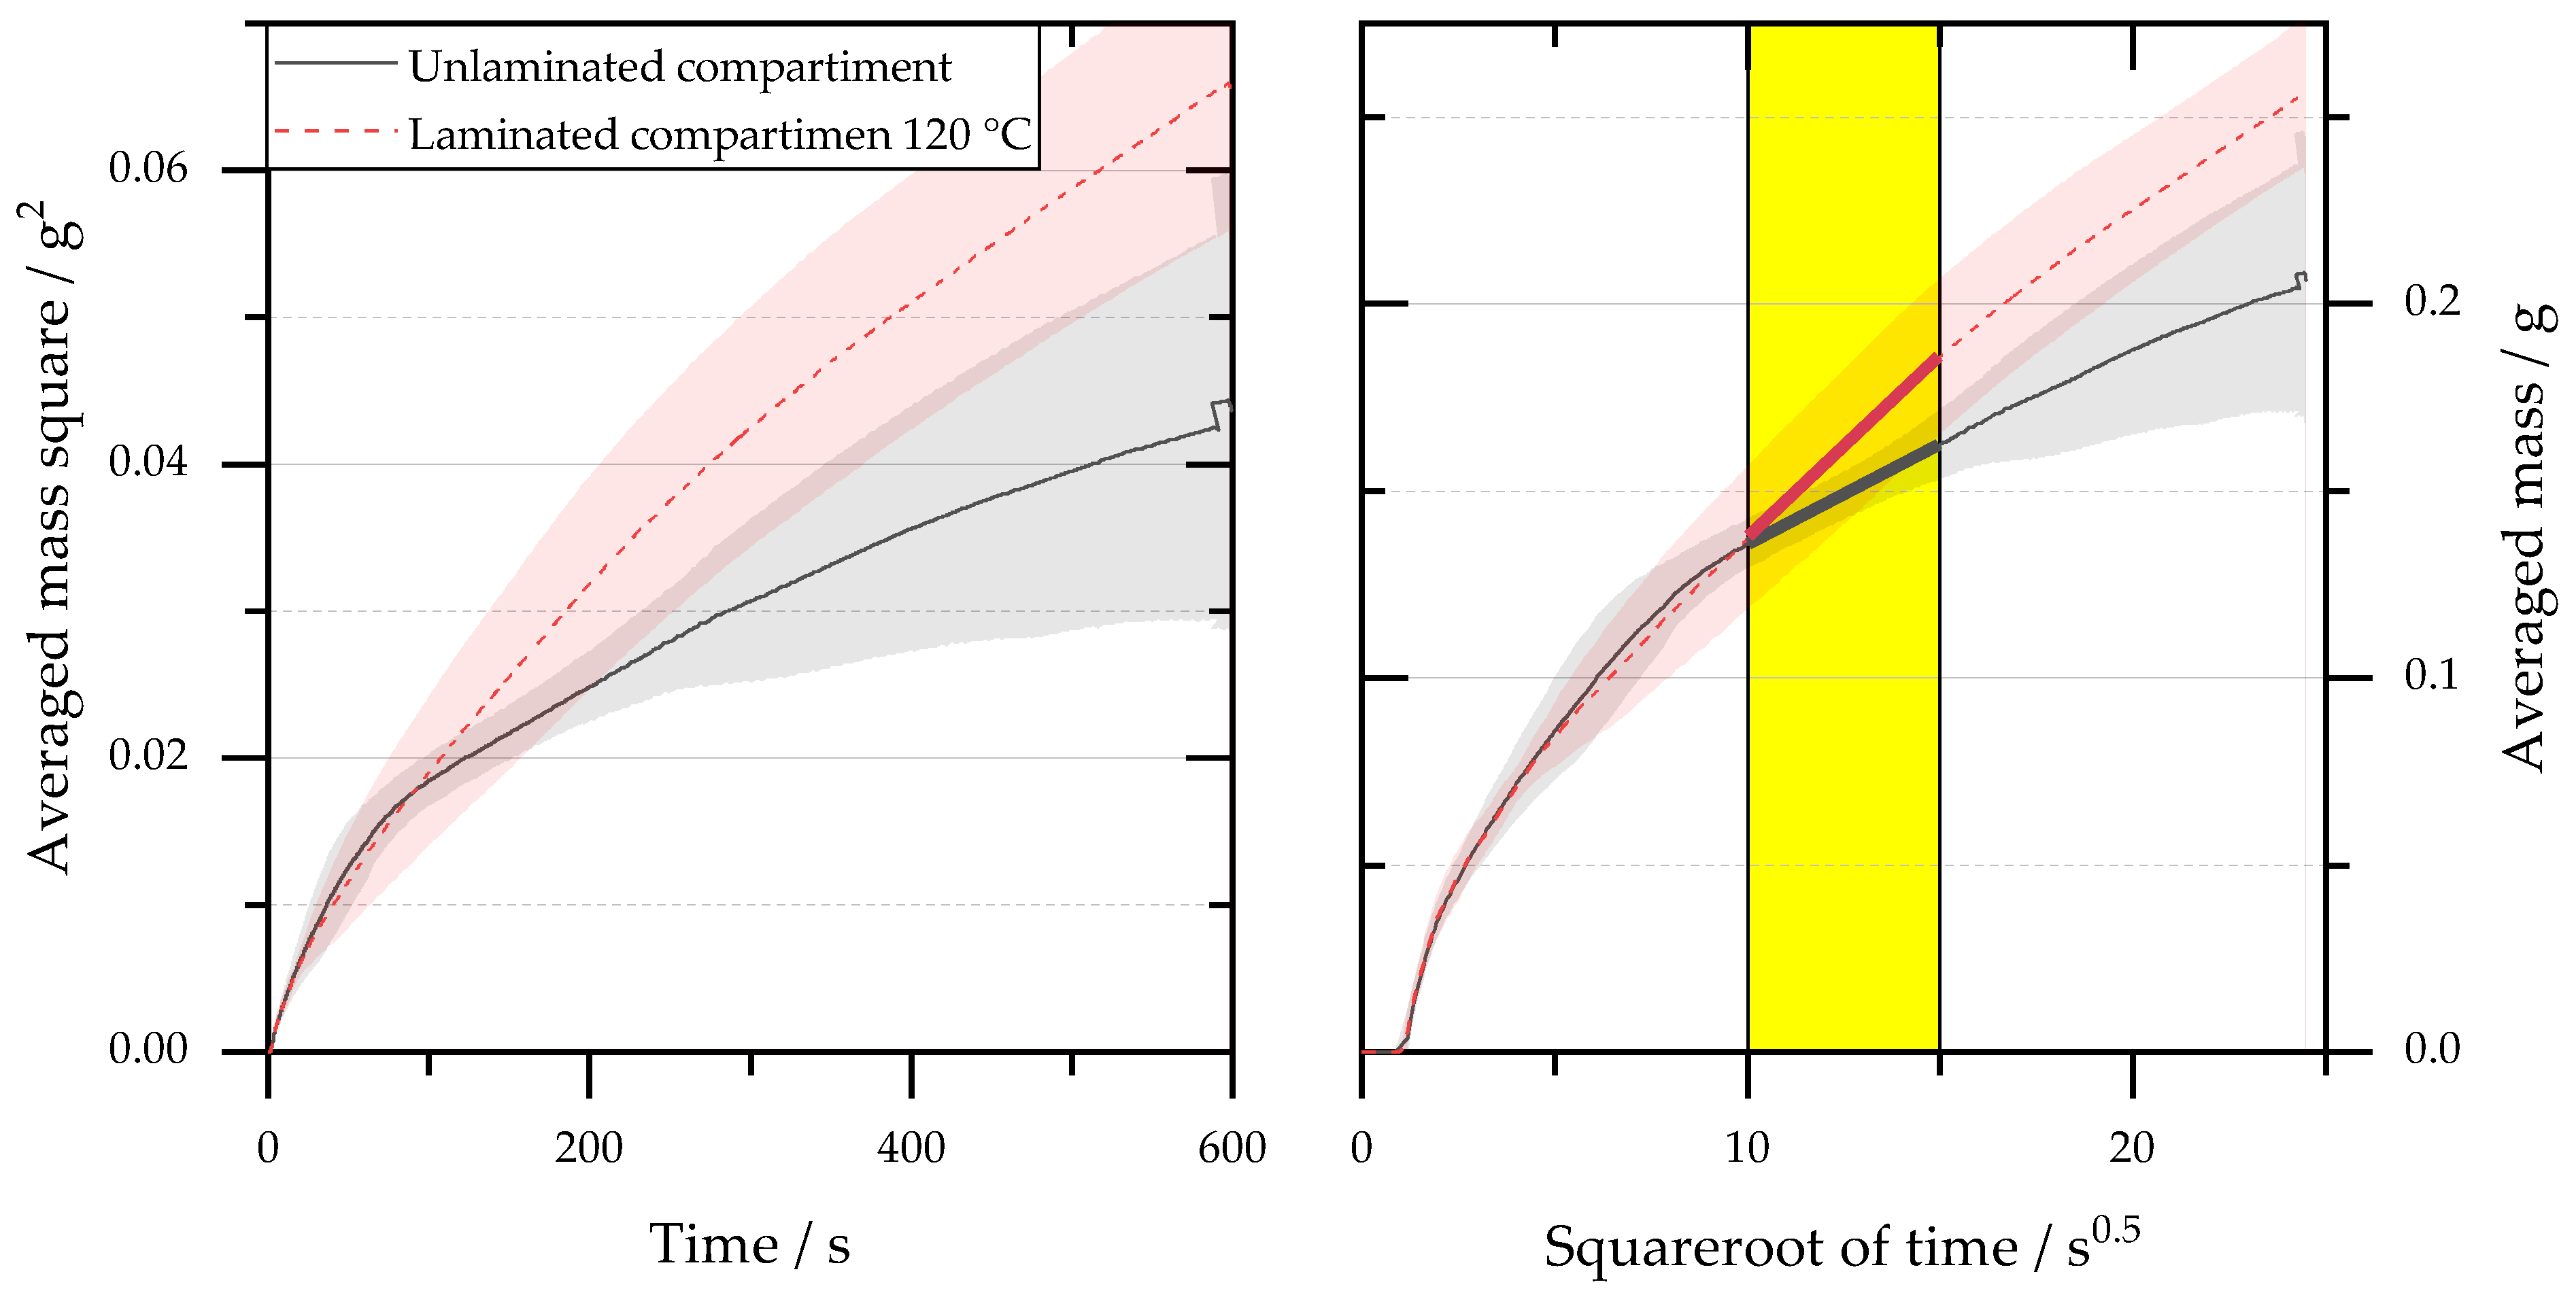
3.1. Gravimetric Measurement

The left part of Figure 3 illustrates the m2-t diagram of the tensiometer measurement for the cathode tests i–iii with the associated standard deviations. All data points show the typical degressive behavior of a root function and thus the expected curve of the experiment. In the right picture, the m-t0.5 graph is shown, which was linearized by the transformation of the m2-t graph using a root function. The slope of the graphs was evaluated in the time interval of 10–15 s0.5 to determine the penetration rate K.
Qualitatively, it can be seen from the left graph (the bigger increase in the measured electrolyte mass) and quantitatively from the right graph (higher slope of the graphs) that the wetting for the experimental points ii and iii of the laminated samples is stronger than the wetting of the non-laminated sample (i). The quantitative results of the evaluation are shown in Table 1. Both samples with a lamination temperature of 80 °C as well as with a lamination temperature of 120 °C led to an increase in the penetration rate. This increase shows a significant difference (5% significance level). No differences can be detected between the lamination temperatures with respect to the penetration rate K, which is converted into the wetting rate k by means of Equation (3). The latter indicates the experimentally determined height of rise from the gravimetric measurement and serves as a comparative value to the measurement result of the optical test VR1.
As expected, the same qualitative test results with regard to the penetration rate were obtained for the test series of the anode (iv–v) and the compartment (vi–vii), see Appendix A Figure A1 and Figure A2. The laminated samples wetted significantly better than the non-laminated samples. The reason for the improved wetting is assumed to arise from the interconnection between the cellular materials. Wetting between the materials is more distinct via the pronounced PVDF bridges (trans-material wetting). The formation of thin channels/pore systems is also possible, which serve as new wetting pathways in the way of a new wetting layer.

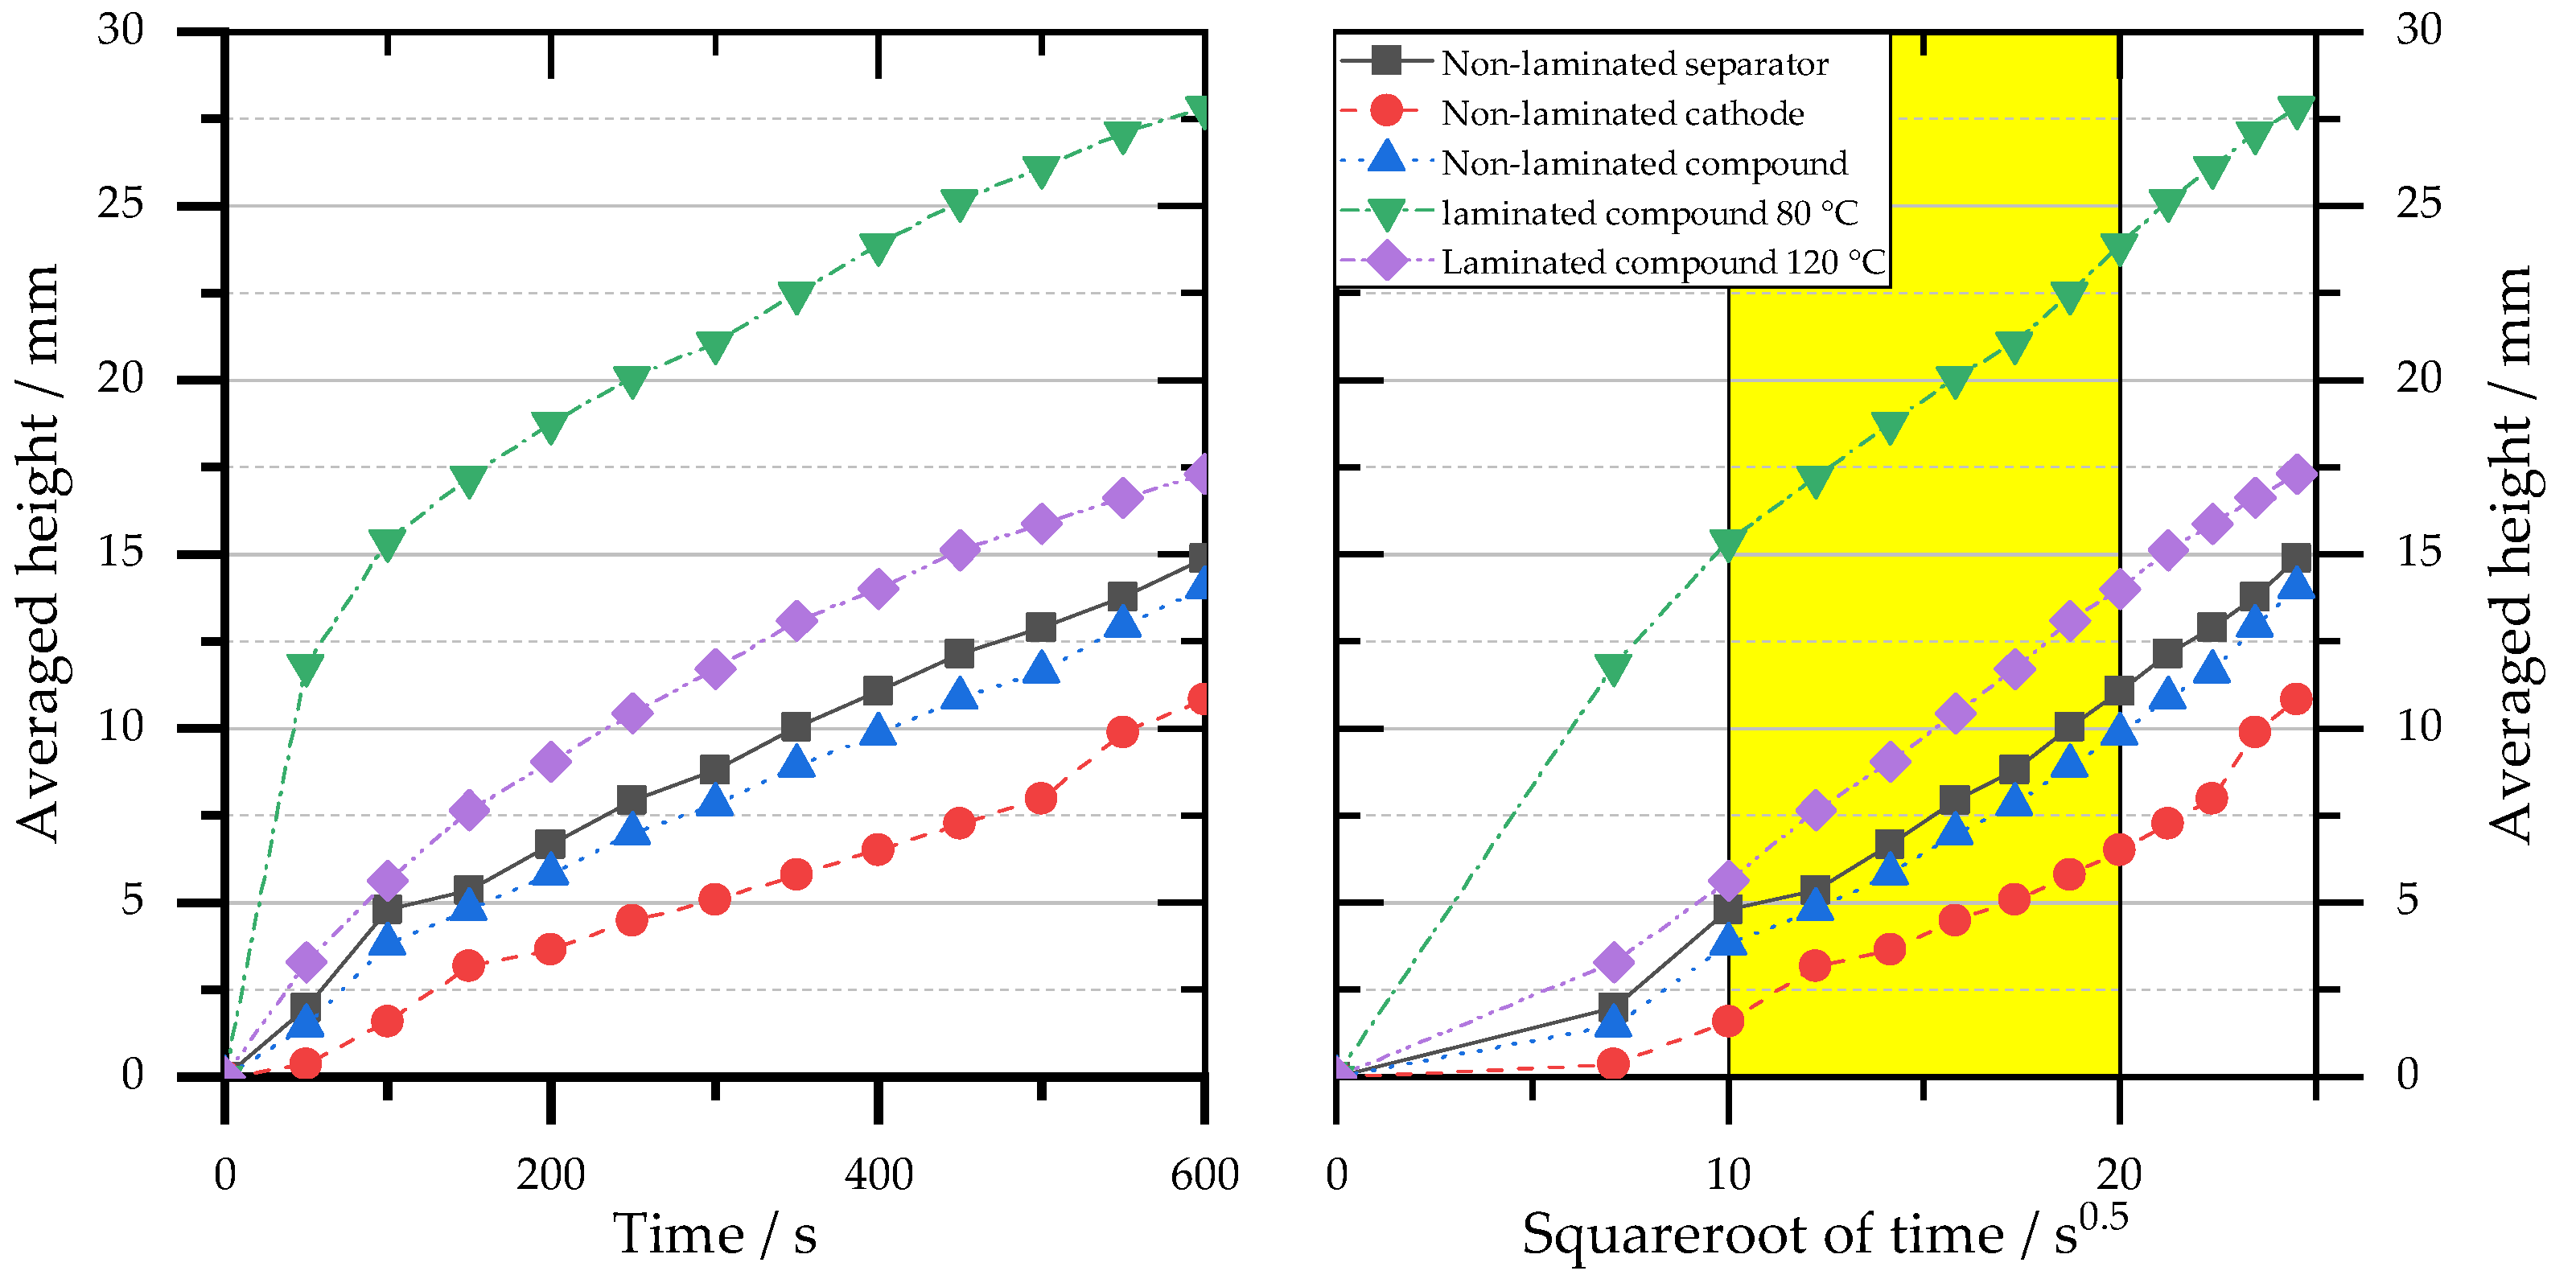
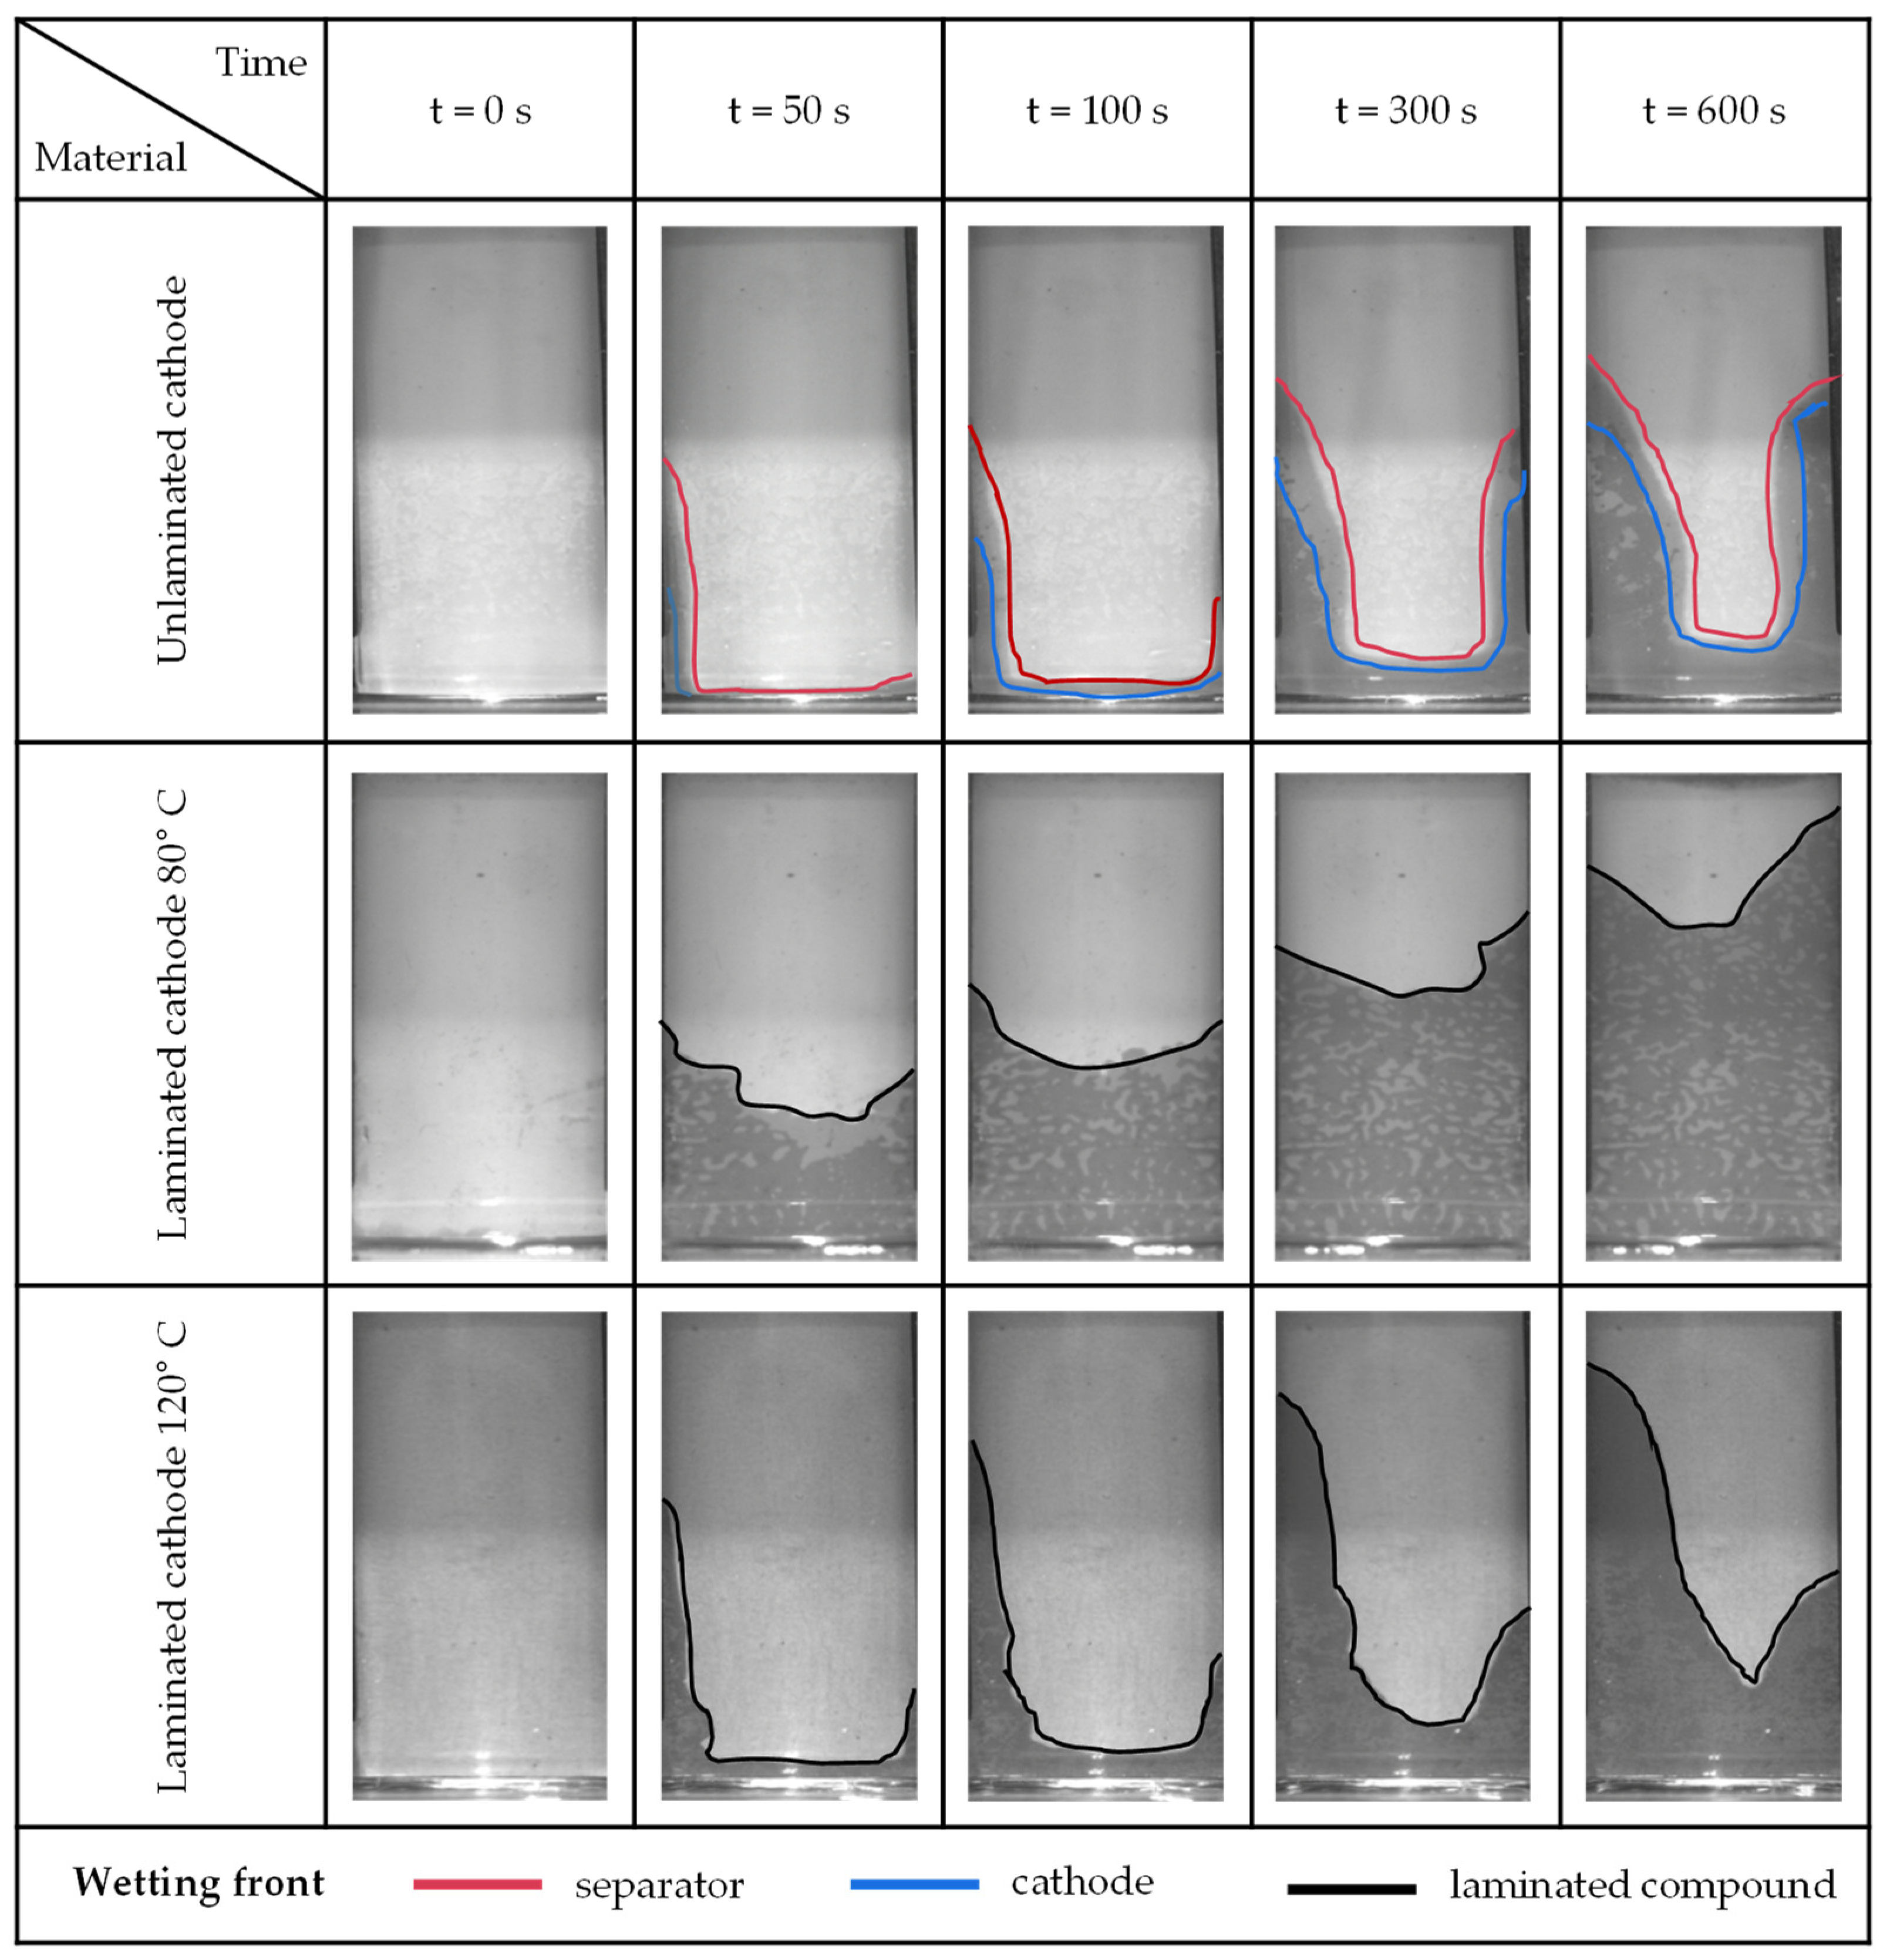
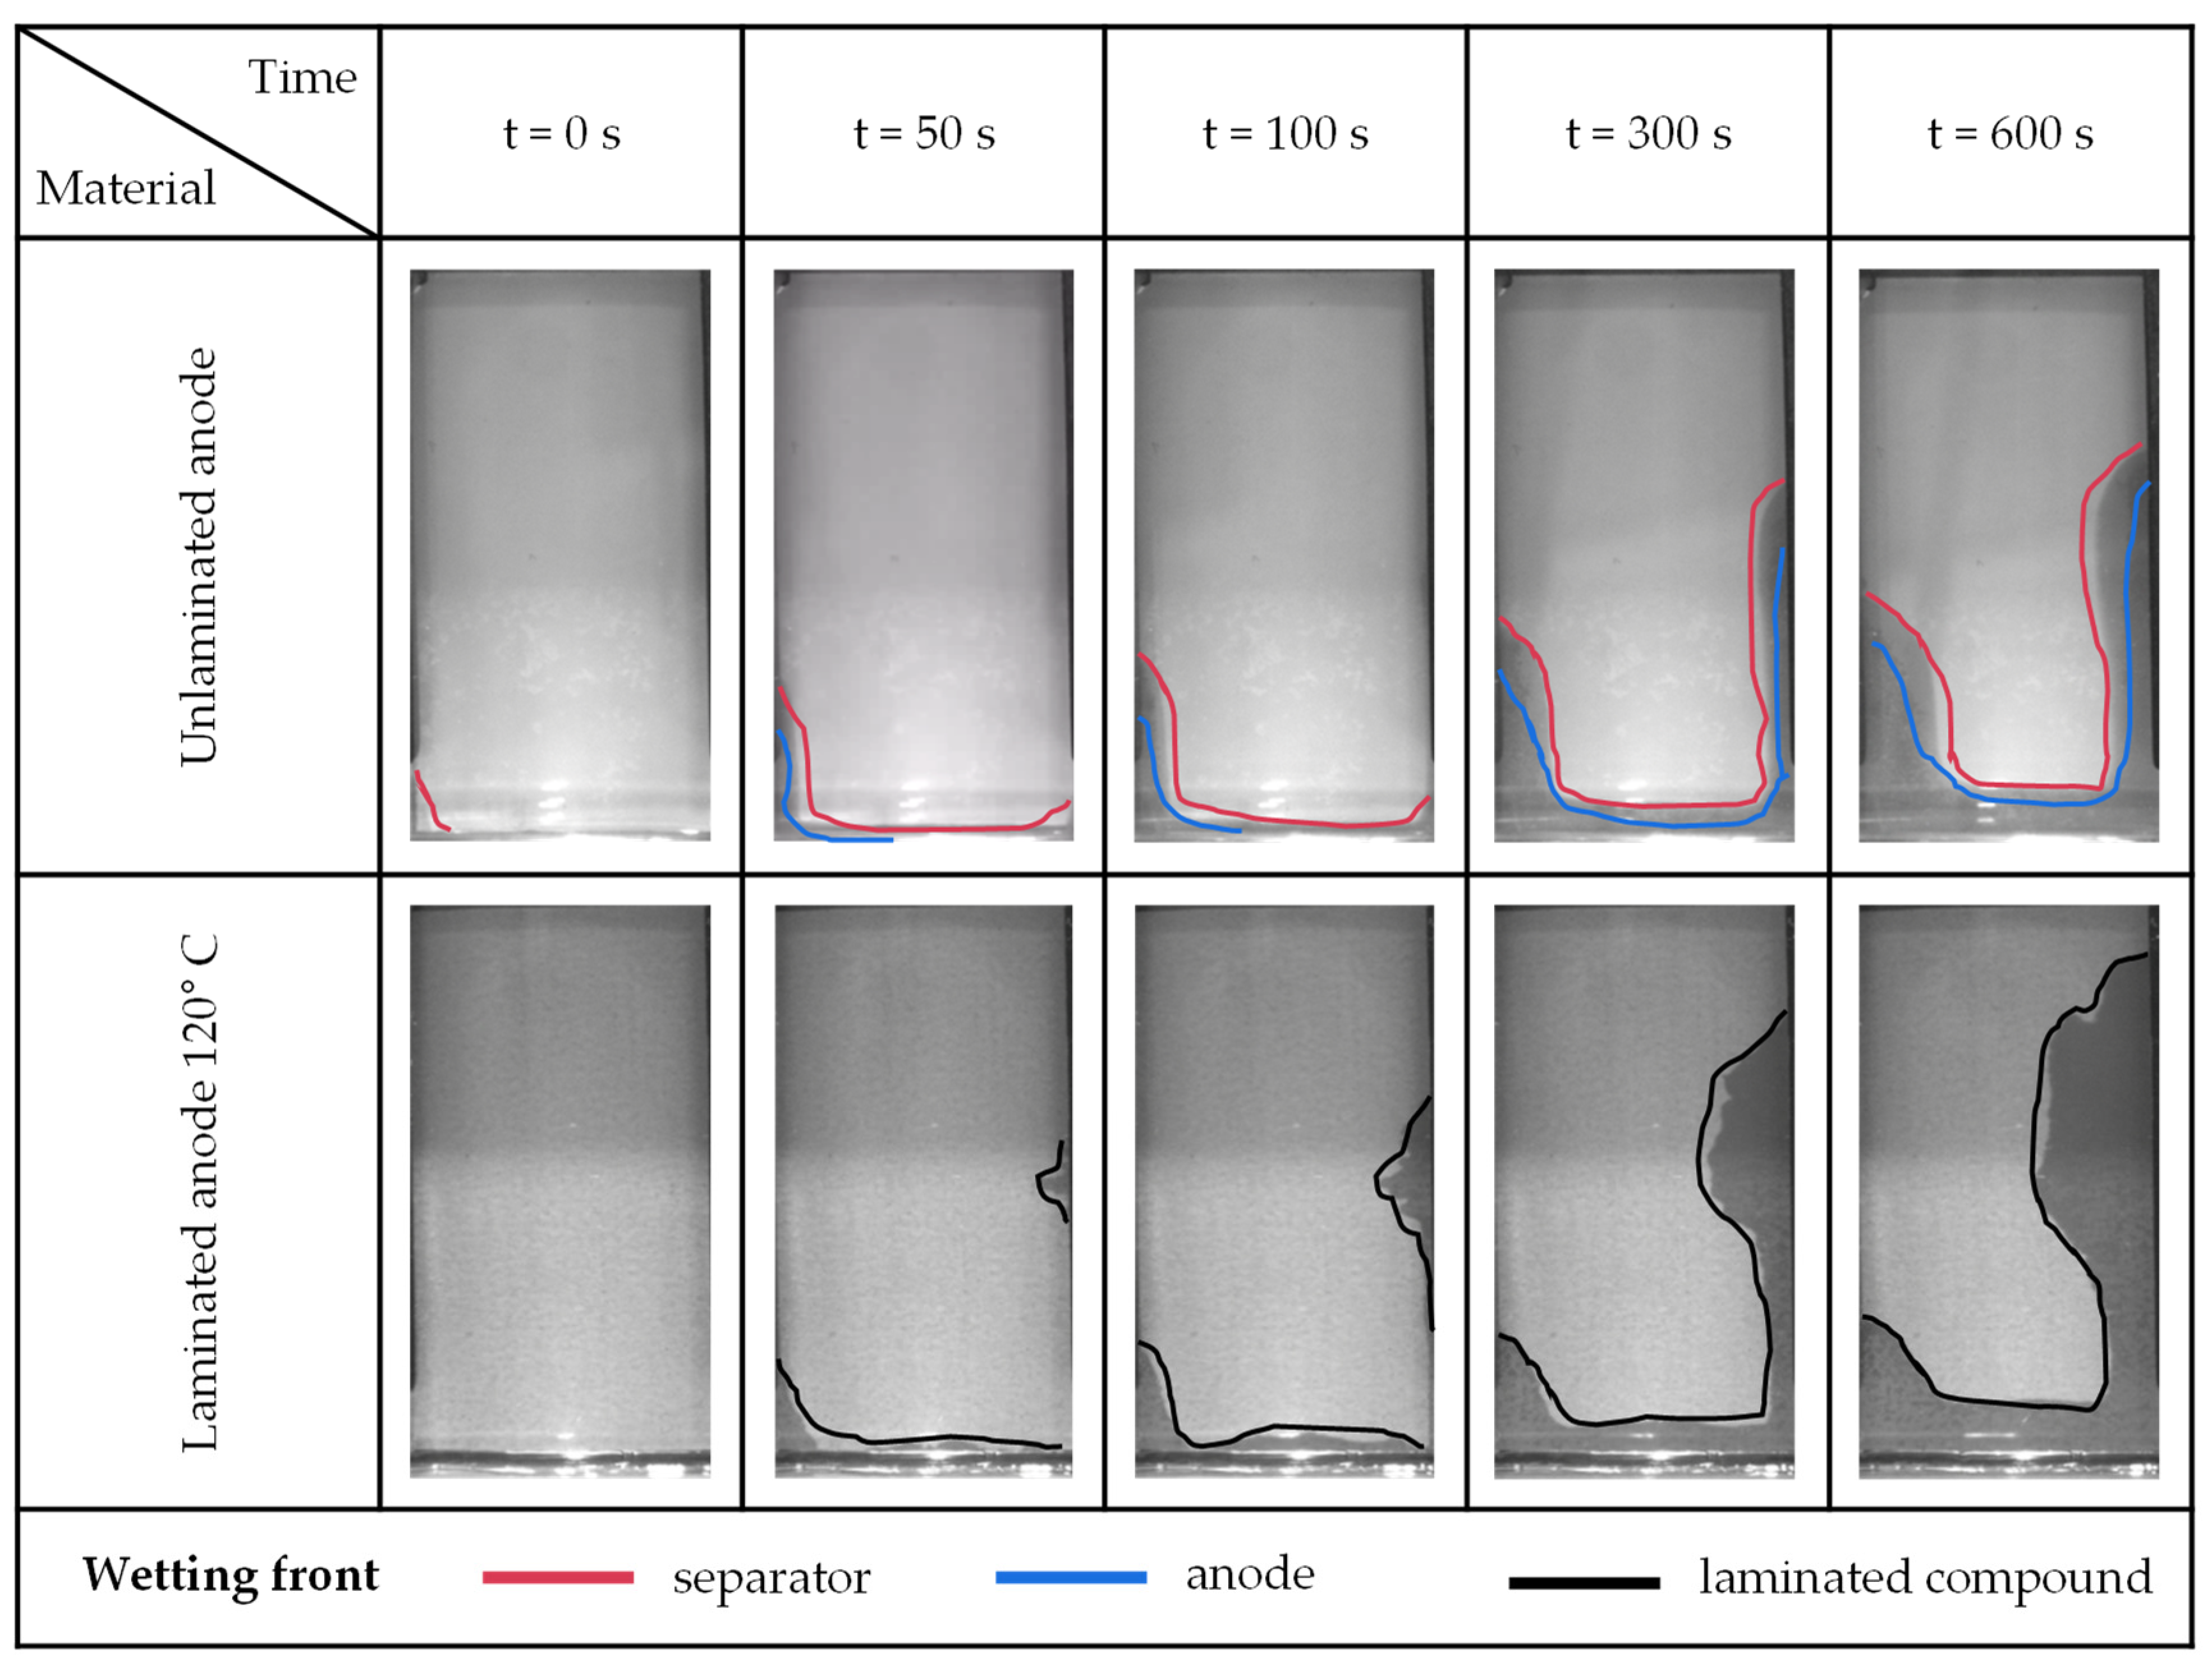
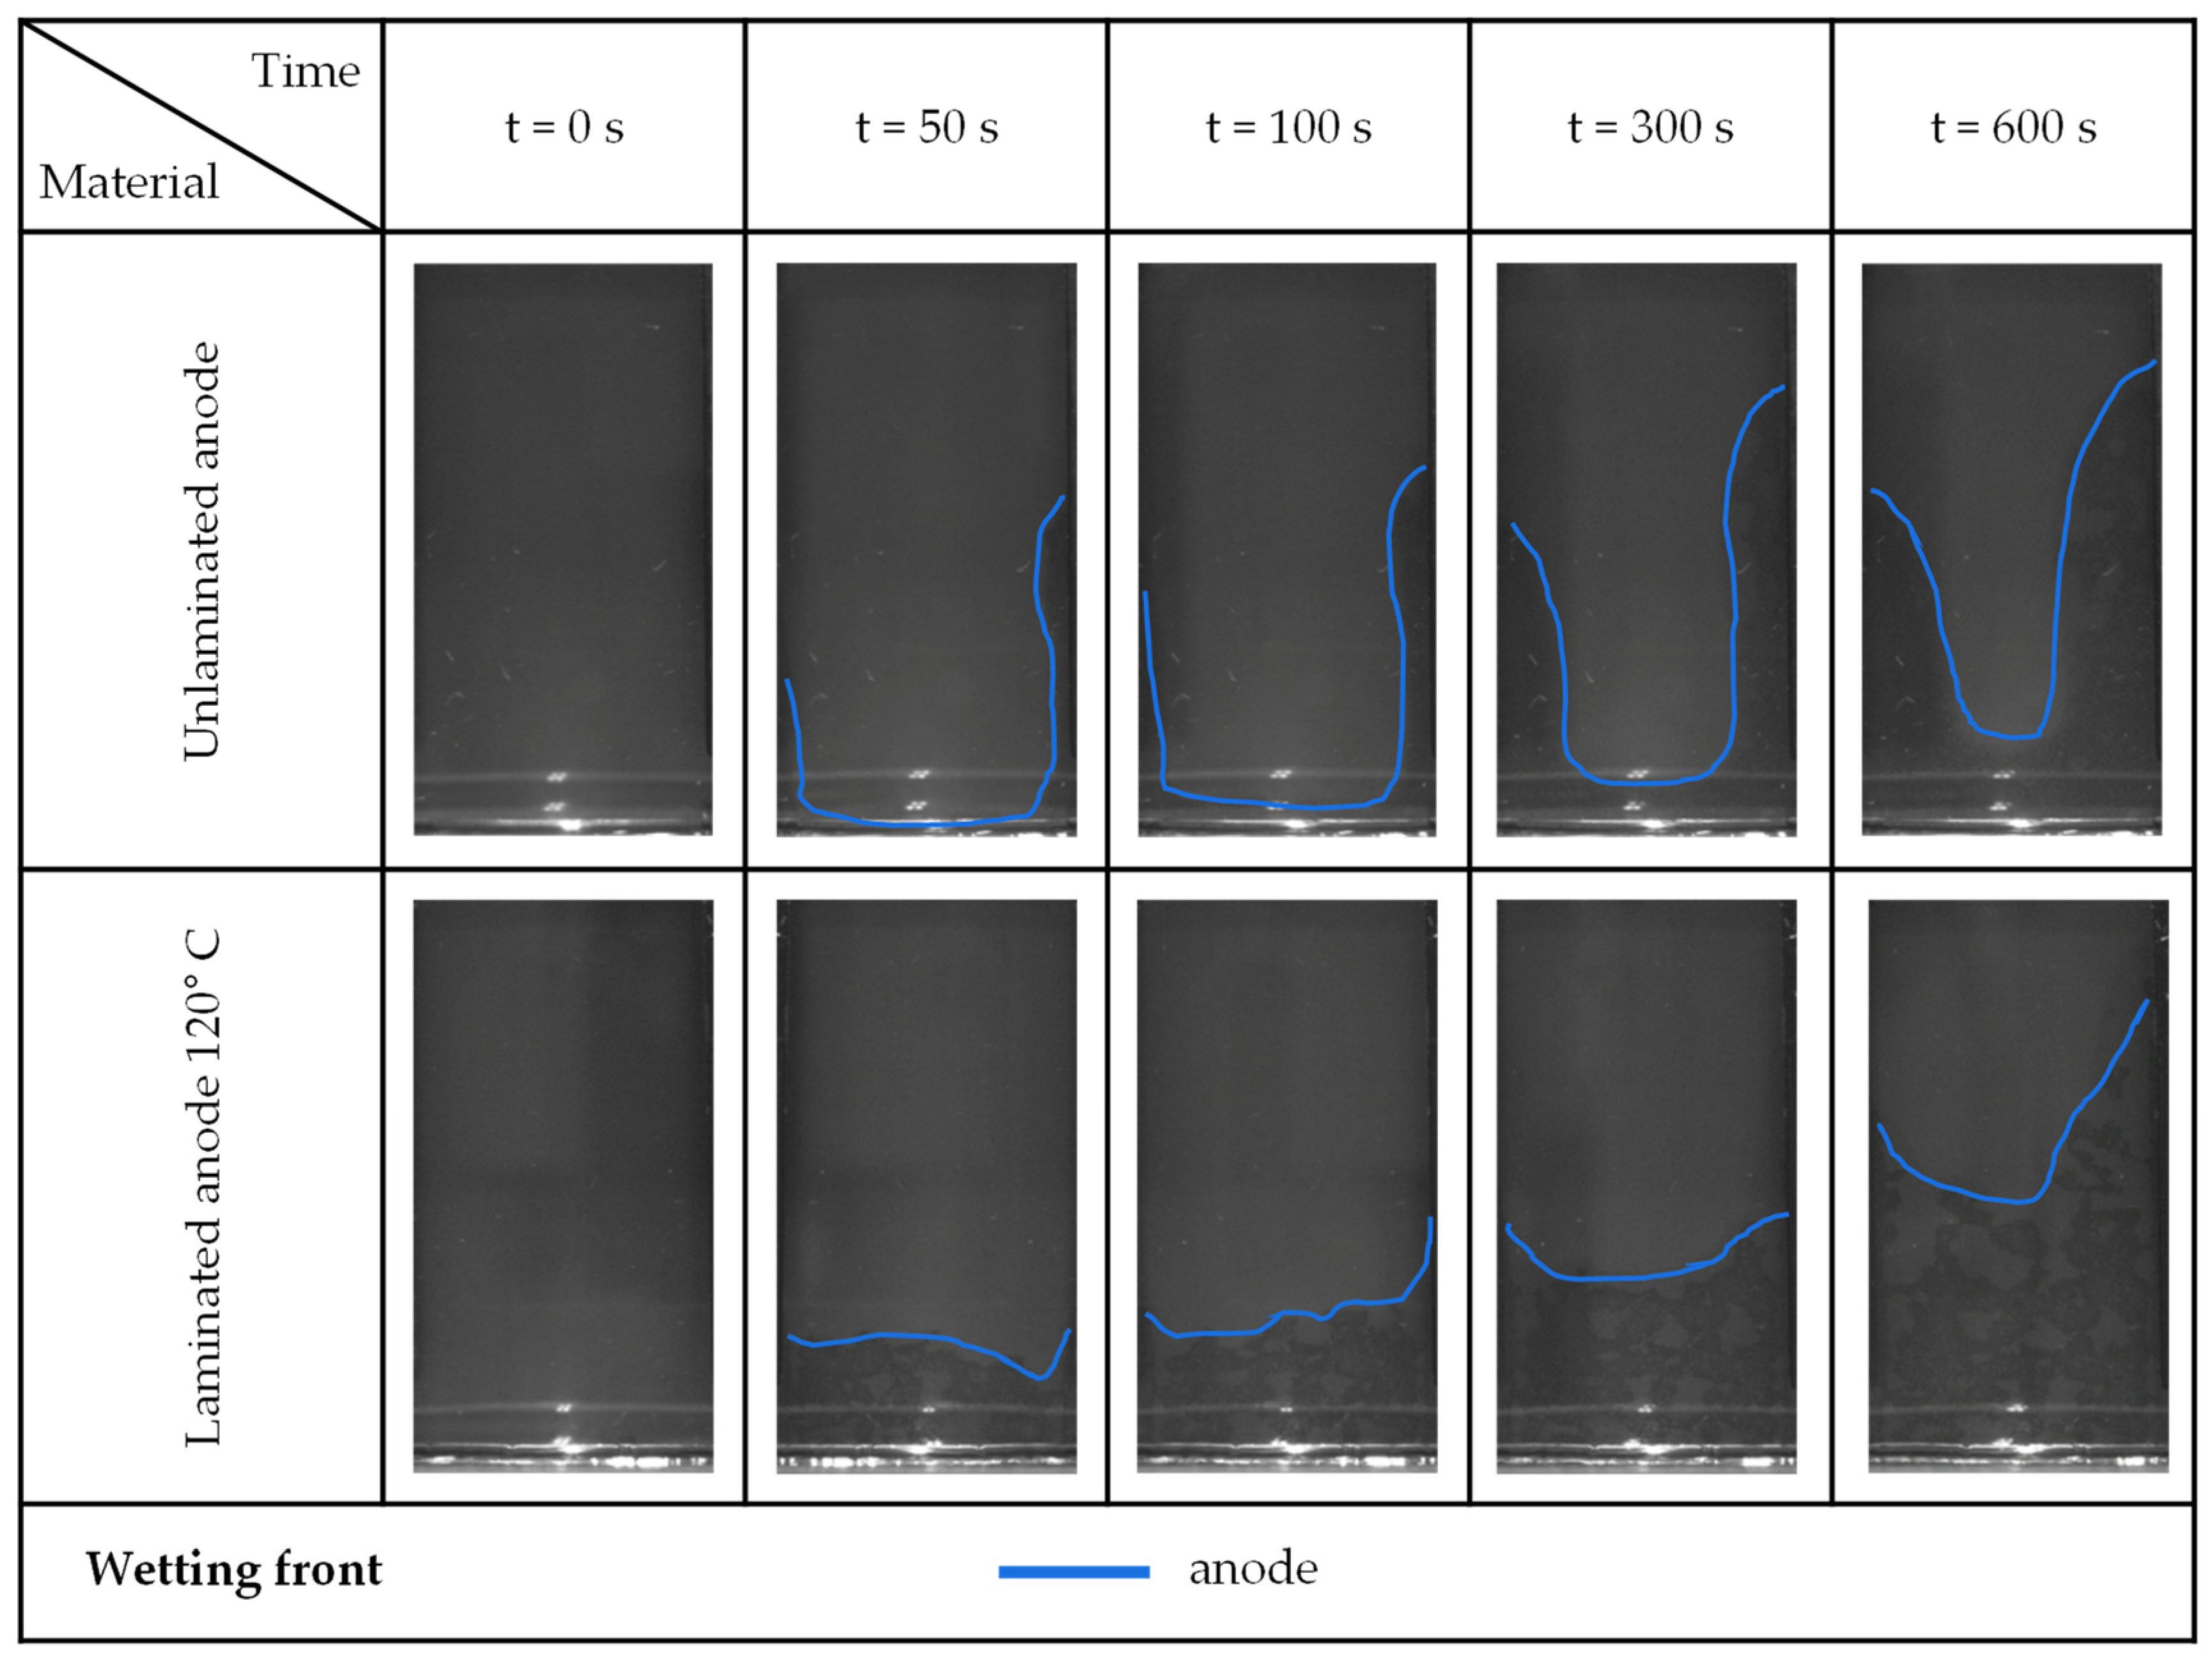
3.2. Optical Measurement

Figure 4 shows the h-t graph of the optically determined rise height. The evaluation was performed for the laminated samples (ii and iii) for one wetting front. For the non-laminated sample, the two materials were wetted at different rates, so both wetting fronts (separator and cathode) were evaluated separately. The mean wetting front of the non-laminated compound was calculated according to Equation (5). In some cases, a digressively decreasing behavior can be observed in the measurement graphs.
The h-t0.5 graph is shown in the right image of Figure 4. Here, in the same way as with the gravimetric measurement, the wetting rate k [mm/s0.5] can be determined in the linear range (10–20 s0.5). The quantitative evaluation with the wetting rate k as well as with the mean heights at different times is plotted in Table 2. The materials of the non-laminated sample show different wetting rates, with the separator always wetting faster than the cathode. A comparison of the averaged non-laminated sample riser height with the two laminated samples again indicates that the laminated samples have a superior wetting rate. Thus, also based on the results of the optical observation, it can be concluded that lamination has a positive effect on the wetting property of the samples. Between the different lamination variants, a significantly higher wetting rate is shown at a temperature of 80 °C compared to the samples laminated at 120 °C.
Figure 5 illustrates for five concise time points the images taken by the camera showing the wetting fronts. For the non-laminated sample, the different wetting fronts for the separator and cathode are drawn. While only a light gray tone was visible with the separator wetting, a deep gray tone was seen with additional wetting of the cathode. A distinction between the two wetting fronts could not be determined for the laminated samples. However, the samples with a lamination temperature of 80 °C showed uneven wetting between separator/cathode areas over the entire surface. Despite a similar wetting rate k, the sample laminated at 80 °C shows a significantly higher absolute slope height than the sample laminated at 120 °C. Thus, the sample laminated at 120 °C shows a higher absolute slope height. This is due in particular to the wetting within the 100 s. In particular, the u- or v-shape of the wetting front stands out in the images. At the side edges of the specimen holder, where the glass plates and electrode-separator assemblies come into contact with the sample holder, the wetting front is particularly pronounced. This can be observed with all sample specimens. In the narrow gap between the sample holder and the glass plates, an additional wetting front is formed due to the capillary forces. Because of the small gap, this force is significantly greater than the wetting by the materials themselves, which is why there is a tendency for lateral wetting results. However, since across all experiments the measurements were performed under identical conditions, the lateral wetting tendency does not affect the validity of the inferred results regarding the positive effect of lamination on wetting. As expected, the same qualitative test results with regard to the wetting fronts were obtained for the test series of the anode (iv–v) and the compartment (vi–vii), see Appendix A Figure A3 and Figure A4.

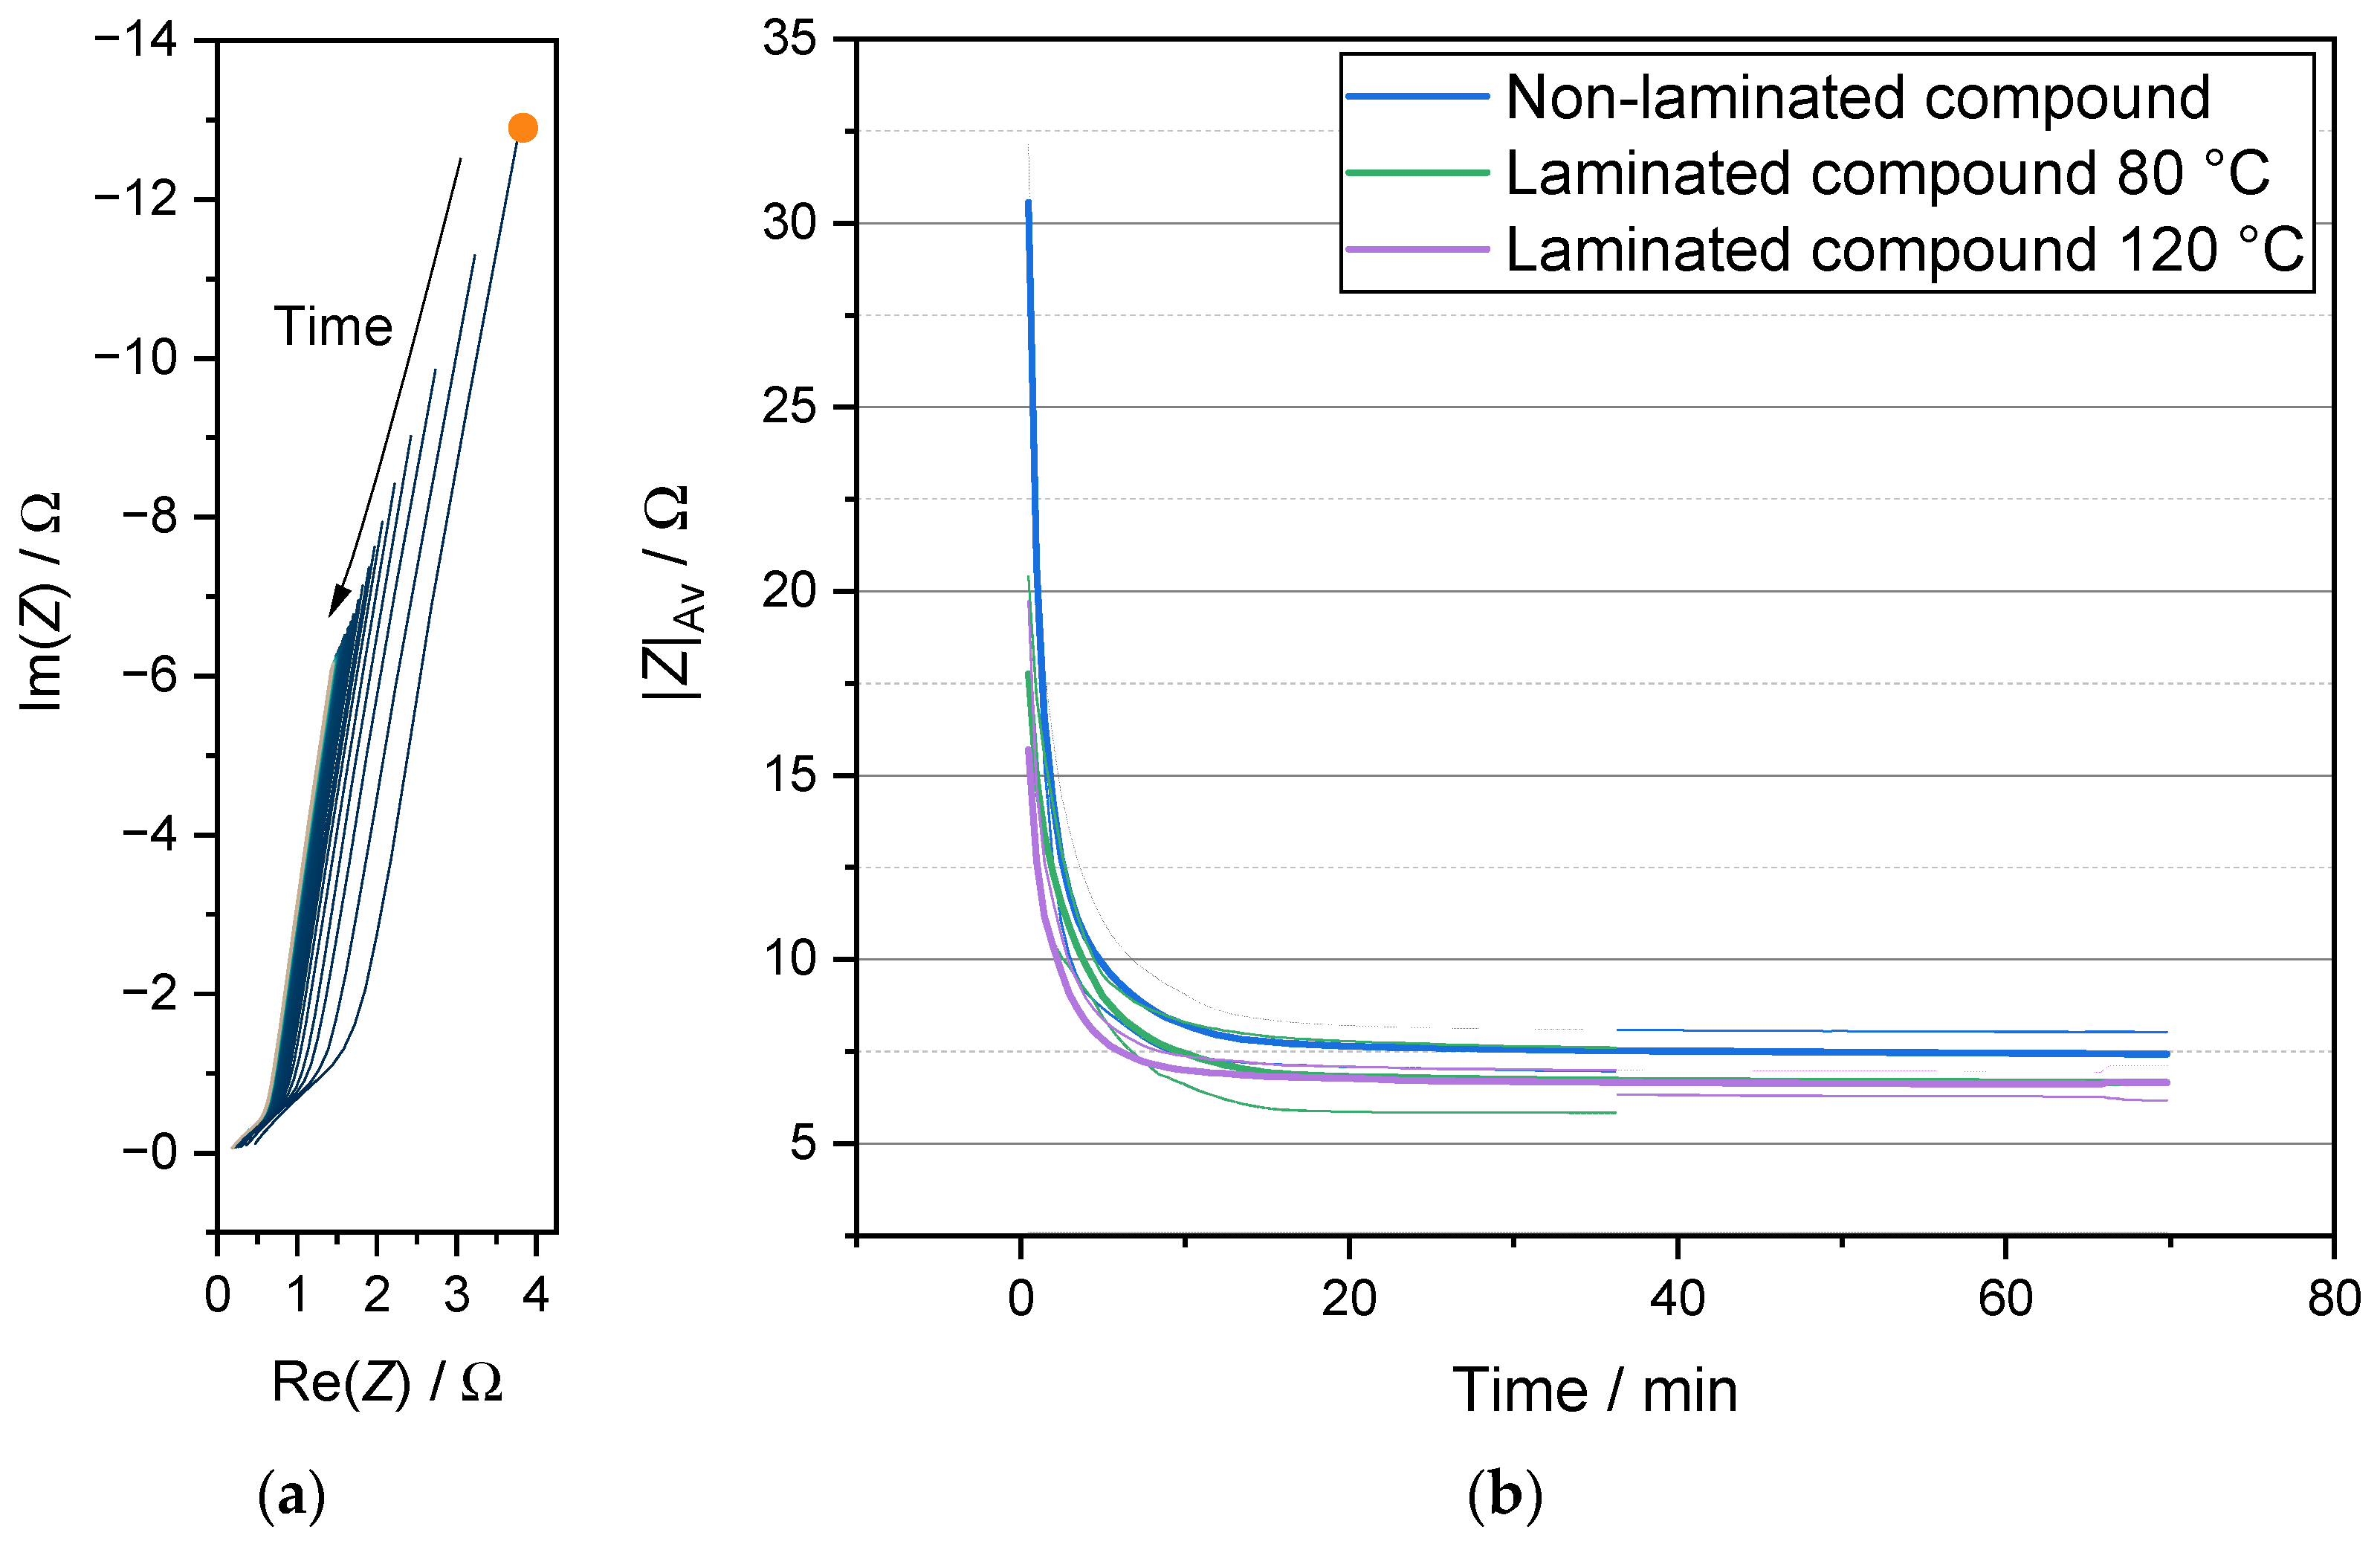
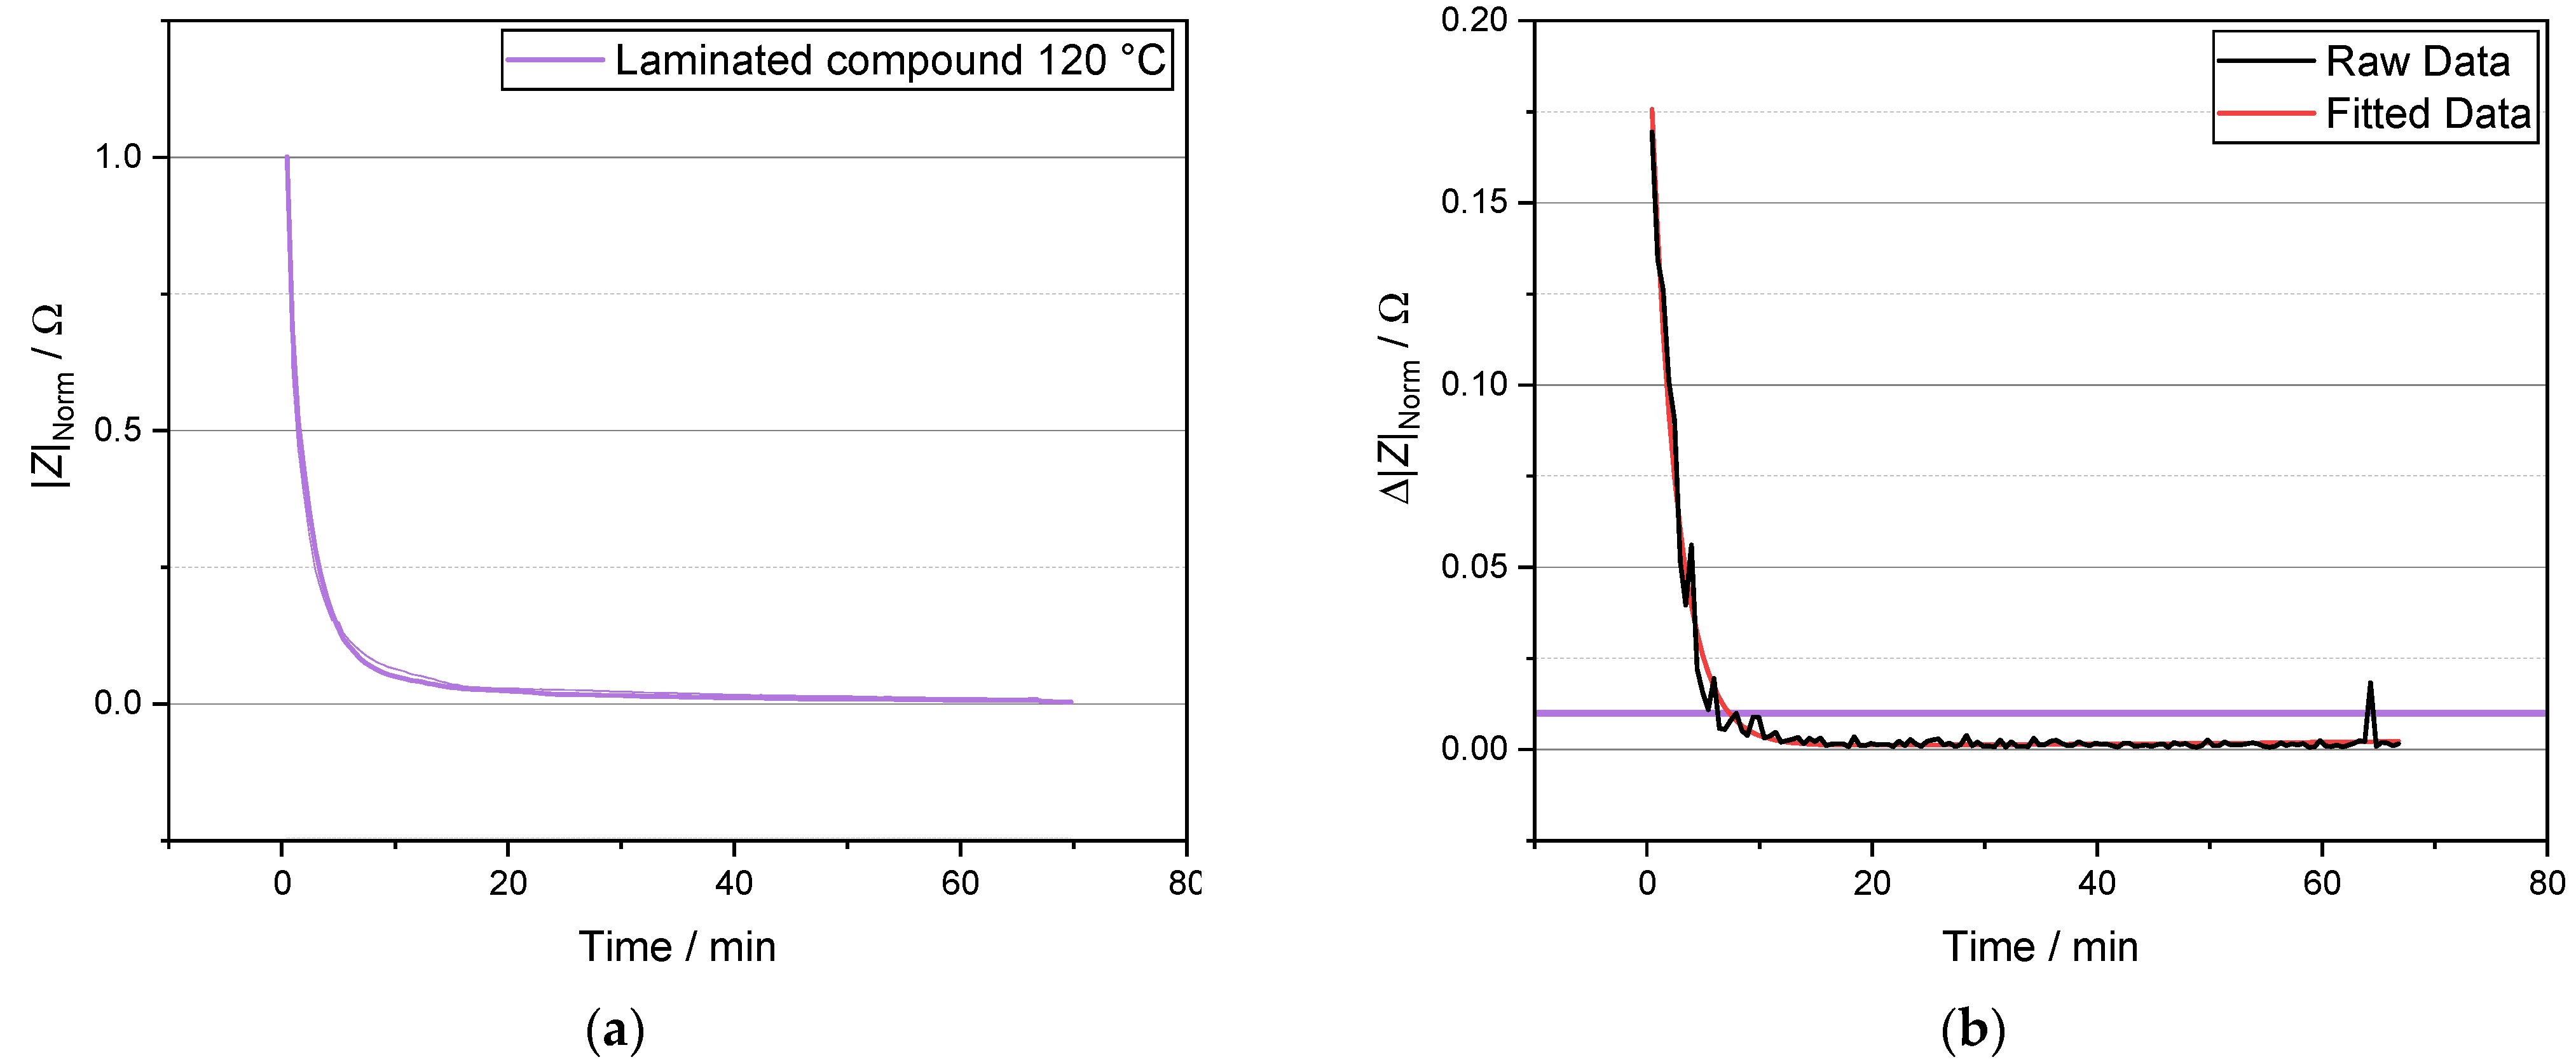
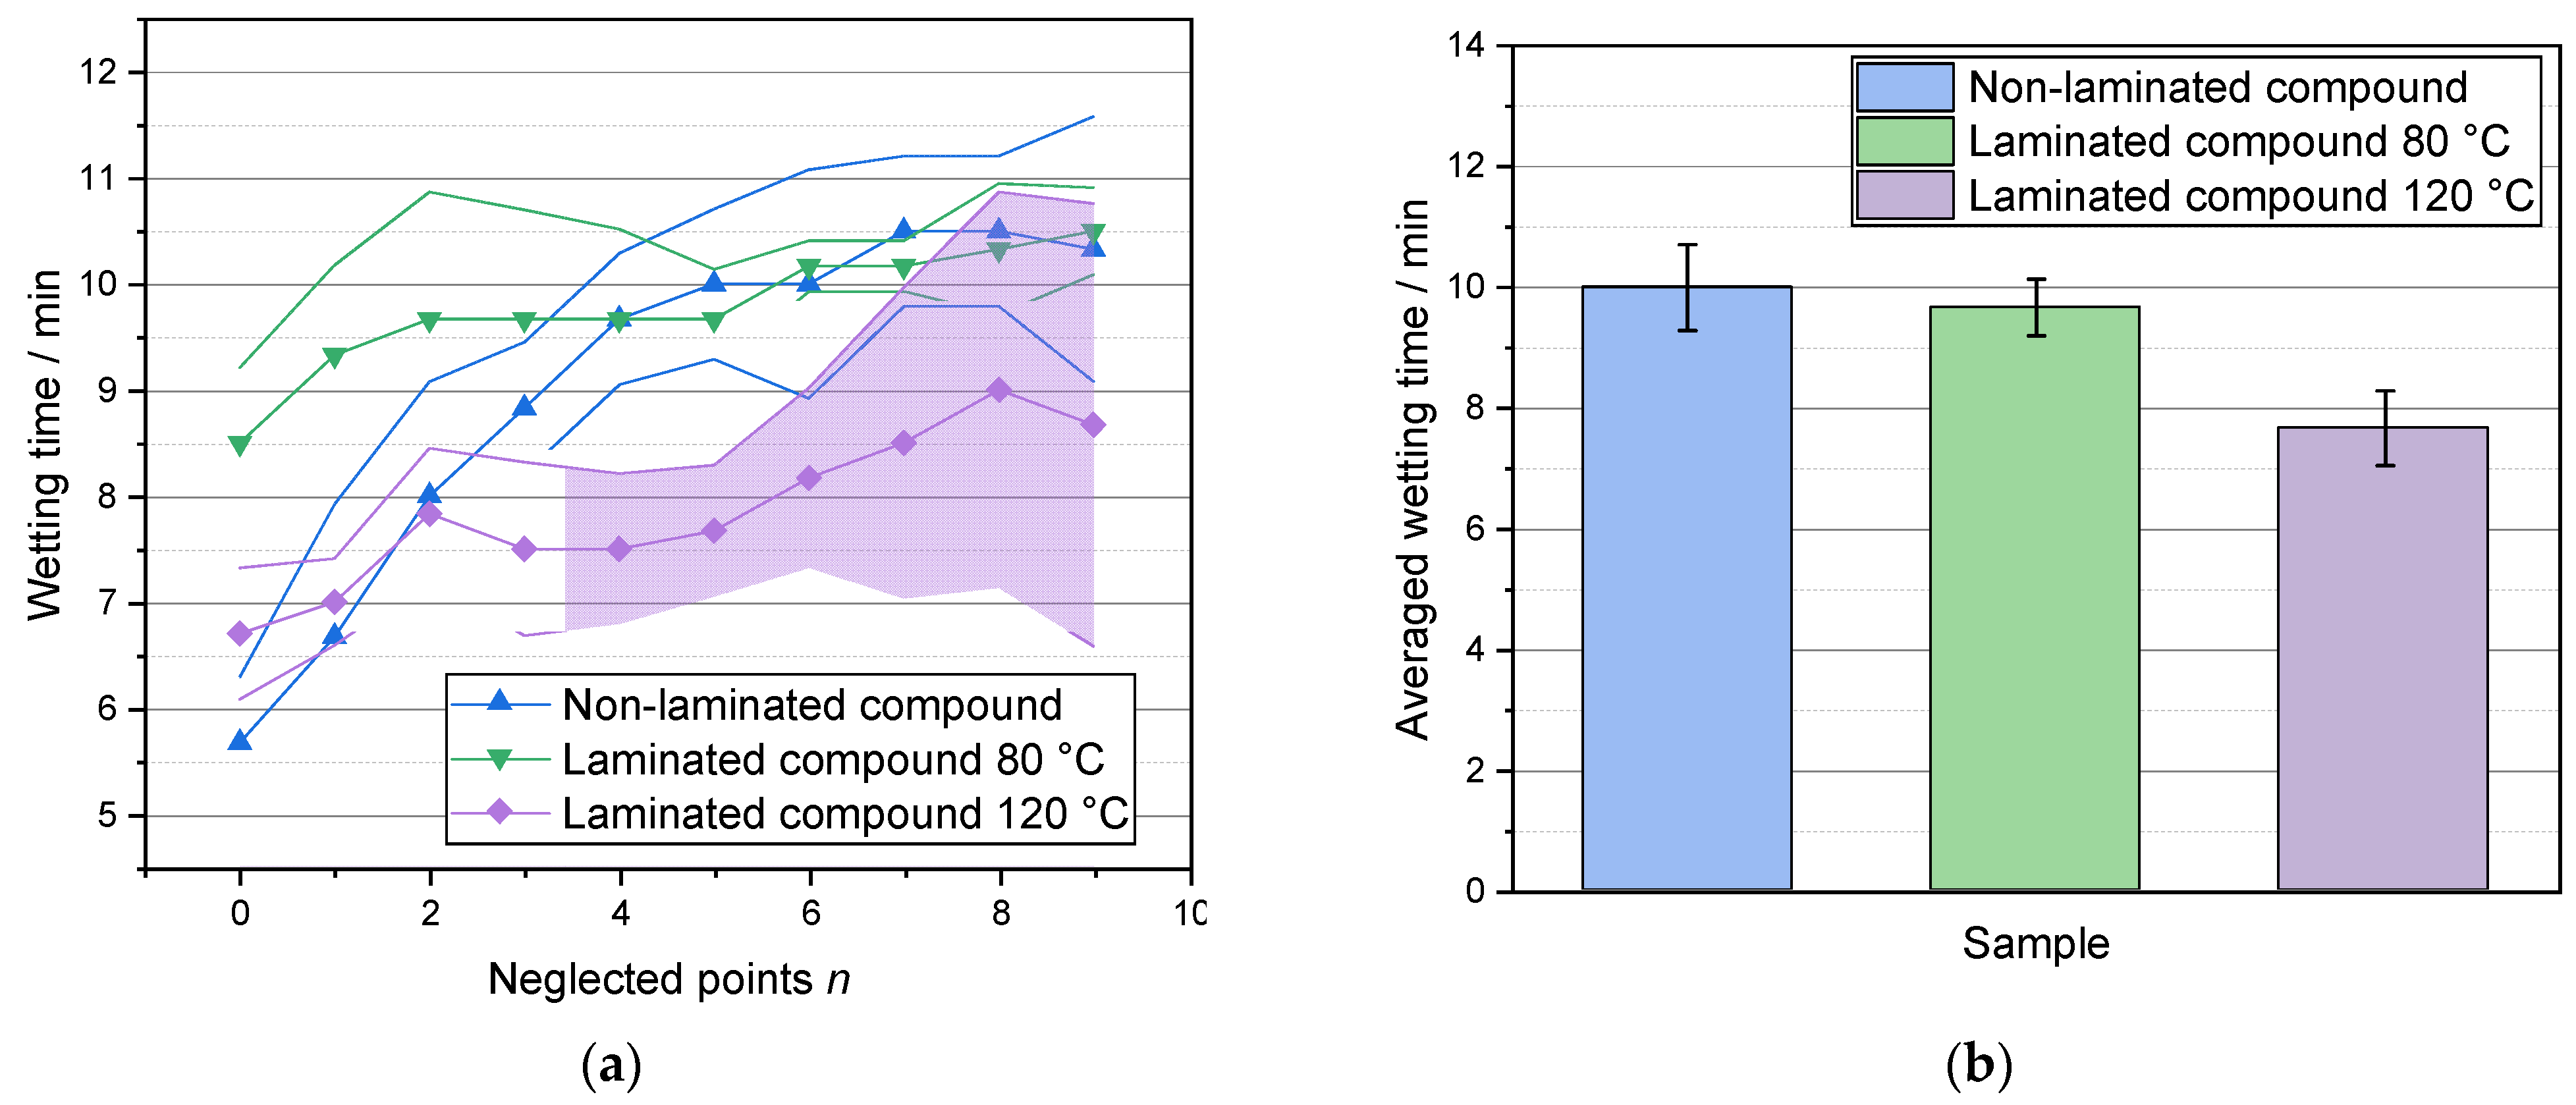
3.3. Electrochemical Measurement

For each cell, similar impedance spectra could be measured. Figure 6a exemplarily shows the impedance outcome for one of the investigated cells (laminated compound at 120 °C) in the Nyquist representation and for varying wetting times. All plots initially show a slight increase in the imaginary part with an increasing real part resulting in a slope of around 45°. However, this area does not appear to rise in a purely linear fashion but rather is characterized by a broad semicircle. For lower frequencies, a steep linear increase can be found.
The single plots shift to lower impedance values on the real axis with increasing wetting time. At the same time, the imaginary part is decreasing. These effects are the more pronounced the smaller the wetting time. Thus, a regressive decrease can be found for the real and the imaginary part. In order to graphically represent this behavior, an equivalent circuit fitting of all individual spectra can be conducted. The extracted quantities of this proceeding can then be depicted as a direct function of the wetting time. In other works, the zero-crossing of the real axis within the Nyquist plot is considered [15].
In this work, however, such a proceeding is omitted to avoid possible errors within the fitting or the data processing influence the final analysis. Instead, the measured impedance data are considered directly. For this purpose, the modulus | Z | of the impedance is analyzed as the time-dependent variable. Examining the modulus is advantageous because this quantity combines both the real part Re ( Z ) and the imaginary part Im ( Z ) of the impedance:
| Z | = Re ( Z ) 2 + Im ( Z ) 2
Here, we concentrate on the modulus measured at a frequency of 1 Hz solely. This frequency point is highlighted in Figure 6a for one of the impedance measurements as an orange dot. By choosing the investigated frequency to be 1 Hz, the main impedance features of the investigated cells are covered within the investigation of wetting times. The highest frequencies reflect mainly pure ohmic resistances (shift of the spectra along the abscissa, nearly no imaginary shares). The change in impedance values at these frequencies with increasing wetting time can thus be attributed to the wetting of the separator. For lower frequencies, on the other hand, the impedance spectra are governed by increasing real and imaginary impedance values. This impedance behavior is due to the electrochemical performance of the electrodes. Hence, any shift for these values with increasing wetting times is related to the wetting of the porous electrodes. However, any change within the processes occurring at higher frequencies also directly affects the impedance values at 1 Hz. Consequently, we use the impedance results measured at 1 Hz to monitor the wetting of both the separator and the electrodes. Nevertheless, the remaining frequencies may contain further information to investigate the wetting process in more detail.
In Figure 6b, the averaged impedance modulus | Z | (1 Hz) for the three different samples is shown as a function of the wetting time. All curves show a similar behavior—with increasing wetting time, | Z | (1 Hz) exponentially decreases. Besides, all data sets show low standard deviations for the entire investigation time. Nevertheless, the curves differ in the magnitude of their initial and final values. Therefore, a comparison of the data among each other is impeded even though the samples, which were laminated at 120 °C and at a contact pressure of 5.5 Nmm−2, seem to show a faster decay.
A clearer representation of the data is possible by standardization. For this purpose, first, the lowest | Z | low and the highest value | Z | high of the time-dependent impedance modulus | Z | ( t ) are determined and subtracted from each other. The resulting range | Z | high | Z | low is subsequently used as a scaling factor, and each data set is individually divided by this value. Additionally, the offset alongside the ordinate is cleared by subtracting | Z | low :
| Z | Norm = | Z | ( t ) | Z | low | Z | high | Z | low
In Figure 7a, the average of | Z | Norm is shown for the three test cells with compounds lamination at 120 °C. The exponential decline of the data is still obvious. Similar to previous works [14,15], we assume a completed wetting of the cell components when the measured impedance values only show negligibly small variations over time. Therefore, the first numerical derivation of | Z | Norm is calculated to monitor the degree of variation as a function of the wetting time. Figure 7b exemplarily depicts the absolute value of the respective derivation for one of the samples of Figure 7a. The resulting curve, again, shows an exponential decay. In addition, the data is superimposed by noise. Hence, an analytical fitting of the data is required for further interpretation of the results (cf. Figure 7b). Finally, the completion of the wetting process can be assumed when the fitting results fall below a threshold value. This limit is defined to be Δ | Z | lim = 0.01 and is depicted in Figure 7b as a violet horizontal line.
The used standardization is mandatory for comparing the results of diverse samples. At the same time, however, this procedure bears the risk that the standardization itself falsifies the outcome. Especially because the value | Z | high is included in Equation (8), the values determined are susceptible to fluctuations. It can be assumed that the starting time of the electrochemical measurements in relation to the electrolyte filling has a considerable impact on the calculations in Equation (8), as | Z | high explicitly varies at the beginning of the investigations. Therefore, the impact of different starting times of the impedance measurements was tested. For this purpose, the raw experimental datasets had been gradually truncated. In each case, the first n time-dependent values were artificially removed from the impedance output. The number of neglected data points was varied between 0 and 9, and for each resulting dataset, the previously shown procedure for determining the wetting time was performed. The averaged wetting time results for all samples in dependence on the number n are shown in Figure 8a. The samples with compounds laminated at 80 °C show stable values when at least the first two data points are omitted. The samples without any lamination, on the contrary, show a steep increase in the determined wetting time when the early data points are neglected. However, the wetting time becomes stable if at least the first n = 5 data points are not taken into account. The samples with compounds laminated at 120 °C show stable values between n = 2 and n = 5 , and their wetting time is smaller than for the other samples regardless of n . The standard deviation for the sample with non-laminated compounds and the sample with compounds laminated at 120 °C increases with higher n values. Therefore, the comparison of the samples is assumed to be optimal for n = 5 , as for this value, stable wetting times in combination with low standard deviations can be obtained.
Figure 8b consequently depicts the averaged wetting times for all samples, calculated by neglecting the first 5 data points for all data sets. The lamination at 80 °C shows only slightly decreased wetting times (9.7 min) compared to the non-laminated reference (10 min). Considering the standard deviations, nearly no difference can be assumed for this comparison. The lamination at 120 °C, on the contrary, clearly decreased the average wetting time of the investigated cells down to 7.7 min. Overall, the standard deviations are quite small for all samples, which underlines the validity of the results.

4. Discussion

Results from the gravimetric and optical measurements both show an increase in wettability due to the process step of lamination. The gravimetric measurement provides a holistic parameter that sums up the individual wetting properties. Consequently, the influence of lamination can be demonstrated with this method as a result of all the cell materials investigated. On the other hand, neither the homogeneity of the wetting depth nor the uniformity of the surface can be determined by this measurement method. The optical measurement allows the wetting capabilities of the individual materials of an electrode-separator-assembly to be determined. Thus, the influence of the separator in wetting can be deduced. Similarly, the nature or homogeneity of wetting on the surface can be replicated. Although the wetting ability of the electrode-separator laminates is influenced and increased by the clamping between the glass plates, since the interfaces between the glass and the sample material provide a further gap for wetting by means of capillary forces. Nevertheless, the sample holder applies constant pressure on the laminates and thereby reproduces a practical operating environment as it exists inside a vacuum-sealed pouch cell during wetting. Similarly, the formation of liquid reservoirs in the form of droplets on the sample surface above the concave liquid meniscus is prevented and, therefore, you achieve a more repeatable measurement of the actual rising height.
The comparison of the two methods shows qualitatively that the wetting ability is increased by lamination, yet the measured wetting rates differ significantly. The values evaluated for the optical measurement are greater by more than a factor of 10. A possible explanation for this could be the one-sided lamination. Thus, the separator electrode-separator laminate was applied to one side of the sample and only the active material of the double-sided coated electrode was applied to the other side of the glass plate. If the wetting of the front side occurred at a higher wetting rate, this might have been overestimated since—in contrast to the gravimetric measurement—only the side facing the camera was taken into account for the calculation of the area-weighted rise height.
Another possible explanation is that only the wetting of the surface is detected in the optical measurement. This may be a driver of sample wetting due to the high capillary forces between the surface and the glass plate. The wetting in the depth of the sample materials, especially of the electrodes, could cause an uneven distribution of the wetting as a result of local, slower wetting rates (cf. Figure 9). The shape of the function shown in Figure 9 is an idealized representation. On the one hand, the real function shows a much less smooth profile due to the locally different pore sizes and the resulting tortuosities. The three different functions indicate possible curves over the laminate thickness. The exact course of this function is the subject of further investigations.
In contrast to the other used methods, absolute wetting times were determined within the electrochemical investigations. Nevertheless, these results can be compared with the outcome of the remaining methods. The impedance analysis showed comparable wetting times for the non-laminated material and the compounds laminated at 80 °C. This result is in contradiction to the findings of the optical and gravimetric investigations. The latter two methods showed a significantly increased wetting rate for all laminated samples. Thus, shorter wetting times can be expected as a result of the lamination. However, reduced wetting times can only be found for the electrochemical investigation of the samples laminated at 120 °C. Here, the lamination causes differences in the wetting time of more than 20 %.
The discrepancy between the results can be explained by the fact that the electrochemical measurement does not only consider a macroscopic distribution of the electrolyte in the separator material. Instead, the electrolyte wetting in the pore volume of the electrodes also influences the electrochemical measurement results. These microscopic processes can show divergent wetting rates from the macroscopic wetting processes [15]. The similar wetting times for the non-laminated samples and the samples with lamination at 80 °C could be explained by considering the wetting in the porous volume as the rate-determining step for the decreasing impedance values. In particular, the lamination at 80 °C could thus provide an accelerated macroscopic wetting, while the penetration of the electrolyte into the pore volume is not affected. For the lamination at 120 °C, on the other hand, a lowered wetting time can be found for both the macroscopic (optical and gravimetrical measurements) and the microscopic scale (electrochemical measurements). This effect could be explained by the increased number of interconnections between the separator and electrode surface, which is prominent for the higher lamination temperature.
These points show that a more systematic consideration of the influence of the lamination process parameters such as temperature or contact pressure on the wetting rate is necessary. In addition, the influence of cell materials also needs investigation. In particular, the use of other laminable separators with different separator base materials (trilayers or nonwovens) as well as other electrode materials such as SiC anodes or LFP cathodes promises valuable insights. Further investigations will address these influences in distinct studies.

5. Conclusions

In this paper, three different measurement methods for evaluating the wetting behavior were compared to each other to determine the advantages and limitations of each measurement method. Both the macroscopic measuring methods (optical and gravimetrical) and the microscopic measuring method (electrochemical) can be used to determine the wetting rate and wetting time, respectively. Moreover, the result shows that the lamination of separator and electrode significantly improves the wetting behavior of an electrode-separator assembly, and consequently, lamination is a promising process step for battery cell production to reduce wetting time and thus process-related storage times.
In summary, the comparative measurement methods of this work provide an approach for detailed investigations of the electrolyte wetting within battery cells. This way, an optimization of the single compounds within the cells regarding the wetting process is accessible.

Author Contributions

Conceptualization, N.K., N.S. and R.L.; methodology, N.K. and N.S.; software, N.S.; validation, N.K. and N.S.; formal analysis, N.K. and N.S.; investigation, S.S. and S.G.; resources, N.K., N.S., R.L. and K.D.; data curation, N.K. and N.S.; writing—original draft preparation, N.K., N.S. and R.L.; writing—review and editing, R.L. and K.D.; visualization, N.K. and N.S.; supervision, K.D.; project administration, K.D.; funding acquisition, R.L. and K.D. All authors have read and agreed to the published version of the manuscript.

Funding

This research was funded by the German Federal Ministry of Education and Research (BMBF) within the research project Cell-Fill (grant number 03XP0237A) and the German Federal Ministry for Economic Affairs and Energy (BMWi) within the research project DaLion 4.0 (grant number 03ETE017A).

Institutional Review Board Statement

Not applicable.

Informed Consent Statement

Not applicable.

Data Availability Statement

MDPI Research Data Policies.

Conflicts of Interest

The authors declare no conflict of interest. The funders had no role in the design of the study, in the collection, analyses, or interpretation of data, in the writing of the manuscript, or in the decision to publish the results.

Appendix A

Figure A1. Results of gravimetric measurement of the anode separator measurement series (iv) to (v). Smoothed measurement data of the tensiometer measurement (left) and transformed measurement data with an evaluation range of 10 to 15 s0.5 (right).
Processes 09 01851 g0a1
Figure A2. Results of gravimetric measurement of the compartment measurement series (vi) to (vii). Smoothed measurement data of the tensiometer measurement (left) and transformed measurement data with an evaluation range of 10 to 15 s0.5 (right).
Processes 09 01851 g0a2
Figure A3. Images of the optical measurement of the anode separator measurement series at four time points. The shape and height of the wetted visible surface are shown. Start of the measurement at t = 0 s.
Processes 09 01851 g0a3
Figure A4. Images of the optical measurement of the compartment measurement series at four time points. The shape and height of the wetted visible surface are shown. Start of the measurement at t = 0 s.
Processes 09 01851 g0a4

References

  1. Mohammadi, F. Lithium-ion Battery Market Analysis for Hybrid, Plug-in and Solar-Powered Electric Vehicles. J. Solar Energy Res. 2019, 4, 23–29. [Google Scholar]
  2. Kwade, A.; Haselrieder, W.; Leithoff, R.; Modlinger, A.; Dietrich, F.; Droeder, K. Current status and challenges for automotive battery production technologies. Nat. Energy 2018, 3, 290–300. [Google Scholar] [CrossRef]
  3. Wood, D.L., III; Li, J.; Daniel, C. Prospects for reducing the processing cost of lithium ion batteries. J. Power Sources 2015, 275, 234–242. [Google Scholar] [CrossRef] [Green Version]
  4. Lithium-Ion Batteries: Basics and Applications; Korthauer, R. (Ed.) Springer: Berlin/Heidelberg, Germany, 2018; ISBN 9783662530719. [Google Scholar]
  5. Davoodabadi, A.; Li, J.; Liang, Y.; Wood, D.L.; Singler, T.J.; Jin, C. Analysis of electrolyte imbibition through lithium-ion battery electrodes. J. Power Sources 2019, 424, 193–203. [Google Scholar] [CrossRef] [Green Version]
  6. Pfleging, W.; Pröll, J. A new approach for rapid electrolyte wetting in tape cast electrodes for lithium-ion batteries. J. Mater. Chem. A 2014, 2, 14918–14926. [Google Scholar] [CrossRef]
  7. Kühnel, R.-S.; Obeidi, S.; Lübke, M.; Lex-Balducci, A.; Balducci, A. Evaluation of the wetting time of porous electrodes in electrolytic solutions containing ionic liquid. J. Appl. Electrochem. 2013, 43, 697–704. [Google Scholar] [CrossRef]
  8. Beyer, S.; Kobsch, O.; Pospiech, D.; Simon, F.; Peter, C.; Nikolowski, K.; Wolter, M.; Voit, B. Influence of surface characteristics on the penetration rate of electrolytes into model cells for lithium ion batteries. J. Adhes. Sci. Technol. 2019, 34, 849–866. [Google Scholar] [CrossRef]
  9. Knoche, T.; Zinth, V.; Schulz, M.; Schnell, J.; Gilles, R.; Reinhart, G. In situ visualization of the electrolyte solvent filling process by neutron radiography. J. Power Sources 2016, 331, 267–276. [Google Scholar] [CrossRef]
  10. Weydanz, W.; Reisenweber, H.; Gottschalk, A.; Schulz, M.; Knoche, T.; Reinhart, G.; Masuch, M.; Franke, J.; Gilles, R. Visualization of electrolyte filling process and influence of vacuum during filling for hard case prismatic lithium ion cells by neutron imaging to optimize the production process. J. Power Sources 2018, 380, 126–134. [Google Scholar] [CrossRef]
  11. Schilling, A.; Gümbel, P.; Möller, M.; Kalkan, F.; Dietrich, F.; Dröder, K. X-ray based visualization of the electrolyte filling process of lithium ion batteries. J. Electrochem. Soc. 2018, 166, A5163–A5167. [Google Scholar] [CrossRef]
  12. Schilling, A.; Wiemers-Meyer, S.; Winkler, V.; Nowak, S.; Hoppe, B.; Heimes, H.H.; Dröder, K.; Winter, M. Influence of Separator Material on Infiltration Rate and Wetting Behavior of Lithium-Ion Batteries. Energy Technol. 2020, 8, 1900078. [Google Scholar] [CrossRef] [Green Version]
  13. Deng, Z.; Huang, Z.; Shen, Y.; Huang, Y.; Ding, H.; Luscombe, A.; Johnson, M.; Harlow, J.E.; Gauthier, R.; Dahn, J.R. Ultrasonic scanning to observe wetting and “unwetting” in li-ion pouch cells. Joule 2020, 4, 2017–2029. [Google Scholar] [CrossRef]
  14. Wu, M.-S.; Liao, T.-L.; Wang, Y.-Y.; Wan, C.-C. Assessment of the wettability of porous electrodes for lithium-ion batteries. J. Appl. Electrochem. 2004, 34, 797–805. [Google Scholar] [CrossRef]
  15. Günter, F.J.; Habedank, J.B.; Schreiner, D.; Neuwirth, T.; Gilles, R.; Reinhart, G. Introduction to Electrochemical Impedance Spectroscopy as a Measurement Method for the Wetting Degree of Lithium-Ion Cells. J. Electrochem. Soc. 2018, 165, A3249–A3256. [Google Scholar] [CrossRef]
  16. Schilling, A. Design of an automated system to accelerate the electrolyte distribution in lithium-ion batteries. Int. J. Mech. Eng. Robot. Res. 2018, 162–166. [Google Scholar] [CrossRef]
  17. Sheng, Y.; Fell, C.R.; Son, Y.K.; Metz, B.M.; Jiang, J.; Church, B.C. Effect of calendering on electrode wettability in lithium-ion batteries. Front. Energy Res. 2014, 2, 2. [Google Scholar] [CrossRef] [Green Version]
  18. Liu, M.; Zhang, P.; Gou, L.; Hou, Z.; Huang, B. Enhancement on the thermostability and wettability of lithium-ion batteries separator via surface chemical modification. Mater. Lett. 2017, 208, 98–101. [Google Scholar] [CrossRef]
  19. Suharto, Y.; Lee, Y.; Yu, J.-S.; Choi, W.; Kim, K.J. Microporous ceramic coated separators with superior wettability for enhancing the electrochemical performance of sodium-ion batteries. J. Power Sources 2018, 376, 184–190. [Google Scholar] [CrossRef]
  20. Knoche, T.; Reinhart, G. Electrolyte Filling of Large-Scale Lithium-Ion Batteries: Challenges for Production Technology and Possible Approaches. Appl. Mech. Mater. 2015, 794, 11–18. [Google Scholar] [CrossRef]
  21. Leithoff, R.; Dilger, N.; Duckhorn, F.; Blume, S.; Lembcke, D.; Tschöpe, C.; Herrmann, C.; Dröder, K. Inline monitoring of battery electrode lamination processes based on acoustic measurements. Batteries 2021, 7, 19. [Google Scholar] [CrossRef]
  22. Frankenberger, M.; Trunk, M.; Seidlmayer, S.; Dinter, A.; Dittloff, J.; Werner, L.; Gernhäuser, R.; Revay, Z.; Märkisch, B.; Gilles, R.; et al. SEI Growth impacts of lamination, formation and cycling in lithium ion batteries. Batteries 2020, 6, 21. [Google Scholar] [CrossRef] [Green Version]
Figure 1. Illustration of the experimental setup of experiments VR1 and VR2. Camera of the optical measurement (VR2) on the left and the tensiometer of the gravimetric measurement (VR1) on the right. On the top right is a rendered detailed representation of the sample holder.
Processes 09 01851 g001
Figure 2. Experimental setup for the electrochemical investigation of the electrolyte wetting. Special test cells were connected before electrolyte filling to a potentiostat. The electrochemical measurements were started simultaneously with the electrolyte filling.
Processes 09 01851 g002
Figure 3. Results of gravimetric measurement of the cathode separator measurement series (i) to (iii). Smoothed measurement data of the tensiometer measurement (left) and transformed measurement data with an evaluation range of 10 to 15 s0.5 (right).
Processes 09 01851 g003
Figure 4. Results of optical measurement of the cathode separator measurement series (i) to (iii). Data points of the time course of mean wetting heights (left) and transformed mean heights with evaluation ranges from 10 to 20 s0.5 (right).
Processes 09 01851 g004
Figure 5. Images of the optical measurement of the cathode separator measurement series at four time points. The shape and height of the wetted visible surface are shown. Start of the measurement at t = 0 s.
Processes 09 01851 g005
Figure 6. Nyquist representation of the time-dependent impedance outcome for one of the samples laminated at 120 °C (a). Averaged impedance modulus at 1 Hz as a function of time for the three investigated samples (b).
Processes 09 01851 g006
Figure 7. Average of the normalized modulus | Z | Norm of the samples laminated at 120 °C (a). Absolute value of the first numerical derivation of the normalized modulus for one sample laminated at 120 °C and the respective analytical fit (b).
Processes 09 01851 g007
Figure 8. Averaged wetting time for the samples studied by means of impedance measurements in dependence on the neglected points n at the beginning of the measurement and the respective standard deviations (a). Averaged wetting times for the three samples when neglecting n = 5 points of raw data (b).
Processes 09 01851 g008
Figure 9. Schematic representation of a possible wetting profile in an electrode-separator laminate along the laminate thickness x. The assumed functional profile is imaginary and requires further investigation.
Processes 09 01851 g009
Table 1. Evaluated parameters penetration rate K and wetting rate k for the cathode separator measurement series (i) to (iii).
MaterialPenetration Rate K
[g/s0.5]
Standard Deviation
[g/s0.5]
Wetting Rate k
[mm/s0.5]
Standard Deviation
[mm/s0.5]
Non-laminated compound2.40 × 10−34.84 × 10−41.69 × 10−23.40 × 10⁻³
Laminated compound 80 °C3.76 × 10−38.54 × 10−42.64 × 10−26.00 × 10⁻³
Laminated compound 120 °C3.79 × 10−35.22 × 10−42.67 × 10−23.67 × 10⁻³
Table 2. Average heights at three time-points and evaluated parameters wetting rate k for the cathode separator measurement series (i) to (iii).
MaterialAvg. Height at t = 100 s
[mm]
Avg. Height at t = 300 s
[mm]
Avg. Height at t = 600 s
[mm]
Wetting Rate k
[mm/s0.5]
Non-laminated separator4.828.8114.896.48 × 10−1
Non-laminated cathode1.585.0610.814.67 × 10−1
Non-laminated compound3.827.8014.046.09 × 10−1
Laminated compound 80 °C15.4221.0527.818.27 × 10−1
Laminated compound 120 °C5.6211.7017.303.83 × 10−1
Publisher’s Note: MDPI stays neutral with regard to jurisdictional claims in published maps and institutional affiliations.

