Article

A Case Study of Turbulent Free Jet Flows Issuing from Rectangular Slots on Process Performances and Quality of Hot-Air-Dried Apple

Univ. Bretagne Sud, UMR CNRS 6027, IRDL, F-56300 Pontivy, France
*
Author to whom correspondence should be addressed.
Submission received: 10 September 2021 / Revised: 8 October 2021 / Accepted: 18 October 2021 / Published: 25 October 2021
(This article belongs to the Special Issue Redesign Processes in the Age of the Fourth Industrial Revolution)

Abstract

:
This study deals with the improvement in drying process performances and the quality of the final product for industrial equipment in the food industry. Designers need to optimize the design parameters of devices to create synergies between the greater energy efficiency of the process and high-quality dried products. Air impingement drying was carried out on apple cylinders at 323 K and with air velocities ranging between 30 and 60 m s−1. The studied drying process presents a particular setup of jets as they are multiple rectangular slot jets issued from triangular nozzles. The effect of four design jet parameters (slot width, nozzle-to-surface height, nozzle-to-nozzle spacing, and airflow) on the drying process performances and the quality of the final product was analyzed and optimized using response surface methodology (RSM). A minimal influence of design jet parameters on the process performances was shown, while an important impact was observed on the quality of dried apple. The slot width and the nozzle-to-nozzle spacing had a significant effect on the textural and functional properties. Predictive models were established and good agreements were found between predictive and observed values. Sorption isotherms were properly modeled by the Guggenheim–Anderson–de Boer (GAB) model.

Graphical Abstract

1. Introduction

The drying process is largely used to reduce the moisture content of agricultural products to a certain level; this is achieved by inhibiting the growth of the microorganisms and minimizing deterioration reactions to extend the shelf life of products. However, the high temperature and long drying time needed in conventional hot-air dryers negatively impact the organoleptic (color and texture), functional (rehydration), and nutritional qualities of food products [1,2,3,4].
Among the different drying methods available, the drying process that uses impinging jets seems to be promising for food thermal treatment [5]. During the air impingement drying process, the air reaches the surface of the product at high velocities which reduces the air layer that is directly in contact with the product (boundary layer), increases heat and mass transfers, diminishes the drying time, and increases the global quality of the product [6,7]. Air impingement drying has become popular over the past 25 years in the food industry and has been applied to vegetables and fruits (seedless grapes, Hami melon flakes, apricots, carrots, line peppers), herbs (American ginseng, yam), foods (tortilla chips, potato chips, fish cakes, fish particles, shrimp), seeds, and soy residue or okara [8]. Among the parameters in impingement flows, the most important parameters are the nozzle-to-product spacing, the nozzle cross-section (circular or rectangular), the nozzle exit conditions (length, smoothness, shape of the nozzle, and Reynolds number (calculated from the airflow)) [9]. Most of the quoted studies have been published by the same research group and have been carried out on the same dryer composed of a series of round nozzles in lines. The distance between the impingement nozzle and the surface of the product has been approximately 8 × 10⁻² m, and other parameters characterizing the airflow have not been reported. These studies have shown that air impingement drying reduces the drying time and increases the quality of dried products (color, texture, nutrient content, rehydration ratio, and microstructure by scanning electron microscope). The following conditions have previously been investigated: 323–353 K and 3–20 m s−1 [8]. At present, the available information concerning the parameters involved in impingement flows during the drying of food and agricultural products is limited.
The optimization of different parameters involved in impingement flows has been carried out for cooling processes. Hardisty and Can [10] studied the effects of changes in the geometry of a slot nozzle on the heat characteristics of an impinging air jet. They showed that the heat transfer coefficient is at maximum value for a ratio H/B (ratio between the nozzle-to-product height and the slot width) in the region of 6–8. Can et al. [11] experimentally determined heat transfer coefficients under arrays of impinging air jets from slot nozzles and circular holes. The results were discussed in terms of free area (ratio of the area covered by jets on the total surface area swept by jets). The authors characterized a maximum heat transfer coefficient of 254 W m−2 K−1 for a free area of 4.25%, a slot width of 2 × 10⁻³ m, a height of 1.2 × 10⁻² m (ratio H/B = 6), and an air jet velocity of 40 m s−1. More recently, Etemoğlu et al. [12] conducted a numerical study to optimize the thermal processes of impinging air jets using single and multiple nozzle systems. They found that an increase in the slot width decreases the heat transfer coefficient. For example, when the slot width increases from 3 to 6 × 10⁻³ m, and then to 1.2 × 10⁻² m, this results in a decrease in heat transfer coefficients from 133 to 95.6, and then to 68.6 W m−2 K−1. The reduction factors are retained (1.4 and 2, respectively) when the air velocity increases (from 20 to 40, and then to 60 m s−1). For multi-nozzle systems, the heat transfer coefficient depends on the free area. A maximum coefficient of 315 W m−2 K−1 was determined for a 3% free area, 3 × 10⁻³ m slot width, 1.8 × 10⁻² m height (ratio H/B = 6), and 60 m s−1 air velocity. It is worth mentioning that these studies have been carried out within the same research group.
Optimization is an essential tool in food engineering for the efficiency of processing operations and the high acceptability of the processes yield. Response surface methodology (RSM) is a statistical technique that includes optimization. This methodology has been widely used in many food processing applications, such as the optimization of osmotic dehydration, spray drying, and fluid bed drying conditions, since the early 2000s [13]. In this work, we are primarily interested in the nonlinear effect of the parameters and their interactions. For example, quadratic effects have been identified for air temperature and air velocity in the convective drying of apple slice [14].
Parthasarathi and Anandharamakrishnan [15] reviewed different modeling techniques to understand food microstructures. Among physical, chemical, and structural changes during the process, they focused on three properties that play an important role in determining food characteristics: skrinkage (the change in volume of food material due to water loss during dehydration), rehydration (the restoration of properties from the dehydrated food material), and texture (the enjoyment and acceptance of food sold to customers). Hardness is a textural property of fruits that provides important information on the storability and resistance to injury of the food products during handling and processing. The loss of texture of rehydrated apples may be highly significant, even for a gentle process such as vacuum freeze-drying [16]. Values of hardness, defined as puncture rupture force, have been used to define the textural impacts of different operations, such as air drying, texturing vacuum treatment and freezing/thawing [17]. Vega-Gálvez et al. [18] studied the effect of temperature and air velocity on the drying kinetics and quality attributes of apples (Granny Smith variety). Depending on the treatment parameters, hardness was very sensitive to drying and decreased by up to 67% with respect to the fresh sample. The sorption isotherms of fresh and processed apple (Golden Delicious variety) were measured by Sá et al. [19]. They successfully compared the Guggenheim–Anderson–de Boer (GAB) model of their data with similar curves obtained from five similar works. Moraes et al. [20] applied GAB, Brunauer–Emmet–Teller (BET), Henderson–Thompson and Oswin models to moisture sorption isotherms of apple at 323 K. They mentioned that the parameters of the GAB and BET models have a physical meaning, and identified the best fitting for the GAB model. These results confirmed that the GAB model presented the best fit for more than 50% of the fruits, meats, and vegetables, as stated by Lomauro et al. [21].
This study has two major objectives. The first is to determine the influence of four design jet parameters, namely the slot width, the nozzle-to-surface height, the nozzle-to-nozzle spacing, and the airflow, on the drying process performances and the quality of the final products. The second is to propose empirical predictive models according to the most relevant design jet parameters. Cylinder-shaped apples were chosen as a model food.

2. Materials and Methods

This research was carried out on apples because they are a product largely studied in the literature, and are easily available and cheap. Moreover, the apple is one of the most popular and widespread fruits around the world, with a production of 87 million tons per year [22]. The Gala variety was selected as it is one of the most appreciated varieties worldwide.

2.1. Raw Material and Sample Preparation

Apples (Malus domestica Gala) were harvested in September/October and kept in storage rooms at 277–279 K for six months. They were issued from a local production near to the supermarket (6 km distance). Before they reached the store, the apples were calibrated, and the overall quality of the product was regularly controlled. The apples were purchased at a supermarket and stored in our lab at 277 K until use. Cylindrical samples were cut through the central axis with a cutting shape (2 × 10⁻² m in diameter and 4 × 10⁻² m in height). Cylinder-shaped samples were chosen as the geometry most extensively investigated is the slab. It was specified that samples were placed vertically. To maintain the samples in a vertical position during the drying, polytetrafluoroethylene (PTFE) sample holders were designed (Figure 1a). The initial mass of the samples was 13.4 ± 0.3 × 10⁻³ kg.

2.2. Drying Processes

Two types of drying, air impingement and oven drying, at 323 K were compared, particularly for the sorption capacity of the dried apples, as oven drying at a moderate temperature and with natural convection is a slow drying process. In such conditions, tissue shrinkage and collapse should be limited, and the formation of the crust layer on the surface of the dried materials should be avoided due to low thermal gradients.

2.2.1. Air Impingement Drying

Boy et al. [23] and Boy et al. [24] previously described the air impingement dryer equipment. The dryer mostly consists of a dehumidifier and a centrifugal fan to supply the air in two separate cylindrical ducts (0.25 m diameter), each with an electrical heater and joined to each other in the drying chamber. At the exit of the drying chamber, the air circulates back to the fan with a degree of recirculation of 100% (Figure 1b). Inside the drying chamber, the air temperature was controlled. Both the hot air heating and the airflow were in continuous operation, meaning that the airflow continuously circulated in a closed circuit surrounding the samples.
The setup of the air jets was original as they were created by triangular nozzles pierced with rectangular slots (Figure 1c). Two nozzle-to-nozzle spacings (Δ = 5 × 10⁻² m and 10 × 10 2 m), two slot widths (B = 2 × 10⁻³ m and 4 × 10⁻³ m), and two heights between the nozzle outlet and the sample surface for the upper part were tested (Hupper = 1.2 × 10⁻² m and 2.4 × 10⁻² m). The height for the lower part was fixed (Hlower = 2.5 × 10⁻² m). The airflow was circulated perpendicular to the sample surface and the sample was placed on a grid subjected to a back-and-forth motion which allowed for the entire surface to be covered by the airflow.
Experiments were performed at a moderate air temperature of 323 K for two airflows (3460 m3 h−1 and 4282 m3 h−1), which corresponded to 80% and 99% of the nominal frequency of the fan motor (T2A90S-2, TECHTOP© Motor, Shanghai, China). The corresponding air velocities at the slot outlets were measured using an anemometer with a pitot tube (TA400, range 1–80 m s−1, accuracy ± 2.5% at 10 m s−1, Trotec, Heinsberg, Germany). Air velocities ranged from 30 to 60 m s−1. During the experiments, a T-type thermocouple (accuracy ± 0.1 K) was used to measure the air temperature under the nozzles, and the data were collected every 10 s by an acquisition unit (SR Mini System, TC S.A., Dardilly, France). The air humidity under the nozzles was measured using a hygrometer (HygroPalm 22-A, 0–100%, accuracy ± 1.2%, Rotronic, Saint-Priest, France). The mean values of air temperature and humidity were as follows: 323.0 ± 2.4 K and 11.8 ± 1.6%.
Four samples were dried at the same time and the weightings were made using a precision scale (Acculab, ACL-110.4, accuracy 1 × 10⁻⁷ kg, Sartorius, Göttingen, Germany); this was firstly completed at 10 min intervals during the first two hours, then the time interval was changed to 30 min for the next four hours, to finally be expanded to 1 h after 6 h of drying. All experiments lasted from 7 to 10 h. The experiments were continued until a moisture ratio ω of 0.1 was obtained. The moisture ratio (ω) was defined according to the following expression:
ω   = M t   M e M 0   M e
where Mt is the moisture content at time (t) (kg kg−1, dry basis (d.b.)), M0 is the initial moisture content (kg kg−1, d.b.), and Me is the equilibrium moisture content (kg kg−1, d.b.) Mt and M0 were determined by the ratio of the mass of water contained in the sample at time (t) and at t = 0, respectively, on the dry solids content (see Section 2.2.3 for further details).
Dried samples were cooled in ambient conditions, packed into heat-sealed polyethylene bags, kept at 277 K, and protected from light until further analysis.

2.2.2. Oven Drying

Triplicate samples were dried in an oven (BM 600, Memmert, Schwabach, Germany) at 323 ± 2 K. Samples were withdrawn and weighed every 30 min until they reached a moisture ratio of 0.1. After the experiment, samples were preserved in the same manner as those from the air impingement drying.

2.2.3. Equilibrium Moisture Content and Dry Solids Content

The equilibrium moisture content was determined by placing dried samples in a drying cabinet (Nalgene 5317-0120, Sigma-Aldrich, Saint-Louis, MO, USA), all samples were left in an oven at 323 K to a constant weight (deviation less than 10−6 kg). Then, the samples were transferred to an oven at 378 ± 2 K for at least 24 h to obtain the dry solids content.

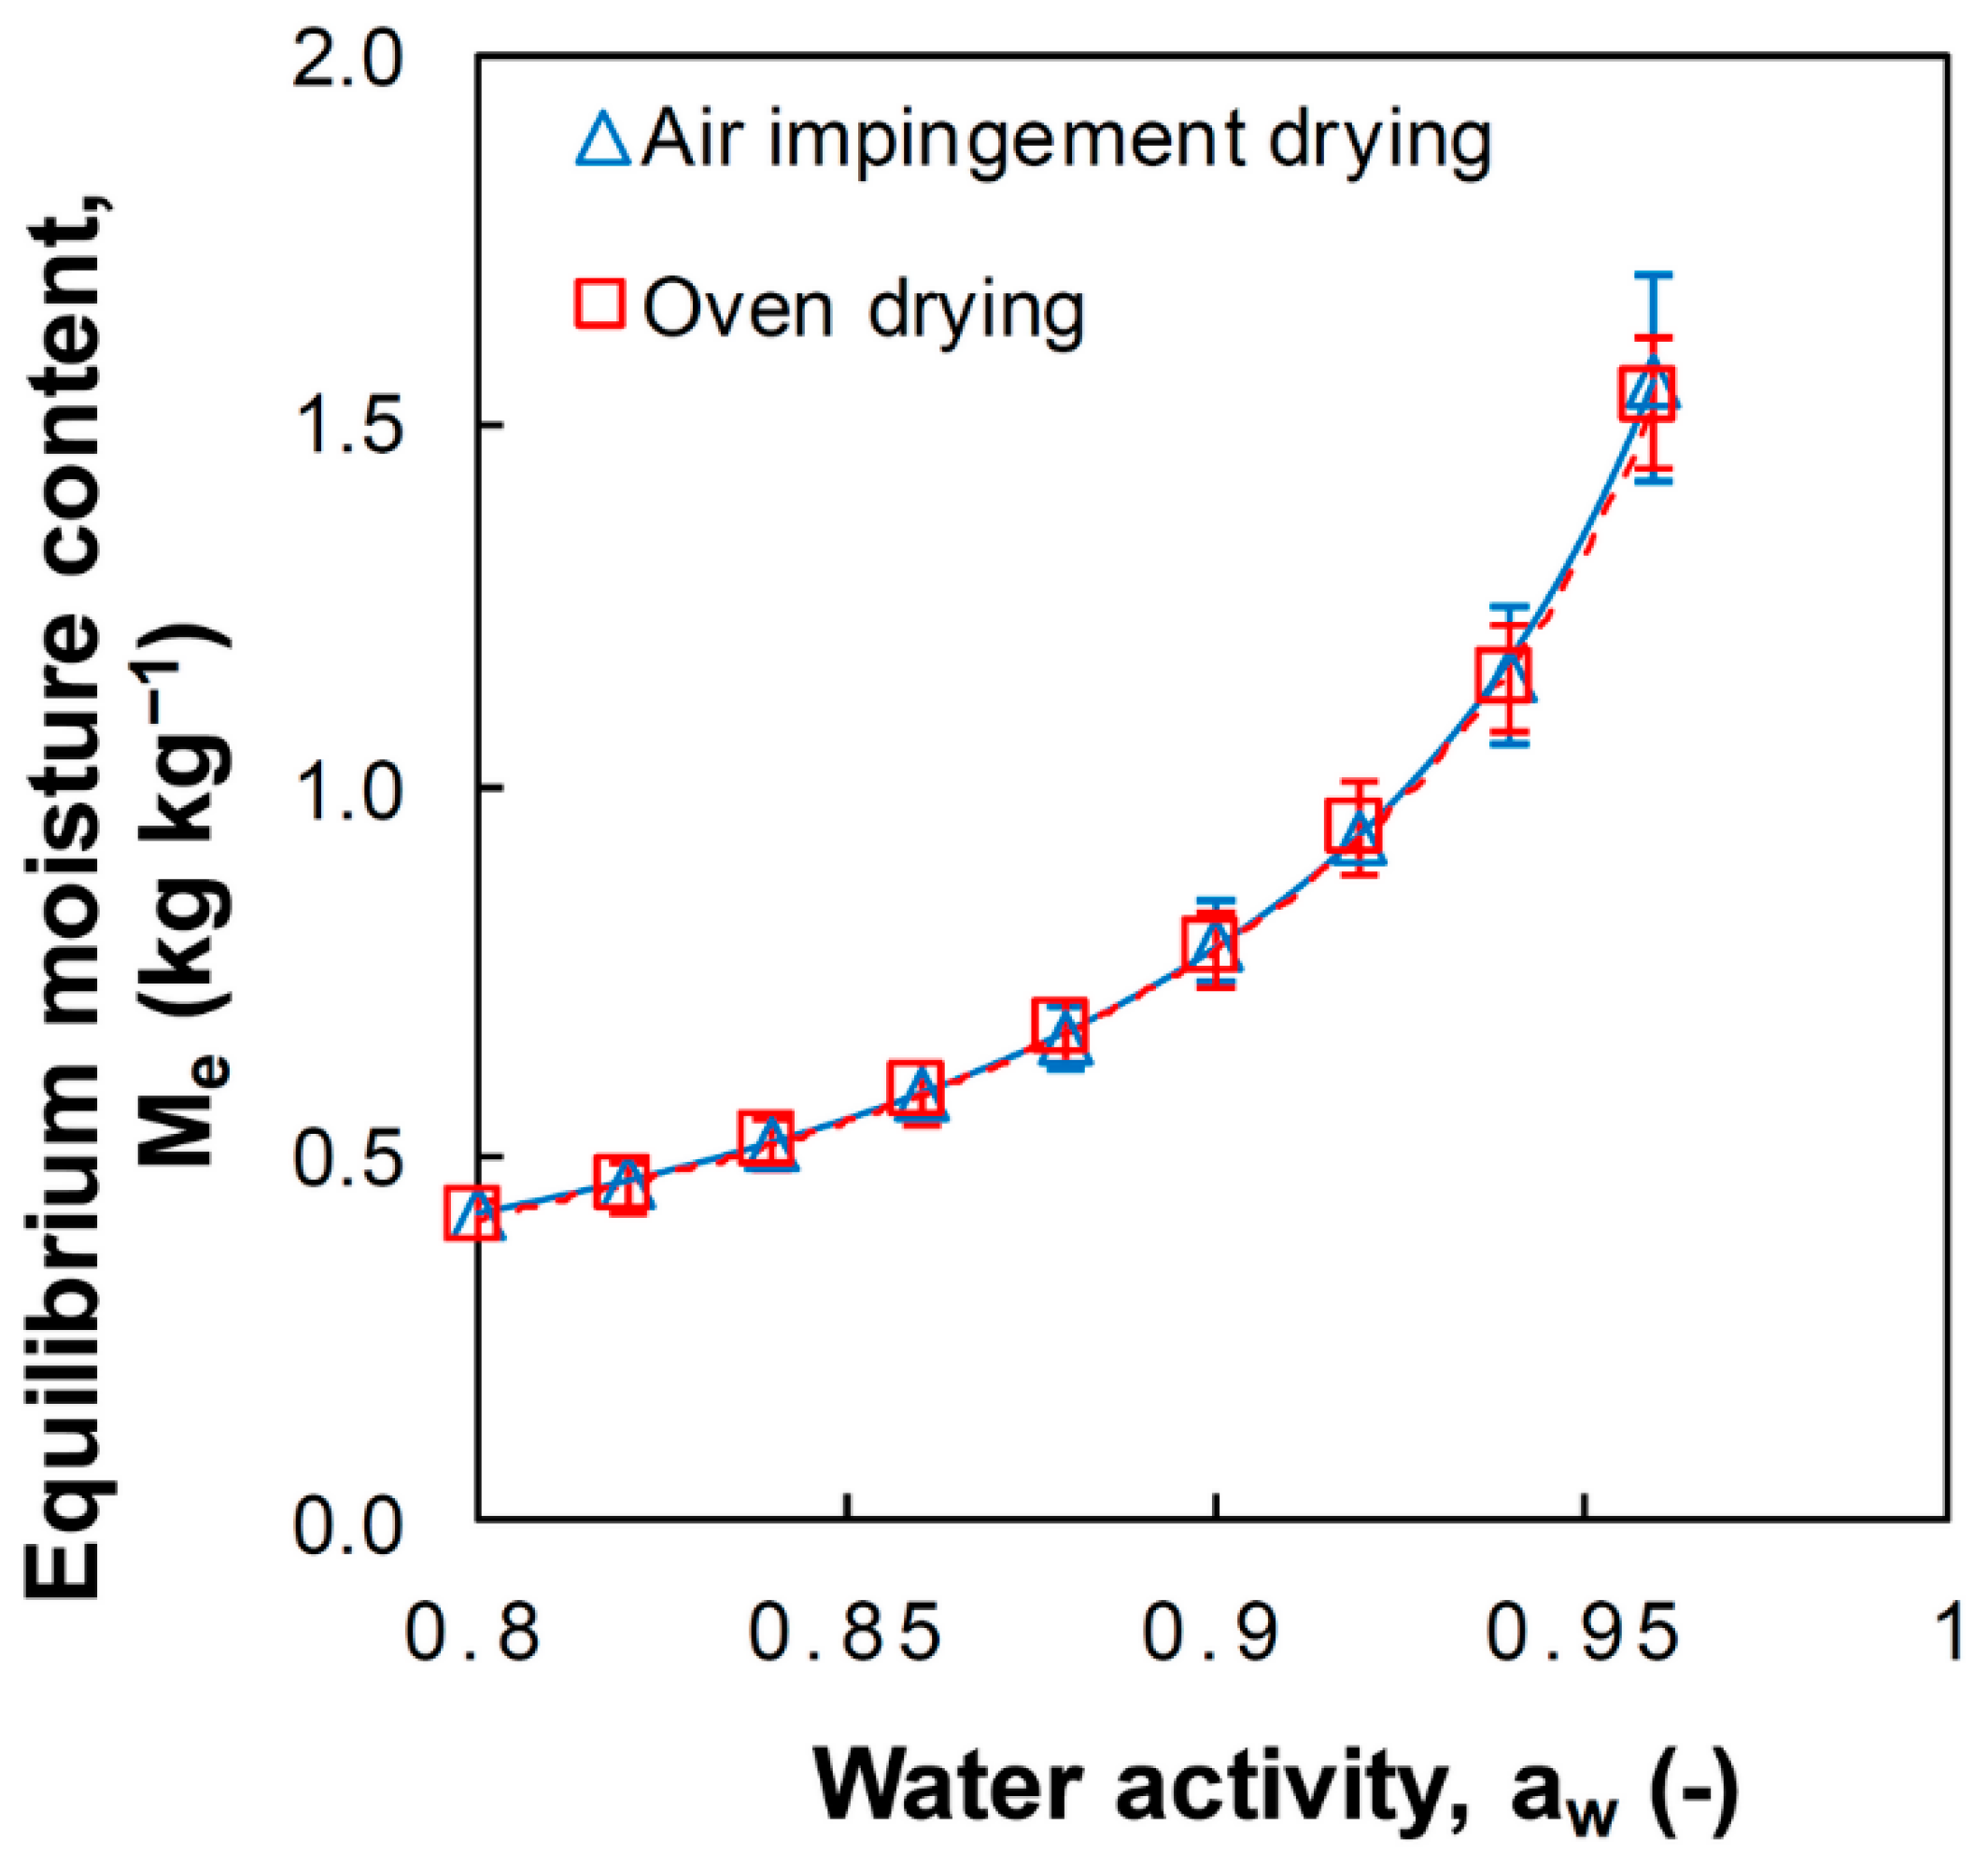
2.3. Sorption Isotherms

Before performing the sorption isotherms, dried samples were stabilized by a gravimetric method [20]. Samples were transferred to a drying cabinet (Nalgene®, Thermo Fisher Scientific, Waltham, MA, USA) and placed in an oven in which the relative humidity was controlled by a saturated salt solution. To maintain the samples at a constant water activity aw of 0.8 (corresponding to ω = 0.1), a saturated salt solution of (NH4)2SO4 was used at 323 K. Samples were then weighed until equilibrium with the surrounding air was reached (constant weight). Once stabilized, sorption isotherms were measured using a Dynamic Vapor Sorption (DVS) equipment (IGAsorp HT, Hiden Instruments Ltd., Warrington, UK). About 2.1 × 10⁻⁵ kg of dried apples were placed under an air flow (4.2 × 10⁻⁶ m3 s−1) until a constant weight was achieved. The mass uptake and sorption kinetics were recorded through a fine balance (10−7 kg resolution) and a control of both temperature and humidity. Curves were registered for increasing humidity from 80 to 96%, in 2 increments, and the temperature was kept constant at 323 K. The equilibrium mass was determined by the exponential increase in mass over time for each increment. Samples were then exposed to zero humidity to estimate the dry solids content. Sorption isotherms were determined through triplicate samples.
Experimental data were fitted using the Guggenheim–Anderson–de Boer (GAB) model because this model has been found to be the most fitting model to the sorption isotherm of apple (Fuji variety) at 323 K [20,25]. The equation was defined as:
M e = M m · C g · a w · K ( 1 K · a w ) ( 1 K · a w + C g · K · a w )
where Mm is the monolayer moisture content (kg kg−1, d.b.), Cg and K are constants, and aw is the water activity.

2.4. Heat and Mass Transfer Parameters

The determination of heat and mass transfer coefficients h and km, respectively, requires the knowledge of some physical properties which were estimated from the literature [26,27].

2.4.1. Heat Transfer Coefficient

The heat transfer coefficient was determined from the thermal history of an aluminum plate, which is known as the lumped capacitance method [28,29]. This method assumes that the internal temperature gradient is negligible because the aluminum thermal conductivity is high. Thus, the resistance to the heat transfer is located on the surface. The plate was placed in the refrigerator to maintain a maximum temperature difference with the hot airflow. The increase in temperature of the aluminum plate was measured until it reached air temperature (323 K). The heat transfer coefficient (h) (W m−2 K−1) was calculated by solving the heat balance that occurred when the plate was surrounded by air:
ρ Al   ·   C p Al   ·   V   ·   dT dt =   h   ·   A   ·   ( T a   T )
where ρAl is the density of aluminum (kg m−3), CpAl is the specific heat of aluminum (J kg−1 K−1), V is the volume of the aluminum plate (m3), T is the temperature (K), t is the time (s), A is the surface area of the aluminum plate (m2), and Ta is the hot air temperature (K).
After integration, Equation (3) becomes:
ln T = ln ( T a   T ) ( T a   T 0 ) = h   ·   A ρ Al   ·   C pAl   ·   V   ·   t
where T0 is the initial temperature of the aluminum plate (K).
The value of h was deduced from the slope of the line in the graph representing ln T* vs. time.

2.4.2. Mass Transfer Parameters

The mass transfer coefficient (km) can be estimated by an analogy with the heat transfer coefficient according to the correlation developed by Chilton and Colburn [30]:
k m = h   ·   ( Pr ) 2 / 3 ρ air   ·   C p air   ·   ( Sc ) 2 / 3
where ρair is the density of air (kg m−3), C p air is the specific heat of air (J kg−1 K−1), Pr is the Prandtl number, and Sc is the Schmidt number.
The effective moisture diffusivity (Deff) (m2 s−1) was calculated from Fick’s second law of diffusion (Equation (6)) when the moisture diffusion is the mass transport mechanism that limits the drying process:
dM db dt =   D eff   ·   d 2 M db dx 2
where Mdb is the moisture content (kg kg−1, d.b.) and x is the characteristic dimension of the sample (m).
The mathematical solution of Equation (6), established by Crank [31] for an infinite slab, was expressed by:
ω   = 8 π 2   i = 0 1 ( 2 i   + 1 ) 2   ·   exp ( ( 2 i + 1 ) 2   ·   π 2   ·   D eff   ·   t 4 L 2 )
where i is the number of terms considered in the series of the exponential functions and L is the sample half thickness (m).
It should be noted that Equation (7) involves numerous assumptions, including a one-dimensional transport of moisture within the product, a negligible shrinkage, and a constant diffusion coefficient (for further details, see Boy et al. [23]). Among the different geometries, we chose the solution developed for an infinite slab. This assumes an isotropic material, which is the case for apple. However, the solution developed for an infinite cylinder implies that the diffusion is radial. This assumption does not hold in our case. To take into account the sample’s shape, we introduced the equivalent thickness (Le) in Equation (7) instead of the sample thickness (2 L). Le was calculated by dividing the volume of the cylinder by the surface area (Le = 4 × 10⁻³ m). As stated previously by Boy et al. [24], two exponential terms (i = 1) were sufficient to identify the effective moisture diffusivity (Deff) of apple. Accordingly, Equation (7) was simplified to the first two terms.
Although the velocities studied were high (between 30 and 60 m s−1), it is more appropriate to call the diffusivity characterized in Equation (7) as apparent moisture diffusivity (Dapp), as it may be a function of the air velocity. Indeed, the diffusivity introduced in Equation (7) should be an intrinsic material property and independent of the external drying conditions. The evolution of Dapp versus the air velocity was not studied as it goes beyond the scope of the present work.

2.4.3. Goodness of Fit

Non-linear regressions were used to identify the parameters of the selected models, namely, Mm, Cg, K, and Deff (Matlab, The Mathworks, Inc., Natick, MA, USA). The coefficient of determination (R2), the adjusted coefficient of determination (adjusted R2), the root-mean-square error (RMSE), the chi-square (χ2), and the residual sum of squares (RSS) were determined to evaluate the fitting of Equations (2) and (7) to the experimental data. These parameters were calculated as mentioned below:
R 2 = 1 j N ( ω exp , j   ω pre , j ) 2 j N ( ω exp , j   ω ¯ exp , j ) 2
adjusted   R 2 = 1 j = 1 N ( ω exp , j   ω pre , j ) 2   ·   ( N   1 ) j = 1 N ( ω exp , j ω ¯ exp , j ) 2   ·   ( N     p )  
RMSE   = 1 N   j = 1 N ( ω exp ,   j   ω pre ,   j ) 2
χ 2 = j = 1 N ( ω exp , j     ω pre , j ) 2 N     p
RSS   = j = 1 N ( ω exp , j   ω pre , j ) 2
where ωexp,j and ωpre,j are the experimental and predicted moisture ratios, respectively, ω ¯ exp , j is the average of the experimental moisture ratio, N is the number of observations, and p is the number of the parameters involved in the selected models (three parameters in Equation (2) and a single parameter in Equation (7), respectively).

2.5. Quality Attributes

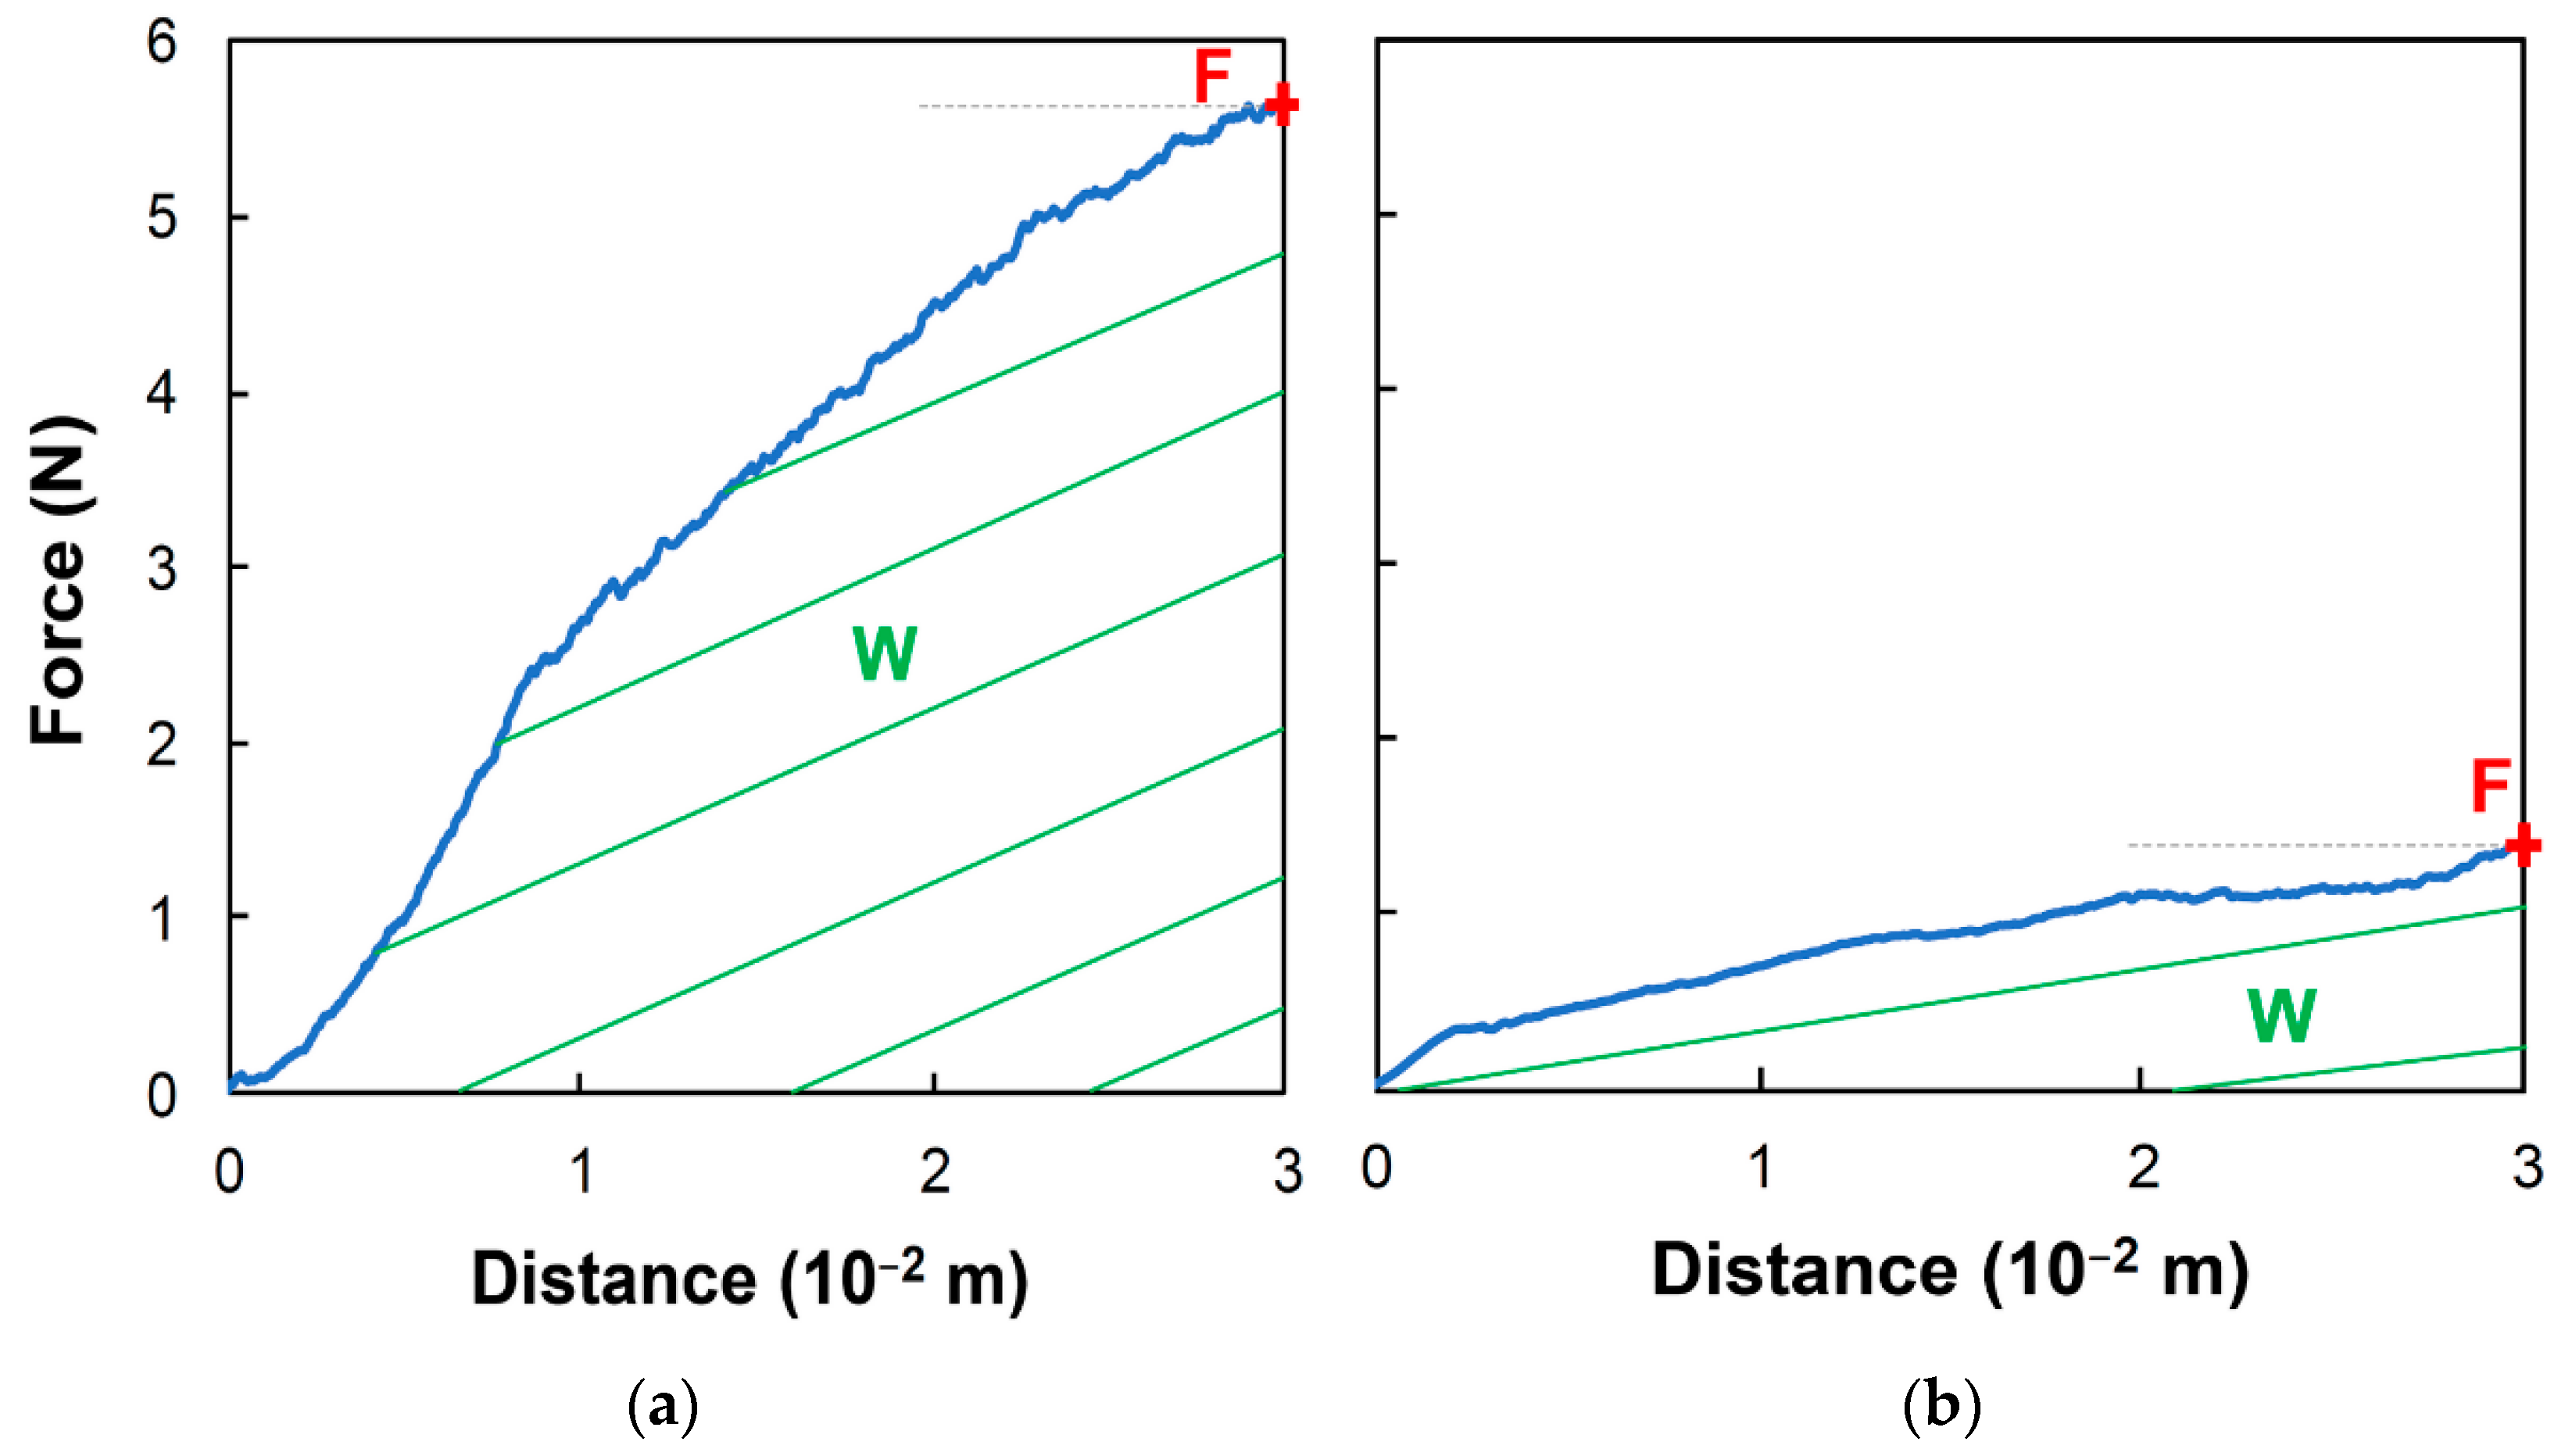
2.5.1. Texture Analysis

The penetration force required to puncture the apple tissue was measured using a Texture Analyzer (TA HD Pluc C, Stable Micro Systems Ldt, Godalming, UK). A probe (2 × 10⁻³ m diameter convex tip) was used to puncture the sample through the central axis at a constant speed of 1.5 × 10⁻³ m s−1 over a distance of 3 × 10⁻² m. The force versus distance curves were plotted and two parameters were analyzed (Figure 2): hardness (F) (calculated in N), and the work associated with hardness (W) (calculated in N m). Hardness (F) is defined as the maximum force on the curve and represents the force required for the rupture of the flesh. The work associated with hardness (W) is calculated as the area under the curve up to F, and reflects the mechanical work needed for the rupture of the flesh. Both definitions and methods of calculation were based on earlier works [32]. Ten and five measurements were made in duplicate for fresh and dried apples, respectively.

2.5.2. Rehydration Ratio

The rehydration ratio (RR) was carried out to measure the capacity of dried samples to rehydrate. First, the rehydration time was assessed. For this purpose, the samples were immersed in 5 × 10⁻⁵ m3 distilled water at ambient temperature and were weighed regularly with a precision scale (ENTRIS 124i-1, accuracy 10−7 kg, Sartorius, Göttingen, Germany) until the mass was stable. Before weighing, the samples were drained on absorbent paper to remove the surface water [33]. The time needed for the rehydration process was 15,800 s (equal to 4 h and 23 min). Then, the rehydration ratio was calculated by weighing the samples before and after soaking in distilled water for 15,800 s (4 h and 38 min) [34]:
RR   = m τ   = 15,800   s m 0
where mτ = 15,800 s is the mass after rehydration (kg) and m0 is the initial mass before drying (kg).
Rehydration measurements were run in duplicate.

2.6. Design of Experiments

The effect of design jet parameters on both the drying process performances and the quality attributes of apples were studied using the response surface methodology (RSM). The design jet parameters (independent variables) were slot width (B), nozzle-to-surface height (H), nozzle-to-nozzle spacing (Δ), and airflow (υ). Two levels were selected, and the variation ranges are presented in Table 1.
Among the response parameters (dependent variables), the drying process performances were the drying time to reach a moisture ratio ω of 0.5 t, the heat and mass transfer coefficients (h and km), hardness (F), the work associated with hardness (W), and the rehydration ratio (RR). A full factorial design of experiments (DoE) was completed and included 16 trials (2k = 24 trials), as shown in Table 2. Each trial was completed in duplicate.
The response variables were analyzed using Statgraphics Plus 5.1 software (Statgraphics Technologies Inc., Warrenton, VA, USA). A statistical model (Equation (14)) was established to predict the response as a function of the studied parameters:
Y = β 0 + i = 1 k β i   · x i + i = 1 k j = 1 k β ij · x i · x j
where Y is the response variable, β are the regression coefficients, xi is the independent variable, and k is the number of studied parameters.
The statistical model was developed by deleting the least significant parameters.
The analysis of variance (ANOVA) was carried out to evaluate the significant differences between the studied parameters for each response at p-value ≤ 0.1 (Table 3).
The lower the p-value, the more significant the parameter. The relevance of the developed empirical model was estimated using the coefficient of determination (R2) and adjusted R2, the mean absolute error, and the standard error.
The optimization of the jet impingement process was achieved to find the best possible combination of the design jet parameters to ensure, if possible, the highest process performances and the best quality of the dried apples. The optimum parameters were identified to minimize the drying time to reach a moisture ratio ω of 0.5, hardness, and the work associated with hardness, and to maximize the heat and mass transfer coefficients and the rehydration ratio. Low textural properties (hardness and the work associated with hardness) were selected to prevent damage to the product, such as the case hardening phenomenon.

3. Results and Discussion

The initial moisture content of apple was 87.7 ± 0.7% in wet basis (w.b.), which corresponds to 7.2 ± 0.4 kg kg−1 in d.b.
The statistical study will be presented by distinguishing, on the one hand, the effect of the four operating parameters on the drying process performances (i.e., drying time, heat and mass transfer coefficients) and, on the other hand, the quality of the final product (i.e., apparent diffusivity and both textural and functional properties).

3.1. Influence of Operating Parameters on the Drying Process Performances

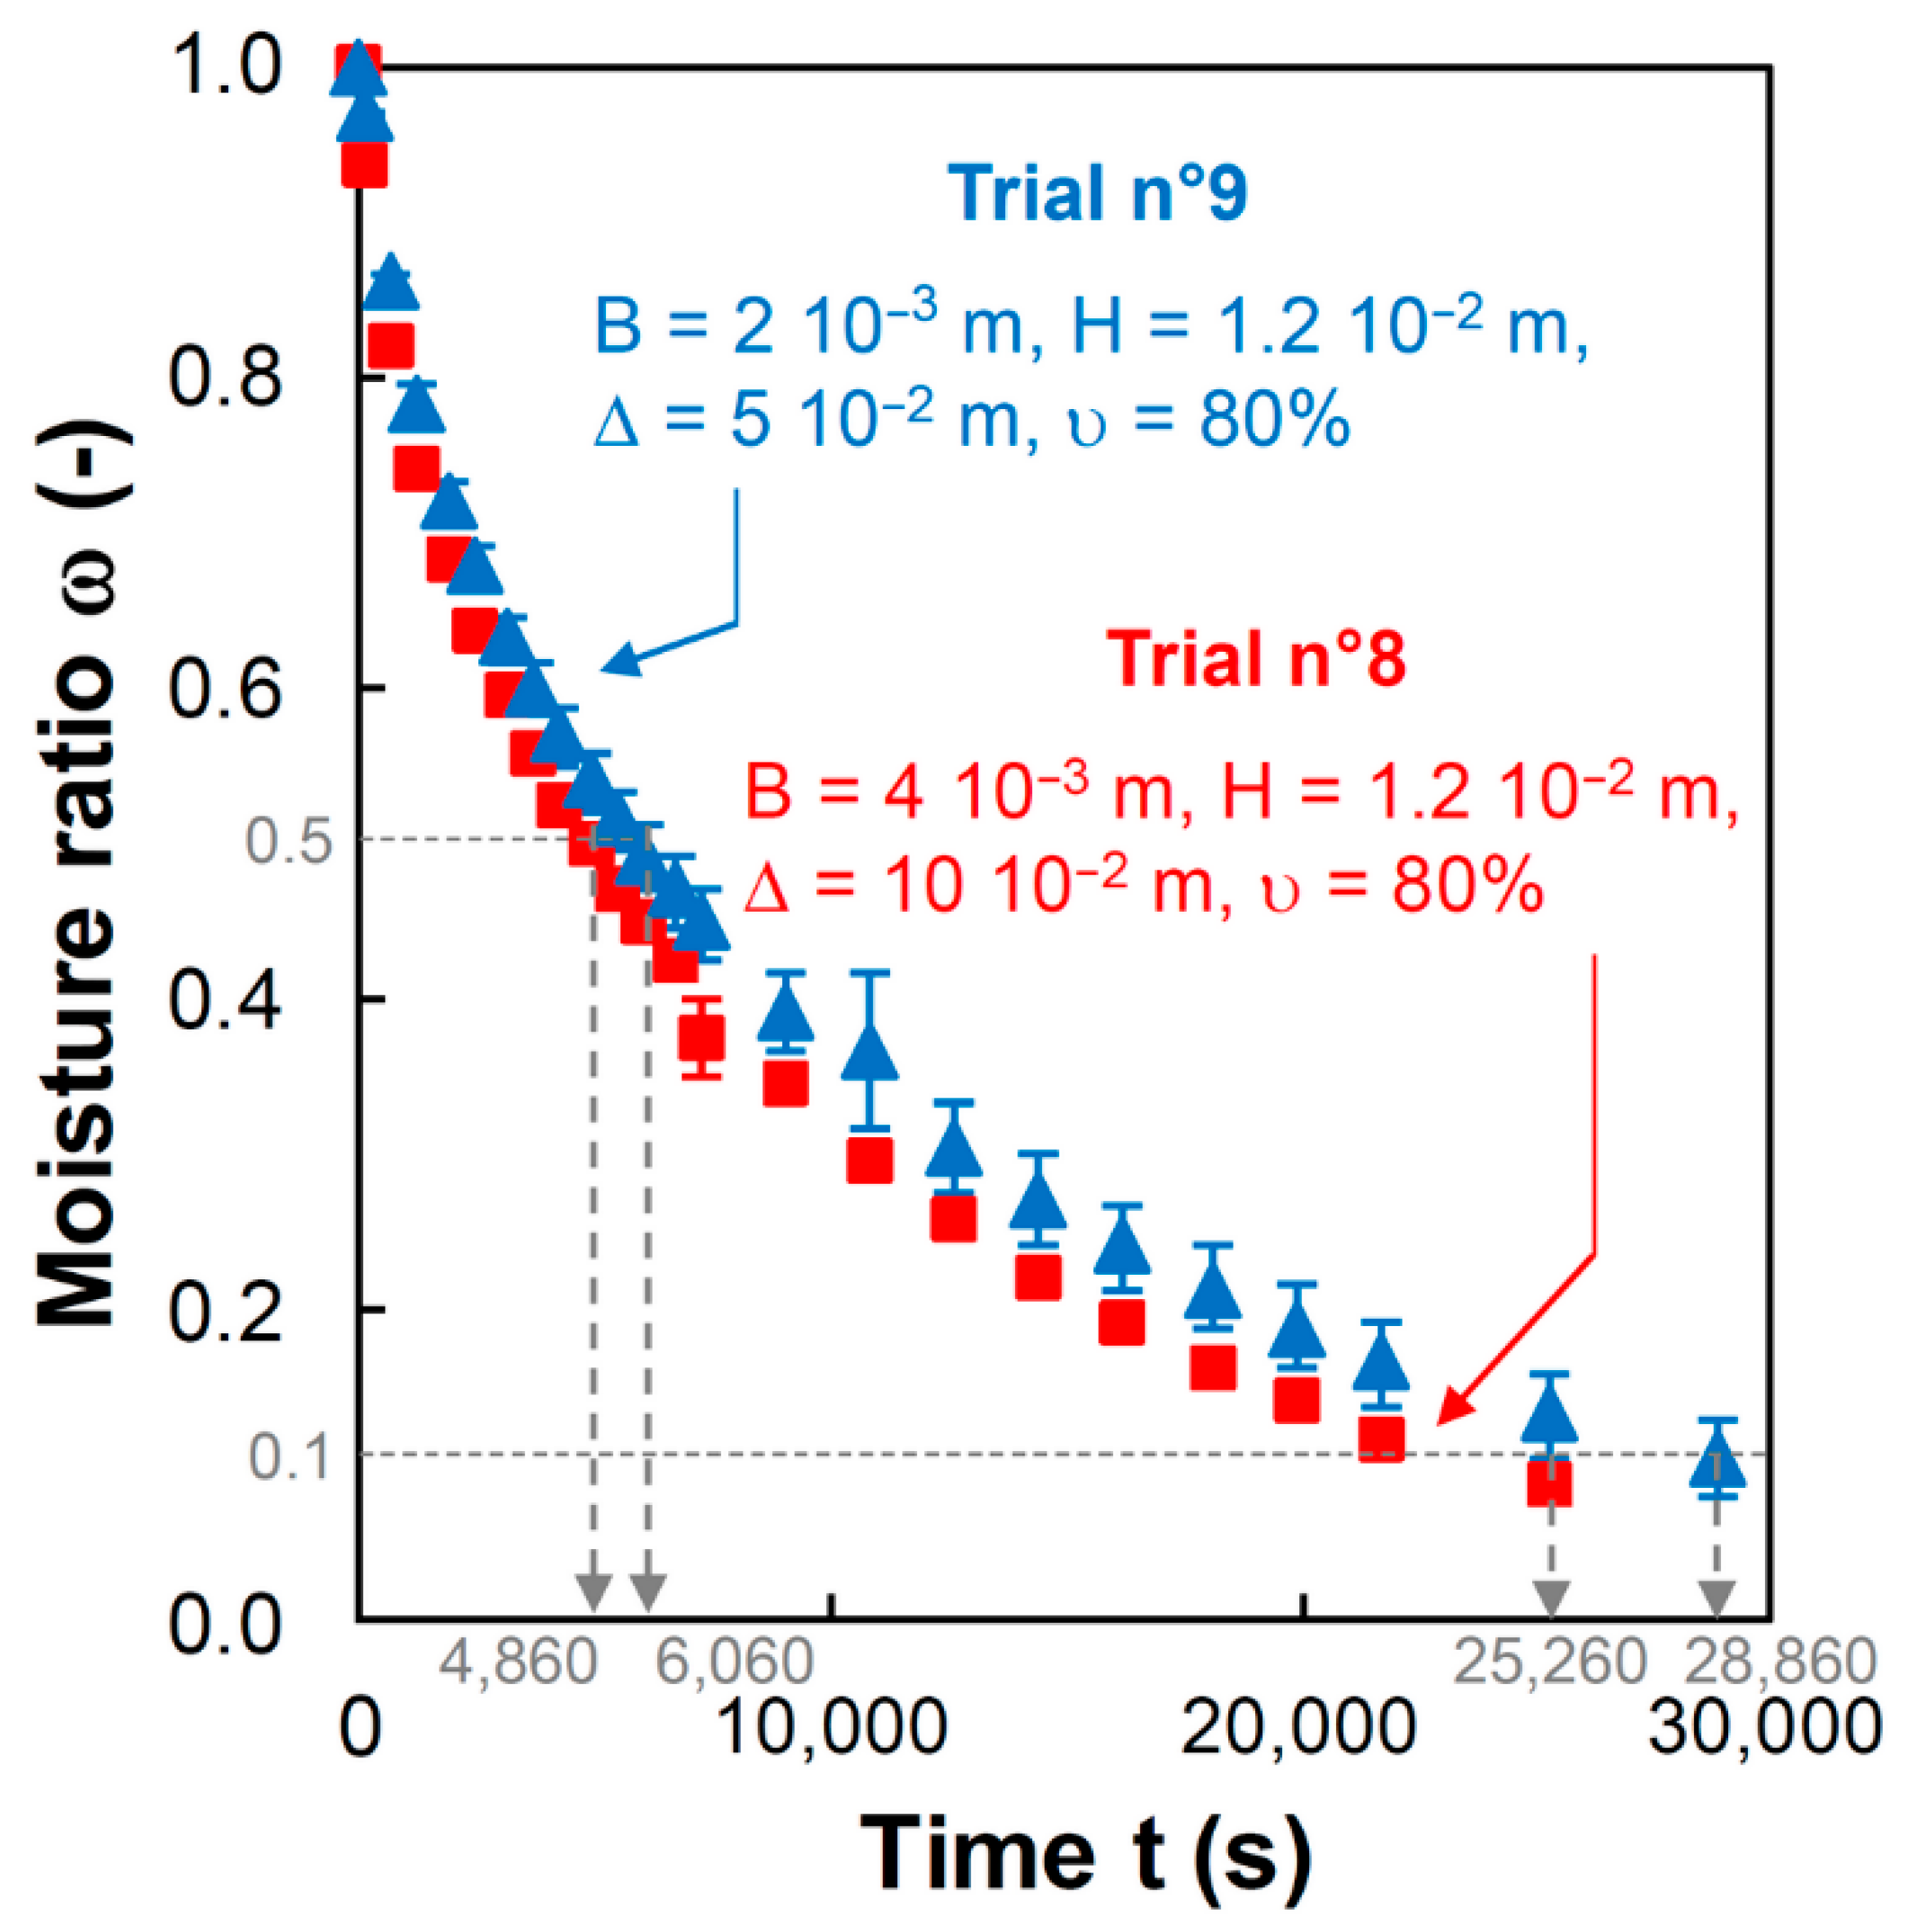
3.1.1. Effect of Design Jet Parameters on Drying Time

The drying time to reach a moisture ratio of 0.5 (corresponding to 78.6 ± 1.2% (w.b.) and 3.7 ± 0.3 kg kg−1 (d.b.)) ranges from 4860 s to 6060 s (1 h and 35 min and 2 h and 10 min, respectively) for all the configurations. From Table 3, both interactions (slot width × nozzle-to-surface height) and (nozzle-to-nozzle spacing × airflow) have a significant positive effect (p-value ≤ 0.1) on the drying time. In contrast, the main factors (the slot width, the nozzle-to-surface height, the nozzle-to-nozzle spacing, and the airflow) have no significant effect (p-value ≥ 0.1) on the drying time.
The RSM study established a statistical model, Equation (15) in Table 4, by adjusting the drying time to the studied jet setup parameters.
The coefficient of determination (R2) and the adjusted R2 calculated by the model are 52.1% and 20.2%, respectively, which indicates a large disparity between experimental and modeled values. Therefore, the drying time cannot be accurately calculated using the parameters examined.
The moisture ratio versus time is plotted on Figure 3 for two extreme drying times (trials n°8 and n°9, Table 2).
The moisture ratio decreases continually over time. Both curves show a rapid moisture elimination from the product at the initial stage of the process (up to 2000 s), to slow down with time. Initially, the surface moisture evaporates very rapidly due to high heat and mass transfer coefficients. The drying rate is exceedingly high during the first moments, and then declines exponentially when all the surface moisture is evaporated and the evaporation front is moved within the product. The curves have the same shape, regardless of the configuration of jets. The time to reach a moisture ratio of 0.1 depends on the configurations studied; it is 25,260 s for trial n°8, and 28,860 s for trial n°9 (Figure 3).
The drying time obtained at 50 °C for two types of drying (air impingement and oven drying) can be compared. The time required to reduce the moisture ratio to 0.5 is 23,460 s (6 h and 52 min, data not presented). This means that the drying time determined using impinging jets is around 75 to 80% lower than the corresponding oven drying time. The drying time can be discussed in relation to other results from the literature for convective drying. Contreras et al. [35] carried out research on apples (Granny Smith variety) in a cylindrical shape (2 × 10⁻² m in diameter and 7 × 10⁻³ m in height) and subjected to air drying (323 K and 2.5 m s−1). Samples were positioned perpendicular to the airflow. The results revealed that 5400 s (1 h and 30 min) is required to reach a moisture ratio of 0.5.

3.1.2. Effect of Design Jet Parameters on Heat and Mass Transfer Coefficients

Heat and mass transfer coefficients under the different conditions were in the range of 157–273 W m−2 K−1 and 1.46 10−4–2.54 10−4 m s−1, respectively (Table 2). The nozzle-to-nozzle spacing and the interaction (nozzle-to-surface height × nozzle-to-nozzle spacing) have a significant effect (p-value ≤ 0.1) on the transfer coefficients (Table 3). In either case, the regression coefficient is negative for the nozzle-to-nozzle spacing, which suggests a facilitated transfer when the nozzle-to-nozzle spacing is low. This may be explained by the fact that the lower the nozzle-to-nozzle, the more often the product is in contact with the air, and the more the heat and mass transfers increase.
Equations (16) and (17) (Table 4) were used to calculate heat and mass transfer coefficients for the levels of parameters studied, respectively. As for the drying time, R2 of 54.1% and 54.4%, and the adjusted R2 of 31.2% and 31.5%, were found. These values are insufficient to properly predict heat and mass transfer coefficients. The statistical analysis shows that all parameters studied do not have a significant impact on both heat and mass transfer coefficients.
Etemoğlu et al. [12] reported that the heat transfer coefficient rises to attain a maximum value for a given free area (ratio of the area covered by slots on the total surface area swept by jets). The coefficient h reaches 315 W m−2 K−1 (maximal value) at a free area of 3%, then decreases to 270 W m−2 K−1 at 6.7% of opening (multiple nozzles, B = 3 × 10⁻³ m and 60 m s−1). The highest coefficient calculated in this investigation was 273 W m−2 K−1 at 4% of the free area (trial n°9: B = 2 × 10⁻³ m and 35 m s−1, Table 2). For information purposes, the free area in this study ranged from 1 and 6% for all configurations. Can et al. [11] revealed the dependence of the free area on the heat transfer coefficient on multiple nozzle systems. For free area values less than 5% and H/B values (ratio between the nozzle-to-surface height and the slot width) below 6, the heat transfer coefficient under each jet is independent, i.e., not influenced by the presence of the surrounding jets, and the coefficient (h) reaches a maximum. In our study, these two conditions are satisfied for eight trials (trials n° 1, 2, 5, 6, 7, 8, 9, and 10; Table 2). In these conditions, the heat transfer coefficient increases linearly with the free area and the H/B ratio. Moreover, Can et al. [11] observed that the heat transfer coefficient goes up when decreasing the slot width; it increases from 241 W m−2 K−1 for B = 2.5 × 10⁻³ m to 254 W m−2 K−1 for B = 2 × 10⁻³ m (an increase of 5%). Only half of our results (trials n°1-8, 3-6, 9-16, and 12-13) are in agreement with this observation. This difference is most likely due to the uncertainty in the determination of the heat transfer coefficient. Zhu et al. [36] studied both effects of nozzle-to-surface height and nozzle-to-nozzle spacing on the heat transfer coefficient. The authors established that, for 5 × 10⁻² m and 10 × 10−2 m of height, the heat transfer coefficient is at its maximum value. When the height is fixed, the coefficient (h) is reduced as the nozzle-to-nozzle spacing increases. For instance, h diminishes from 314 W m−2 K−1 to 243 W m−2 K−1 and then 207 W m−2 K−1 for a nozzle spacing of 3 × 10⁻³ m, 5 × 10⁻³ m, and 7 × 10⁻³ m, respectively. This result confirms the findings of our study since we have noticed that a lower nozzle spacing improves transfer coefficients.
Despite the variability in results due to difficulties in designing and measuring near jets, our results are perfectly in line with previous works.
Finally, the statistical study carried out to optimize the performances of industrial dryers makes it possible to conclude that all tested factors have a minimal impact on the analyzed responses. The reason that may explain these results is that the levels of the selected factors are too close to the optimum operating conditions [11,12]. The levels of each factor have been selected according to previous studies, in particular those carried out by Can et al. [11] and Etemoğlu et al. [12].

3.2. Influence of Operating Parameters on Quality Attributes of Dried Apple

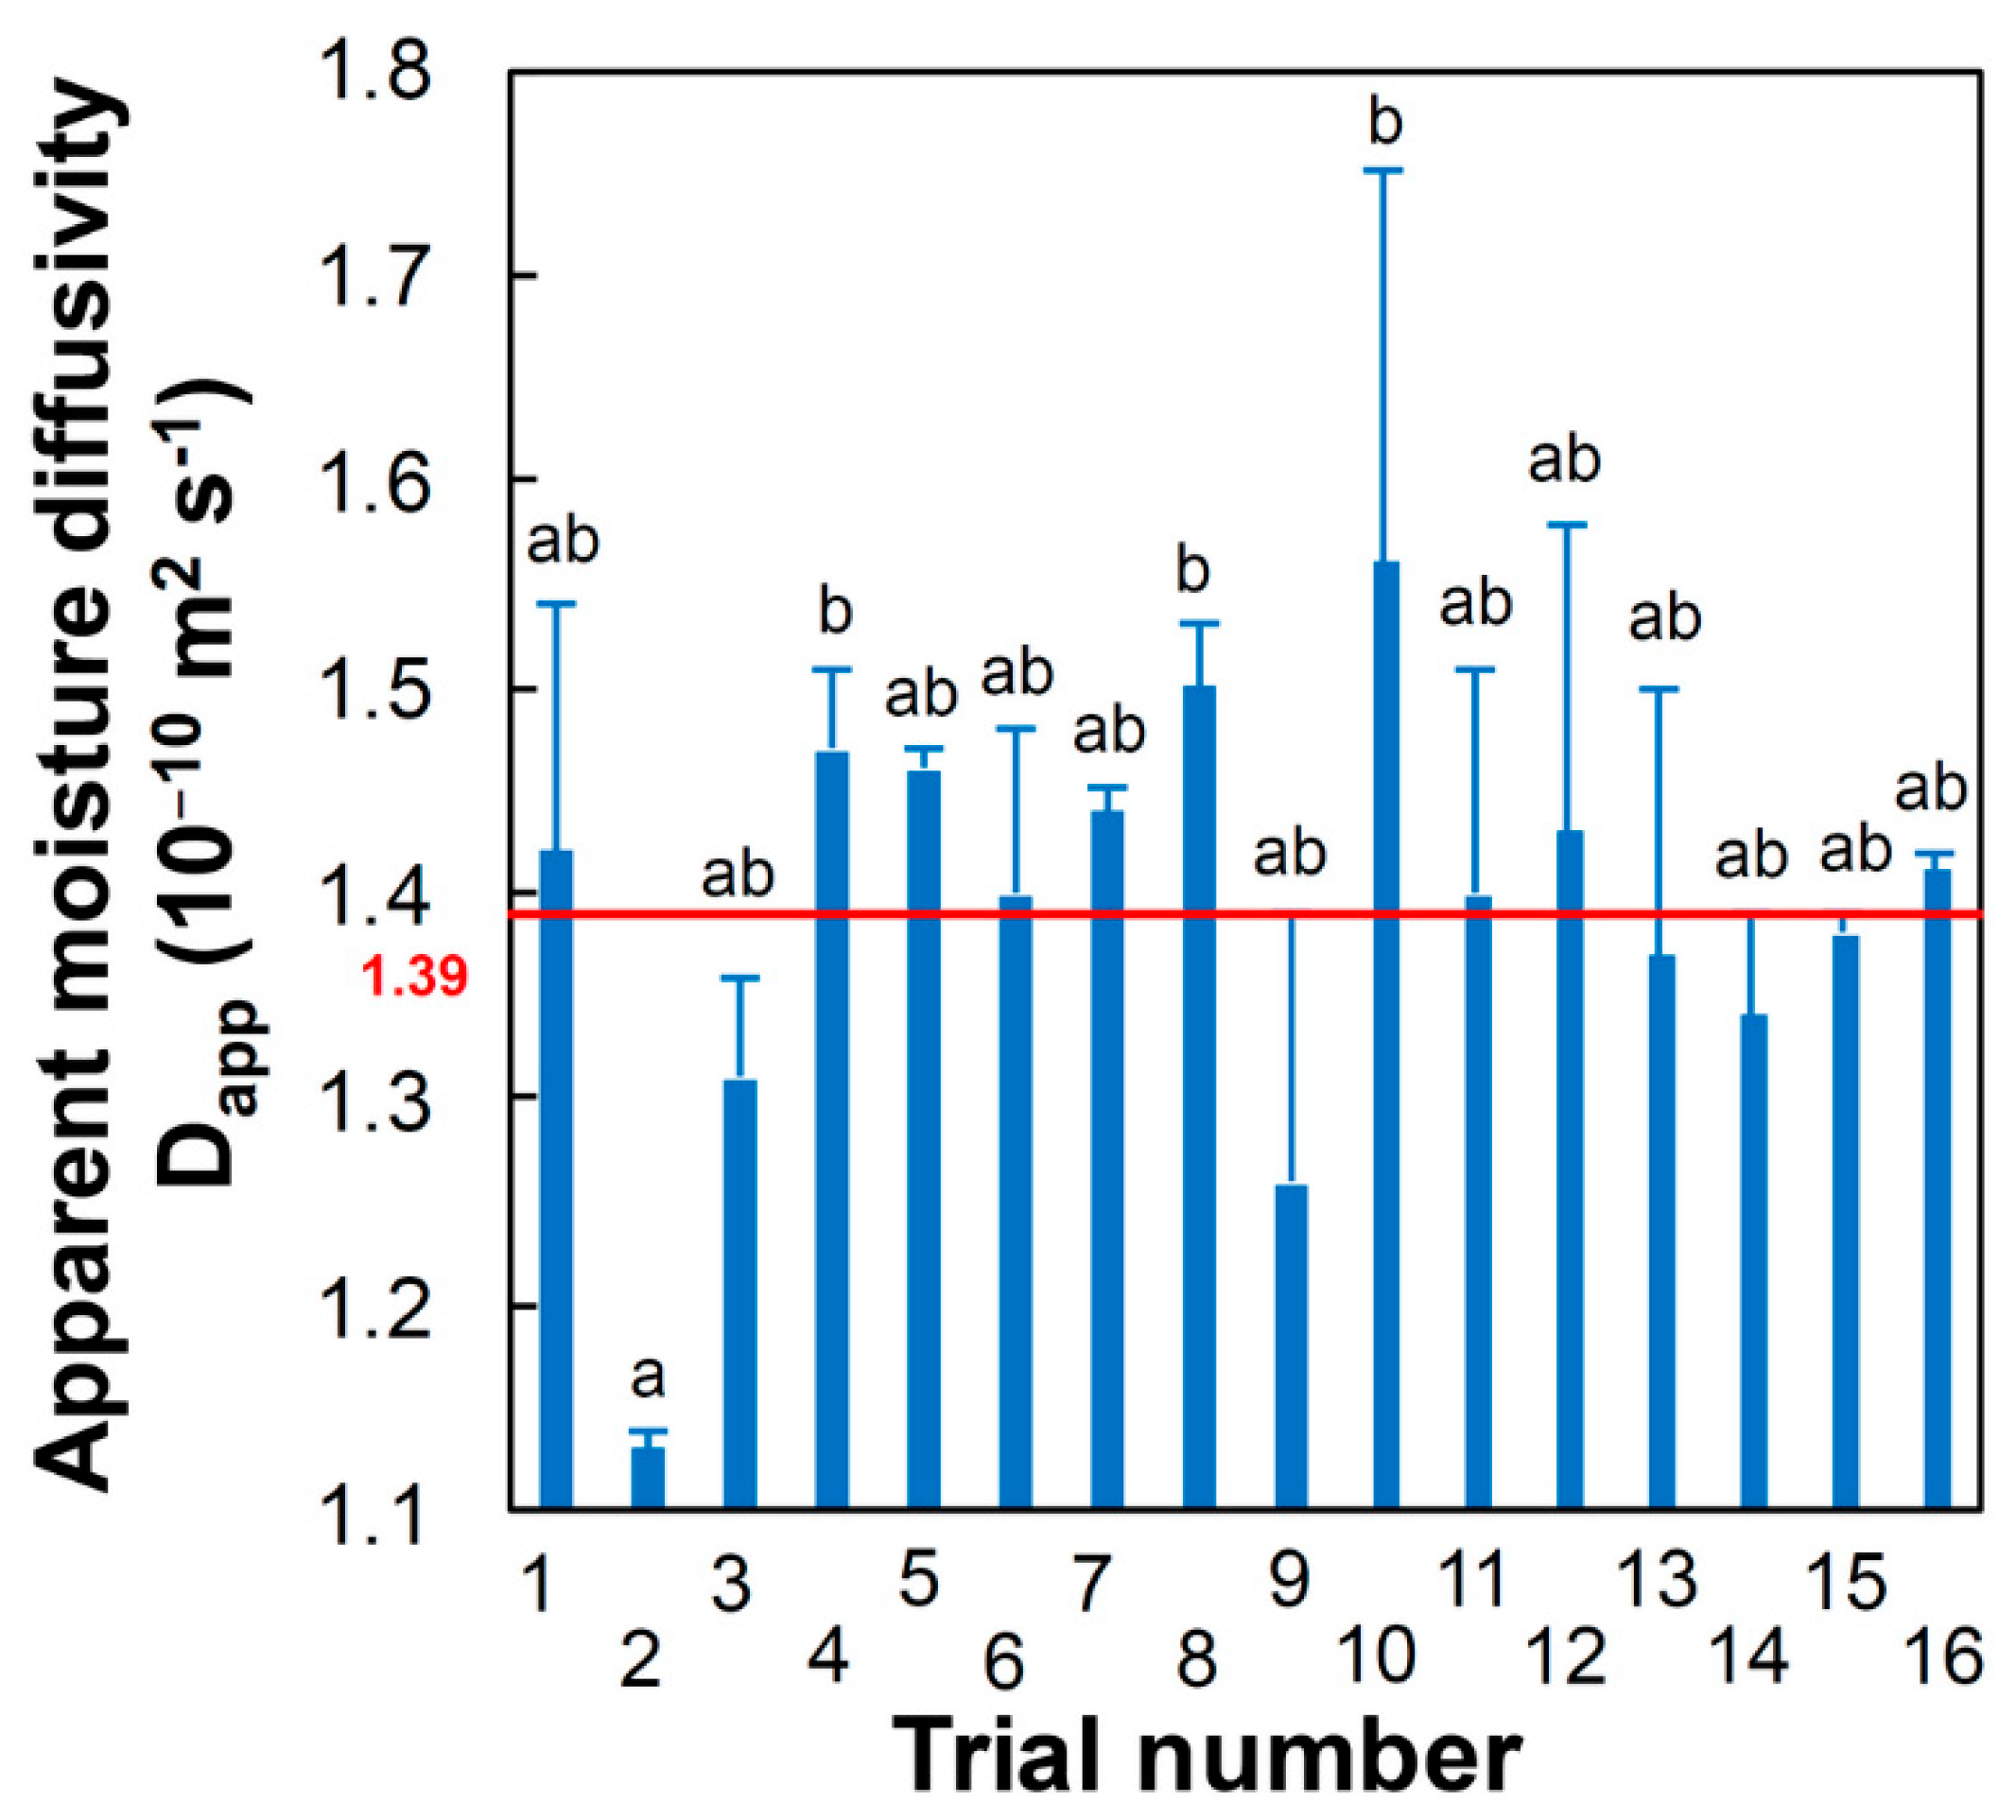
3.2.1. Effect of Design Jet Parameters on the Apparent Moisture Diffusivity

The influence of the design jet parameters on the apparent moisture diffusivity of apple was investigated (Figure 4).
The average value obtained in the 16 trials of the DoE was 1.39 ± 0.06 × 10⁻¹⁰ m2 s−1. A one-way ANOVA on Dapp values shows few significant differences between the tests (p-value ≤ 0.1). From Figure 4, the highest value of Dapp (1.56 ± 0.19 × 10⁻¹⁰ m2 s−1) is obtained in trial n°10 (B = 2 × 10⁻³ m, H = 1.2 × 10⁻² m, Δ = 5 × 10⁻² m, and υ = 99%), while the lowest value (1.13 ± 0.01 × 10⁻¹⁰ m2 s−1) is achieved in trial n°2 (B = 2 × 10⁻³ m, H = 1.2 × 10⁻² m, Δ = 10 × 10−2 m, and υ = 99%). The difference between the two tests comes from the nozzle-to-nozzle spacing value. This is an interesting result because it states that a low nozzle-to-nozzle spacing helps to increase the moisture diffusivity within the product during the drying. Furthermore, this result supports the ANOVA analysis on heat and mass transfer coefficients (previous section) where it has been noticed that a low nozzle-to-nozzle spacing tends to improve the transfer phenomena that occur during the drying process.
The literature presents many values of Deff for different cultivars of apple and numerous scenarios of drying. Kaya et al. [37] reported effective moisture diffusivities within a range from 0.48 × 10⁻¹⁰ m2 s−1 to 2.02 × 10⁻¹⁰ m2 s−1 during the air drying of Red Delicious apples (6 × 10⁻³ m thick) at 308 K, 318 K, and 328 K, velocities at 0.2 m s−1, 0.4 m s−1, and 0.6 m s−1, and humidities of 40%, 55%, and 70%. In the same way, Doymaz [38] obtained diffusivities between 3.00 × 10⁻¹⁰ m2 s−1, and 4.13 × 10⁻¹⁰ m2 s−1 for Amasya red apples (5 × 10⁻³ m thick) dried at 328 K, 338 K, and 348 K at 2 m s−1. More recently, ElGamal et al. [39] calculated effective diffusivities of Red Delicious apples (6 × 10⁻³ m thick) dried in a solar dryer equipped with light sensors to track the position of the sun at a different time of day. These results have been compared with a sample batch dried in a fixed solar dryer and another dried under the temperature and velocity of ambient air. Diffusivities have ranged from 2.42 × 10⁻¹⁰ m2 s−1 and 5.43 × 10⁻¹⁰ m2 s−1. Not surprisingly, the highest value has been obtained in the adjustable solar dryer at the highest airflow rate (44 m3 h−1), while the lowest value has been recorded for apples subjected to ambient drying. Overall, reported values of Deff in our study are consistent with the literature’s data.

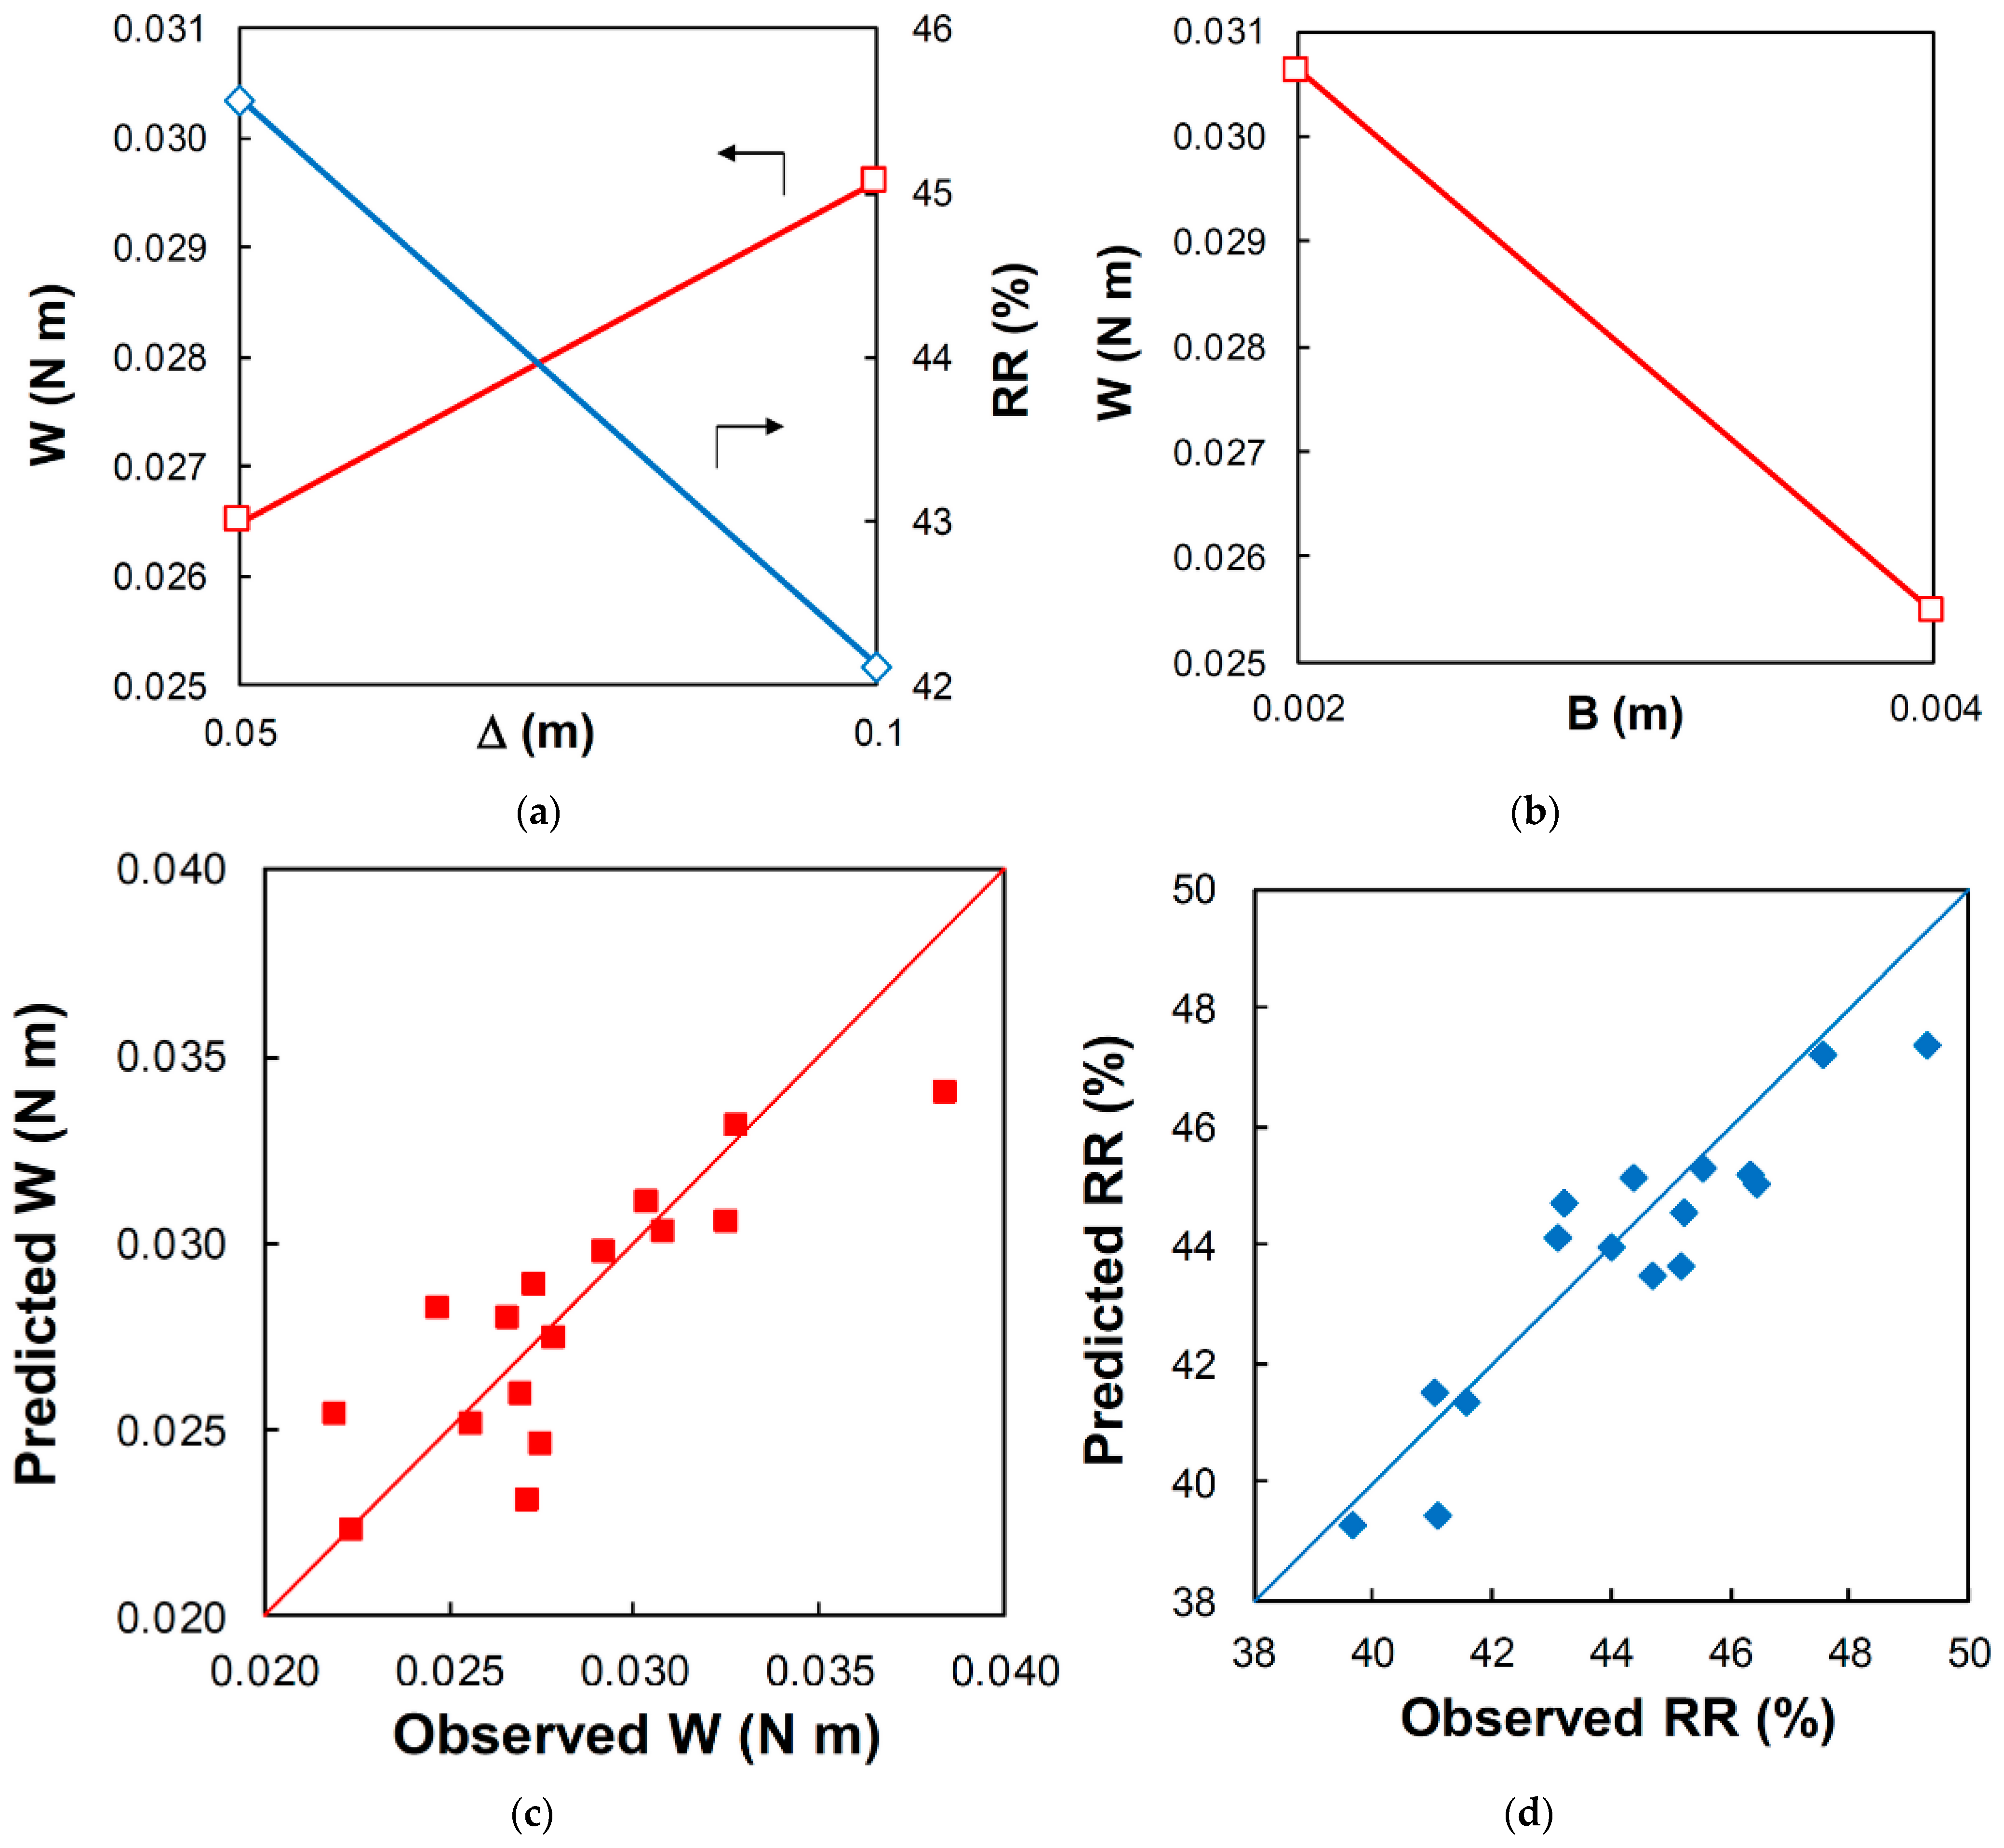
3.2.2. Effect of Design Jet Parameters on Textural Properties

The hardness of dried apple varies from 1.52 ± 0.33 N to 2.67 ± 0.48 N, and the work associated with hardness ranges between 21.88 ± 9.18 10−3 N m and 38.39 ± 7.86 10−3 N m (Table 2). The results of the ANOVA show that the slot width has a very significant effect (p-value ≤ 0.01) on hardness (Table 3). The nozzle-to-nozzle spacing and the interaction (nozzle-to-nozzle spacing × airflow) have a significant effect (p-value ≤ 0.1) on the work associated with hardness. In addition, the slot width has a very significant effect (p-value ≤ 0.01) on the work associated with hardness (Table 3). Moreover, the latter increases with the rise of the nozzle-to-nozzle spacing, while it decreases when the slot width diminishes as illustrated in Figure 5a,b.
The mathematical models that allow adjusting the hardness and the work associated with hardness according to the studied parameters through the RSM study are presented by Equations (18) and (19) (Table 4), respectively. To realize the fitting level of the models, predicted versus observed values are plotted for the work associated with hardness. The adjustment of the model is reviewed by a good distribution of the values around the bisector (Figure 5c). The coefficients of determination (R2) of 60.5% and 69.3% and adjusted R2 of 46.2% and 54.0% indicate the discrepancies between the response values and models for hardness and the work associated with hardness, respectively (Table 3). Consequently, the two models (Equations (18) and (19)) are satisfying to predict, in a relevant manner, hardness and the work associated with hardness of the dried apple in the considered conditions. The optimal conditions, identical for the two responses, are cited in Table 3 (B = 4 × 10⁻³ m, H = 2.4 × 10⁻² m, Δ = 5 × 10⁻² m, and υ = 80%).
The hardness of fresh apple is 5.74 ± 1.17 N, which is 2 to 4 times higher than the hardness measured during the tests (Figure 1 and Table 2). A similar value has been found in the case of Granny Smith apples [18]. A significant reduction in hardness is observed in the course of the drying process; this result is supported by earlier studies [40]. Textural properties of dried products rely on the behavior of the cellular matrix, the soluble solid phase within the tissues, all combined with their interaction with water. A decline in the moisture content of the product caused by the drying process affects the structure and the textural properties. Changes in structure and textural properties of dried apple may be from the amount and composition of pectin in apple tissues [41].

3.2.3. Effect of Design Jet Parameters on Functional Properties

Rehydration consists of restoring the properties of the raw material to a dry product by bringing it into contact with water. However, drying and rehydration processes induce changes in the structure and composition of the product, leading to damaged reconstitution properties [42]. Therefore, rehydration is a quality criterion that informs on chemical and structural injuries that occur during the drying process.
Values of the rehydration ratio of apple samples dried in different operating conditions are between 39.68 ± 5.07% and 49.32 ± 1.95% (trials n°5 and 15, Table 2). The interaction (slot width × airflow) has a significant effect (p-value ≤ 0.1), whereas the interaction (slot width × nozzle-to-nozzle spacing) and the nozzle-to-nozzle spacing have a very significant effect (p-value ≤ 0.01) on the rehydration ratio (Table 3). Besides, the regression coefficient is negative for the nozzle-to-nozzle spacing, which means that improved rehydration is obtained when the nozzle spacing is low. On another note, the effect of nozzle-to-nozzle spacing on the rehydration ratio is shown in Figure 5a. The ratio declines when nozzle-to-nozzle spacing increases.
The statistical model established by Equation (20) (Table 4) can be used to predict the rehydration ratio, even if all the parameters are not significant. The coefficients of determination R2 of 84.5% and the adjusted R2 of 74.2% reveal the quite acceptable quality of the model to predict the rehydration ratio of dried apple. Figure 5d depicts the distribution of predicted versus observed values around the bisector. The developed model may be used to properly predict the rehydration ratio of dried apples. As indicated earlier, the optimal conditions to get the best rehydration are reported in Table 3 (B = 4 × 10⁻³ m, H = 1.2 × 10⁻² m, Δ = 5 × 10⁻² m, and υ = 99%).
Given that most of the dried products need to be rebuilt before use, it is fundamental to know their rehydration behavior. The highest values of rehydration ratio reveal stiffer and more open structures [34]. Following Vadivambal and Jayas [43], the highest values are characteristic of high quality dried products. It is widely accepted that tissue rehydration consists of three simultaneous processes: the imbibition of water within the dried product, the swelling of the product, and the leaching of soluble solids derived from the dried product [44]. Lewicki and Wiczkowska [45] compared the features of the rehydration of apple (Idared variety) dried by convection (343 K and 1.5 m s−1) and freeze-dried (frozen at 252 K for 20 h and then freeze-dried at 37 Pa and 293 K for 24 h). They showed that the collapsed structure of dried apple by convection rebuilds during rehydration, unlike those freeze-dried. Based on these results, the authors established a potential mechanism during the rehydration process. The shrunken and compact structure of the product absorbs the water by capillary suction and the wetted dry matrix starts to swell. Then, the swelling causes an increase in volume and the matrix continuity is the source of the mechanical strength of the product. These results suggest that the cell wall network is, at least, partly continuous after convective drying. The lowest values of rehydration ratio indicate extensive cellular and structural tissue damage occurring during the drying process [46]. This leads to denser structures with collapsed capillaries and shrunken pores that lock the water reabsorption of the product [34].
From the sorption curves (Figure 6), apple dried by air impingement and oven drying adsorbs the same quantity of water vapor over the water activity range investigated (0.8 to 0.96).
This result suggests that the porous structure between apples dried by impinging jets (fast drying) and by oven drying (slow drying) is the same. This is in accordance with Prawiranto et al. [47] who established, by simulation, that the apple tissue sorption isotherm and its water permeability have a high dependency on the way in which the cellular structure changes during drying. In an earlier review, Lewicki [48] underlined that changes in sorption processes are in relationship with the effective diffusion coefficient. He also clarified that the diffusion coefficients account for the way the molecules are transported within the solid and includes porosity and tortuosity.
It should be specified that the sorption curve for the air impingement drying was determined in optimal conditions to attain the best rehydration (B = 4 × 10⁻³ m, H = 1.2 × 10⁻² m, Δ = 5 × 10⁻² m and υ = 99%, trial n°15, Table 2). Nonetheless, this result can be confounded by the fact that the adsorptive capacity appears to be impacted by the porous structure only in low water activity areas (<0.6), as indicated by Saravacos [49].
The water sorption isotherms were modelled using the GAB (Guggenheim–Anderson–de Boer) model according to Equation (2). Values of the corresponding parameters for the two drying processes and the statistical parameters that allow for evaluating the quality of the fit are presented in Table 5.
Statistical parameters reveal a satisfactory modeling of the experimental points (R2 > 99.9%, RMSE < 7.7 × 10⁻³, χ2 < 9.2 × 10⁻⁵ and RSS < 5.5 × 10⁻⁴, Table 5).

4. Conclusions

This research has focused on studying the impact of design jet parameters (slot width, nozzle-to-surface height, nozzle-to-nozzle spacing, and airflow) on the drying process performances (drying time, and heat and mass transfer coefficients) and the quality attributes of apples (apparent diffusivity, textural properties, and rehydration) using RSM.
A greater significant influence of the examined parameters was shown through the quality of the product compared with the drying process performances. The slot width had a very significant effect on textural properties (hardness and work associated with hardness). The nozzle-to-nozzle spacing and the interaction (slot width × nozzle-to-nozzle spacing) had a very significant effect on the rehydration ratio. The nozzle-to-nozzle spacing and the interaction (nozzle-to-nozzle spacing × airflow) had a significant effect on the work associated with hardness. The interaction (slot width × airflow) had a significant effect on the rehydration ratio. From the ANOVA, the conditions for which the best quality of products, commonly known as ‘optimal conditions’, were obtained. In this study, optimal conditions were estimated for low textural properties and high rehydration ratios. Low textural properties were preferred to avoid the case hardening phenomenon which occurs during the drying process. The optimal predicted conditions were B = 4 × 10⁻³ m, H = 2.4 × 10⁻² m, Δ = 5 × 10⁻² m, and υ = 80% to obtain the lowest textural properties, and B = 4 × 10⁻³ m, H = 1.2 × 10⁻² m, Δ = 5 × 10⁻² m, and υ = 99% to obtain the highest rehydration ratio. Empirical models between design jet variables and parameters characterizing the quality of the product presented adequate levels of R2 and adjusted R2.
The sorption curve at 323 K of apple dried by air impingement drying in optimal conditions to get the highest rehydration was overlapped by that obtained after oven drying. This result indicates that, after a fast drying (impinging jets), the structure of apple was no further deteriorated than after a slow drying (oven). The GAB model provided a good fit to the experimental data.

Author Contributions

V.B. supervised the experimental research work, performed the literature, treated data collection, wrote original draft preparation, and reviewed. S.M. performed the main part of the experimental work. M.G. completed the experiments. Y.L. designed and produced the holders for the samples and slot configurations. J.-L.L. established the study, experimental design, supervised both the experimental work and the data treatment, and evaluated the whole scientific study. All authors have read and agreed to the published version of the manuscript.

Funding

This research was funded by CIMS Company (Sablé-sur-Sarthe, France) during the end-of-studies internship of S. Mlayah (no funding number was assigned to this work).

Institutional Review Board Statement

Not applicable.

Informed Consent Statement

Not applicable.

Data Availability Statement

The datasets generated during and/or analyzed during this investigation are available from the corresponding author on reasonable request.

Acknowledgments

The authors wish to express their gratitude to CIMS Company for their technical assistance.

Conflicts of Interest

The authors declare no conflict of interest. The funders had no role in the design of the study, in the collection, analyses, or interpretation of data, in the writing of the manuscript, or in the decision to publish the results.

References

  1. Schadle, E.R.; Burns, E.E.; Talley, L.J. Forced air drying of partially freeze-dried compressed carrot bars. J. Food Sci. 1983, 48, 193–196. [Google Scholar] [CrossRef]
  2. Yang, C.S.T.; Atallah, W.A. Effect of four drying methods on the quality of intermediate moisture lowbush blueberries. J. Food Sci. 1985, 50, 1233–1237. [Google Scholar] [CrossRef]
  3. Yongsawatdigul, J.; Gunasekaran, S. Microwave-vacuum drying of cranberries: Part II. Quality evaluation. J. Food Process Pres. 1996, 20, 145–156. [Google Scholar] [CrossRef]
  4. Lin, T.M.; Durance, T.D.; Scaman, C.H. Characterization of vaccum microwave, air and freeze dried carrot slices. Food Res. Int. 1998, 31, 111–117. [Google Scholar] [CrossRef]
  5. Xiao, H.W.; Bai, J.W.; Xie, L.; Sun, D.W.; Gao, Z.J. Thin-layer air impingement drying enhances drying rate of American ginseng (Panax quinquefolium L.) slices with quality attributes considered. Food Bioprod. Process. 2015, 94, 581–591. [Google Scholar] [CrossRef]
  6. Anderson, B.A.; Singh, R.P. Modeling the thawing of frozen foods using air impingement technology. Int. J. Refrig. 2006, 29, 233–240. [Google Scholar] [CrossRef]
  7. Mujumdar, A.S. Handbook of Industrial Drying, 4th ed.; CRC Press: Boca Raton, FL, USA, 2014; p. 1282. [Google Scholar]
  8. Xiao, H.W.; Mujumdar, A.S. Impingement drying: Application and future trends. In Drying Technologies for Foods, 1st ed.; Nema, P.K., Kaur, B.P., Mujumdar, A.S., Eds.; CRC Press: Boca Raton, FL, USA, 2018; pp. 279–299. [Google Scholar]
  9. Dewan, A.; Dutta, R.; Srinivasan, B. Recent trends in computational of turbulent jet impingement heat transfer. Heat. Transfer. Eng. 2012, 33, 447–460. [Google Scholar] [CrossRef]
  10. Hardisty, H.; Can, M. An experimental investigation into the effects of changes in the geometry of a slot nozzle on the heat transfer characteristics of an impinging air jet. Proc. Inst. Mech. Eng. Part C J. Mech. Eng. Sci. 1983, 197, 7–15. [Google Scholar] [CrossRef]
  11. Can, M.; Etemoğlu, A.B.; Avci, A. Experimental study of convective heat transfer under arrays of impinging air jets from slots and circular holes. Heat. Mass. Transfer. 2002, 38, 251–259. [Google Scholar] [CrossRef]
  12. Etemoğlu, A.B.; Can, M. Performance studies of energy consumption for single and multiple nozzle systems under impinging air jets. Heat. Mass. Transfer. 2013, 49, 1057–1070. [Google Scholar] [CrossRef]
  13. Koç, B.; Kaymak-Ertekin, F. Response surface methodology and food processing applications. Gida 2010, 35, 63–70. [Google Scholar]
  14. Majdi, H.; Esfahani, J.A.; Mohebbi, M. Optimization of convective drying by response surface methodology. Comput. Electron. Agric. 2019, 156, 574–584. [Google Scholar] [CrossRef]
  15. Parthasarathi, S.; Anandharamakrishnan, C. Modeling of shrinkage, rehydration and textural changes for food structural analysis: A review. J. Food Process. Eng. 2014, 37, 199–210. [Google Scholar] [CrossRef]
  16. Hammami, C.; René, F.; Marin, M. Process-quality optimization of the vacuum freeze-drying of apple slices by the response surface method. Int. J. Food Sci. Technol. 1999, 34, 145–160. [Google Scholar] [CrossRef]
  17. Ben Haj Said, L.; Bellaghou, S.; Allaf, K. Optimization of instant pressure drop (DIC)—Assisted dehydrofreezing using mechanical texture measurement versus initial water content of apple. Food Bioprocess Technol. 2015, 8, 1102–1112. [Google Scholar] [CrossRef]
  18. Vega-Gálvez, A.; Ah-Hen, K.; Chacana, M.; Vergara, J.; Martínez-Monzó, J.; García-Segovia, P.; Lemus-Mondaca, R.; Di Scala, K. Effect of temperature and air velocity on drying kinetics, antioxidant capacity, total phenolic content, colour, texture and microstructure of apple (var. Granny Smith) slices. Food Chem. 2012, 132, 51–59. [Google Scholar] [CrossRef] [Green Version]
  19. Sá, M.M.; Figueiredo, A.M.; Sereno, A.M. Glass transitions and state diagrams for fresh and processed apple. Thermochim. Acta 1999, 329, 31–38. [Google Scholar] [CrossRef]
  20. Moraes, M.A.; Rosa, G.S.; Pinto, L.A.A. Moisture sorption isotherms and thermodynamic properties of apple Fuji and garlic. Int. J. Food Sci. Technol. 2008, 43, 1824–1831. [Google Scholar] [CrossRef]
  21. Lomauro, C.J.; Bakshi, A.S.; Labuza, T.P. Evaluation of food moisture sorption isotherm equations. Part I: Fruit, vegetable and meat products. Lebensm. Wiss. Technol. 1985, 18, 111–117. [Google Scholar]
  22. Atlasbig.com. Available online: https://www.atlasbig.com/en-cn/countries-by-apple-production (accessed on 28 September 2021).
  23. Boy, V.; Liu, X.; Chamaa, M.A.; Lemée, Y.; Sabourin, C.; Lendormi, T.; Lanoisellé, J.L. Air impingement drying of digestate. Experimental and modelling study. Chem. Eng. Res. Des. 2019, 146, 436–448. [Google Scholar] [CrossRef]
  24. Boy, V.; Ben Khalifa, W.; Drévillon, L.; Lemée, Y.; Lendormi, T.; Lanoisellé, J.L. Air impingement and intermittent drying: Application to apple and to mango. Can. J. Chem. Eng. 2021, 99, 120–134. [Google Scholar] [CrossRef]
  25. De Boer, J.H. The Dynamical Character of Adsorption, 1st ed.; Oxford University Press: Oxford, UK, 1953; p. 239. [Google Scholar]
  26. Lide, D.R. Handbook of Chemistry and Physics, 82th ed.; CRC Press: Boca Raton, FL, USA, 2001–2002; p. 2661. [Google Scholar]
  27. Green, D.W.; Perry, R.H. Perry’s Chemical Engineers’ Handbook, 8th ed.; The Mc Graw-Hill Companies Inc.: New York, NY, USA, 2008; p. 2737. [Google Scholar]
  28. Agnelli, M.E.; Mascheroni, R.H. Cryomechanical freezing. A model for the heat transfer process. J. Food Eng. 2001, 47, 263–270. [Google Scholar] [CrossRef]
  29. Mohamed, I.O. An inverse lumped capacitance method for determination of heat transfer coefficients for industrial air blast chillers. Food Res. Int. 2008, 41, 404–410. [Google Scholar] [CrossRef]
  30. Geankoplis, C.J. Transport Processes and Unit Operations, 3rd ed.; Prentice Hall: Upper Saddle River, NJ, USA, 1993; p. 935. [Google Scholar]
  31. Crank, J. The Mathematics of Diffusion, 2nd ed.; Oxford University Press: New York, NY, USA, 1975; p. 414. [Google Scholar]
  32. Bejaei, M.; Stanich, K.; Cliff, M.A. Modelling and classification of apple textural attributes using sensory, instrumental and compositional analyses. Foods 2021, 10, 384. [Google Scholar] [CrossRef]
  33. Fabani, M.P.; Román, M.C.; Rodriguez, R.; Mazza, G. Minimization of the adverse environmental effects of discarded onions by avoiding disposal through dehydration and food-use. J. Environ. Manag. 2020, 271, 110947. [Google Scholar] [CrossRef]
  34. Ndisya, J.; Mbuge, D.; Kulig, B.; Gitau, A.; Hensel, O.; Sturm, B. Hot air drying of purple-specled Cocoyam (Colocasia esculenta (L.) Schott) slices: Optimisation of drying conditions for improved product quality and energy savings. Therm. Sci. Eng. Progress. 2020, 18, 100557. [Google Scholar] [CrossRef]
  35. Contreras, C.; Martín-Esparza, M.E.; Chiralt, A.; Martínez-Navarrete, N. Influence of microwave application on convective drying: Effects on drying kinetics, and optical and mechanical properties of apple and strawberry. J. Food Eng. 2008, 88, 55–64. [Google Scholar] [CrossRef]
  36. Zhu, D.M.; Wang, Y.T.; Zhu, J.H. Heat transfer characteristics of multinozzle air impingement jet during die steel plate cooling progress. Adv. Mech. Eng. 2014, 7, 1–7. [Google Scholar] [CrossRef]
  37. Kaya, A.; Aydin, O.; Demirtaş, C. Drying kinetics of red delicious apple. Biosyst. Eng. 2007, 96, 517–524. [Google Scholar] [CrossRef]
  38. Doymaz, I. Effect of citric acid and blanching pre-treatments on drying and rehydration of Amasya red apples. Food Bioprod. Process. 2010, 88, 124–132. [Google Scholar] [CrossRef]
  39. ElGamal, R.; Kishk, S.; Al-Rejaie, S.; ElMasry, G. Incorporation of a solar tracking system for enhancing the performance of solar air heaters in drying apple slices. Renew Energ. 2021, 167, 676–684. [Google Scholar] [CrossRef]
  40. Cruz, A.C.; Guiné, R.P.F.; Gonçalves, J.C. Drying kinetics and product quality for convective drying of apples (cvs. Golden Delicious and Granny Smith). Int. J. Fruit Sci. 2015, 15, 54–78. [Google Scholar] [CrossRef]
  41. Deng, Y.; Zhao, Y. Effect of pulsed vacuum and ultrasound osmopretreatments on glass transition temperature, texture, microstructure and calcium penetration of dried apples (Fuji). LWT-Food Sci. Technol. 2008, 41, 1575–1585. [Google Scholar] [CrossRef]
  42. Boateng, I.D.; Yang, X.M.; Aly Tahany, A.A.; Li, Y.Y. Yolandani Drying methods affect organoleptic and physicochemical properties of rehydrated ginkgo seed slices. Ind. Crop. Prod. 2021, 160, 113166. [Google Scholar] [CrossRef]
  43. Vadivambal, R.; Jayas, D.S. Changes in quality of microwave-treated agricultural products—A review. Biosyst. Eng. 2007, 98, 1–16. [Google Scholar] [CrossRef]
  44. Vega-Gálvez, A.; Zura-Bravo, L.; Lemus-Mondaca, R.; Martinez-Monzó, J.; Quispe-Fuentes, I.; Puente, L.; Di Scala, K. Influence of drying temperature on dietary fibre, rehydration properties, texture and microstructure of Cape gooseberry (Physalis peruviana L.). J. Food Sci. Technol. 2015, 52, 2304–2311. [Google Scholar] [CrossRef] [PubMed] [Green Version]
  45. Lewicki, P.P.; Wiczkowska, J. Rehydration of apple dried by different methods. Int. J. Food Prop. 2006, 9, 217–226. [Google Scholar] [CrossRef]
  46. Krokida, M.; Marinos-Kouris, D. Rehydration kinetics of dehydrated products. J. Food Eng. 2003, 57, 1–7. [Google Scholar] [CrossRef]
  47. Prawiranto, K.; Defraeye, T.; Derome, D.; Verboven, P.; Nicolai, B.; Carmeliet, J. New insights into the apple fruit dehydration process at the cellular scale by 3D continuum modeling. J. Food Eng. 2018, 239, 52–63. [Google Scholar] [CrossRef] [Green Version]
  48. Lewicki, P.P. Water as the determinant of food engineering properties. A review. J. Food Eng. 2004, 61, 483–495. [Google Scholar] [CrossRef]
  49. Saravacos, G.D. Effect of the drying method on the water sorption of dehydrated apple and potato. J. Food Sci. 1967, 32, 81–84. [Google Scholar] [CrossRef]
Figure 1. Experimental drying system: (a) drawing of sample holders; (b) air impingement dryer equipment; (c) setups of air jets and positioning of samples; (d) slot width and air jet outflow direction.
Processes 09 01900 g001aProcesses 09 01900 g001b
Figure 2. Force versus distance curve obtained during a penetration test on: (a) fresh apple; (b) dried apple by air impinging jets (trial n°13, Table 2).
Processes 09 01900 g002
Figure 3. Moisture ratio versus time of apple dried for different configurations of air jets.
Processes 09 01900 g003
Figure 4. Apparent moisture diffusivities of apple dried by different design jet parameters.
Processes 09 01900 g004
Figure 5. ANOVA results for the quality attributes (work associated with hardness and rehydration ratio) of the dried apple: (a) interaction plot with the nozzle-to-nozzle spacing; (b) interaction plot with the width slot; (c) predicted versus observed work associated with hardness; (d) predicted versus observed rehydration ratio.
Processes 09 01900 g005
Figure 6. Sorption isotherms of apple at 323 K after air impingement and oven drying. Comparison of two drying methods on the adsorptive capacity of the product. Symbols: experimental data; lines: GAB model (full line: air impingement; dotted line: oven).
Processes 09 01900 g006
Table 1. Design of experiment parameters and associated variation ranges.
ParameterLevel
−1+1
Slot width B × 103 (m)24
Nozzle-to-surface height H × 102 (m)1.22.4
Nozzle-to-nozzle spacing Δ × 102 (m)510
Airflow υ (%)8099
Table 2. Process performances and quality attributes obtained during the air impingement drying of apple for different design jet parameters.
Trial NumberFactorsResponses
Design Jet ParametersProcess PerformancesQuality Attributes
B × 103
(m)
H × 102
(m)
Δ × 102
(m)
υ
(%)
t
(s)
h
(W m−2 K−1)
km × 104
(m s−1)
F
(N)
W × 103
(N m)
RR
(%)
121.2108048601801.682.67 ± 0.4838.39 ± 7.8643.08 ± 1.22
221.2109960601591.482.06 ± 0.5030.34 ± 7.8645.20 ± 2.46
322.4109954602422.252.34 ± 1.0130.81 ± 15.4744.70 ± 0.15
422.4108048601651.542.15 ± 0.3132.75 ± 6.9144.03 ± 1.59
542.4108054602011.871.74 ± 0.4826.62 ± 7.5639.68 ± 5.07
642.4109954601621.511.69 ± 0.5025.55 ± 9.3641.55 ± 0.30
741.2109954601781.662.11 ± 0.9626.93 ± 7.1841.02 ± 4.33
841.2108048601571.461.88 ± 0.3227.31 ± 2.9741.08 ± 4.24
921.258060602732.541.84 ± 0.9124.70 ± 13.1946.33 ± 0.89
1021.259948602061.922.62 ± 0.5432.49 ± 9.9943.20 ± 2.86
1122.459948601981.851.99 ± 0.3229.21 ± 2.5845.25 ± 5.03
1222.458048602332.171.93 ± 0.4827.81 ± 6.2046.43 ± 4.34
1342.458054601671.561.52 ± 0.3322.27 ± 7.5444.38 ± 2.50
1442.459954602041.911.91 ± 0.3227.50 ± 6.1047.54 ± 2.22
1541.259954602302.141.53 ± 0.4921.88 ± 9.1849.32 ± 1.95
1641.258048602222.071.72 ± 0.1827.08 ± 4.6145.53 ± 2.76
Table 3. Analysis of variance of the effect of design jet parameters on the process performances and the quality attributes of dried apple.
ParameterSum of SquareDf 1Mean SquareF-Ratiop-ValueEstimated EffectOptimum
t
B22,500122,5000.160.7004+75n.a 3
H22,500122,5000.160.7004−75n.a
Δ22,500122,5000.160.7004+75n.a
υ202,5001202,5001.420.2637+225n.a
B · H562,5001562,5003.950.07822+375
Δ · υ562,5001562,5003.950.0782+375
Total error1.28 × 1069142,500
Corrected total error2.68 × 10615
R2 (%)52.11 Standard error377
R2 adjusted for df (%)20.17 Mean absolute error230
h
B1139111391.400.2644−16.875n.a
H68.06168.060.080.7785−4.125n.a
Δ5220152206.410.0298−36.125n.a
υ22.56122.560.030.8712−2.375n.a
H · Δ3164131643.880.0771+28.125
Total error8148108148
Corrected total error17,76215
R2 (%)54.13 Standard error28.55
R2 adjusted for df (%)31.19 Mean absolute error19.06
km
B9.77 × 10−1019.77 × 10−101.400.2643−1.56 × 10⁻⁵n.a
H5.26 × 10−1115.26 × 10−110.080.7894−3.63 × 10⁻⁶n.a
Δ4.59 × 10−914.59 × 10−96.570.0282−3.39 × 10⁻⁵n.a
υ1.81 × 10−1111.81 × 10−110.030.8754−2.13 × 10⁻⁶n.a
H · Δ2.68 × 10−912.68 × 10−93.840.0786+2.59 × 10⁻⁵
Total error6.98 × 10−9106.98 × 10−9
Corrected total error1.53 × 10−815
R2 (%)54.36 Standard error2.64 × 10−5
R2 adjusted for df (%)31.54 Mean absolute error1.77 × 10−5
F
B0.765610.765612.340.0049 **−0.43754 × 10⁻³
H0.084110.08411.360.2689−0.1452.4 × 10−2
Δ0.156010.15602.520.1410+0.19755 × 10⁻²
υ0.0410.040.640.4389+0.180
Total error0.6822110.0620
Corrected total error1.728015
R2 (%)60.52 Standard error0.25
R2 adjusted for df (%)46.16 Mean absolute error0.15
W
B1.07 × 10−411.07 × 10−413.560.0042 **−5.16 × 10−34 × 10−3
H2.64 × 10−612.64 × 10−60.340.5751−8.13 × 10−42.4 × 10−2
Δ4.13 × 10−514.13 × 10−55.250.0449+3.21 × 10−35 × 10−2
υ3.31 × 10−713.31 × 10−70.040.8416−2.88 × 10−480
Δ · υ2.68 × 10−512.68 × 10−53.410.0948−2.59 × 10⁻³
Total error7.86 × 10−5107.86 × 10−5
Corrected total error2.56 × 10−415
R2 (%)69.32 Standard error2.80 × 10−3
R2 adjusted for df (%)53.97 Mean absolute error1.70 × 10−3
RR
B4.1214.122.380.1570−1.0154 × 10⁻³
H0.0910.090.050.8246−0.151.2 × 10−2
Δ47.75147.7527.610.0005 **−3.4555 × 10⁻²
υ3.2713.271.890.2020+ 0.90599
Β · Δ23.14123.1413.380.0053 **−2.405
Β · υ6.6016.603.820.0824+ 1.285
Total error15.5691.73
Corrected total error100.5415
R2 (%)84.52 Standard error1.31
R2 adjusted for df (%)74.20 Mean absolute error0.81
1 Df is the degree of freedom and corresponds to the mathematical relationship between the deviations from the average. Df is calculated on the basis of the number of trials less the average. 2 Value in bold: significant (p-value ≤ 0.1), ** very significant (p-value ≤ 0.01). 3 Not applied.
Table 4. Statistical models expressing the drying process performances and the final quality of the apple as a function of the studied parameters and their interactions.
Yβ0BHΔυB · HΔ · υH · ΔB · ΔB · υEq n°R2
(%)
t11,087−525,000−100,000−69,158−47.373.13 × 10−7789-−1.76 × 10⁻¹⁰−3.33 × 10−101552.11
h422.00−8438−7375−2410−0.125--93,750--1654.13
km3.91 × 10−4−7.81 × 10⁻³−6.77 × 10⁻³−2.23 × 10⁻³−1.12 × 10⁻⁷--8.63 × 10⁻²--1754.36
F2.09−218.75−12.083.955.26 × 10−3-----1860.52
W −2.84 × 10⁻³−2.58−6.77 × 10−20.553.93 × 10−4-−5.45 × 10⁻³---1969.32
RR54.27−2953−12.575.2−0.16---−48,10067.632084.52
B is the slot width (m), H is the nozzle-to-surface height (m), Δ is the nozzle-to-nozzle spacing (m), υ is the airflow (%).
Table 5. Parameters for GAB sorption model of apple at 323 K after air impingement drying and oven drying.
Air
impingement drying
ParametersOven
drying
Parameters
Mm (kg kg−1)0.095 ± 0.005Mm (kg kg−1)0.102 ± 0.015
Cg4.31 ± 1.48 × 10²Cg2.30 ± 1.46
K0.98 ± 0.01K0.97 ± 0.01
R2 (%)99.95 ± 0.02R2 (%)99.96 ± 0.03
RMSE7.70 ± 1.74 × 10⁻³RMSE6.96 ± 2.88 × 10⁻³
χ29.20 ± 4.06 × 10⁻⁵χ28.09 ± 5.34 × 10⁻⁵
RSS5.52 ± 2.44 × 10⁻⁴RSS4.85 ± 3.21 × 10⁻⁴
Publisher’s Note: MDPI stays neutral with regard to jurisdictional claims in published maps and institutional affiliations.

