
Metabolic Flux Analysis of VERO Cells under Various Culture Conditions


1
Department of Mathematical Engineering, ICTEAM, UCLouvain, 1348 Louvain-la-Neuve, Belgium
2
Cell Technology Group, Division of Industrial Biotechnology, KTH Royal Institute of Technology, 100 44 Stockholm, Sweden
3
Systems, Estimation, Control and Optimization (SECO), University of Mons, 7000 Mons, Belgium
*
Author to whom correspondence should be addressed.
Processes 2021, 9(12), 2097; https://0-doi-org.brum.beds.ac.uk/10.3390/pr9122097
Submission received: 10 October 2021
/
Revised: 12 November 2021
/
Accepted: 15 November 2021
/
Published: 23 November 2021
(This article belongs to the Special Issue Mathematical Modeling and Control of Bioprocesses)
Abstract
:Although the culture of VERO cells in bioreactors is an important industrial bioprocess for the production of viruses and vaccines, surprisingly few reports on the analysis of the flux distribution in the cell metabolism have been published. In this study, an attempt is made to fill this gap by providing an analysis of relatively simple metabolic networks, which are constructed to describe the cell behavior in different culture conditions, e.g., the exponential growth phase (availability of glucose and glutamine), cell growth without glutamine, and cell growth without glucose and glutamine. The metabolic networks are kept as simple as possible in order to avoid underdeterminacy linked to the lack of extracellular measurements, and a unique flux distribution is computed in each case based on a mild assumption that the macromolecular composition of the cell is known. The result of this computation provides some insight into the metabolic changes triggered by the culture conditions, which could support the design of feedback control strategies in fed batch or perfusion bioreactors where the lactate concentration is measured online and regulated by controlling the delivery rates of glucose and, possibly, of some essential amino acids.
1. Introduction
The production of biopharmaceuticals using cultures of genetically modified strains has gained tremendous importance in the drug manufacturing sector. In this context, it is important to understand and assess the influence of the culture conditions, and the impact of metabolic engineering, on the yield of the products of interest. This can be achieved through an analysis of the flux distribution inside the metabolic network of the cells or microorganisms under consideration. Various computational procedures have been proposed for that purpose, including metabolic flux analysis and flux balance analysis [1].
Even though there has been a significant number of reports of the application of these procedures to cultures of CHO cells and hybridoma cells (e.g., [2,3,4,5,6,7,8]), there has been surprisingly few reports focusing on the metabolism of VERO cell cultures [9]. However VERO cells are important vectors for the production of viruses (and vaccines) (e.g., [10,11,12,13,14,15,16,17,18]).
The objective of this study is to apply metabolic flux analysis to small metabolic networks of VERO cells, on the basis of experimental data collected in three different culture conditions. In each case, the network is designed to be fully compatible with the data while being kept as simple as possible to avoid the underdeterminacy that usually prevails when manipulating large metabolic networks. In this study, the considered metabolic networks allow keeping the underdeterminacy at a minimum, and to compute a unique solution based on the only additional mild assumption that the macromolecular (proteins, nucleic acids, membrane lipids) composition of the cell is as reported in the literature [19] (p. 113, Table 7.1).
The paper is organized as follows. The next section presents the experimental data, cell densities, and metabolite concentrations, collected in two batch cultures of VERO cells. From these data, depending on the availability of glucose and glutamine, three types of culture growth are distinguished. The metabolic network and its analysis are then detailed and discussed in Section 3 for the exponential growth phase with glucose and glutamine as carbon and nitrogen sources, respectively. Next, in Section 4, we consider the case where glutamine is replaced by glutamate as the source of nitrogen. Finally, the case where lactate becomes the source of carbon instead of glucose is addressed in Section 5. Final conclusions are presented in the last section.
2. Experimental Data
In this paper, we use data from two batch cultures of VERO cells, labeled (a1) and (a2), which were simultaneously carried out over a period of eight days in parallel spinner-flasks, using the same culture medium. In particular, the two cultures were seeded from the same pool of cells. The only difference between the two cultures lies in the initial concentration of glucose. A full description of the materials and methods of these experiments can be found in [20] (Section 3).
The experiments were performed in spinner-flasks (paddle impeller type). The culture volume was 250–270 mL. VERO cells (passage 136–146) were grown adherently on Cytodex 1 microcarriers (3.5 g/L). The spinner-flasks were inoculated with approximately cells/mL, which corresponded to eight cells per microcarrier on average. The basic culture medium was M199 supplemented at inoculation with fetal calf serum (10% ) and antibiotic (neomycin sulfate 5% ). The culture was magnetically stirred at 45 RPM. The oxygen supply was provided by transfer via the head space. The atmosphere of the head space was renewed twice a day.
The culture medium was sampled (2 mL) twice a day for analysis (except on day 5, where there was only one sample). Cell counting was done with a hemacytometer using crystal violet staining. Glucose and lactate concentrations were determined with a Yellow–Springer analyzer. Amino acids and ammonia were determined with the HPLC method.
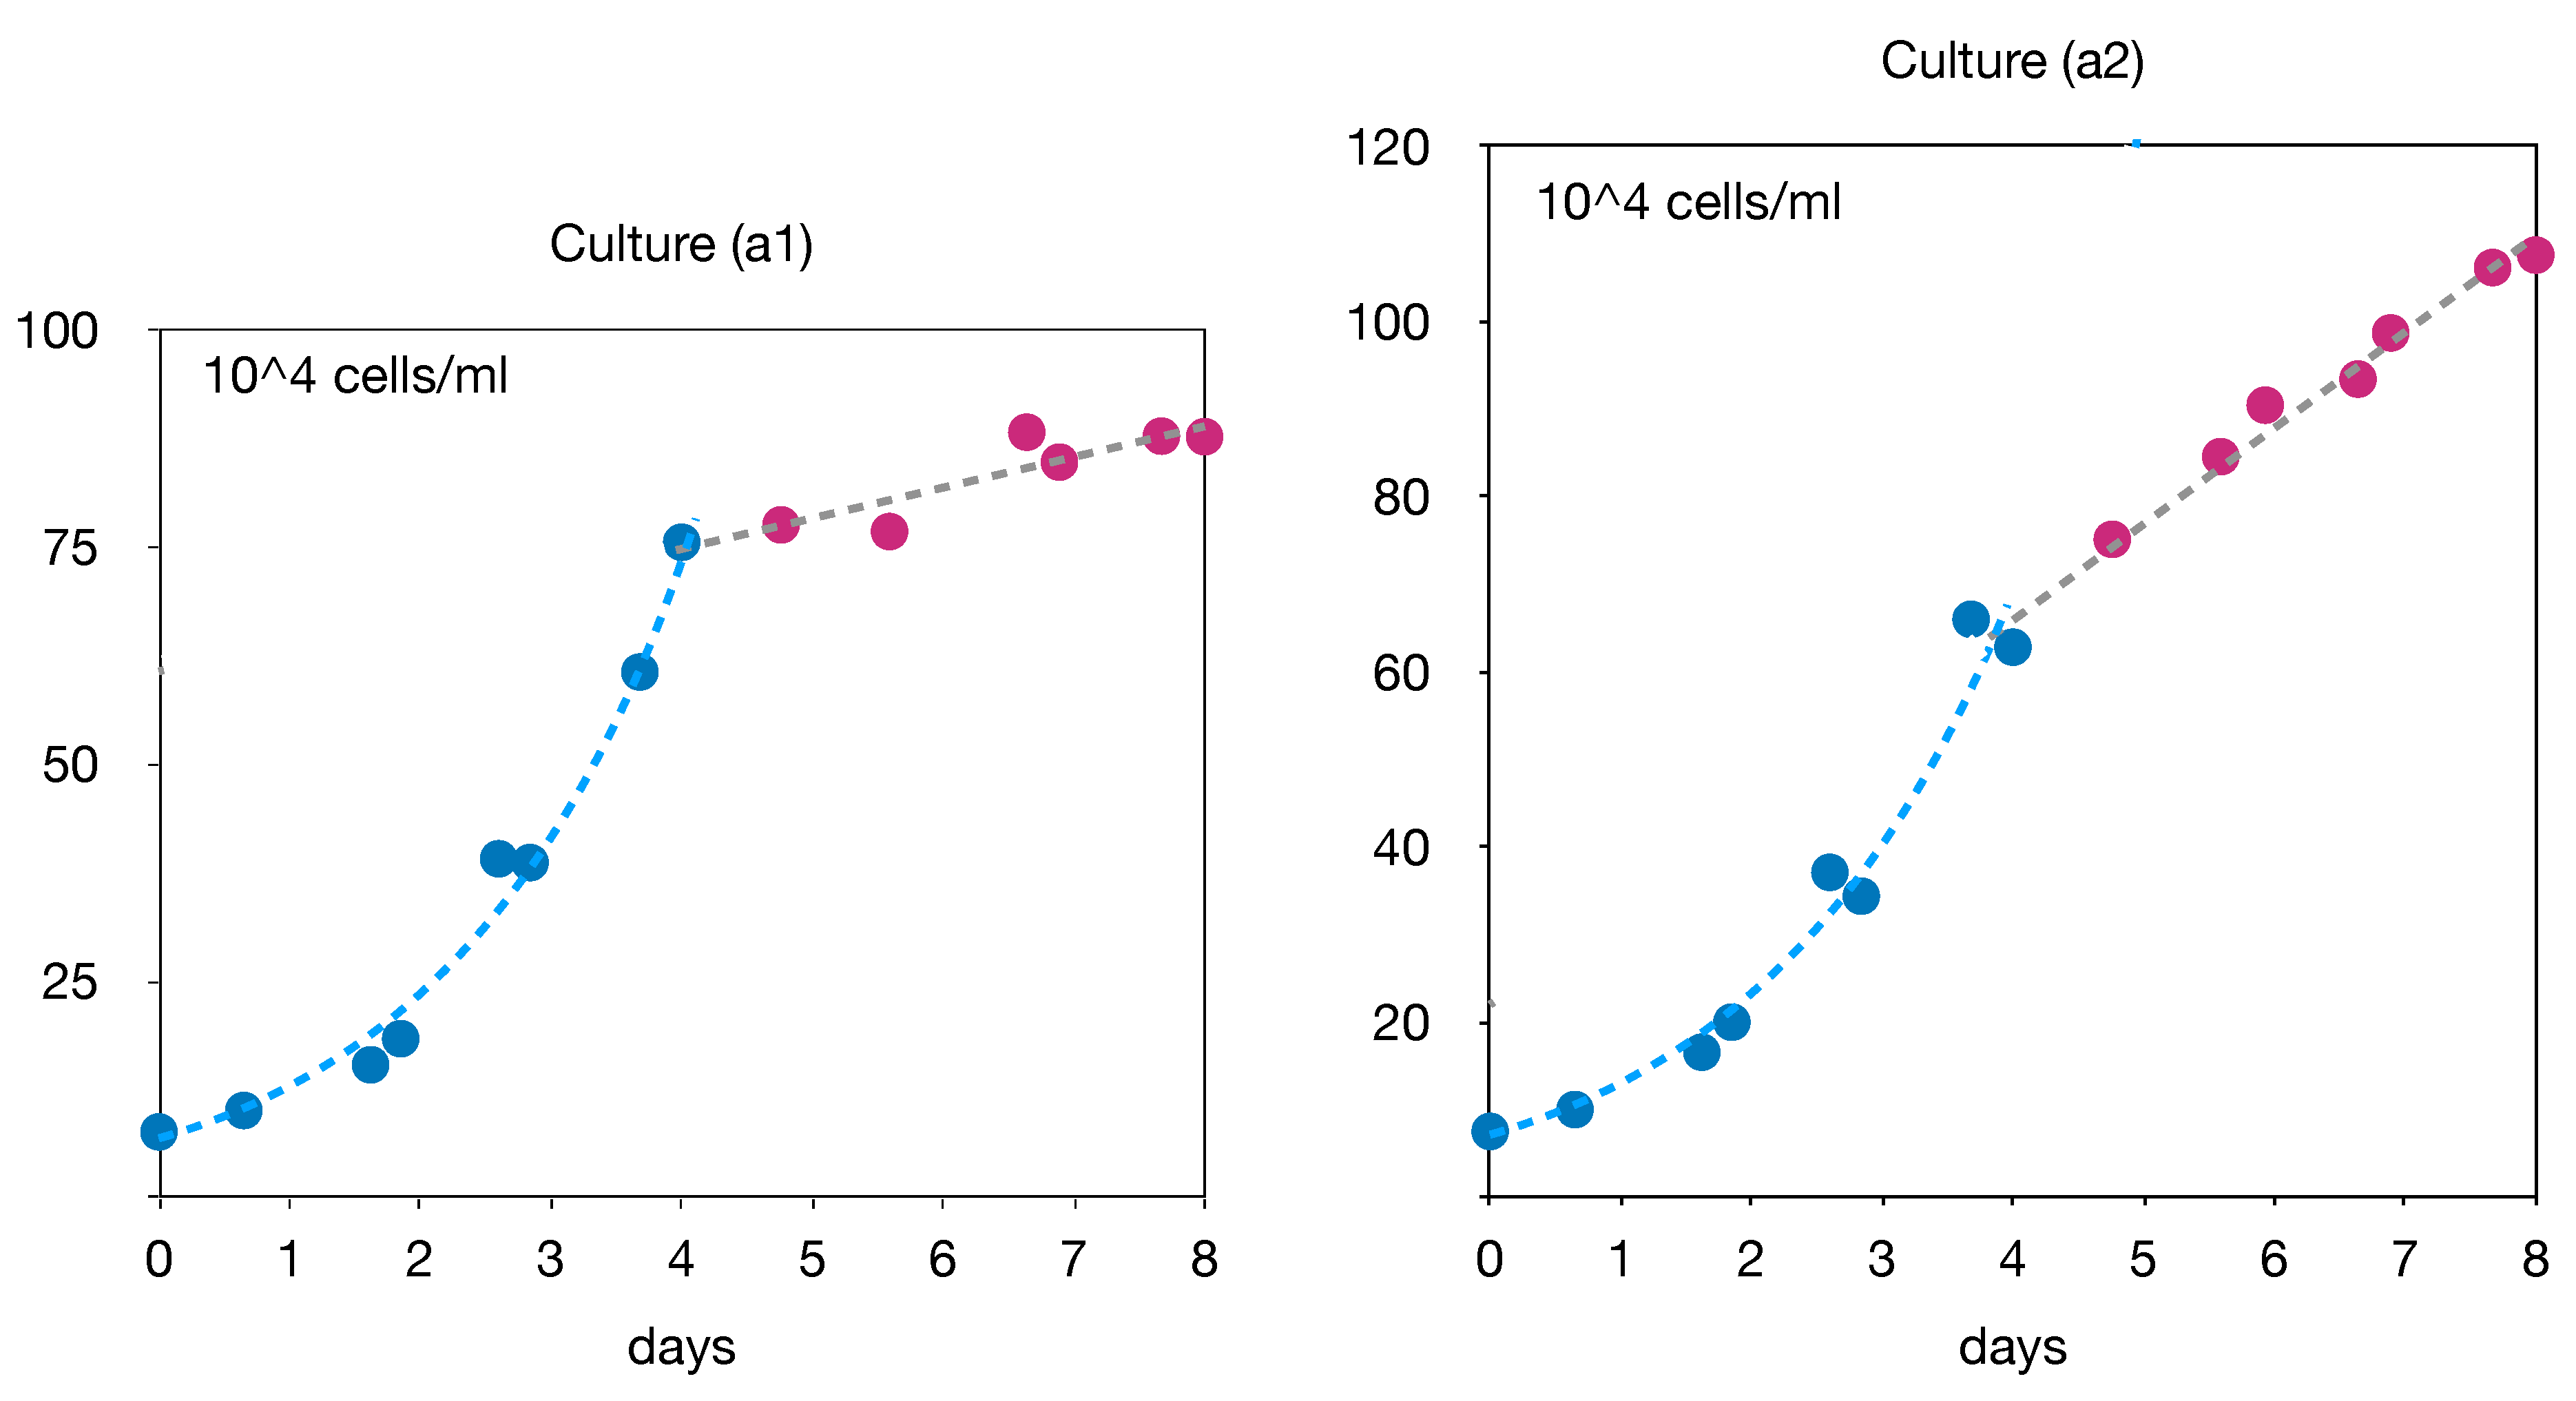
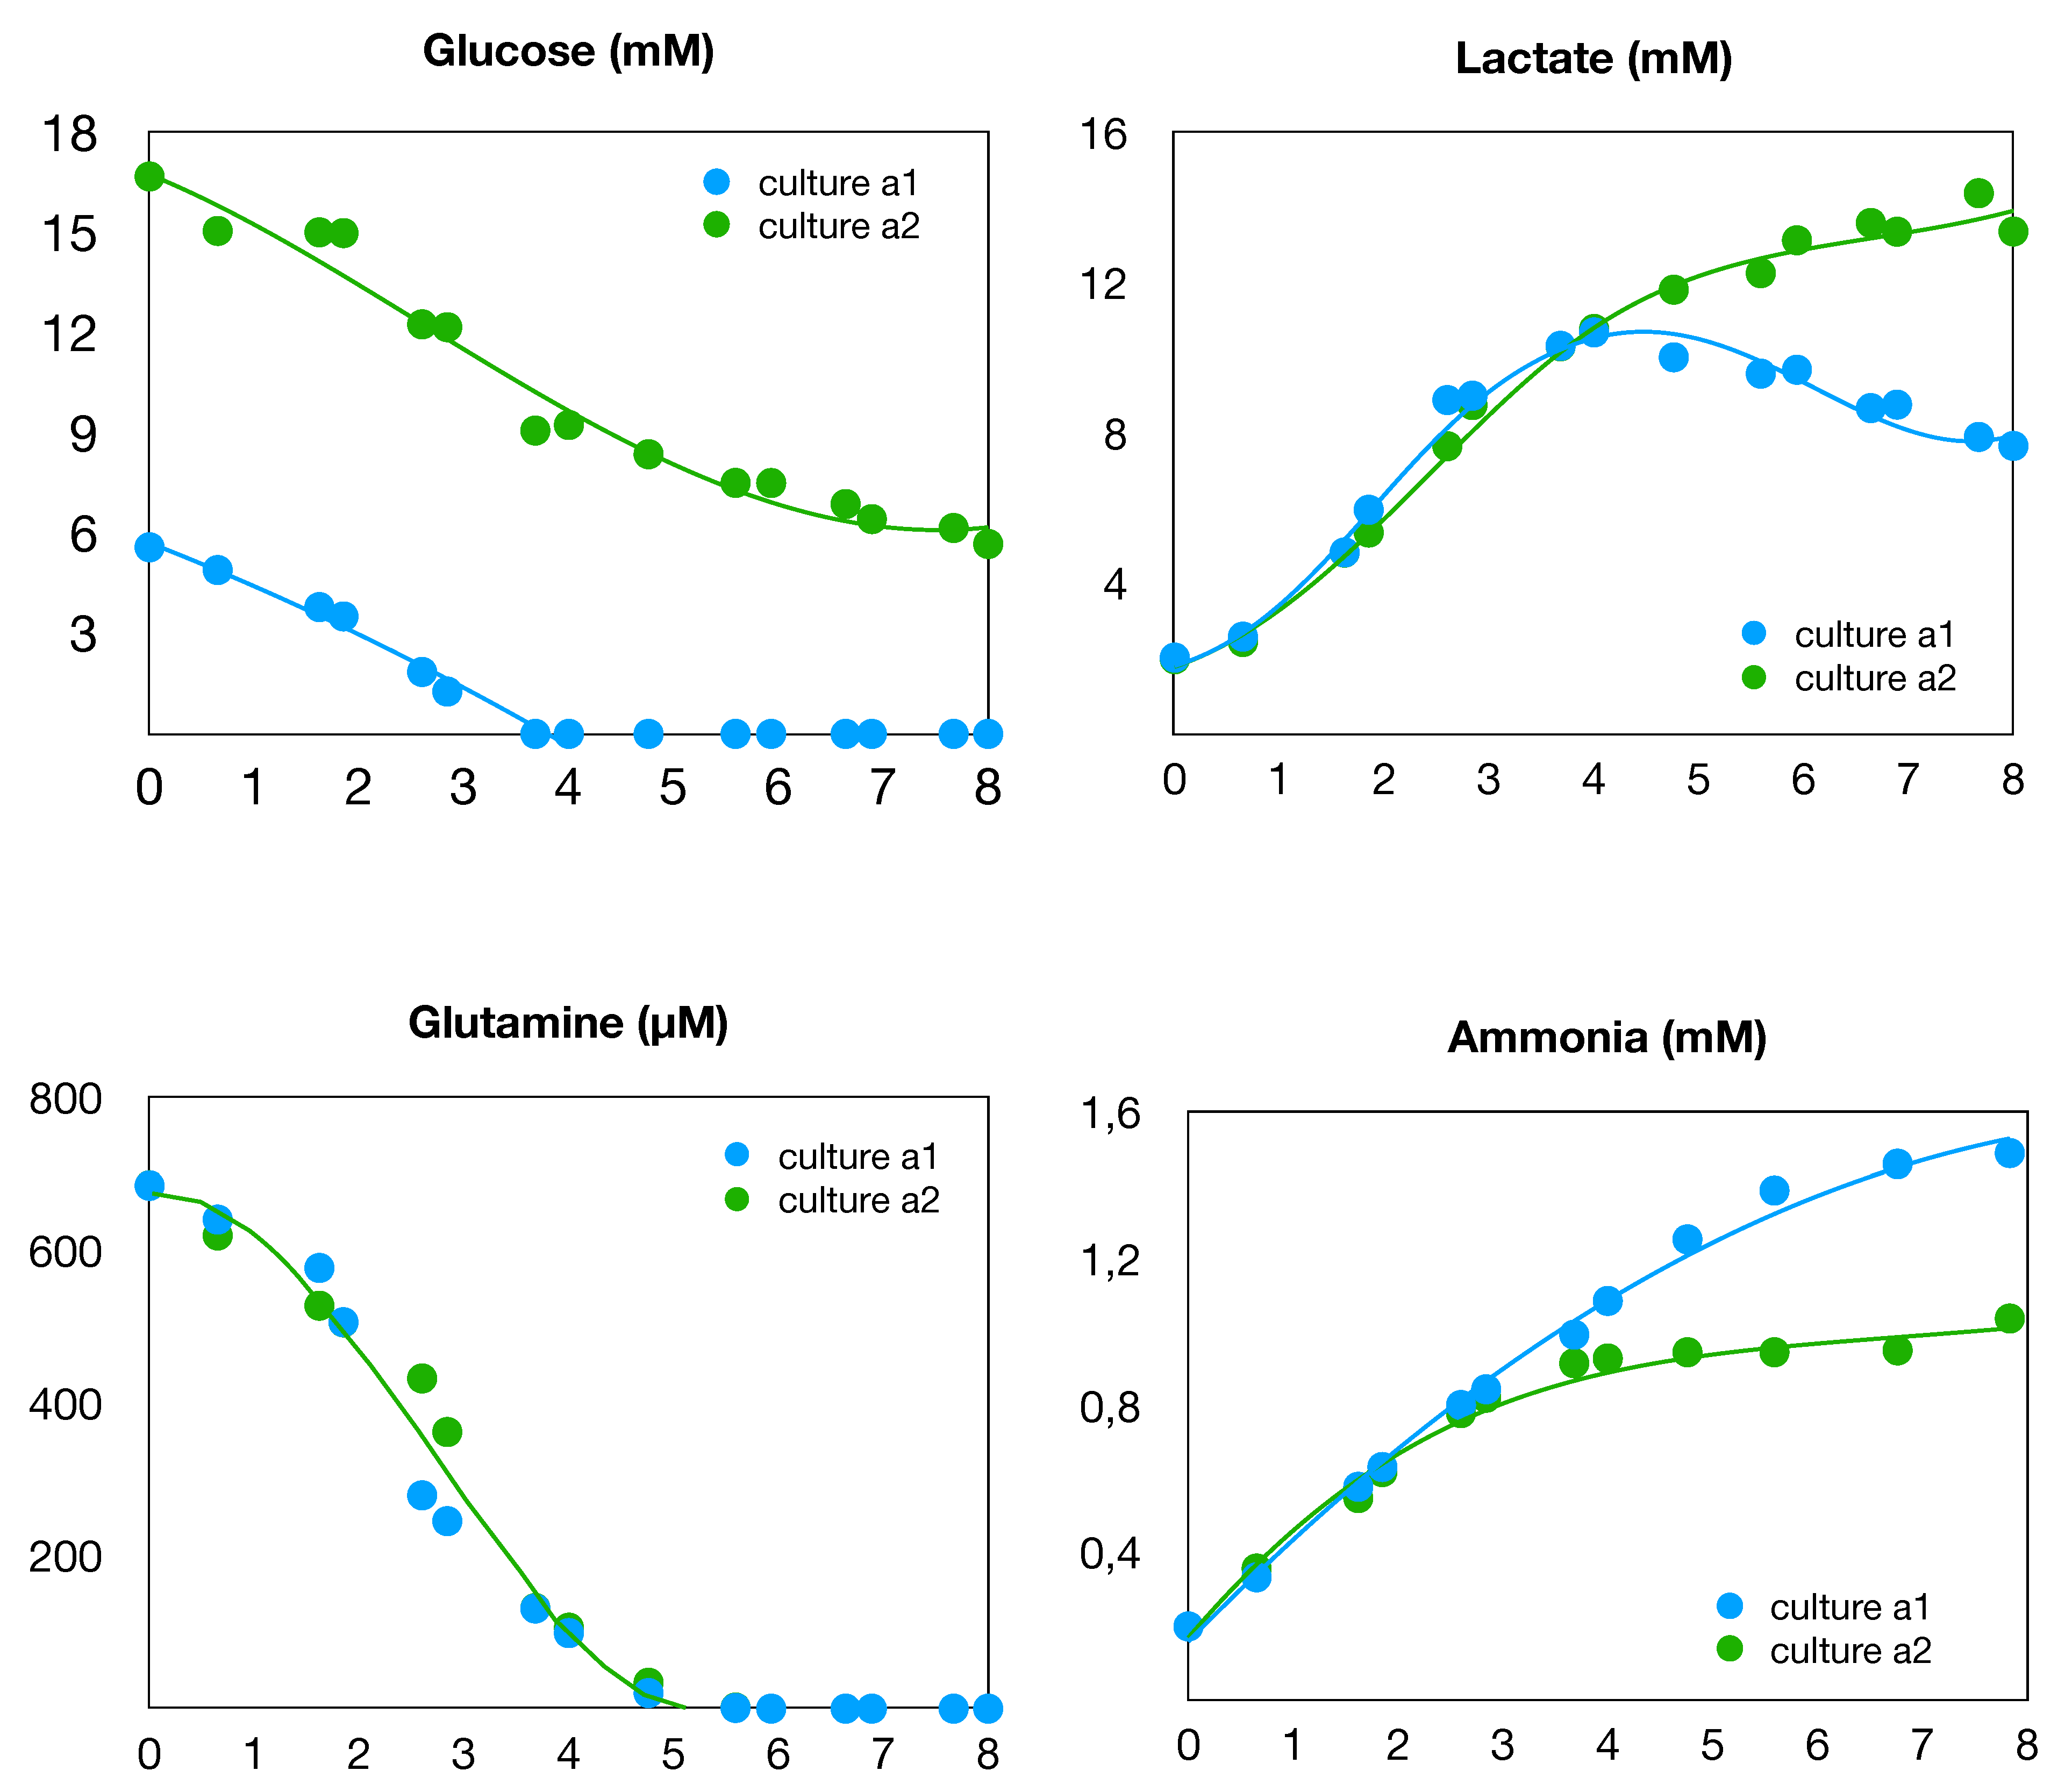
The data collected during these cultures are presented in various figures hereafter. The time evolution of cell densities (counting) is shown in Figure 1. We can readily observe two different successive phases in both cultures. The growth begins with a classical exponential phase during the first four days. Then, from the fourth to the eighth days, there was a shift to a slower quasi-linear growth. An explanation for this behavior can be found in Figure 2 where the time evolution of the concentrations of glucose and glutamine in the culture medium are shown. Indeed, it can be seen that, after the fourth day, both glucose and glutamine are depleted in culture (a1). However the growth proceeds more slowly, with lactate as the carbon source, while alanine and glutamate are alternative nitrogen sources in the central metabolism (see Figure 3). In contrast, culture (a2) is operated with an excess of glucose, so that only glutamine is depleted on the fourth day and replaced by glutamate as a source of nitrogen. These three different situations of the culture conditions are summarized in the Table 1 below. Our purpose, in this paper, is to perform a metabolic flux analysis in order to compute and compare the distributions of the intracellular metabolic fluxes in these three situations.
Data of Amino Acids
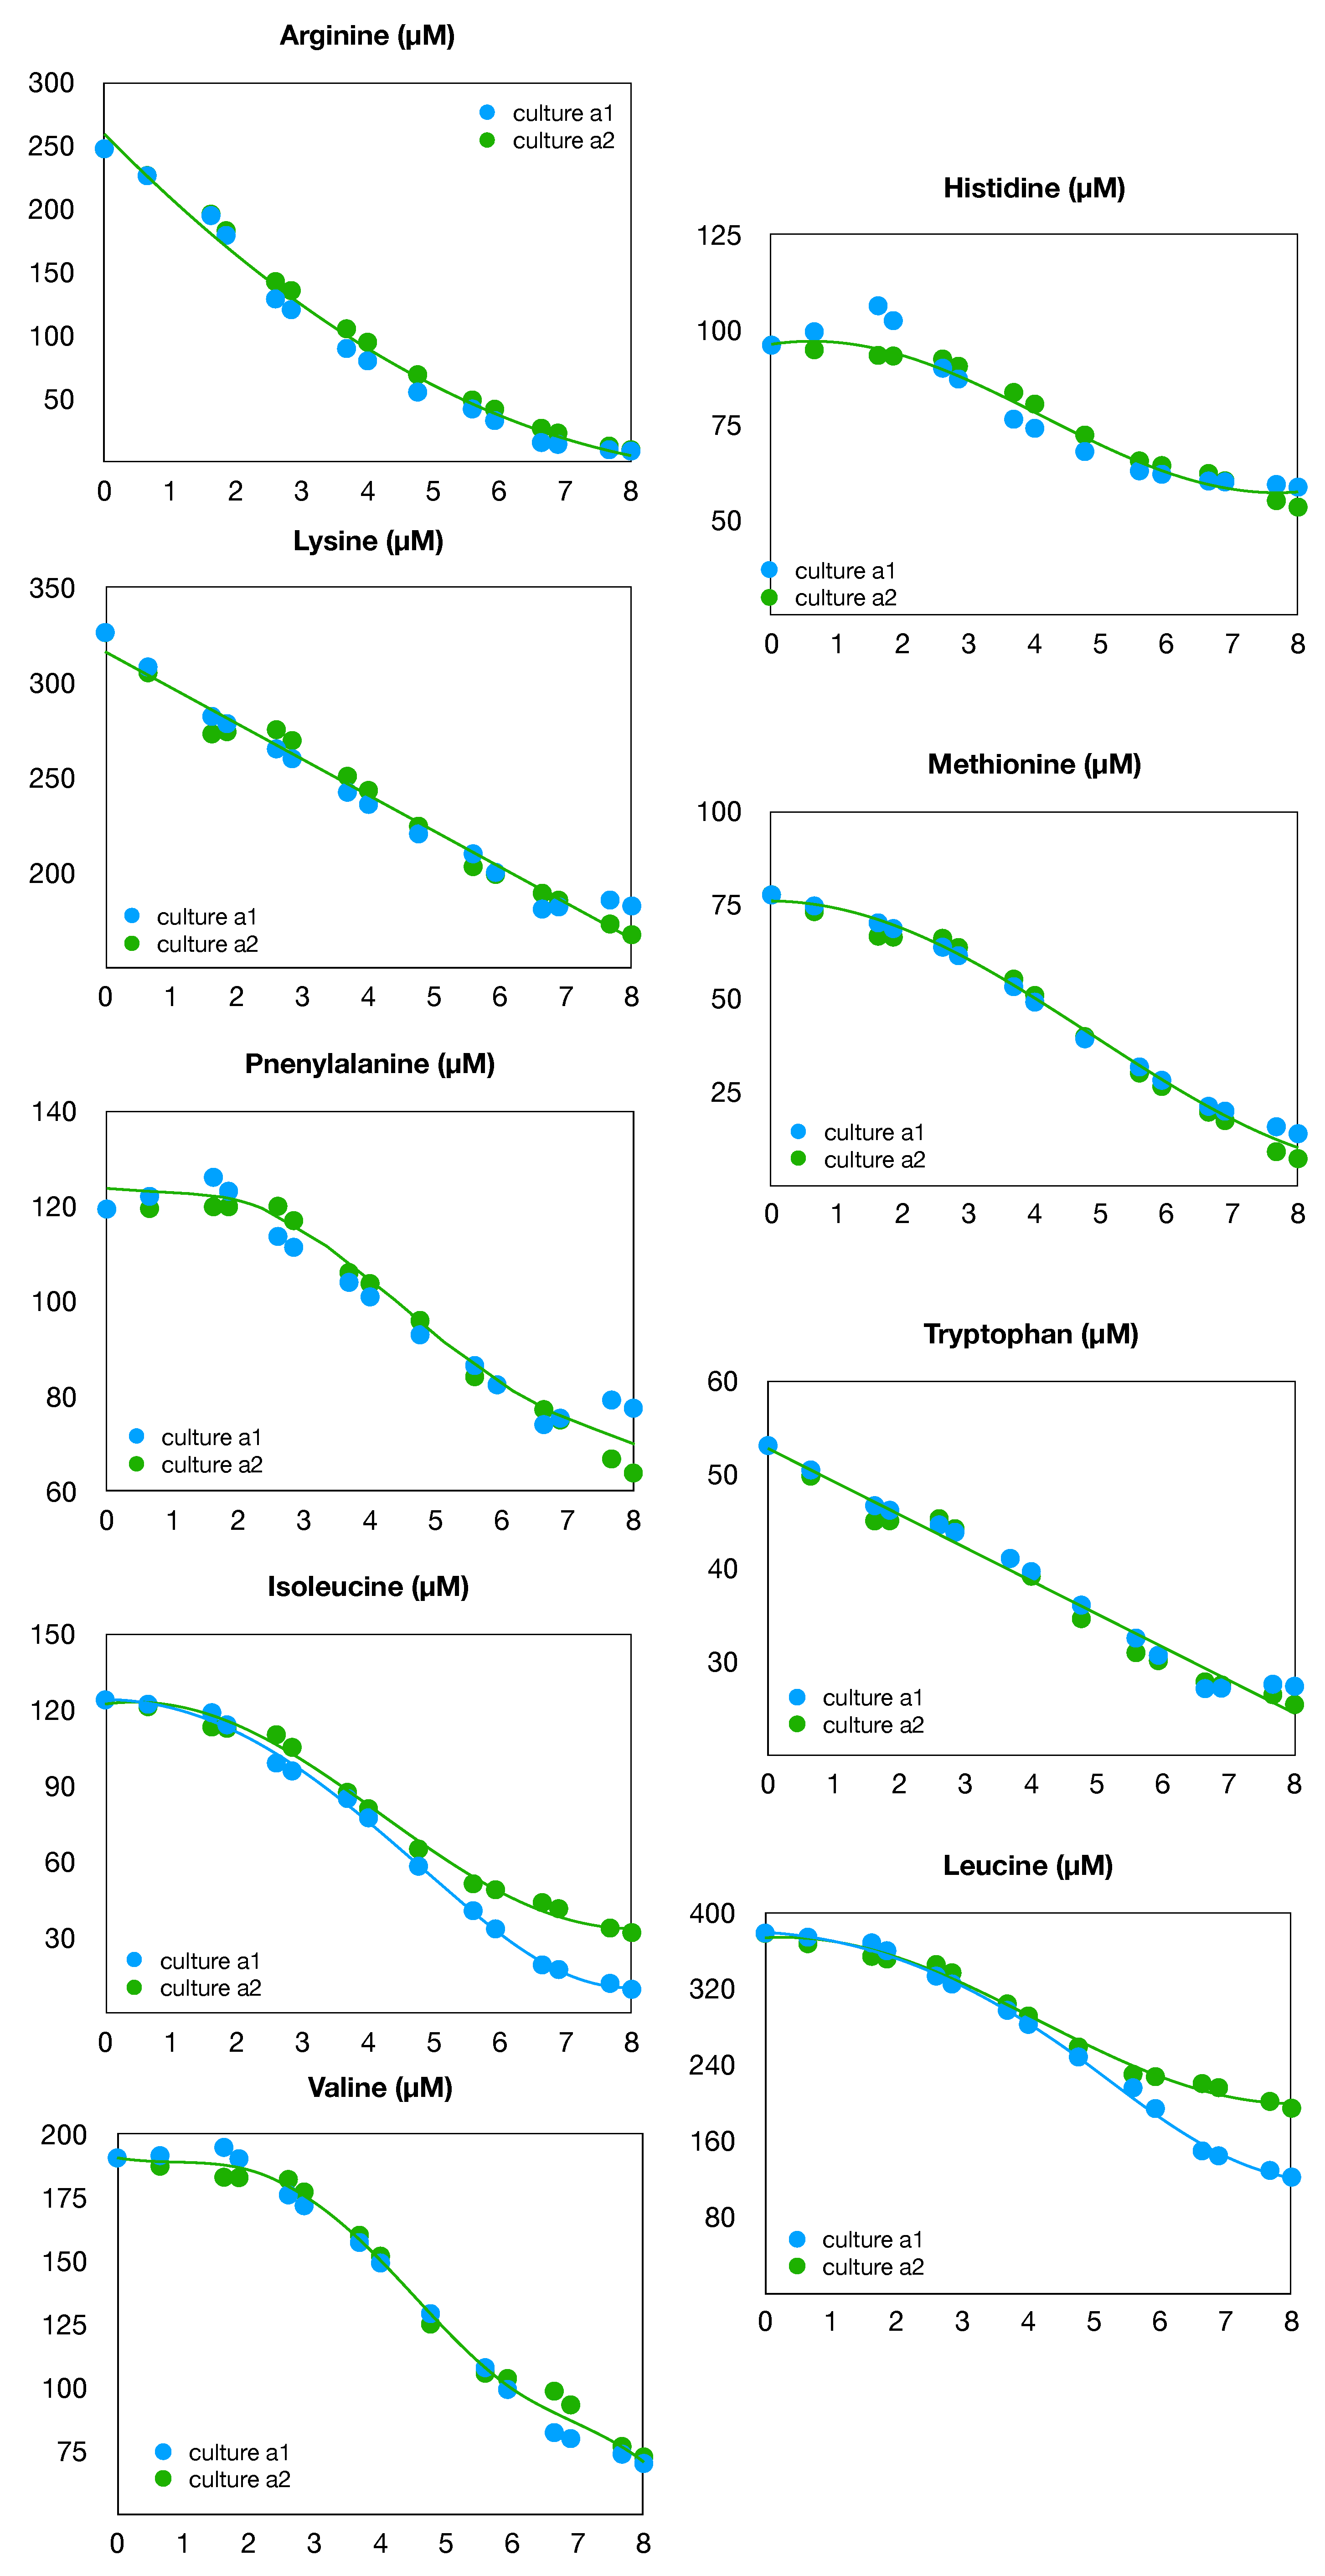
Concentration measurements of eighteen amino acids in the culture medium were measured with an HPLC method. In Figure 4, we present the data for nine essential amino acids, which are naturally consumed in correlation with the cell growth: arginine, histidine, isoleucine, leucine, lysine, methionine, phenylalanine, tryptophan, and valine. Data are not available for threonine. It can be seen that the shape of the consumption is quite similar for both cultures, (a1) and (a2), with only marginal deviations for leucine and isoleucine.
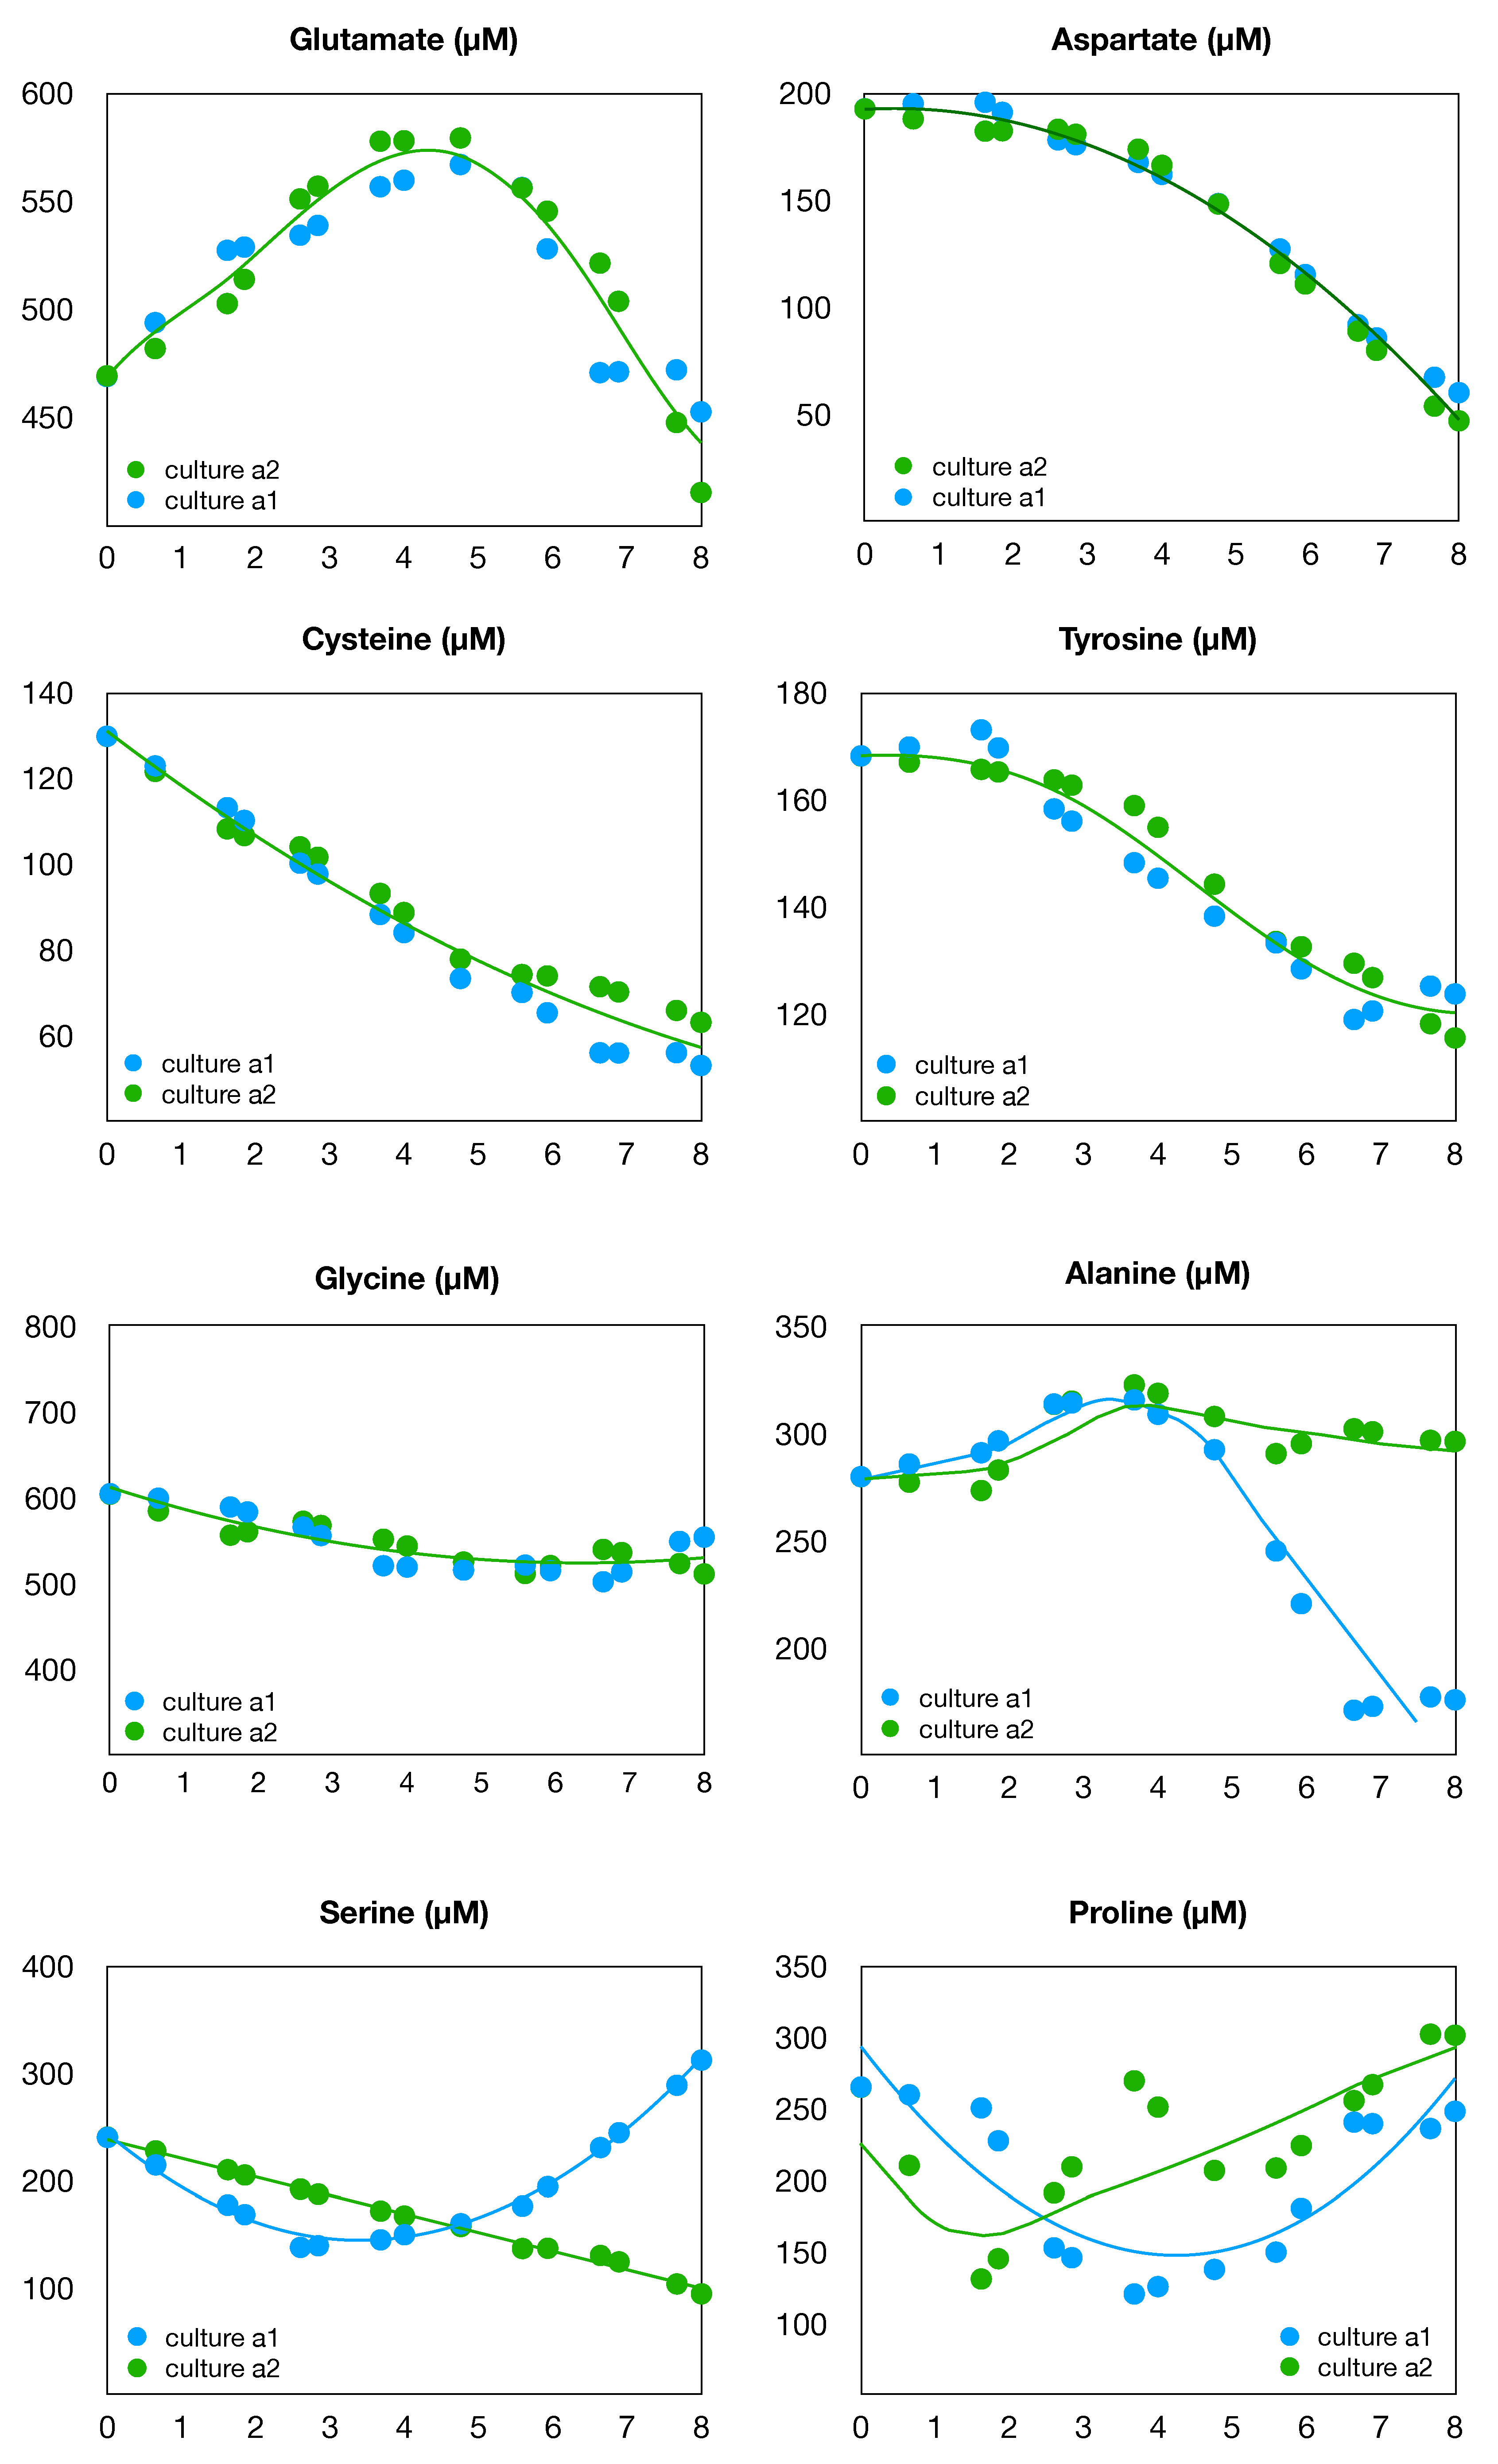
Moreover, in addition to glutamine in Figure 2, we present in Figure 3 the measurements for eight other non-essential amino acids: alanine, aspartate, cysteine, glutamate, glycine, proline, serine, and tyrosine. It can be seen that these measurements do not always follow the shape of the cellular growth. In particular, glutamate and alanine are accumulated in the culture medium during the exponential growth, but are significantly consumed when glutamine is depleted. We also note that the medium does not contain asparagine at the start of the culture and that asparagine data are not available throughout the culture.
In Table 2, Table 3 and Table 4, the specific uptake and/or excretion rates of all the species measured in the culture medium are given for the three considered culture conditions (Table 2 and Table 4 are complementary and when a rate does not appear in one table (symbol –––––) it appears in the other one). These rates are estimated from the slopes of the solid curves that fit the experimental data in Figure 2, Figure 3 and Figure 4, at time 2.90 days for the exponential growth and at time 6.64 days for the growth without glucose and/or glutamine.
3. Metabolic Flux Analysis of the Exponential Growth Phase
3.1. Metabolic Network
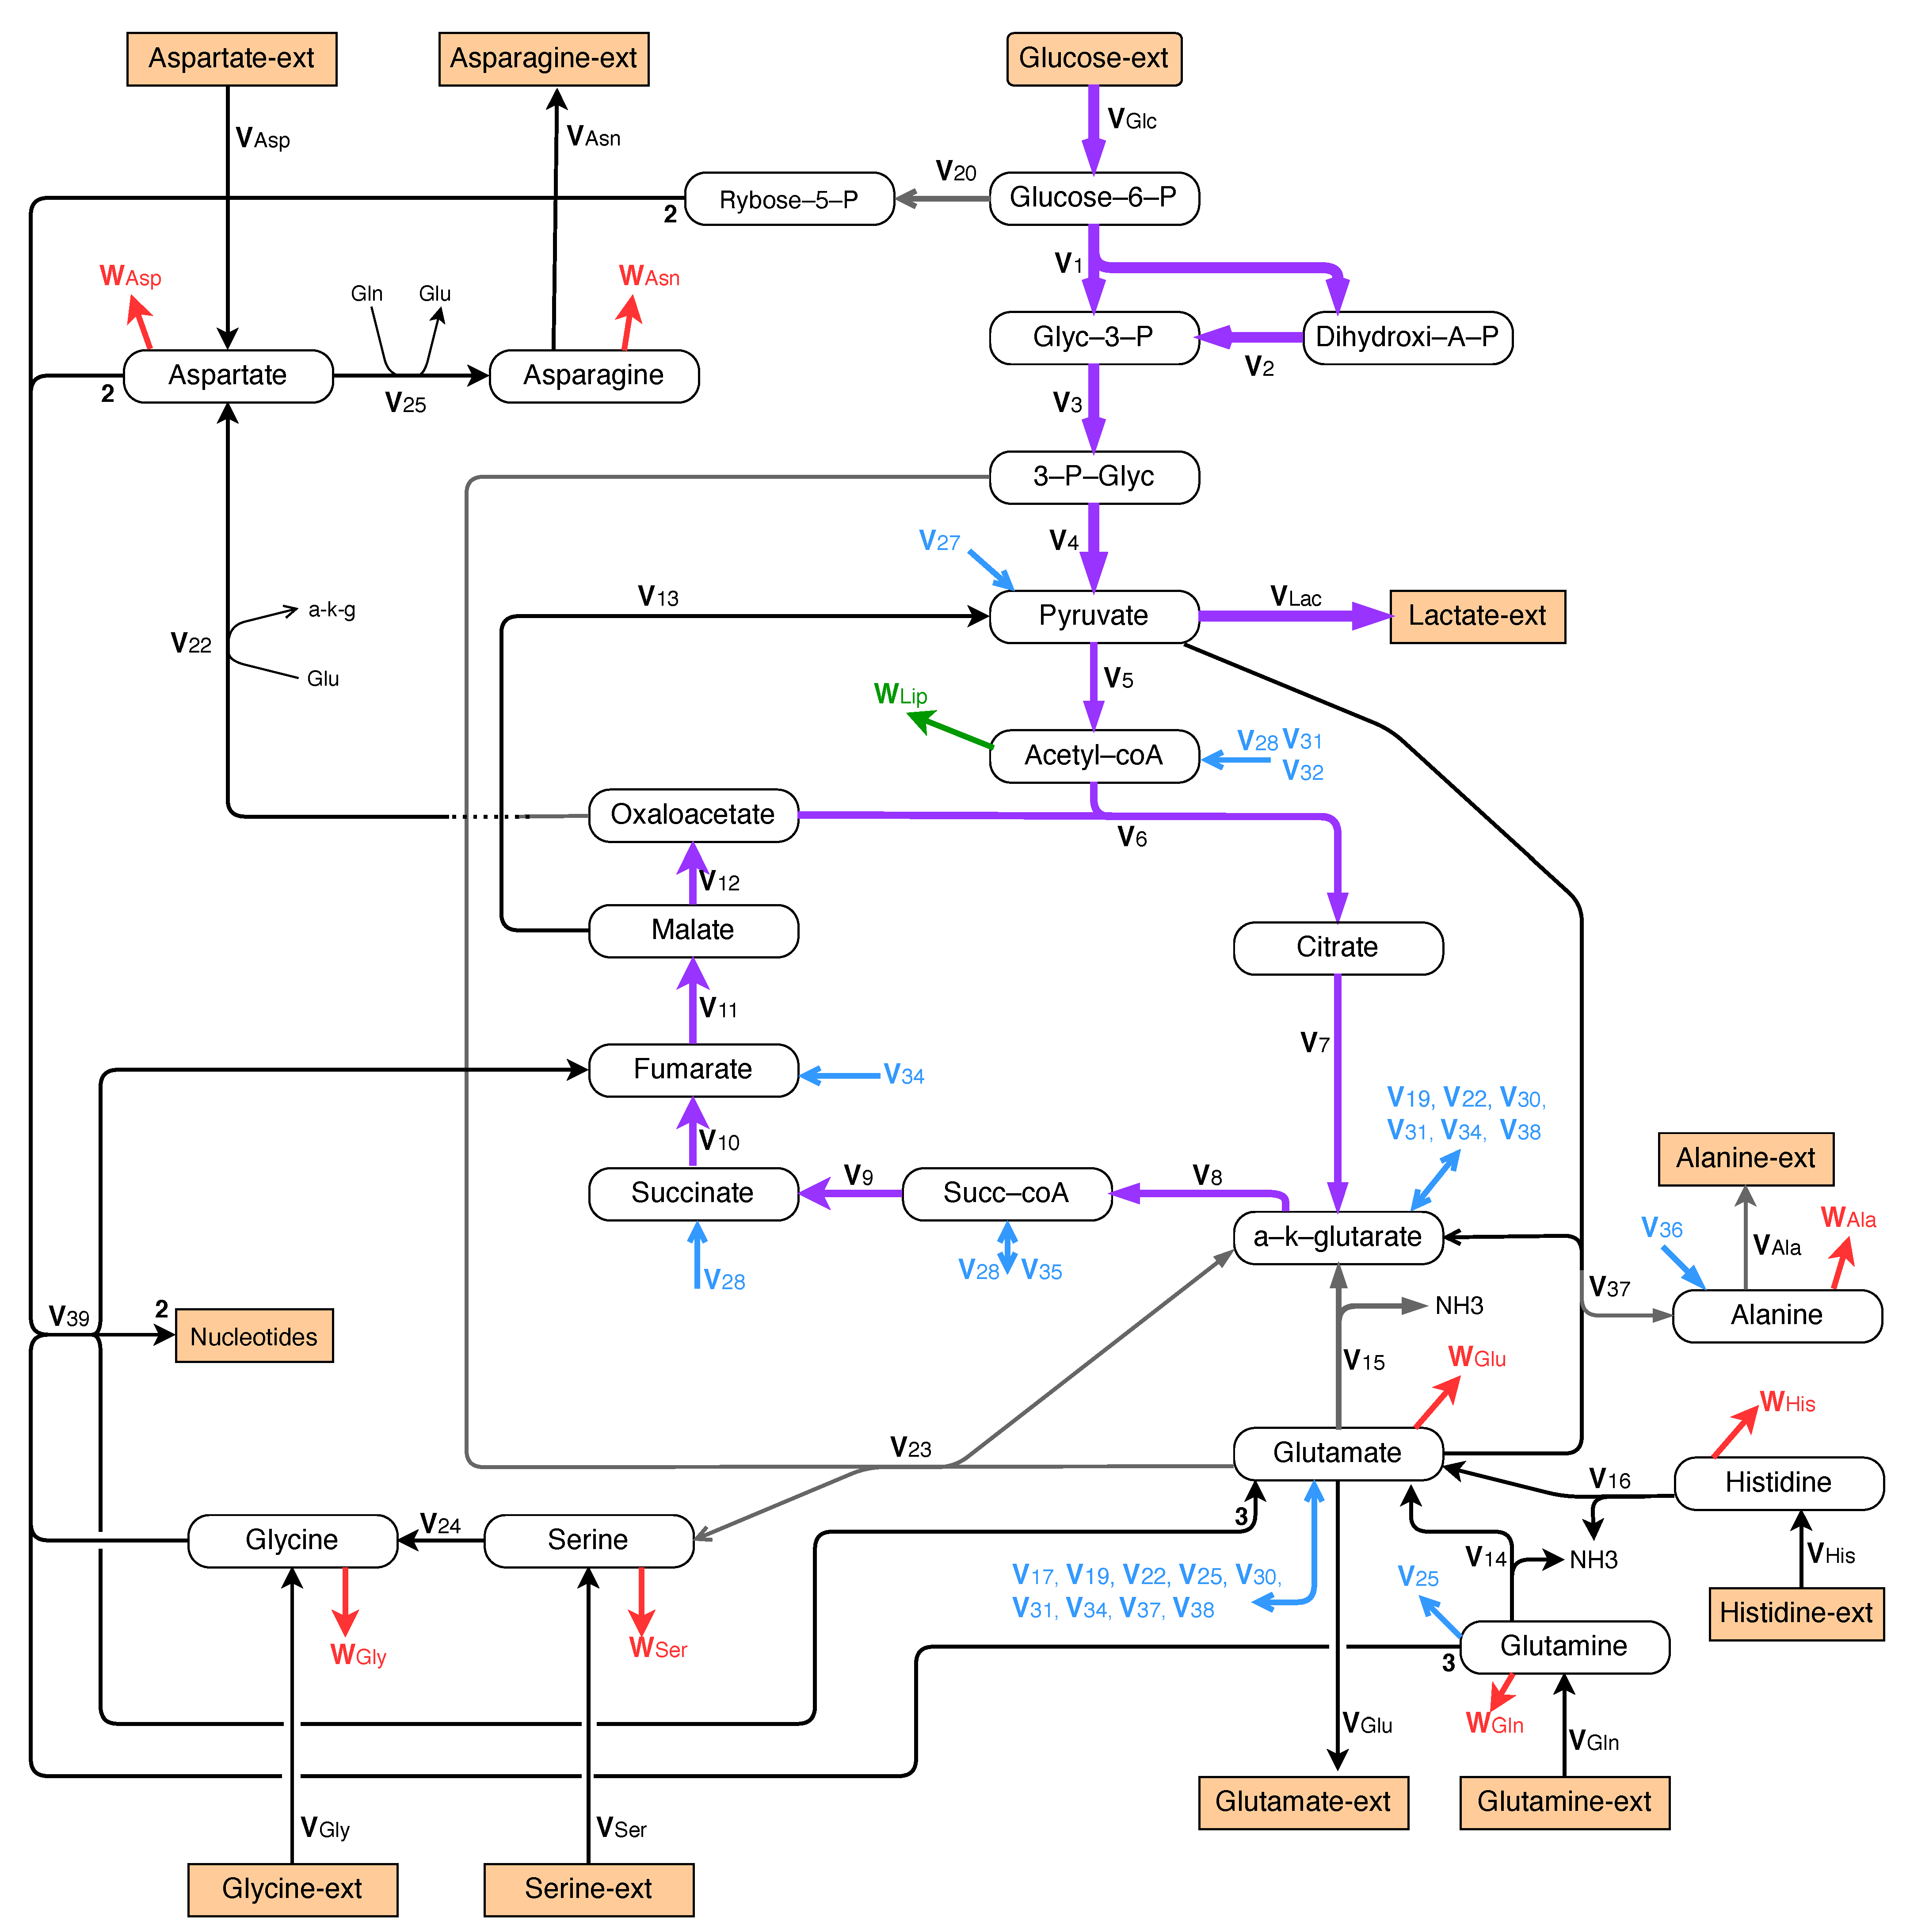
The metabolic network considered for the exponential growth is made up of all the biochemical reactions in Figure 5, Figure 6 and Figure 7. The main motivations behind the set-up of this network are given in the present section.
3.1.1. Central Metabolism
For the growth of mammalian cells, the central metabolism involves glycolysis, TCA cycle, and glutaminolysis, as represented in Figure 5. For simplicity, the pentose phosphate pathway is neglected.
3.1.2. Synthesis of Proteins
Essential amino acids cannot be synthesized and must be provided in the culture medium. Therefore, the maximum possible production rate of proteins is determined by the essential amino acid with the lowest ratio between its external uptake rate (from Table 3) and its frequency in protein composition as given in Table 5.
In the case of exponential growth, among all essential measured amino acids, phenylalanine is the one with this lower ratio. Hence, assuming a maximization of the biomass production, we suppose that phenylalanine is exclusively used for protein production. Therefore the protein production flux from phenylalanine must be equal to the external uptake rate given in Table 3, i.e., = = 0.228 M/d × 10 cell. On this basis, we can then compute the contribution of each amino acid to the production rate of proteins given in Table 5 with the formula:
where is a specific intracellular consumption rate of amino acid for protein production, is the frequency of amino acid in the protein composition (and for phenylalanine).
3.1.3. Synthesis of Nucleotides
The synthesis of nucleotides is represented by the following standard overall biochemical reactions:
Furthermore, we assume that DNA and RNA are made up with, approximately, equal shares of purine and pyrimidine nucleotides. It results that, omitting the co-factors ATP, ADP and AMP, nucleotide synthesis is represented in the network of Figure 5 by the single overall reaction:
3.1.4. Catabolism of Essential Amino Acids
Only catabolic pathways must be considered for essential amino acids since they cannot be synthesized in the cell. We adopt the standard catabolic reactions represented in Figure 6 and Figure 7. It can be verified that this representation is fully consistent with the available data because we have for all essential amino acids (with from Table 3 and from Table 5).
3.1.5. Metabolism of Non-Essential Amino Acids
For non-essential amino acids, both catabolic and anabolic pathways can be taken into account. From the data of Table 2, Table 4 and Table 5, it appears that the metabolism of non-essential AA may strongly depend on the culture conditions.
In the phase of exponential growth, anabolic pathways must be considered for alanine and glutamate because, as seen in Table 4, they are excreted in the culture medium and, therefore, produced inside the cell at a level that is widely in excess, with respect to the amount needed for protein production. The metabolism of alanine and glutamate is represented in Figure 5.
Moreover, from the data of Table 2, it appears that the uptake rates of extracellular aspartate, glycine, and serine are not sufficient to reach the protein production level given in Table 5, and that an intracellular synthesis must be provided, too. The metabolism of these amino acids is also represented in Figure 5. In Figure 5, a synthesis pathway is provided for asparagine together with an excretion. This assumption will be motivated in the next section.
3.1.6. Synthesis of Lipids
Finally, in addition to nucleotides and amino acids, we consider the lipids as the last fundamental building blocks of the biomass, in order to set up a model that is consistent, in terms of mass balance with a sufficient accuracy. For simplicity, we assume however that acetyl-CoA is the only significant contributor to the molecular mass of lipids, with a rate denoted as shown in Figure 5. Indeed, the other necessary precursors of membrane lipids (e.g., serine, choline, ethanolamine, or dihydroxyacetone phosphate) are used in such low proportions that they can be neglected without significant loss of accuracy.
3.2. Metabolic Flux Analysis
3.2.1. Balance Equations
The metabolic fluxes satisfy the following set of balance equations.
| Internal Metabolite | Flux Balance Equation |
| Glucose-6-P | = 42.308 |
| Glyceraldehyde-3-P | |
| Dihydroxyacetone P | |
| 3-Phosphoglycerate | |
| Pyruvate | = 63.970 |
| Acetyl-coA | = 0 |
| Citrate | |
| -ketoglutarate | |
| Succinyl-CoA | |
| Succinate | |
| Fumarate | |
| Malate | |
| Oxaloacetate | |
| Glutamate-5-semialdehyde | |
| -ketobutyrate | |
| Propionyl-CoA | |
| -ketoadipate | |
| Acetoacetate | |
| Ribose-5-P | |
| Arginine | = 0.643 |
| Aspartate | = −0.001 |
| Asparagine | = 0.266 |
| Cysteine | |
| Glutamate | = 1.025 |
| Glutamine | = 4.734 |
| Glycine | = −0.139 |
| Histidine | = 0.045 |
| Methionine | = 0.118 |
| Phenylalanine | = 0 |
| Proline | = 0.260 |
| Serine | = −0.204 |
| Tyrosine | = 0.016 |
| Valine | = 0.097 |
| Isoleucine | = 0.142 |
| Leucine | = 0.306 |
| Lysine | = 0.041 |
| Tryptophan | = 0.022 |
| Alanine | = 1.006 |
| NH3 | = 5.3 |
3.2.2. Computation of Metabolic Fluxes
The above system of linear equations is underdetermined. One of the reasons for this indeterminacy is that asparagine data are not available and the rate of asparagine transfer between the cell and the external culture medium is unknown. In order to get a unique solution, we introduce the additional constraint that the macromolecular (proteins, nucleic acids, membrane lipids) composition is as reported, e.g., in [19] (p. 113, Table 7.1) for mammalian cells. From this reference, the mass of proteins is roughly 12-fold larger than the mass of nucleic acids in mammalian cells. Furthermore, we know that the average mass of a nucleotide is about three-fold larger than the average mass of an amino acid. Using molar units as we do in this paper, it follows that the sum (see Table 5) of amino acid rates for protein production must be approximately 36-fold larger than the nucleotide production rate and, consequently, 72-fold larger that the rate of reaction (2), i.e.,
Similarly, the mass of protein is roughly 3.5-fold larger than the mass of membrane lipids, while the average mass of a phospholipid is about 7-fold larger than the average mass of an amino acid. Then, since the production of one mole of phospholipids consumes about 18 moles of acetyl-CoA, we deduce that we have approximately:
where denotes the consumption rate of acetyl-CoA for lipid synthesis (see Figure 5).
Under these additional constraints (3) and (4), the system of equations is determined and has the following solution:
| = = 42.136 | = 3.198 | = 0.429 | = 0.0 |
| = 84.272 | = 2.731 | = 0.225 | = 0.016 |
| = 83.843 | = 2.306 | = 1.745 | = 0.357 |
| = 22.318 | = 0.045 | = 0.118 | = 0.022 |
| = = 18.973 | = 0.903 | = 0.231 | = 0.984 |
| = 23.630 | = 0.260 | = 0.354 | = 0.041 |
| = 23.633 | = 0.643 | = 0.118 | = 0.086 |
| = 23.987 | = 0.172 | = 0.097 | |
| = 24.089 | = 0.032 | = 0.142 | = 1.479 |
| = 20.891 | = 1.918 | = 0.306 | = 4.52 |
These results can be summed up as follows:
Assuming that
- (a)
- The essential amino acids are not produced inside the cell;
- (b)
- The biomass production is maximal;
- (c)
- The production rates of proteins, nucleic acids, and membrane lipids are in the same proportions as the respective mass fractions of these macromolecules inside the cells;
Then
- (a)
- (b)
- Closing the overall flux balance necessarily implies that asparagine (which is not measured) is significantly excreted with a rate of about 1.5 M/d × 10 cells. This is quite natural because it is well known that “mammalian cell culture metabolism is characterized by a high glucose and glutamine uptake combined with a high rate of lactate and non-essential amino acid secretion” [3]. From our results, it appears that glutamate, alanine, and especially asparagine, are the main excreted non-essential amino acids for this culture of VERO cells during the exponential growth. It is clearly the reason why a medium without asparagine may be used at the start of the culture without problem.
4. Metabolic Flux Analysis for the Growth without Glutamine
4.1. Metabolic Network
4.1.1. Central Metabolism and Nucleotide Synthesis
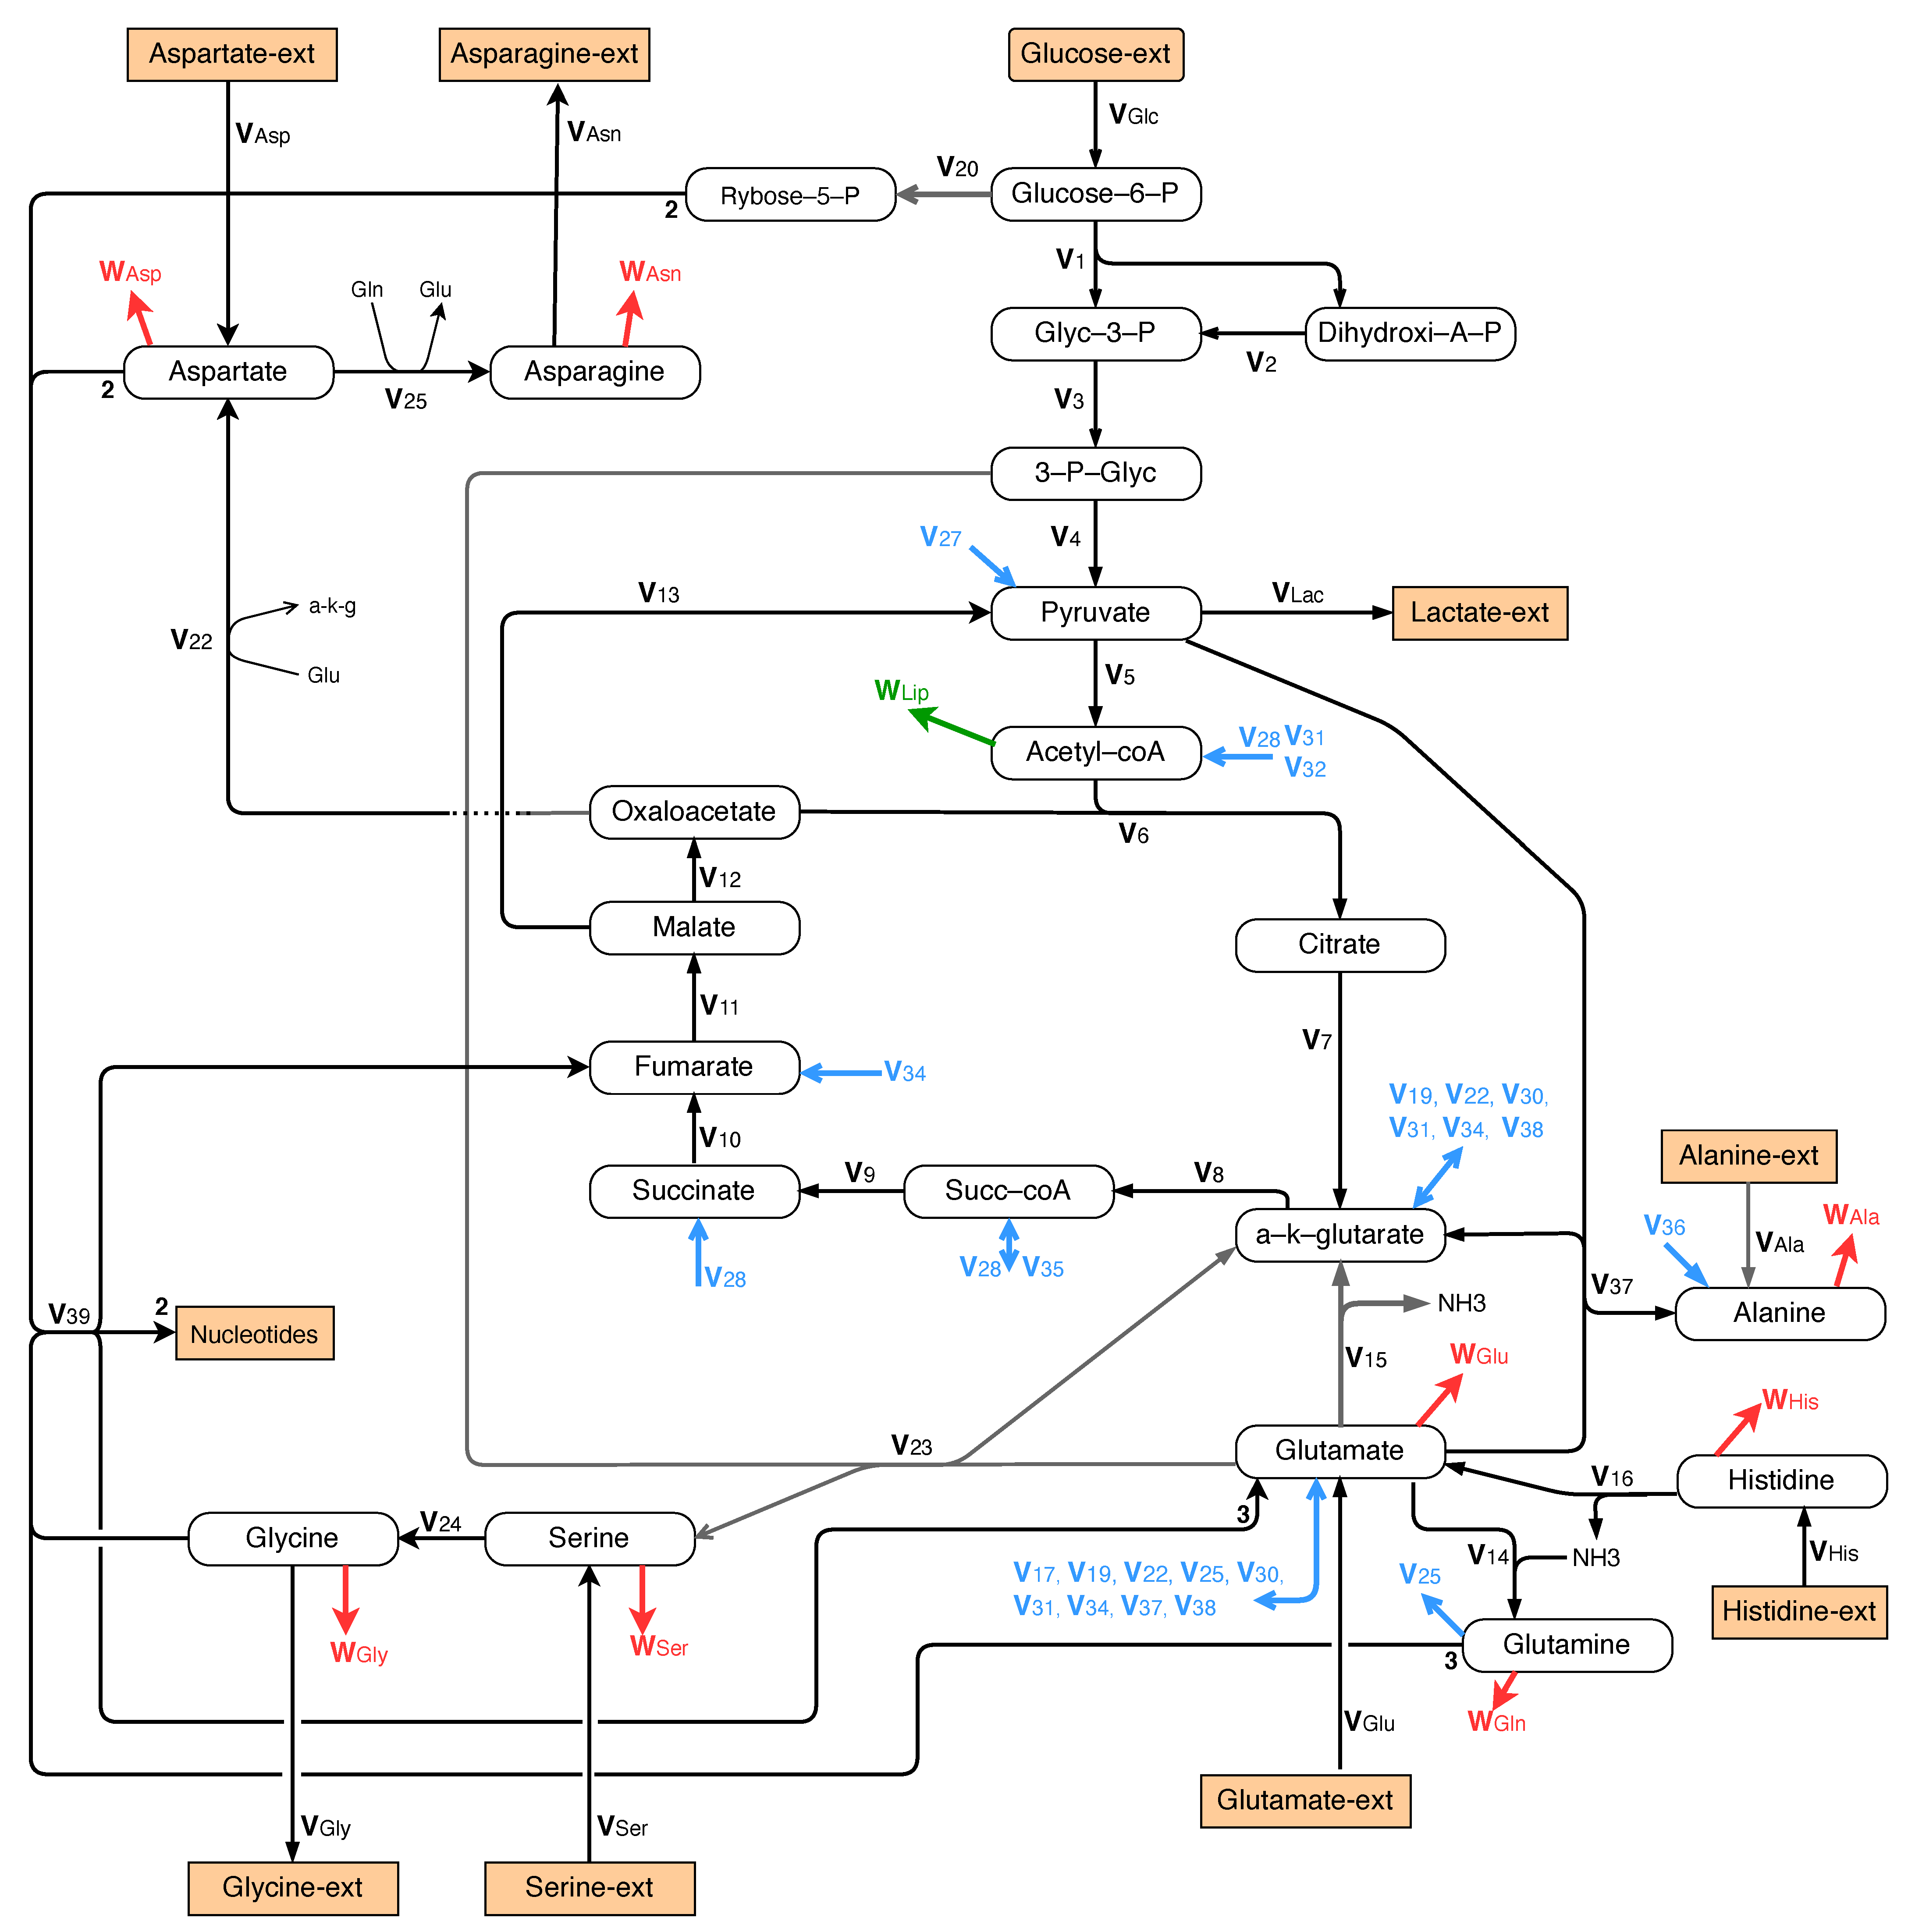
As explained in Section 1, we now consider a case where there is no glutamine in the culture medium while glucose is in excess and not limiting. Glutamate (and aspartate to a lesser extent) become the main nitrogen sources. Obviously, in that case, glutamine must be synthesized inside the cells. The central metabolism is therefore slightly modified as represented in Figure 8 with a pathway for the synthesis of glutamine from glutamate.
Moreover, as shown in Figure 8, the pathway to nucleotide synthesis is assumed to be identical to that of exponential growth (see Section 3.1.3).
4.1.2. Synthesis of Proteins
In this phase of growth without glutamine, histidine turns out to be the essential amino acid with the lowest ratio between its external uptake rate (from Table 3) and its frequency in protein composition (from Table 5). If we assume (as in the previous section) that the cell growth is maximized and that histidine is exclusively used for protein formation, then the total protein production rate can be estimated as
where the values of and are taken from Table 3 and Table 5, respectively. We can then compute the contribution of each amino acid to the production rate of proteins. The result is given in Table 5.
From the available experimental data, the assumption of cell growth maximization could however be questionable when glutamine is depleted. The reason is that, as it can be seen in Figure 4, the net uptake rate of essential amino acids is similar in magnitude to the exponential growth while the specific cell growth rate is much smaller. An alternative natural assumption is to suppose that the rate of protein production is proportional to the rate of cell growth. Under this assumption, we have another manner to compute a plausible estimate of the protein production rate, as follows:
In Equations (5) and (6), the subscripts ‘wg’ and ‘eg’ refer to the growth without glutamine and to the exponential growth, respectively. The values of the growth rates and are taken from Table 1.
It is remarkable that these two estimations of the protein production rate are almost equal, although they are obtained under totally different assumptions. In our viewpoint, this certainly gives a strong consistency to the validity of our experimental data and to the relevance of the assumption of growth maximization, which appears to be very plausible, not only for the exponential growth with non-limiting glucose and glutamine resources, but also in the case of growth with glutamine limitation. It will be seen, in the next section, that the situation is very different for the culture without glucose.
4.1.3. Metabolism of Amino Acids
For the catabolism of essential amino acids, we adopt the same standard catabolic reactions represented in Figure 6 and Figure 7.
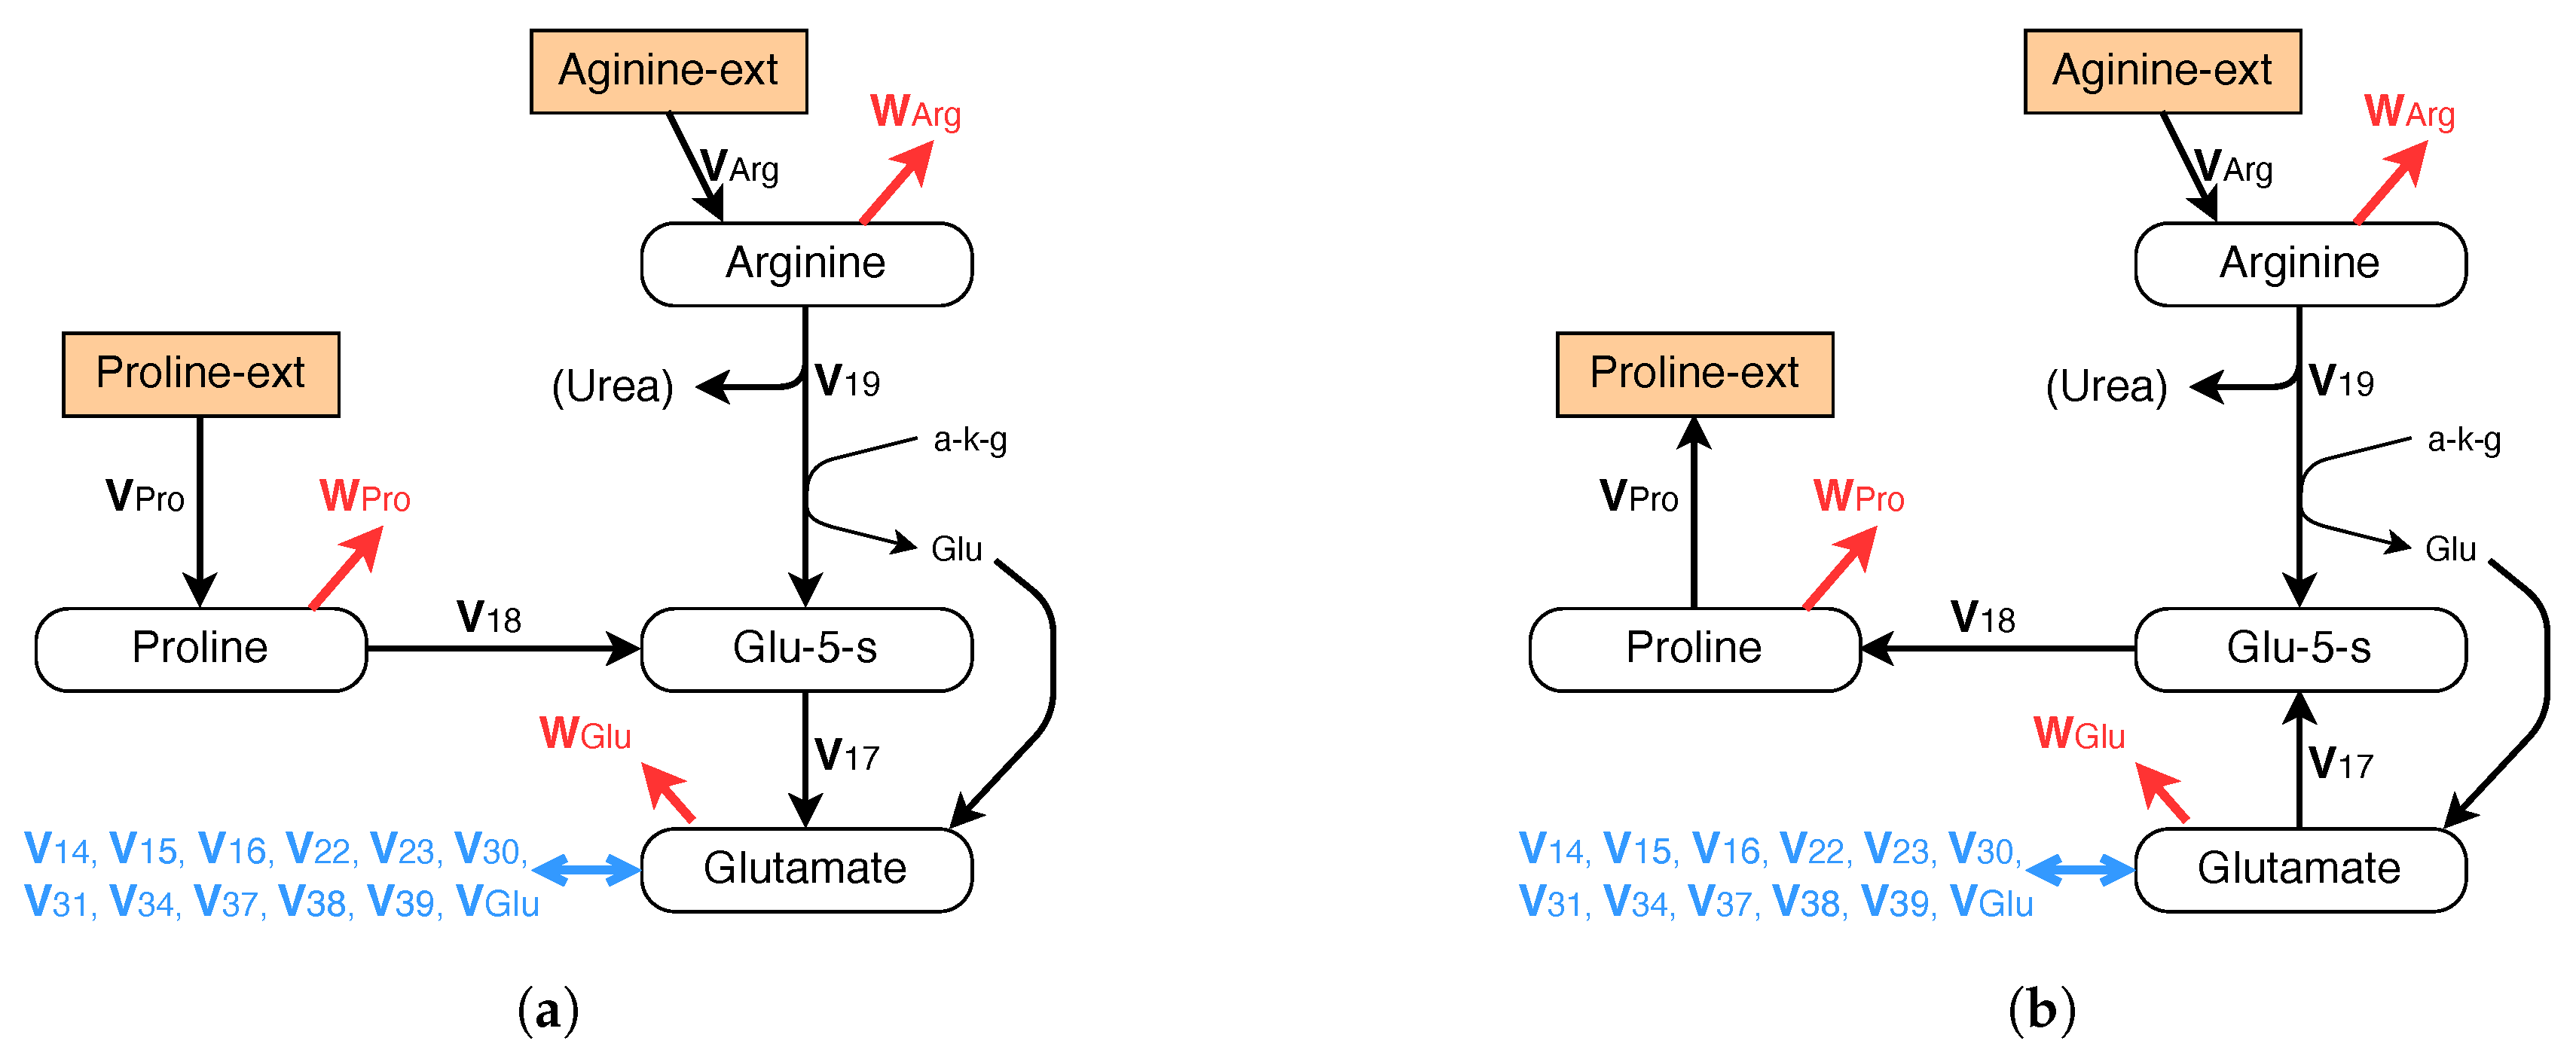
Moreover anabolic pathways must be provided for glycine and proline, which are excreted into the extracellular medium under the current conditions (see Table 2). The metabolic pathways are given in Figure 7b for proline and in Figure 8 for glycine. Note that the difference between Figure 7a,b lies in the inversion of fluxes , and .
Finally, catabolic pathways are used for aspartate, cysteine, serine, and tyrosine because the uptake rate from the culture medium is larger than their contribution to the flux in protein production given in Table 5. The metabolism of these amino acids is represented in Figure 6 for cysteine and tyrosine, and in Figure 8 for aspartate and serine.
4.2. Metabolic Flux Analysis
In this case of growth without glutamine, the metabolic fluxes satisfy the following set of balance equations.
| Internal Metabolite | Flux Balance Equation |
| Glucose-6-P | = 8.933 |
| Glyceraldehyde-3-P | |
| Dihydroxyacetone P | |
| 3-Phosphoglycerate | |
| Pyruvate | = 8.818 |
| Acetyl-CoA | |
| Citrate | |
| -ketoglutarate | |
| Succinyl-CoA | |
| Succinate | |
| Fumarate | |
| Malate | |
| Oxaloacetate | |
| Glutamate-5-semialdehyde | |
| -ketobutyrate | |
| Propionyl-CoA | |
| -ketoadipate | |
| Acetoacetate | |
| Ribose-5-P | |
| Arginine | = 0.086 |
| Aspartate | = 0.234 |
| Asparagine | = 0.081 |
| Cysteine | = 0.022 |
| Glutamate | = −0.388 |
| Glutamine | = 0.079 |
| Glycine | = 0.160 |
| Histidine | = 0.0 |
| Methionine | = 0.062 |
| Phenylalanine | = 0.021 |
| Proline | = 0.567 |
| Serine | = 0.050 |
| Tyrosine | = 0.006 |
| Valine | = 0.024 |
| Isoleucine | = 0.018 |
| Leucine | = 0.043 |
| Lysine | = 0.064 |
| Tryptophan | = 0.016 |
| Alanine | = 0.092 |
| NH3 | = 0.195 |
Under conditions (3) and (4), this system of linear equations is determined and has the following solution.
| = = 8.881 | = 0.741 | = 0.136 | = 0.021 |
| = 17.762 | = 0.544 | = 0.186 | = 0.027 |
| = 17.626 | = 0.655 | = 0.545 | = 0.104 |
| = 9.557 | = 0.0 | = 0.062 | = 0.016 |
| = = 8.478 | = 0.481 | = 0.084 | = 0.076 |
| = 9.426 | = 0.567 | = 0.110 | = 0.064 |
| = 9.420 | = 0.086 | = 0.062 | = 0.026 |
| = 9.530 | = 0.052 | = 0.024 | |
| = 9.583 | = 0.040 | = 0.018 | = 0.465 |
| = 8.842 | = 0.363 | = 0.043 | = 1.36 |
We can conclude, as above, that the flux balance analysis based on the considered metabolic network allows computing the entire intracellular flux distribution from the measured extracellular uptake and excretion rates of Table 2, Table 3 and Table 4.
In this case, closing the overall flux balance requires that the non-essential amino acids that are significantly excreted be asparagine (0.47 M/d × 10 cells) and proline (0.47 M/d × 10 cells).
5. Metabolic Flux Analysis for the Growth without Glucose and Glutamine
5.1. Metabolic Network
5.1.1. Central Metabolism and Nucleotide Synthesis
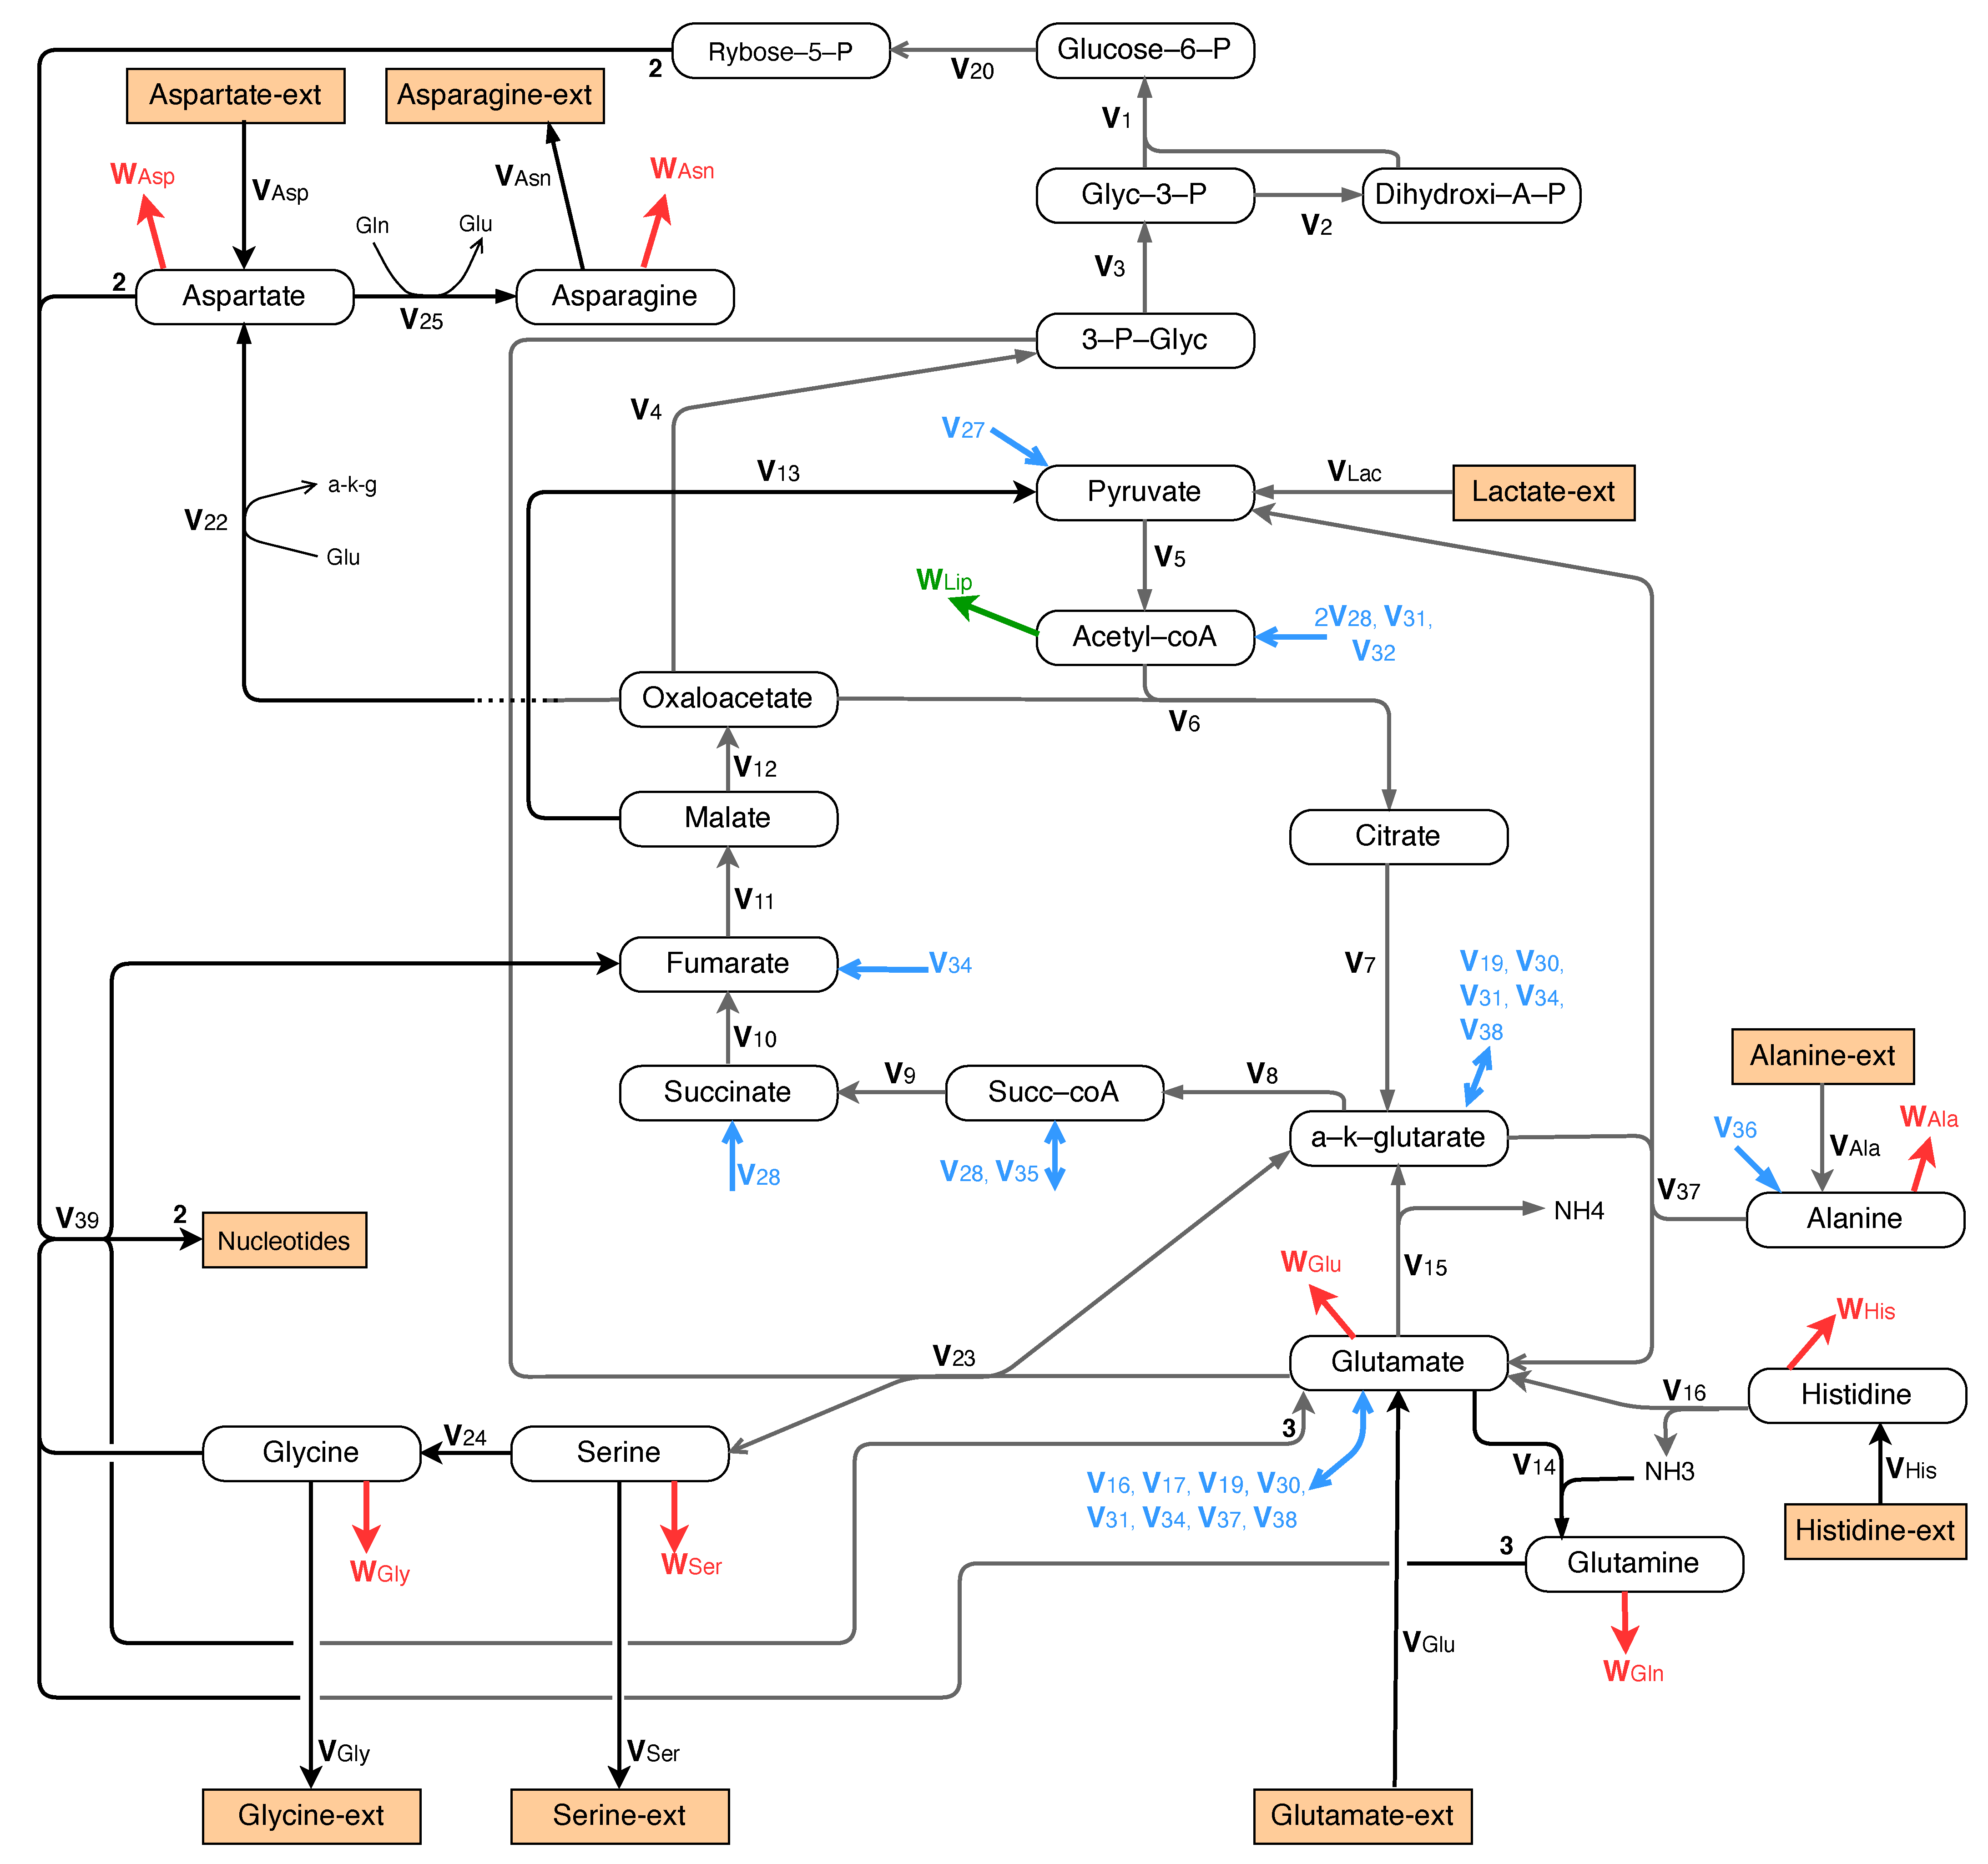
We now consider the case where there is neither glucose nor glutamine in the culture, and where lactate, glutamate, and alanine are the main carbon and nitrogen sources for the central metabolism. This is represented by a metabolic network, shown in Figure 9, which involves a gluconeogenesis pathway for the synthesis of glucose-6-phosphate and a pathway for the synthesis of glutamine from alanine and glutamate. Moreover, the nucleotide synthesis pathway remains unchanged.
5.1.2. Synthesis of Proteins
In this phase of growth without glucose and glutamine, histidine is the essential amino acid with the lowest ratio between its external uptake rate (from Table 3) and its frequency in protein composition (from Table 5). From the assumption that the protein production rate is proportional to the cell growth rate, it appears however that maximization of cell growth is not applicable. Indeed, using equations of the form (5) and (6), we have here:
In Equation (7), the subscript ‘wgg’ refers to growth without glucose and glutamine. It follows clearly from (7) and (8) that the actual protein production rate must be much smaller than the maximal rate that could be reached from the measured amino acid uptakes. Hence, the contributions of the amino acids are computed, in Table 5, by using the value = 0.41 from Equation (7).
5.1.3. Metabolism of Amino Acids
For the catabolism of essential amino acids, we adopt the same standard catabolic reactions represented in Figure 6 and Figure 7.
Moreover, anabolic pathways are provided for glycine, serine, and proline, which are excreted into the extracellular medium under the current conditions (see Table 2). The metabolic pathways for glycine and serine are given in Figure 9. The metabolism of proline is represented in Figure 7b.
Furthermore, catabolic pathways are used for aspartate, cysteine, and tyrosine, because the uptake rate from the culture medium is larger that their contribution to the flux in protein production. The metabolism of these amino acids is represented in Figure 9 for aspartate and in Figure 6 for cysteine and tyrosine.
5.2. Metabolic Flux Analysis
In this case of growth without glucose and without glutamine, the metabolic fluxes satisfy the following set of balance equations.
| Internal Metabolite | Flux Balance Equation |
| Glucose-6-P | |
| Glyceraldehyde-3-P | |
| Dihydroxyacetone P | |
| 3-Phosphoglycerate | |
| Pyruvate | = 10.218 |
| Acetyl-coA | |
| Citrate | |
| -ketoglutarate | |
| Succinyl-CoA | |
| Succinate | |
| Fumarate | |
| Malate | |
| Oxaloacetate | |
| Glutamate-5-semialdehyde | |
| -ketobutyrate | |
| Propionyl-CoA | |
| -ketoadipate | |
| Acetoacetate | |
| Ribose-5-P | |
| Arginine | = 0.180 |
| Asparagine | = 0.018 |
| Aspartate | = 0.353 |
| Cysteine | = 0.067 |
| Glutamate | = 0.534 |
| Glutamine | = 0.017 |
| Glycine | = 0.052 |
| Histidine | = 0.041 |
| Methionine | = 0.104 |
| Phenylalanine | = 0.086 |
| Proline | = 0.879 |
| Serine | = 0.653 |
| Tyrosine | = 0.058 |
| Valine | = 0.137 |
| Isoleucine | = 0.152 |
| Leucine | = 0.425 |
| Lysine | = 0.192 |
| Tryptophan | = 0.037 |
| Alanine | = 0.669 |
| NH3 | = 1.089 |
Under conditions (3) and (4), this system of equations is determined and has the following solution.
| = = 0.012 | = 0.567 | = 0.711 | = 0.086 |
| = 0.024 | = 0.874 | = 0.058 | = 0.144 |
| = 0.735 | = 1.751 | = 0.839 | = 0.393 |
| = 11.662 | = 0.041 | = 0.104 | = 0.037 |
| = = 13.306 | = 0.699 | = 0.171 | = 0.706 |
| = 14.563 | = 0.879 | = 0.684 | = 0.192 |
| = 14.272 | = 0.180 | = 0.104 | = 0.006 |
| = 17.956 | = 0.012 | = 0.137 | |
| = 15.106 | = 0.114 | = 0.152 | = 0.821 |
| = 14.539 | = 0.498 | = 0.425 | = 0.3 |
Here, the excreted amino acids are proline (0.86 M/d × 10 cells), asparagine (0.82 M/d × 10 cells), and serine (0.62 M/d × 10 cells).
6. Final Remarks and Conclusions
In this paper, we applied metabolic flux analysis to investigate the behavior of VERO cells in three different culture conditions.
As long as glucose is not limiting, this analysis supports the validity of a maximum growth hypothesis in which the amino acids are primarily used as building blocks for the formation of the biomass, even in case of glutamine deprivation. In the latter case, glutamine is replaced by glutamate as the nitrogen source and it can be observed that the biomass yield is even slightly higher (while the productivity is lower).
When glucose is exhausted, the cell growth does not stop, but continues at a smaller rate with the consumption of lactate as an alternative source of carbon, while using only a small part (about 20%) of available amino acids for biomass synthesis. As represented in the network of Figure 9, lactate is reintroduced into the cell, transformed into pyruvate, and integrated in the TCA cycle in order to provide a part of the required energy, which is no longer given by glycolysis. The rest of the energy is provided by the degradation of that part of amino acids, which are not used as building blocks for the biomass synthesis.
This analysis provides a metabolic foundation for the design of feedback control strategies in fed batch or perfusion bioreactors where the lactate concentration is measured online and regulated by controlling the delivery rates of glucose and, possibly, of some essential amino acids. Applications of such control strategies to CHO cells are discussed, e.g., in [23,24], while, to our knowledge, applications to VERO cell cultures have not been reported in the literature.
Let us finally mention that, in our metabolic analysis, one amino acid, namely threonine, was omitted from the model because experimental measurements are (unfortunately) missing. Obviously, this is equivalent to implicitly assume that, in the considered experiments, threonine, which is an essential amino acid, is consumed at the rate required for protein synthesis as given in Table 5. We can however confirm that this assumption is quite plausible on the basis of threonine data, which were obtained for the same cell line grown in similar conditions, but with a slightly different fetal serum (bovine instead of calf), as reported in [20], Chapter 3. This means that including threonine catabolism in the model, if actual data were available, should not significantly alter our results.
Author Contributions
Conceptualization, G.B., V.C. and A.V.W.; methodology, G.B., V.C. and A.V.W.; data curation and visualization, G.B. and V.C.; software, G.B.; investigation, G.B., V.C. and A.V.W.; writing—original draft preparation, G.B.; writing—review and editing, G.B. and A.V.W. All authors have read and agreed to the published version of the manuscript.
Funding
This research received no external funding.
Data Availability Statement
All the data used in this study are available in the graphs and tables of this article.
Conflicts of Interest
The authors declare no conflict of interest.
References
- Antoniewicz, M.R. Methods and advances in metabolic flux analysis: A mini-review. J. Ind. Microbiol. Biotechnol. 2015, 42, 317–325. [Google Scholar] [CrossRef] [PubMed]
- Bonarius, H.P.J.; Hatzimanikatis, V.; Meesters, K.P.H.; de Gooijer, C.D.; Schmid, G.; Tramper, J. Metabolic flux analysis of hybridoma cells in different culture media using mass balances. Biotechnol. Bioeng. 1996, 50, 299–318. [Google Scholar] [CrossRef]
- Quek, L.E.; Dietmair, S.; Krömer, J.O.; Nielsen, L.K. Metabolic flux analysis in mammalian cell culture. Metab. Eng. 2010, 12, 161–171. [Google Scholar] [CrossRef] [PubMed]
- Zamorano, F.; Wouwer, A.V.; Bastin, G. A detailed metabolic flux analysis of an underdetermined network of CHO cells. J. Biotechnol. 2010, 150, 497–508. [Google Scholar] [CrossRef] [PubMed]
- Niklas, J.; Heinzle, E. Metabolic flux analysis in systems biology of mammalian cells. Adv. Biochem. Eng. Biotechnol. 2011, 127, 109–132. [Google Scholar]
- Fernandes de Sousa, S.; Bastin, G.; Jolicoeur, M.; Vande Wouwer, A. Dynamic metabolic flux analysis using a convex analysis approach: Application to hybridoma cell cultures in perfusion. Biotechnol. Bioeng. 2016, 113, 1102–1112. [Google Scholar] [CrossRef] [PubMed]
- Hagrot, E.; Oddsdóttird, H.Æ.; Mäkinena, M.; Forsgrend, A.; Chotteau, V. Novel column generation-based optimization approach for poly-pathway kinetic model applied to CHO cell culture. Metab. Eng. Commun. 2018, 8, e00083. [Google Scholar] [CrossRef]
- Chen, Y.; McConnell, B.O.; Dhara, V.G.; Naik, H.M.; Li, C.T.; Antoniewicz, M.R.; Betenbaugh, M.J. An unconventional uptake rate objective function approach enhances applicability of genome-scale models for mammalian cells. Npj Syst. Biol. Appl. 2019, 5, 25. [Google Scholar] [CrossRef] [PubMed]
- Petiot, E.; Guedon, E.; Blanchard, F.; Gény, C.; Pinton, H.; Marc, A. Kinetic characterization of Vero cell metabolism in a serum-free batch culture process. Biotechnol. Bioeng. 2010, 107, 143–153. [Google Scholar] [CrossRef] [PubMed]
- Montagnon, B.; Fanget, B.; Vincent-Falquet, J. Industrial-scale production of inactivated poliovirus vaccine prepared by culture of Vero cells on microcarrier. Rev. Infect. Dis. 1984, 6, S341–S344. [Google Scholar] [CrossRef] [PubMed]
- Srivastava, A.K.; Putnak, J.R.; Lee, S.H.; Hong, S.P.; Moon, S.B.; Barvir, D.A.; Zhao, B.; Olson, R.A.; Kim, S.O.; Yoo, W.D.; et al. A purified inactivated Japanese encephalitis virus vaccine made in Vero cells. Vaccine 2001, 19, 4557–4565. [Google Scholar] [CrossRef]
- Trabelsi, K.; Rourou, S.; Loukil, H.; Majoul, S.; Kallel, H. Optimization of virus yield as a strategy to improve rabies vaccine production by Vero cells in a bioreactor. J. Biotechnol. 2006, 121, 261–271. [Google Scholar] [CrossRef]
- Paillet, C.; Forno, G.; Kratje, R.; Etcheverrigaray, M. Suspension-Vero cell cultures as a platform for viral vaccine production. Vaccine 2009, 27, 6464–6467. [Google Scholar] [CrossRef] [PubMed]
- Montomoli, E.; Khadang, B.; Piccirella, S.; Trombetta, C.; Mennitto, E.; Manini, I.; Stanzani, V.; Lapini, G. Cell culture-derived influenza vaccines from Vero cells: A new horizon for vaccine production. Expert Rev. Vaccines 2012, 11, 587–594. [Google Scholar] [CrossRef] [PubMed]
- Orr-Burks, N.; Murray, J.; Wu, W.; Kirkwood, C.D.; Todd, K.V.; Jones, L.; Bakre, A.; Wang, H.; Jiang, B.; Tripp, R.A. Gene-edited vero cells as rotavirus vaccine substrates. Vaccine X 2019, 3, 100045. [Google Scholar] [CrossRef] [PubMed]
- Pato, T.P.; Souza, M.C.; Mattos, D.A.; Caride, E.; Ferreira, D.F.; Gaspar, L.P.; Freire, M.S.; Castilho, L.R. Purification of yellow fever virus produced in Vero cells for inactivated vaccine manufacture. Vaccine 2019, 37, 3214–3220. [Google Scholar] [CrossRef] [PubMed]
- Rourou, S.; Zakkour, M.B.; Kallel, H. Adaptation of Vero cells to suspension growth for rabies virus production in different serum free media. Vaccine 2019, 37, 6987–6995. [Google Scholar] [CrossRef] [PubMed]
- Kiesslich, S.; Losa, J.P.V.C.; Gélinas, J.F.; Kamen, A.A. Serum-free production of rVSV-ZEBOV in Vero cells: Microcarrier bioreactor versus scale-X™ hydro fixed-bed. J. Biotechnol. 2020, 310, 32–39. [Google Scholar] [CrossRef] [PubMed]
- Palsson, B.Ø. Systems Biology: Simulation of Dynamic Network States; Cambridge University Press: Cambridge, UK, 2011. [Google Scholar]
- Chotteau, V. A General Modelling Methodology for Animal Cell Cultures. Ph.D. Thesis, Faculty of Engineering, Louvain University, Louvain-la-Neuve, Belgium, 1995. [Google Scholar]
- Gross, L.J. Observed Frequency of Amino Acids in Vertebrates. 1999. Available online: http://www.tiem.utk.edu/~gross/bioed/webmodules/aminoacid.htm (accessed on 14 November 2021).
- Provost, A. Metabolic Design of Dynamic Bioreaction Models. Ph.D. Thesis, Faculty of Engineering, Louvain University, Louvain-la-Neuve, Belgium, 2006. [Google Scholar]
- Gagnon, M.; Hiller, G.; Luan, Y.T.; Kittredge, A.; DeFelice, J.; Drapeau, D. High-end pH-controlled delivery of glucose effectively suppresses lactate accumulation in CHO fed-batch cultures. Biotechnol. Bioeng. 2011, 108, 1328–1337. [Google Scholar] [CrossRef] [PubMed]
- Hartley, F.; Walker, T.; Chung, V.; Morten, K. Mechanisms driving the lactate switch in Chinese hamster ovary cells. Biotechnol. Bioeng. 2018, 115, 1890–1903. [Google Scholar] [CrossRef] [PubMed]
Figure 1.
Time evolution of cell density in cultures a1 (left) and a2 (right).

Figure 2.
Time evolution of substrates and products of the central metabolism in cultures a1 and a2.
Figure 2.
Time evolution of substrates and products of the central metabolism in cultures a1 and a2.

Figure 3.
Time evolution of non-essential amino acids in cultures a1 and a2.

Figure 4.
Time evolution of essential amino acids in cultures a1 and a2.

Figure 5.
Exponential growth: central metabolism involving glycolysis, TCA, and glutaminolysis, nucleotide synthesis, and metabolism of alanine, asparagine, aspartate, histidine, glycine, and serine.
Figure 5.
Exponential growth: central metabolism involving glycolysis, TCA, and glutaminolysis, nucleotide synthesis, and metabolism of alanine, asparagine, aspartate, histidine, glycine, and serine.

Figure 6.
Metabolic network for seven essential amino acids (isoleucine, leucine, lysine, methionine, phenylalanine, tryptophan, valine) and two non-essential amino acids (cysteine, tyrosine).
Figure 6.
Metabolic network for seven essential amino acids (isoleucine, leucine, lysine, methionine, phenylalanine, tryptophan, valine) and two non-essential amino acids (cysteine, tyrosine).

Figure 7.
Metabolic network for arginine (essential) and proline (non-essential). (a) Exponential growth; (b) growth without glutamine.
Figure 7.
Metabolic network for arginine (essential) and proline (non-essential). (a) Exponential growth; (b) growth without glutamine.

Figure 8.
Growth without glutamine: central metabolism involving glycolysis, TCA and glutamine synthesis, nucleotide synthesis and metabolism of alanine, asparagine, aspartate, histidine, glycine, and serine.
Figure 8.
Growth without glutamine: central metabolism involving glycolysis, TCA and glutamine synthesis, nucleotide synthesis and metabolism of alanine, asparagine, aspartate, histidine, glycine, and serine.

Figure 9.
Growth without glucose and glutamine: central metabolism involving glyconeogenesis, TCA, and glutamine synthesis, nucleotide synthesis and metabolism of alanine, asparagine, aspartate, histidine, glycine, and serine.
Figure 9.
Growth without glucose and glutamine: central metabolism involving glyconeogenesis, TCA, and glutamine synthesis, nucleotide synthesis and metabolism of alanine, asparagine, aspartate, histidine, glycine, and serine.


Table 1.
Three different culture conditions.
| Culture Conditions | Carbon Source | Nitrogen Source | |
|---|---|---|---|
| Exponential growth | Glucose | Glutamine | 0.6 day |
| Growth without Gln | Glucose | Glutamate | 0.18 day |
| Growth without Glc and Gln | Lactate | Glutamate, Alanine | 0.04 day |
Table 2.
Specific uptake rates (M/d × 10 cell) Glucose, Lactate and non-essential AA.
| Species | Exponential Growth | Growth without Gln | Growth without Glc & Gln | |
|---|---|---|---|---|
| Glucose | 42.308 | 8.933 | 0.0 | |
| Lactate | ––––– | ––––– | 10.218 | |
| Glutamine | 4.994 | 0.0 | 0.0 | |
| Alanine | ––––– | 0.058 | 0.702 | |
| Aspartate | 0.338 | 0.337 | 0.376 | |
| Cysteine | 0.264 | 0.068 | 0.077 | |
| Glutamate | ––––– | 0.499 | 0.558 | |
| Glycine | 0.325 | ––––– | ––––– | |
| Proline | 0.565 | ––––– | ––––– | |
| Serine | 0.231 | 0.182 | ––––– | |
| Tyrosine | 0.205 | 0.063 | 0.071 |
Table 3.
Specific uptake rates (M/d × 10 cell) for essential AA.
| Species | Exponential Growth | Growth without Gln | Growth without Glc & Gln | |
|---|---|---|---|---|
| Arginine | 0.949 | 0.179 | 0.200 | |
| Histidine | 0.195 | 0.045 | 0.051 | |
| Isoleucine | 0.428 | 0.105 | 0.171 | |
| Leucine | 0.821 | 0.200 | 0.459 | |
| Lysine | 0.484 | 0.199 | 0.222 | |
| Methionine | 0.244 | 0.100 | 0.112 | |
| Phenylalanine | 0.228 | 0.091 | 0.101 | |
| Tryptophan | 0.091 | 0.037 | 0.042 | |
| Valine | 0.499 | 0.146 | 0.164 |
Table 4.
Specific excretion rates (M/d × 10 cell) Lactate, NH3 and non-essential AA.
| Species | Exponential Growth | Growth without Gln | Growth without Glc & Gln | |
|---|---|---|---|---|
| Lactate | 63.770 | 8.818 | ––––– | |
| NH3 | 5.316 | 0.195 | 1.089 | |
| Alanine | 0.513 | ––––– | ––––– | |
| Glutamate | 0.659 | ––––– | ––––– | |
| Glycine | ––––– | 0.019 | 0.021 | |
| Proline | ––––– | 0.474 | 0.859 | |
| Serine | ––––– | ––––– | 0.624 |
Table 5.
Specific consumption rates of amino acids (AA) for protein production [M/d × 10 cell]. (Essential AA are in bold).
Table 5.
Specific consumption rates of amino acids (AA) for protein production [M/d × 10 cell]. (Essential AA are in bold).
| Amino Acid (AA) | Frequency f (%) | Exponential Growth | Growth without Gln | Growth without Glc & Gln | |
|---|---|---|---|---|---|
| Alanine | 8.0 | 0.493 | 0.150 | 0.033 | |
| Arginine | 5.0 | 0.306 | 0.093 | 0.020 | |
| Asparagine | 4.3 | 0.266 | 0.081 | 0.018 | |
| Aspartate | 5.5 | 0.339 | 0.103 | 0.023 | |
| Cysteine | 2.5 | 0.151 | 0.046 | 0.010 | |
| Glutamine | 4.2 | 0.260 | 0.079 | 0.017 | |
| Glutamate | 5.9 | 0.366 | 0.111 | 0.024 | |
| Glycine | 7.5 | 0.464 | 0.141 | 0.031 | |
| Histidine | 2.4 | 0.150 | 0.045 | 0.010 | |
| Isoleucine | 4.6 | 0.286 | 0.087 | 0.019 | |
| Leucine | 8.4 | 0.515 | 0.157 | 0.034 | |
| Lysine | 7.2 | 0.443 | 0.135 | 0.030 | |
| Methionine | 2.0 | 0.126 | 0.038 | 0.008 | |
| Phenylalanine | 3.7 | 0.228 | 0.070 | 0.015 | |
| Proline | 4.9 | 0.305 | 0.093 | 0.020 | |
| Serine | 7.1 | 0.435 | 0.132 | 0.029 | |
| Threonine | 5.9 | 0.366 | 0.111 | 0.024 | |
| Tryptophan | 1.1 | 0.069 | 0.021 | 0.005 | |
| Tyrosine | 3.1 | 0.189 | 0.057 | 0.013 | |
| Valine | 6.5 | 0.402 | 0.122 | 0.027 | |
| 6.159 | 1.874 | 0.411 |
Publisher’s Note: MDPI stays neutral with regard to jurisdictional claims in published maps and institutional affiliations. |
© 2021 by the authors. Licensee MDPI, Basel, Switzerland. This article is an open access article distributed under the terms and conditions of the Creative Commons Attribution (CC BY) license (https://creativecommons.org/licenses/by/4.0/).
Share and Cite
MDPI and ACS Style
Bastin, G.; Chotteau, V.; Vande Wouwer, A. Metabolic Flux Analysis of VERO Cells under Various Culture Conditions. Processes 2021, 9, 2097. https://0-doi-org.brum.beds.ac.uk/10.3390/pr9122097
AMA Style
Bastin G, Chotteau V, Vande Wouwer A. Metabolic Flux Analysis of VERO Cells under Various Culture Conditions. Processes. 2021; 9(12):2097. https://0-doi-org.brum.beds.ac.uk/10.3390/pr9122097
Chicago/Turabian StyleBastin, Georges, Véronique Chotteau, and Alain Vande Wouwer. 2021. "Metabolic Flux Analysis of VERO Cells under Various Culture Conditions" Processes 9, no. 12: 2097. https://0-doi-org.brum.beds.ac.uk/10.3390/pr9122097
Note that from the first issue of 2016, this journal uses article numbers instead of page numbers. See further details here.