Article

Cyclodextrin Dispersion of Mebendazole and Flubendazole Improves In Vitro Antiproliferative Activity

1
Faculty of Pharmacy, Victor Babeş University of Medicine and Pharmacy Timişoara, 2 Eftimie Murgu Street, 300041 Timişoara, Romania
2
Faculty of Medicine, Victor Babeş University of Medicine and Pharmacy Timişoara, 2 Eftimie Murgu Street, 300041 Timişoara, Romania
*
Authors to whom correspondence should be addressed.
These authors have contributed equally to this work.
Submission received: 4 November 2021 / Revised: 27 November 2021 / Accepted: 29 November 2021 / Published: 3 December 2021
(This article belongs to the Section Pharmaceutical Processes)

Abstract

:
Mebendazole and flubendazole are antihelmintic drugs that have re-entered the research spotlight due to their exhibited anticancer effects, thus making them strong candidates as repurposed drugs. However, these benzimidazole derivatives exhibit poor solubility in water and various organic solvents, which limits their bioavailability. With the aim of obtaining an improved drug solubility and increased biological effect, mebendazole and flubendazole were complexed with 2-hydroxypropyl-β-cyclodextrin (HPBCD). The binary 1:1 conjugates were physicochemically evaluated by X-ray diffraction, thermal analysis, and FTIR spectroscopy, revealing the formation of physical mixtures. The increased aqueous solubility of the binary 1:1 conjugates vs. pure benzimidazole compounds was demonstrated by performing dissolution tests. The in vitro antiproliferative activity of mebendazole and flubendazole, as well as their combination with HPBCD, was tested on two cancer cell lines, human melanoma—A375 and pulmonary adenocarcinoma—A549 by the MTT assay. The cytotoxic activity manifested in a dose-dependent manner while the presence of HPBCD increased the antiproliferative activity against the targeted cells. Treatment of A375 and A549 cell lines with the binary conjugates induced a significant inhibition of mitochondrial respiration, as revealed by high-resolution respirometry studies. Molecular docking analysis showed that one of the mechanisms related to MEB and FLU cytotoxic activity may be due to the inhibition of MEK/ERK proteins.

1. Introduction

Mebendazole (methyl (5-benzoyl-1H-benzimidazol-2-yl) carbamate) (MEB) and flubendazole (methyl N-[6-(4-fluorobenzoyl)-1H-benzimidazol-2-yl] carbamate) (FLU) (Figure 1) are typical benzimidazole compounds used as broad-spectrum antihelmintic drugs for over 40 years, in both veterinary and human medicine [1]. MEB is designated an essential intestinal antihelminthic by WHO. They bind to β-tubulin and act as a tubulin polymerase inhibitor [2]. As a result, the drugs impede the parasytes’ glucose uptake, mobility, and egg production, finally resulting in death. Although mainly used against gastrointestinal parasitic infections in animals, FLU may be administered parenterally with high macrofilaricidal efficacy in humans [1].
Both drugs have re-entered the attention of researchers with the drug repurposing initiative, revealing strong anticancer effects through various molecular mechanisms. MEB exhibits several characteristics that make it a candidate as a repurposed drug, such as low toxicity and price, suitable pharmacokinetic profile, and facile administration [3]. The tubulin polymerase inhibition, initially discovered in parasitic worms, enables the drug to target microtubules in cancer cells, thus inhibiting cell division and inducing apoptosis [4]. Recently, benzimidazole derivatives were identified as autophagy inducers, with most studies validating autophagy as the anticancer mechanism [5]. In addition, the compounds cause cell cycle (G2/M) arrest, act as anti-angiogenic agents, and block the transport of glucose. Moreover, the antiproliferative effect is also manifested on resistant cancer cells and enhances the efficacy of conventional therapy [6]. The anticancer effects were attributed to the regulation of various signaling pathways, such as the canonical Wnt/β-catenin, JAK/STAT-3, JNK, MEK/ERK, and hedgehog signaling pathways [7].
In a review published in 2014, Pantziarka et al. summarized the in vitro and in vivo findings on the anticancer potential of MEB. The drug was found active in vitro in a dose-dependent manner against lung, breast, ovary, colon carcinomas, melanoma, leukemia, and osteosarcoma [8]. Some of the in vitro results were confirmed by in vivo testing, with MEB inhibiting the growth of human melanoma and glioma murine models. Noteworthy is the fact that the drug was inactive in non-malignant cell lines and relatively lacked in vivo side effects. In pancreatic cancer models, MEB decreased dysplasia, slowed cancer progression, and reduced metastasis [9]. In association with radiation, MEB increases the sensitivity of cancer cells to the treatment due to the alteration of the expression of DNA damage response proteins [10]. In addition, MEB induces immunomodulating effects by activating the MEK-ERK pathway, thus being able to fight some autoimmune diseases [11]. In turn, FLU was found to be active against a wide range of carcinomas, such as breast and colorectal carcinoma, melanoma, and leukemia [12]. It efficiently inhibited tumor growth in a mouse xenograft model of breast cancer with favorable toxicology profiles [13].
Benzimidazole derivatives exhibit poor solubility in water and various organic solvents as well as poor oral absorption and bioavailability (1–5%). In addition, although generally safe when used orally for limited periods of time, prolonged administrations may lead to severe side effects, such as hepatotoxicity, allergies, or even myelosuppression [14]. Their low aqueous solubility makes the parenteral administration (e.g., against metastatic cancer) unachievable. Numerous attempts have been made in order to improve their biopharmaceutical and pharmacokinetic profile, such as redispersible microparticles [15], polymer crystals [16] and conjugates [17], soluble derivatives [18], and pro-drugs [19].
An attractive option is the preparation of cyclodextrin complexes, which are capable not only of enabling the water solubilization of benzimidazole derivatives but also of increasing their oral bioavailability as well [20]. The inclusion of MEB in β-cyclodextrin did not interfere with the physical stability of the drug [21]. Among various α, β, and γ-cyclodextrin derivatives investigated as hosts for MEB, the methylated-β-cyclodextrin derivative was highlighted as the most efficient solubilizing agent [22], thus indicating that the size of β-cyclodextrin’s cavity is suitable for accommodating the molecule of the active drug. Similarly, the FLU’s complex with hydroxypropyl-β-cyclodextrin markedly increased its water solubility [23]. The complex was used as a solubilization alternative to DMSO for FLU applied in vivo on the chorioallantoic membrane model, revealing anti-angiogenic and antiproliferative activity against neuroblastoma [24]. Additionally, the pharmacokinetic profile of the drug was significantly affected by its pharmaceutical formulation, the oral absorption pattern being optimized as a result of complexation with hydroxypropyl-β-cyclodextrin [25].
Although some other benzimidazole compounds, such as albendazole and ricobendazole, have been investigated as cyclodextrin complexes in anticancer treatment [26], to the best of our knowledge, the information on the repositioning of this class of drugs as anticancer agents remains scarce. The focus of this current work is to bring new data (evidence) on the possibility of using two well-known antihelmintic drugs, MEB and FLU, as repurposed drugs for anticancer therapy.
Current approaches involving new/repurposed anticancer therapy drug development are geared towards finding suitable molecules that act as targeted inhibitors of key enzymes, involved in functionally important signaling pathways, such as EGF and VEGF, PI3K/AKT/mTOR, MAPK, or apoptosis, all of which play a significant role in carcinogenesis, tumor progression, and metastasis [27,28,29,30].
The current study aimed to prepare binary conjugates of MEB and FLU, respectively, with hydroxypropyl-β-cyclodextrin (HPBCD), in order to improve drug solubility and biological effects. The obtained conjugates were physicochemically assessed and further submitted to biological evaluation.

2. Materials and Methods

2.1. Preparation of Binary Conjugates

The drugs, MEB and FLU, respectively, were mixed with HPBCD in a 1:1 molar ratio using a mortar and pestle; the mixture was treated with an equal amount of 50% ethanolic solution (ethanol:water 1:1 v/v) and kneaded until a viscous paste formed. The product was dried in the oven at 105 °C until constant mass.

2.2. In Vitro Dissolution Studies

In vitro dissolution studies were conducted by the modified paddle method in 100 mL of distilled water. Then, 20 mg samples of pure drugs (MEB or FLU, respectively) or binary cyclodextrin conjugates containing the same amount of the respective drug were added to the dissolution medium and the basket was rotated at 100 rpm. Sampling was performed at 5, 10, 15, 30, 60, 90, and 120 min (sample volume of 5.0 mL). After filtration, the drug content of each sample was determined spectrophotometrically at λ = 289 nm for MEB and λ = 292 nm for FLU.

2.3. X-ray Diffraction

X-ray diffraction was employed to assess the phase composition of conjugates. The method used the Rigaku ULTIMA IV Diffractometer, radiation CuKα with 2θ angles between 5° and 40°, functioning at 40 kV and 40 mA.

2.4. Thermal Analysis

The heating behavior of all samples was assessed by TG-DTG and DSC analysis in the temperature range 25–1000 °C using a Netzsch STA 449C device. The analysis was conducted in aluminum crucibles, under dynamic air atmosphere at a 10 K/min heating rate.

2.5. FTIR Spectrometry

The FTIR spectra were recorded using the Shimadzu Prestige-21 spectrometer between 400 and 4000 cm−1 with 4 cm−1 resolution and the KBr pelletization technique.

2.6. Cell Culture

A375 (ATCC® CRL-1619™)—human melanoma cell lines and A549—pulmonary adenocarcinoma cell line (ATCC® CCL-185™) procured from the American Type Culture Collection (ATCC, Lomianki, Poland) were used to test the effect on cell viability of the two substances and their combination with HPBCD. A375 and A549 were cultured in Dulbecco’s modified Eagle Medium (DMEM) high glucose culture medium—4.5 g/L, supplemented with 10% fetal bovine serum (FBS), to which a mixture of 100 U/mL penicillin and 100 μg antibiotics/mL streptomycin was added. The cells were kept under standard conditions of humidity, temperature (37 °C), and CO2 (5%). The Countess II Automated Cell Counter (Thermo Fisher Scientific, Inc., Waltham, MA, USA) was used to determine the number of cells, using Trypan blue as a color reagent.

2.7. Cell Viability Assessment

To determine cell viability, the MTT (3-(4,5-Dimethylthiazol-2-yl)-2,5-Diphenyltetrazolium Bromide) kit (Roche, Mannheim, Germany) method was used according to the experimental protocol described in our previous studies [31]. Thus, cells, A375 and A549, were cultured in 96-well plates in a number of 1 × 10⁴ cells/well. After reaching a confluence of approximately 90%, they were stimulated with three concentrations (0.1, 0.5, and 1 μM) of FLU and MEB alone, HPBCD, and the combination of these, respectively. After 72 h of stimulation, the test sample medium was removed and was replaced with a volume of 100 μL of fresh medium. Then, 10 µL/well of MTT reagent were added, and the plates were placed in the incubator for 3 h. The next step was to add the buffer solution in a volume of 100 μL/well for 30 min. Finally, viable cells were determined by measuring absorbances at 570 nm using a xMark™ Microplate Spectrophotometer (Bio-Rad Laboratories, Inc., Hercules, CA, USA).

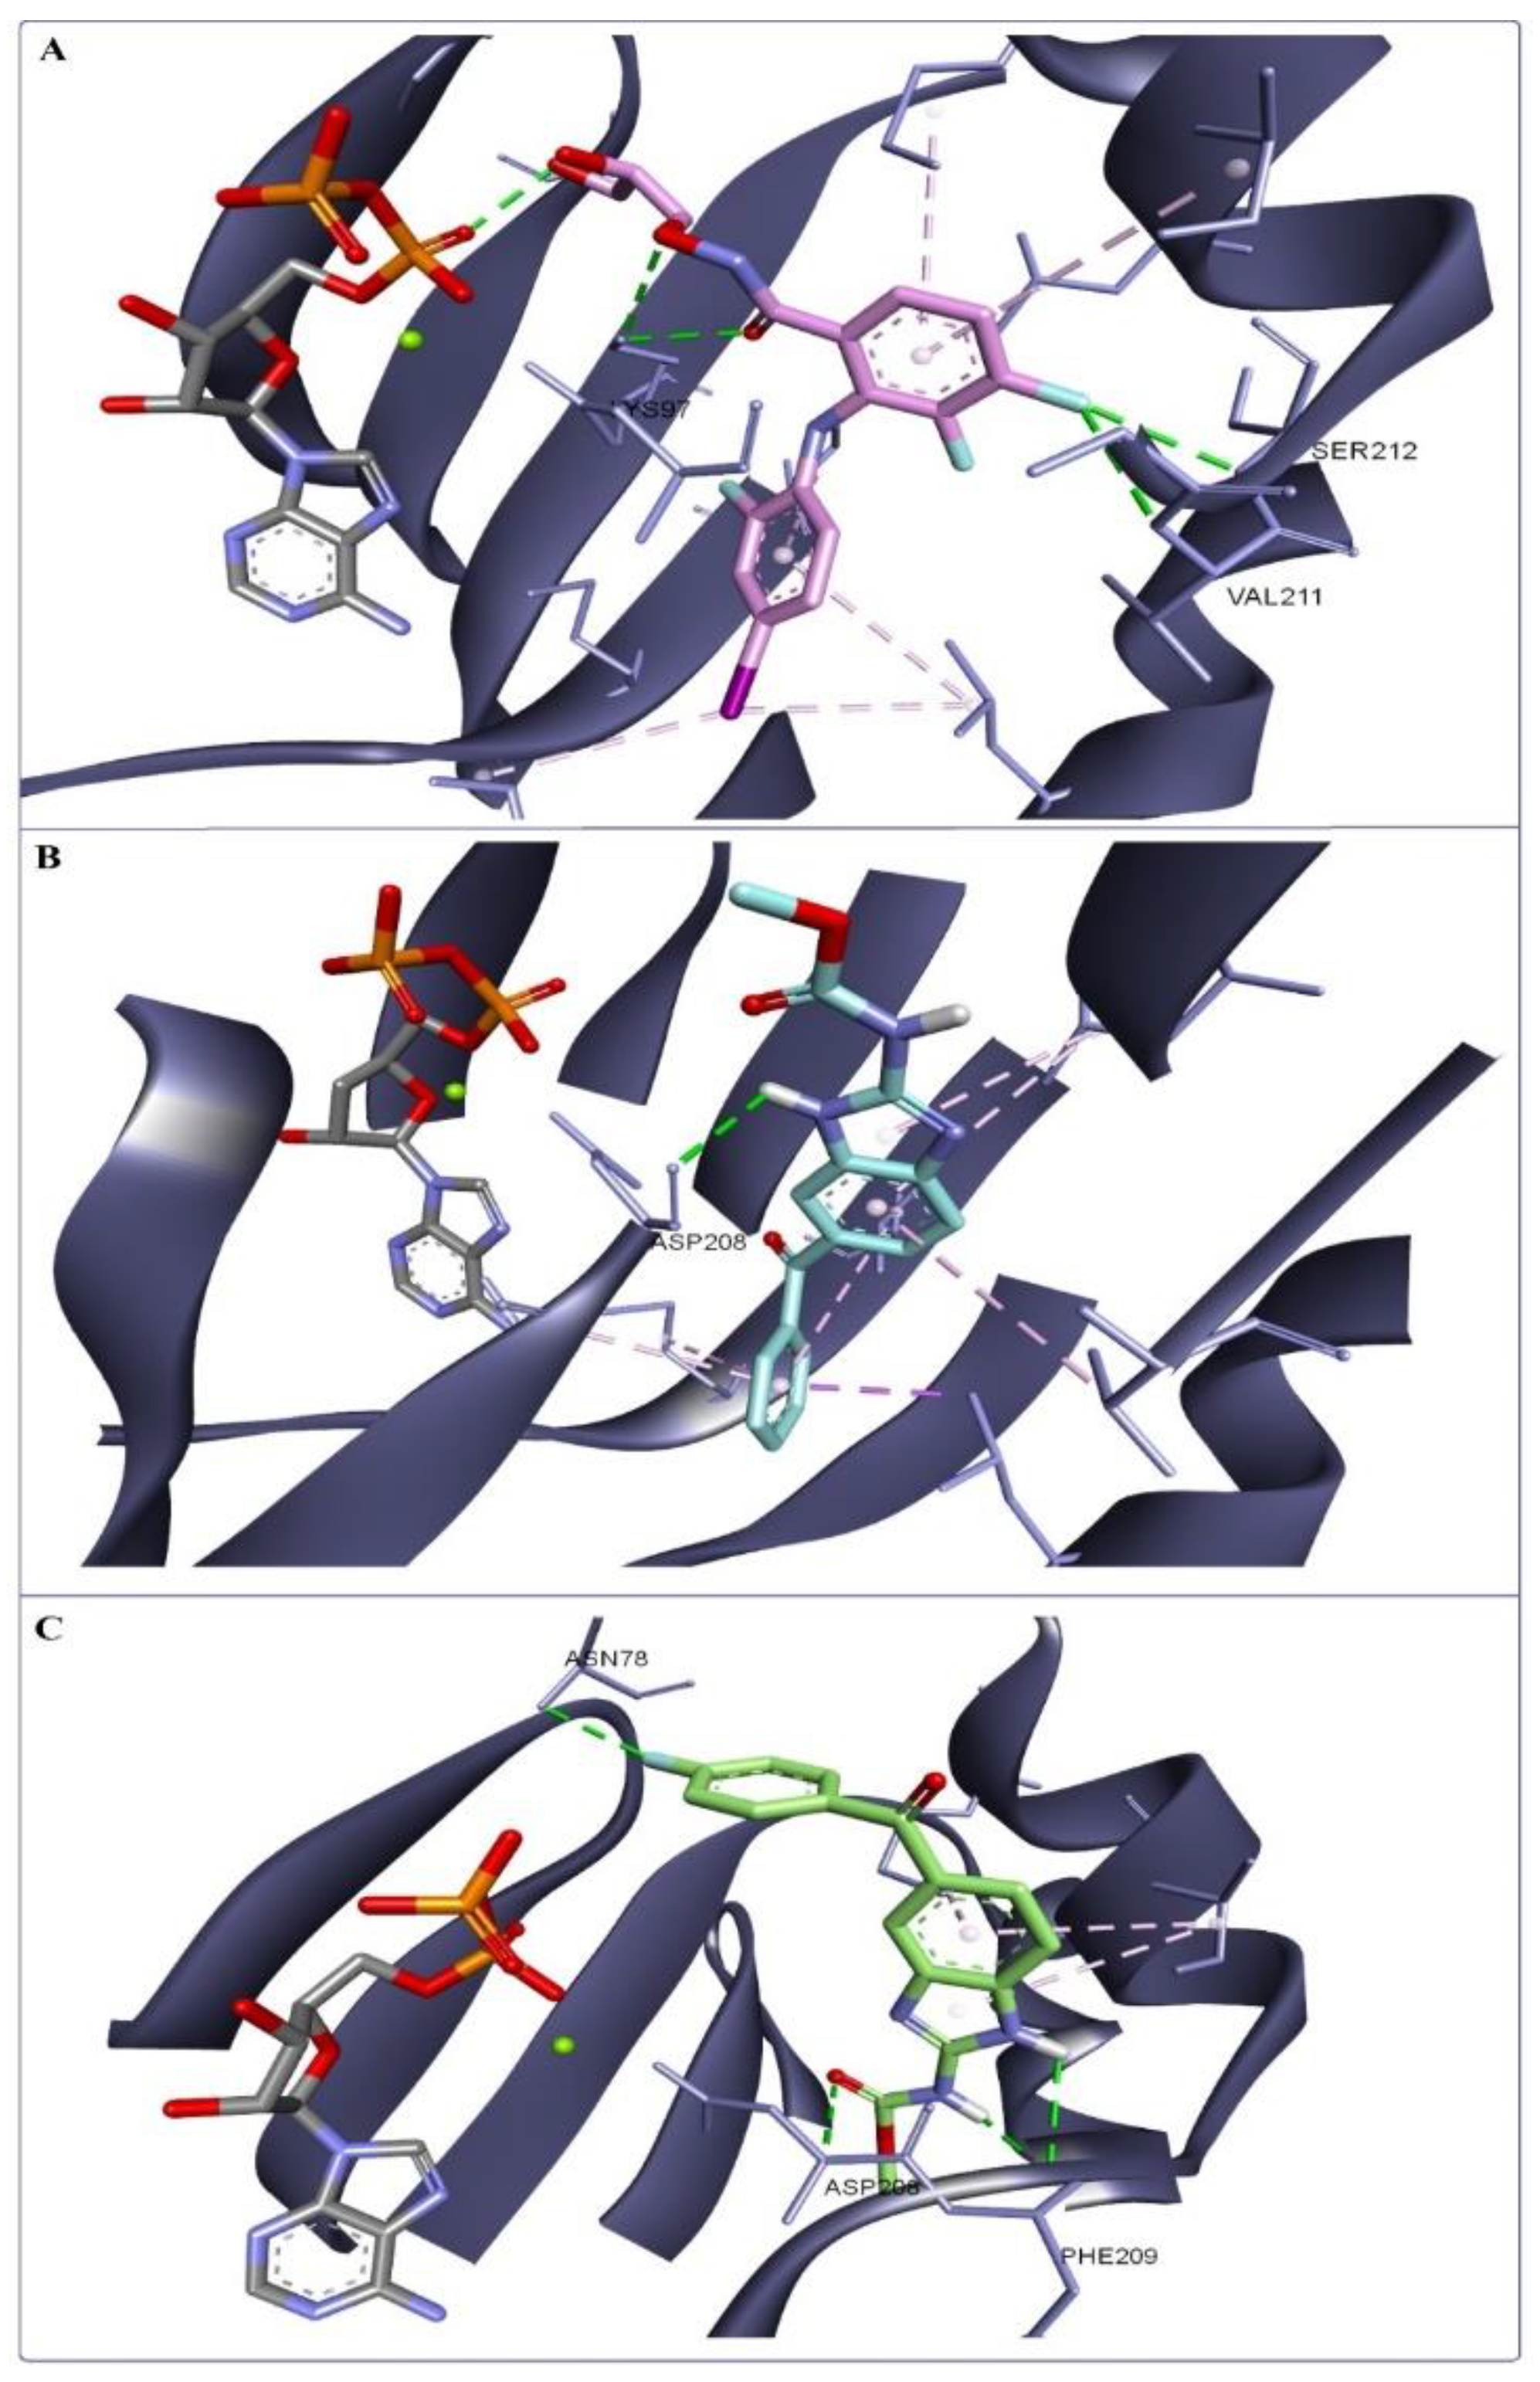
2.8. Molecular Docking Analysis

Molecular docking analysis was achieved using a previously described method [32]. All protein target structures were retrieved from the RCSB Protein Data Bank [33] (Table 1). These structures were optimized as docking suitable targets, using Autodock Tools v1.5.6 (The Scripps Research Institute, La Jolla, CA, USA). Water molecules, unlinked atoms/protein chains, and the native ligands were removed from the protein structure file. The target structures were saved as pdbqt files. The 2D structure of MEB and FLU were sketched using Biovia Draw (Dassault Systems Biovia, San Diego, CA, USA) and converted into 3D structures using the PyRx embedded Open Babel function. Molecular docking was performed with the PyRx v0.8 virtual screening software (The Scripps Research Institute, La Jolla, CA, USA), using Autodock Vina’s embedded scoring function [34]. The docking protocol was validated by re-docking the native ligands into their original protein binding sites. The predicted docking pose was compared with the experimental binding pose. Docking studies were performed for each case only, where the root mean square deviation (RMSD) values between the native ligand’s experimental and docked pose did not exceed a 2 Å threshold. The search space grid box was defined in terms of coordinates and size (Table 1) to best fit the active binding site. Docking results were recorded as free binding energy values (ΔG, kcal/mol). Ligand–protein binding interactions were analyzed using Accelerys Discovery Studio 4.1 (Dassault Systems Biovia, San Diego, CA, USA).

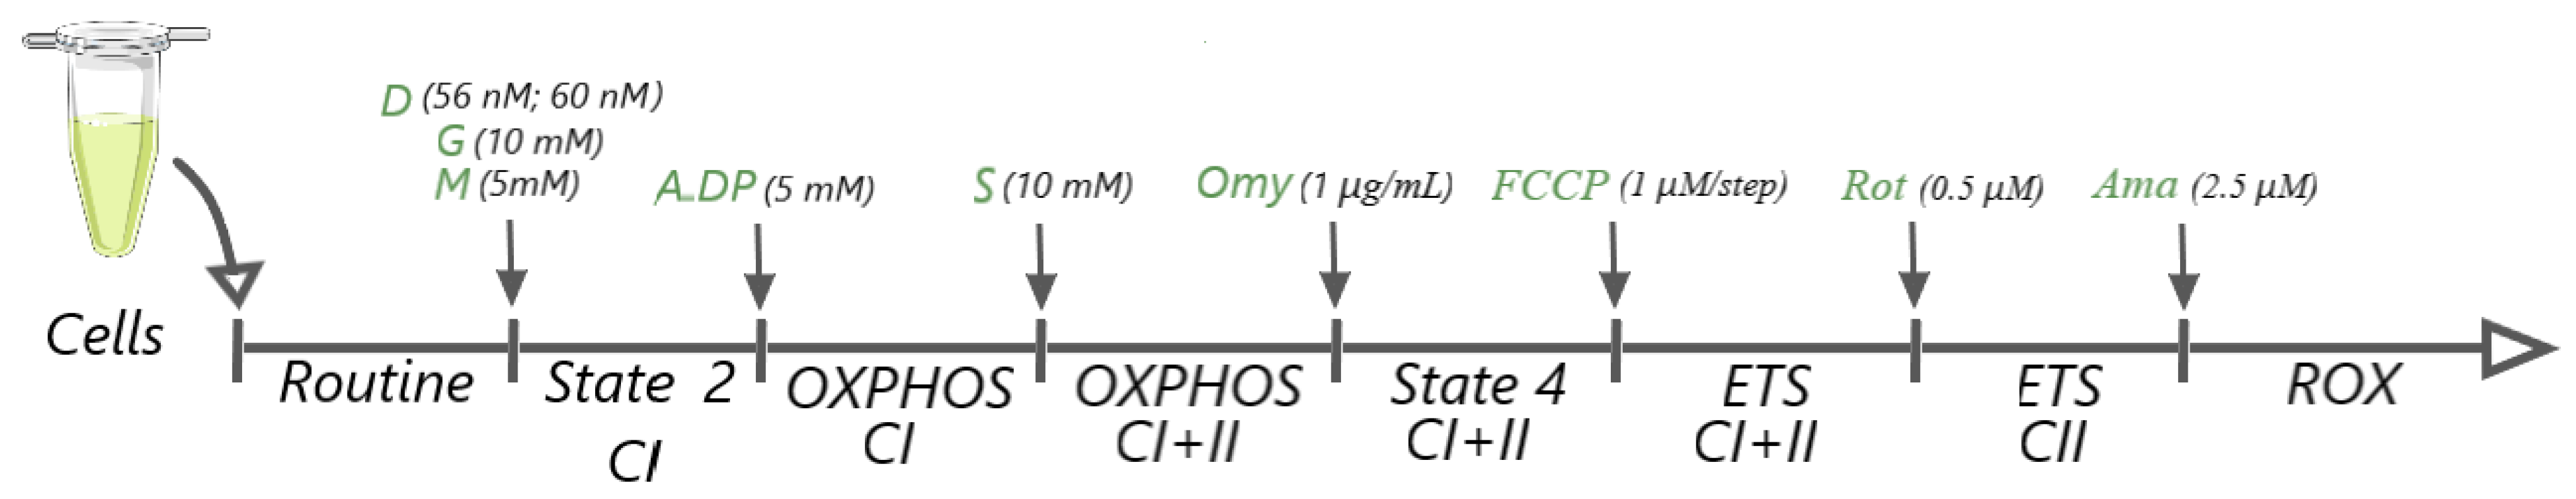
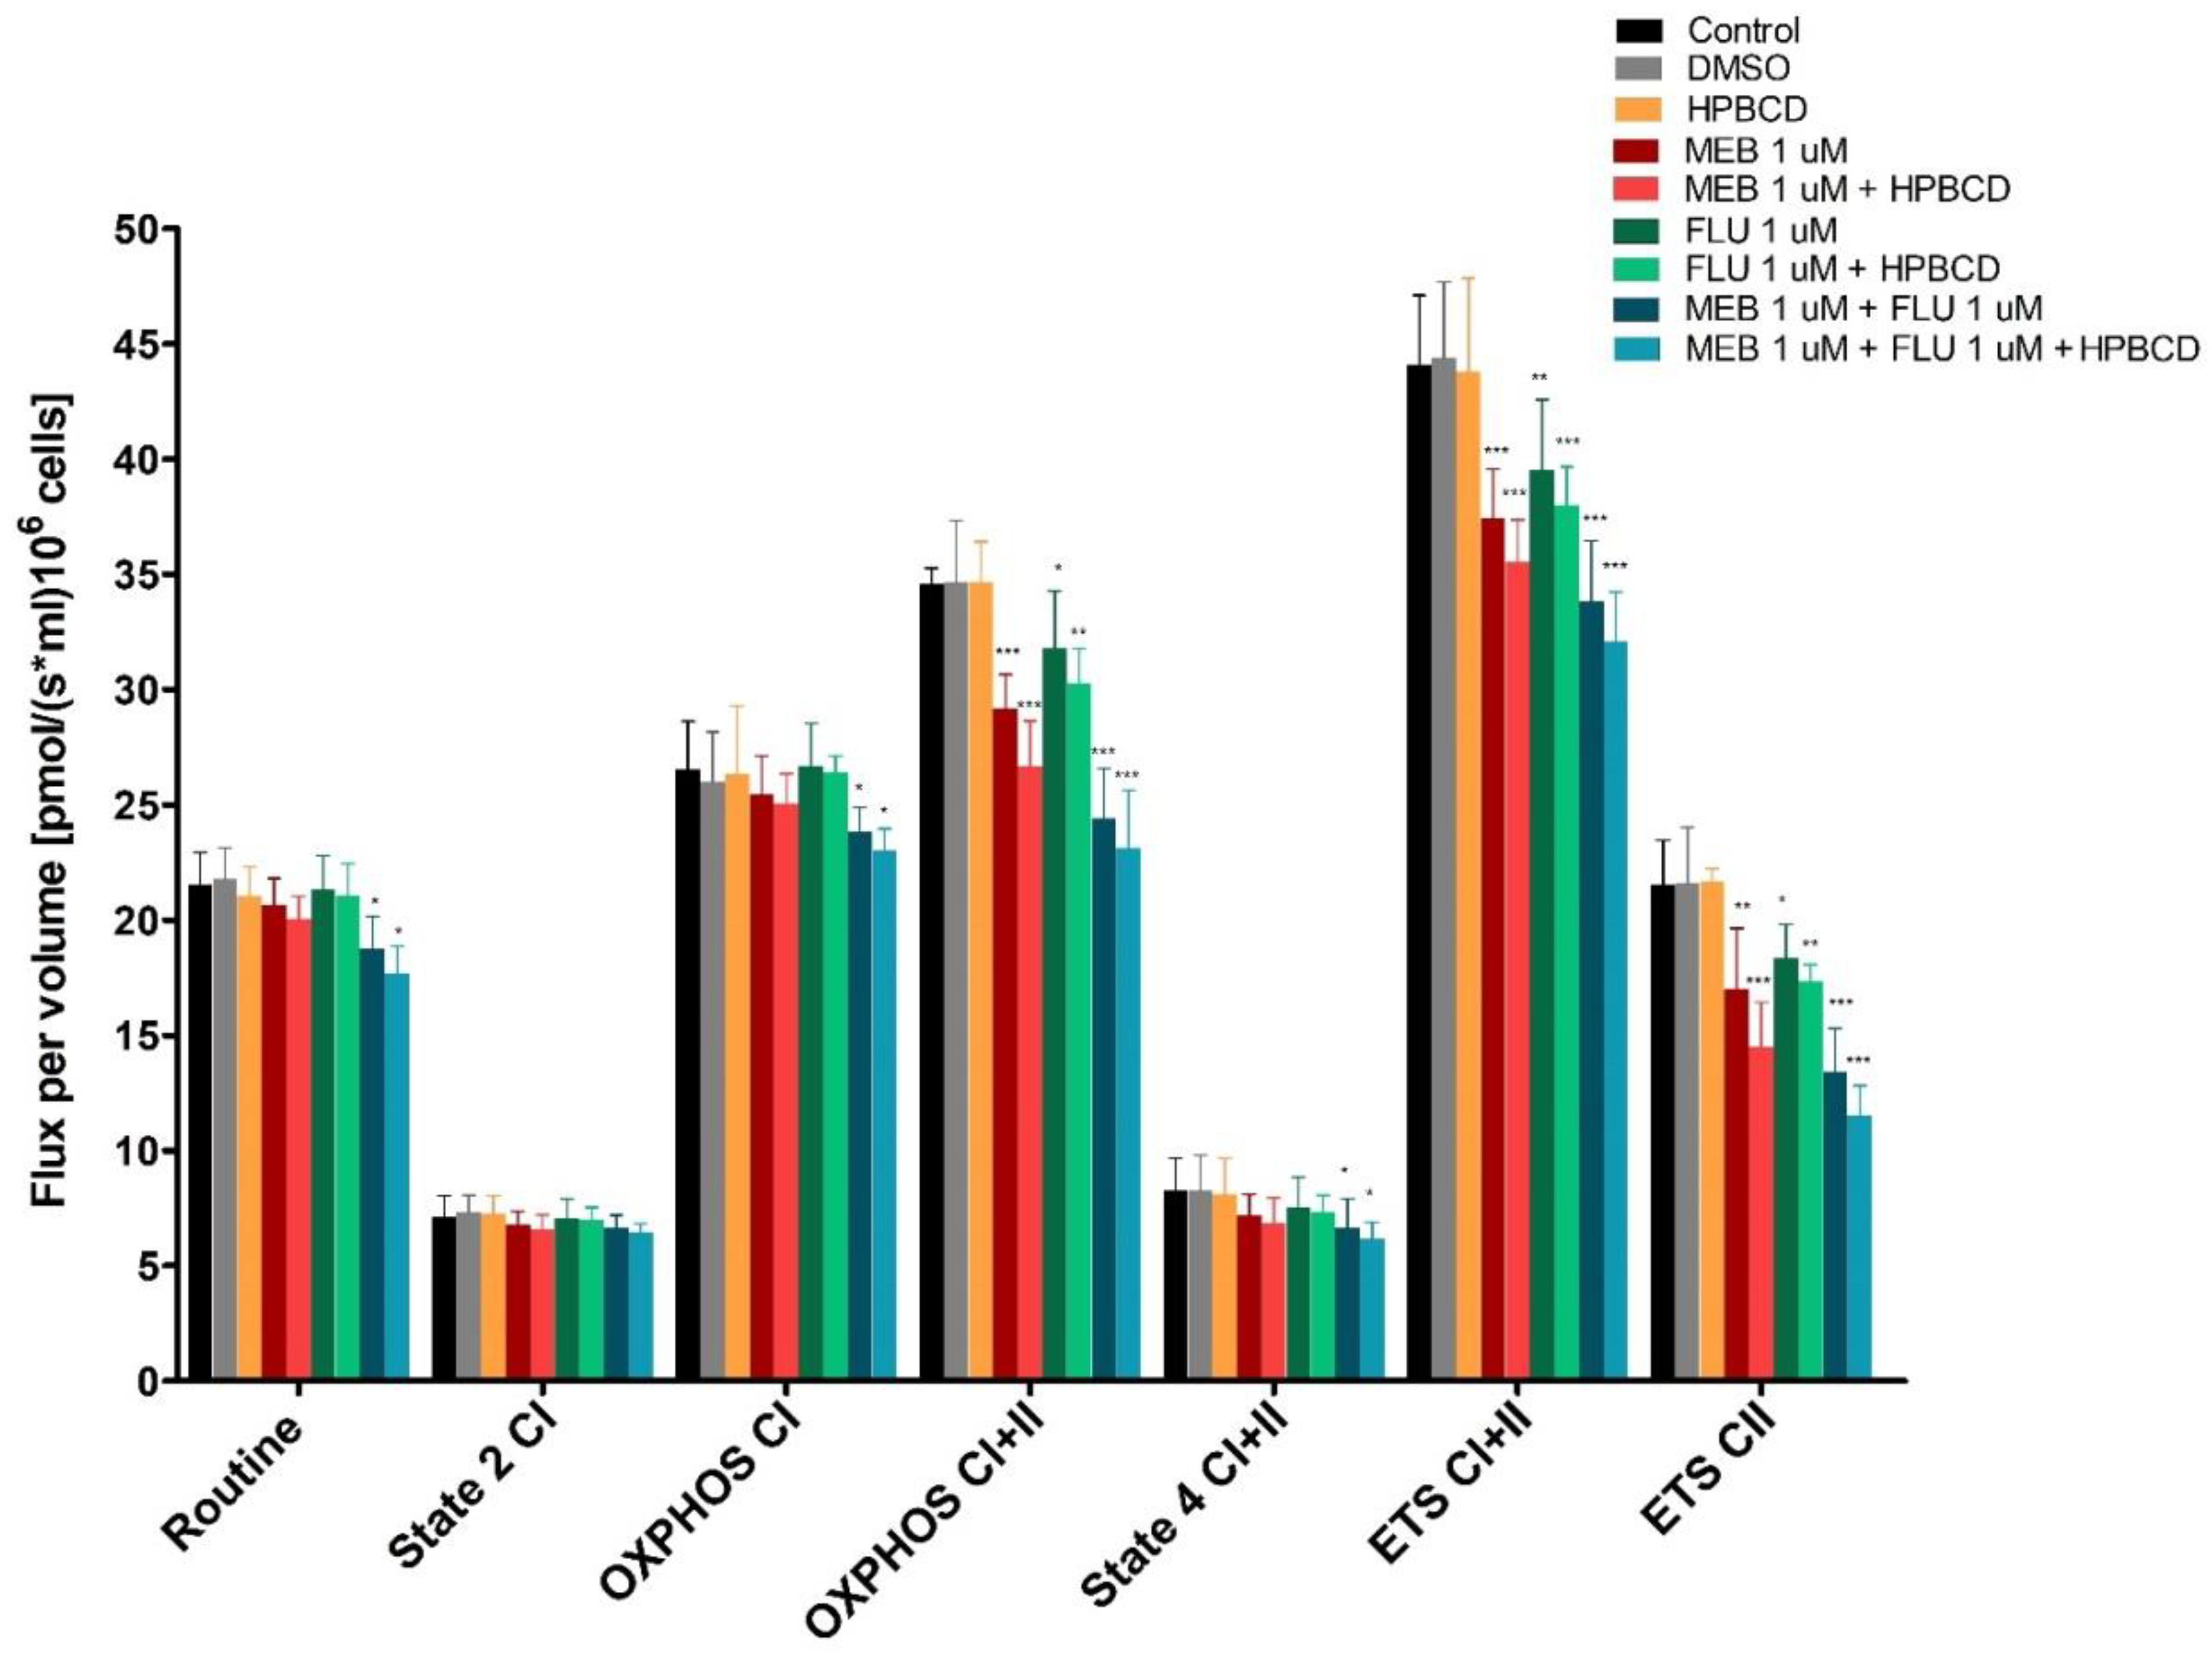
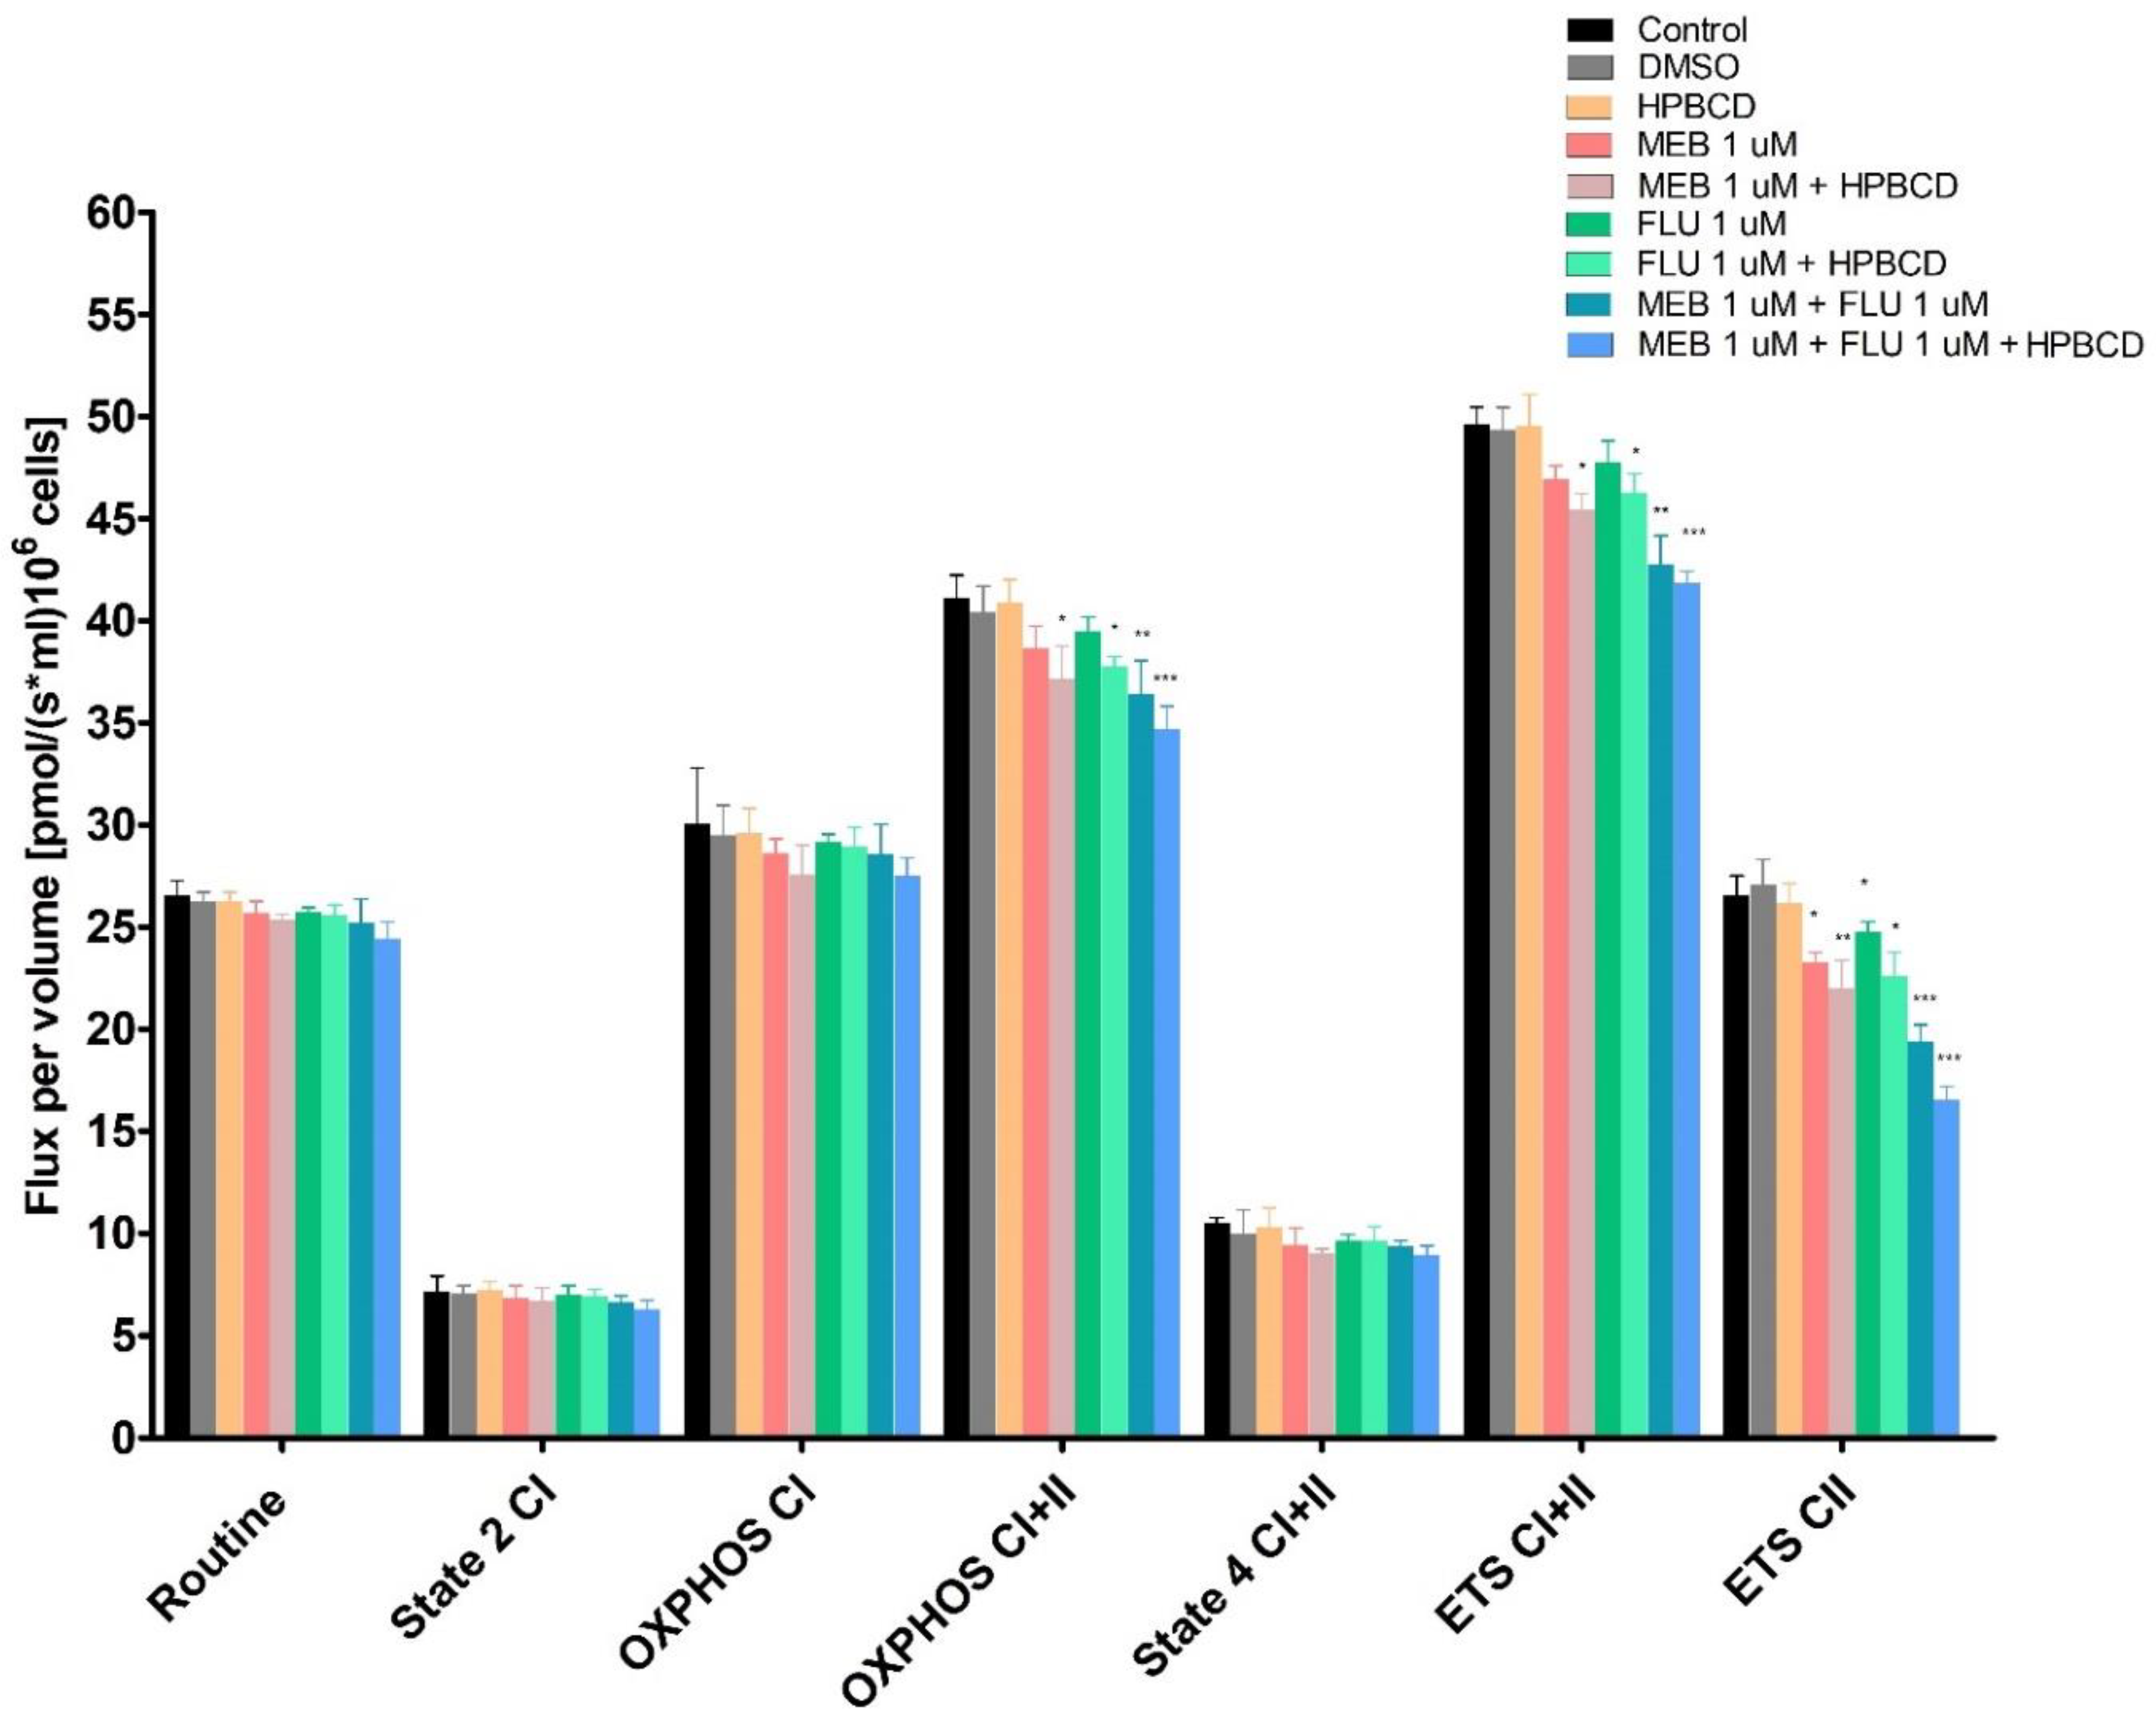
2.9. High-Resolution Respirometry Studies in Permeabilized Cells

Oxygen consumption was measured by high-resolution respirometry (HRR) at 37 °C (Oxygraph-2K, Oroboros Instruments, Austria). Following a standard oxygen calibration, 1 × 10⁶ cells/mL were incubated in 2 mL of incubation media (110 mM Sucrose, 20 mM Taurine, 3 mM MgCl2, 0.5 mM EGTA, 10 mM KH2PO4, 60 mM lactobionic acid, 20 mM HEPES, 1 g/L BSA, pH adjusted at 7.1 with KOH 5 M) and permeabilized with digitonin (56.7 mM for A375 and 50 mM for A549). The cellular membrane permeabilization was performed in order to achieve a thorough assessment of the OXPHOS capacity. The optimal concentration of digitonin used for each cell line was determined after a step-wise titration protocol performed at the beginning of the experiment. Firstly, the cells were suspended in media without the mitochondrial respiration substrates for 10 min, to allow the measurement of the routine respiration rate (the mitochondrial oxygen consumption of intact cells in physiological conditions). A modified substrate-uncoupler-inhibitor-titration (SUIT) protocol was applied afterwards; mitochondrial respiratory rates were measured when the electron transfer was both separate (i.e., from complex I-CI and complex II-CII) and conjunctive (CI+CII), as presented in detail in Figure 2.
The mitochondrial respiratory rates measured following each titration of the SUIT protocol were as follows:
  • State 2CI: the basal respiration in a non-phosphorylating state; mitochondrial respiration dependent on CI (NADH-generating) substrates.
  • OXPHOSCI: the active phosphorylating respiration in the presence of CI substrates.
  • OXPHOSCI+CII: the active maximal phosphorylating respiration in the presence of CI and CII substrates.
  • State 4CI+CII: the basal/leak respiration dependent on both CI and CII substrates in a non-phosphorylating state—after inhibition of ATP synthase.
  • ETSCI+CII: mitochondrial respiration in a fully uncoupled state that reveals the maximal electron transport system capacity:
  • ROX: the non-mitochondrial residual oxygen consumption—after CI and CIII inhibition by rotenone and antimycin A, respectively.

Data Acquisition and Statistical Analysis
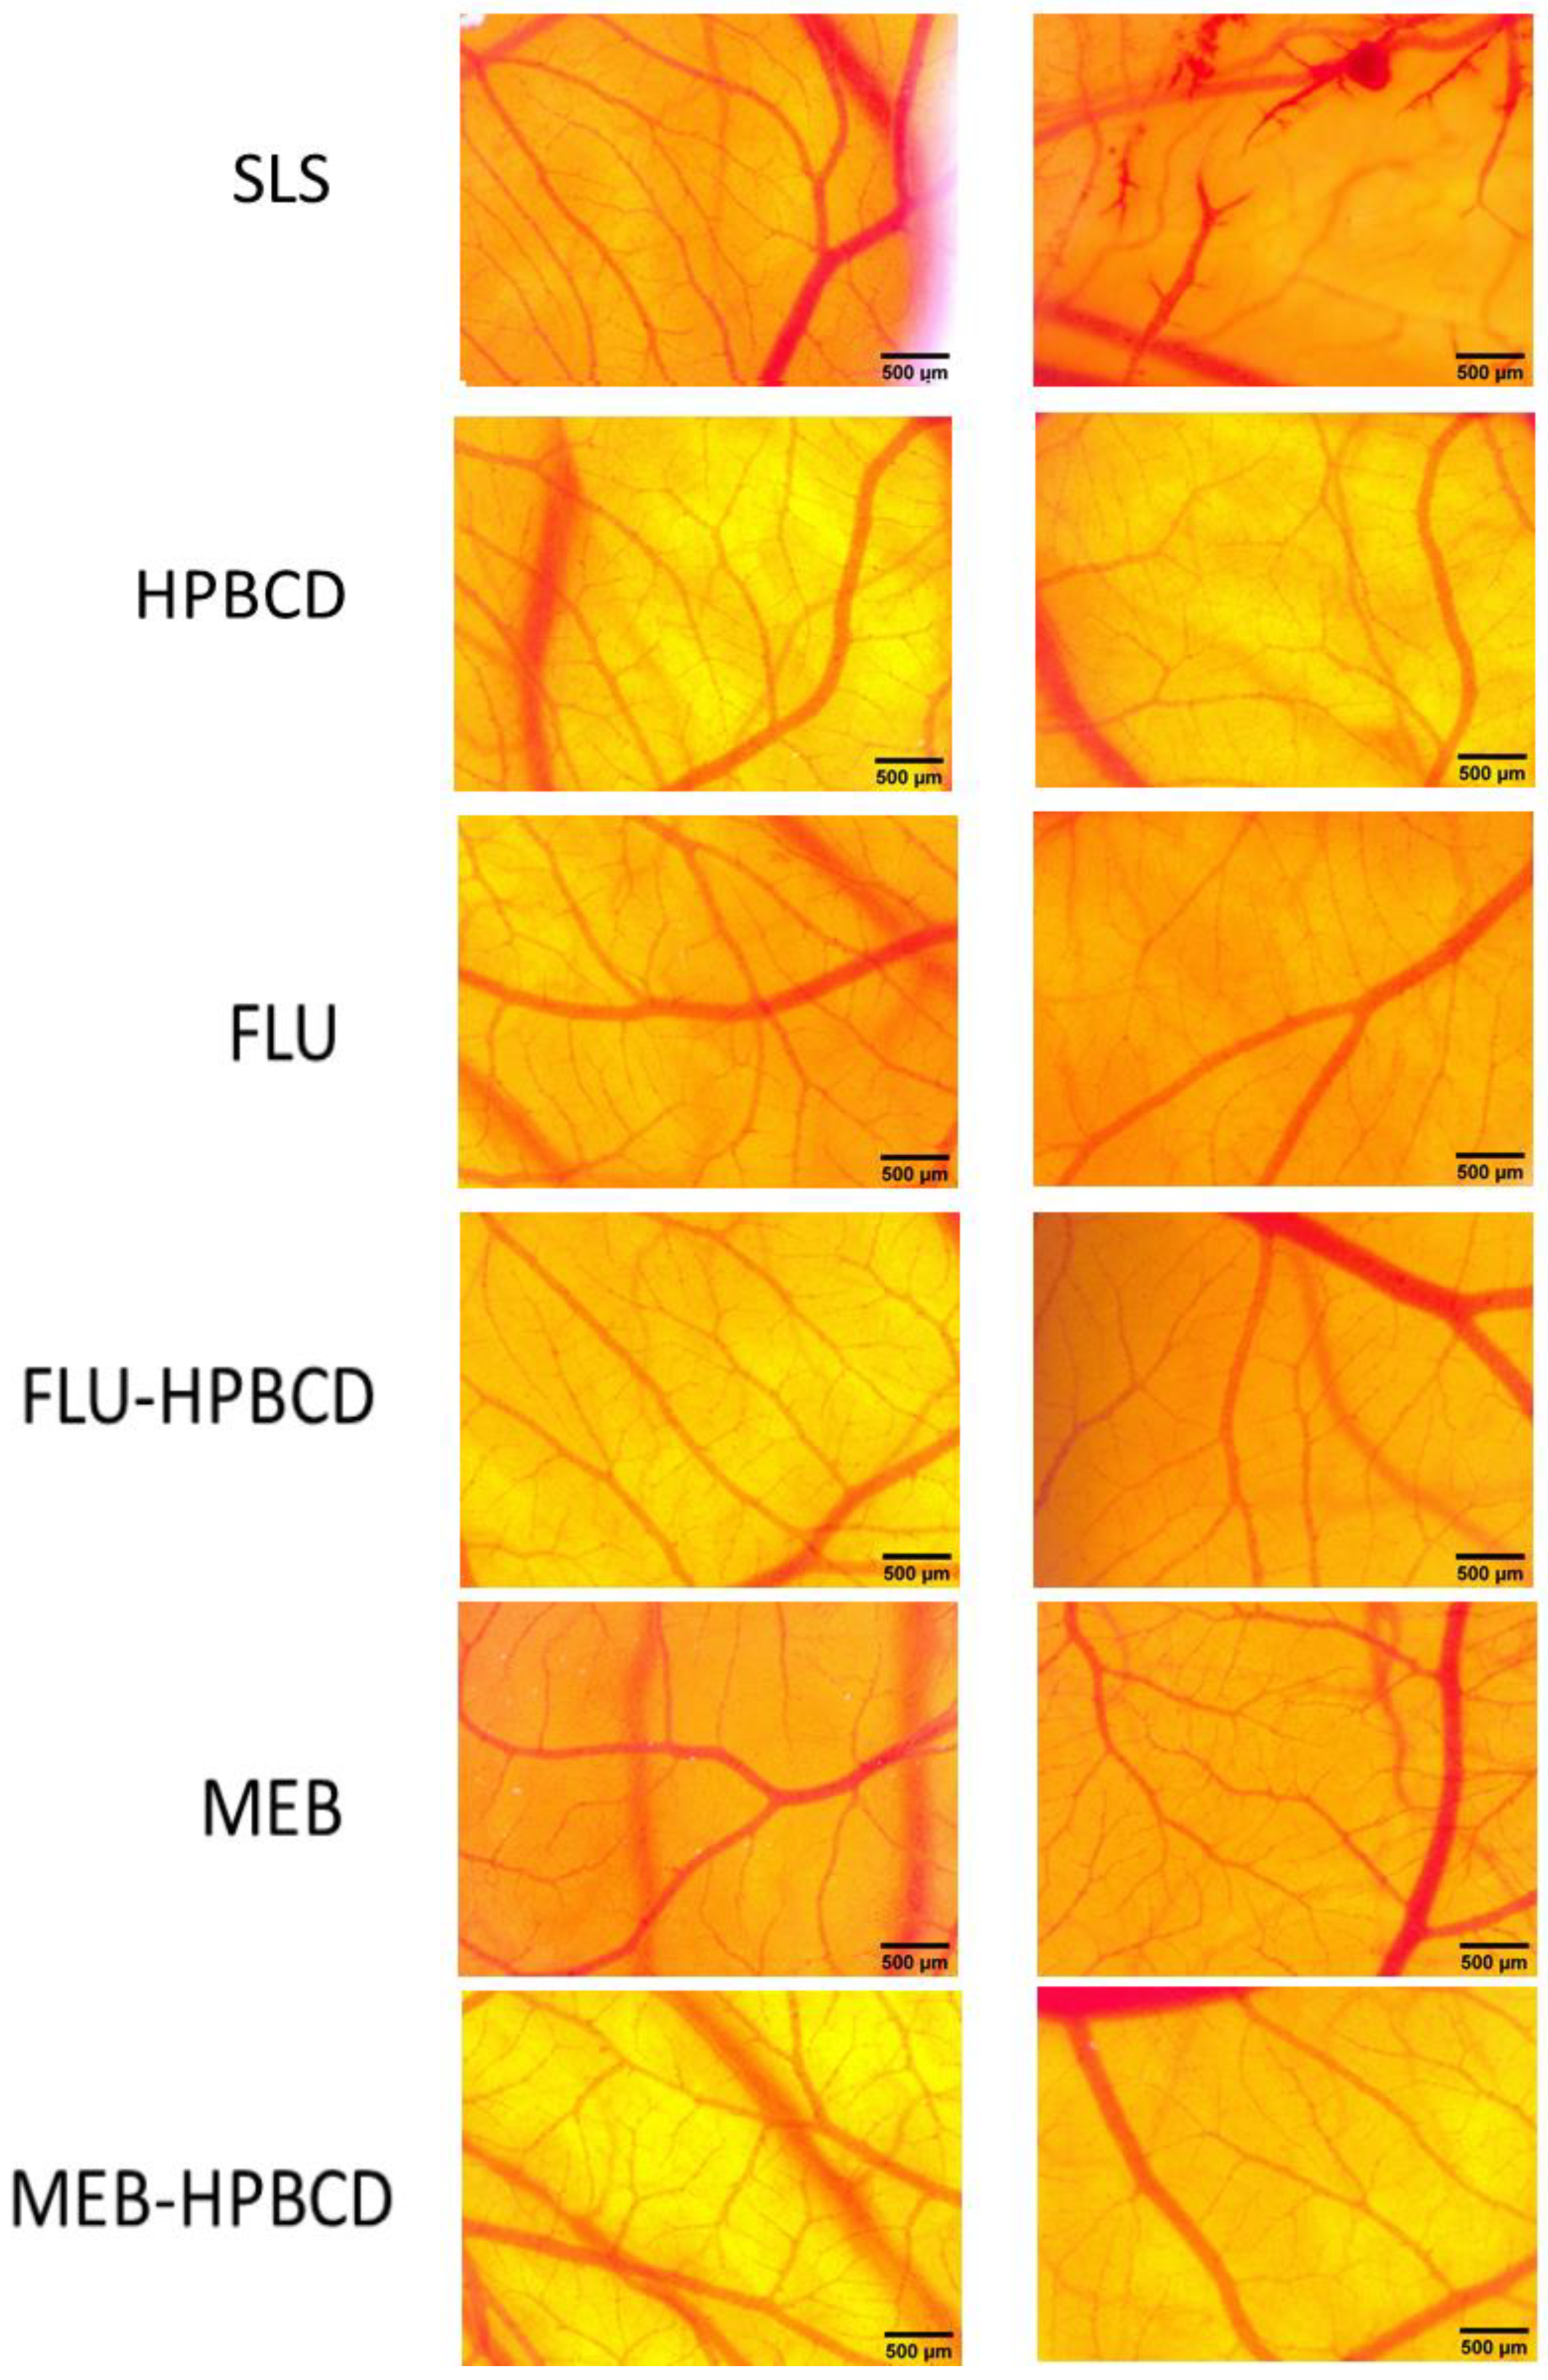
The measured mitochondrial oxygen consumption rates (software DatLab6, Oroboros Instruments, Innsbruck, Austria) were corrected for ROX values. The results were expressed as mean ± SD. The statistical analysis was performed using two-way ANOVA, followed by Bonferroni post-test (GraphPad Prism5 software, San Diego, CA, USA). If p < 0.05, the difference between groups was considered to be statistically significant, as follows: * p < 0.05, ** p < 0.01, and *** p < 0.001.

2.10. HET-CAM Assay

The compounds were also evaluated concerning the biocompatibility and local toxicity on mucosal tissues, by using the in vivo Hen’s Egg Chorioallantoic Membrane Test (HET-CAM). The assay determines a potential irritant effect on the vascular plexus of the chorioallantoic membrane [35]. The HET-CAM method was carried out following ICCVAM recommendations and adapted to our conditions [36,37,38].
Thus, a volume of 300 µL of control or test solution was applied and the modifications produced at the CAM level were monitored by means of stereomicroscopy (Discovery 8 Stereomicroscope, Zeiss), registering significant images (Axio CAM 105 color, Zeiss, Göttingen, Germany), before the application and after 5 min of contact with the samples. All images were processed using Zeiss ZEN software, Gimp 2.8, and ImageJ software.
The negative control was represented by distillate water and solvent control DMSO 0.5%, while the positive control by the sodium lauryl sulphate (SLS) 0.5% in distillate water. The test substances were tested in concentrations of 10 mM.
The observation time of the produced reactions was 5 min (300 s) and the time at which the occurrence of a particular reaction took place was noted in seconds. Finally, the following reactions were hemorrhage-H (blood vessel bleeding), vascular lysis-L (disintegration of blood vessels), and coagulation-C (intra or extra-vascular protein denaturizing). A variety of analysis methods may be used to assess the irritancy potential of test substances. One analysis method that has been used extensively used is an irritation score (IS). Equation (1) used to generate an IS value is:
IS = 5 × 301 Sec H 300 + 7 × 300 Sec L 300 + 9 × 301 Sec C 300
where: H = hemorrhage; L = vessel lysis; C = coagulation; Hemorrhage time (SecH) = onset of hemorrhage reactions on CAM (in seconds); Lysis time (SecL) = onset of vessel lysis on CAM (in seconds); and Coagulation time (SecC) = onset of coagulation formation on CAM (in seconds). Means values were obtained. The formula comprises a factor indicating the impact on vascular damage of the observed effect, e.g., coagulation has the highest impact expressed by the multiplication factor of 9. The IS values range on a scale between 0 and 21.

3. Results and Discussion

Nowadays, cancer stands among the pathologies with the highest mortality rate, accounting for nearly 10 million deaths in 2020 [39]. The race for finding a cure is ongoing, with several promising research directions, such as the development of vaccines or gene therapies, which carry, however, the burden of high prices as well as the unpleasant surprise of side effects. A strategy that is highly efficient, low cost, and time consuming, with minimum failure risks, is drug repositioning, which combines experimental and computational approaches in order to identify new uses for existing drug molecules. A huge advantage of this strategy is that the drugs are already validated as safe for human use [40]. The current study evaluated the possibility of repurposing two benzimidazole antihelminthics, MEB and FLU, as anticancer agents and, simultaneously, the possibility of increasing their aqueous solubility by using cyclodextrin as solubility enhancers.
The binary conjugates were prepared by kneading each drug with a β-cyclodextrin derivative with high water solubility, hydroxypropyl-β-cyclodextrin (HPBCD). The conjugates were physicochemically assessed by several analytical techniques aimed to investigate the potential formation of inclusion complexes.

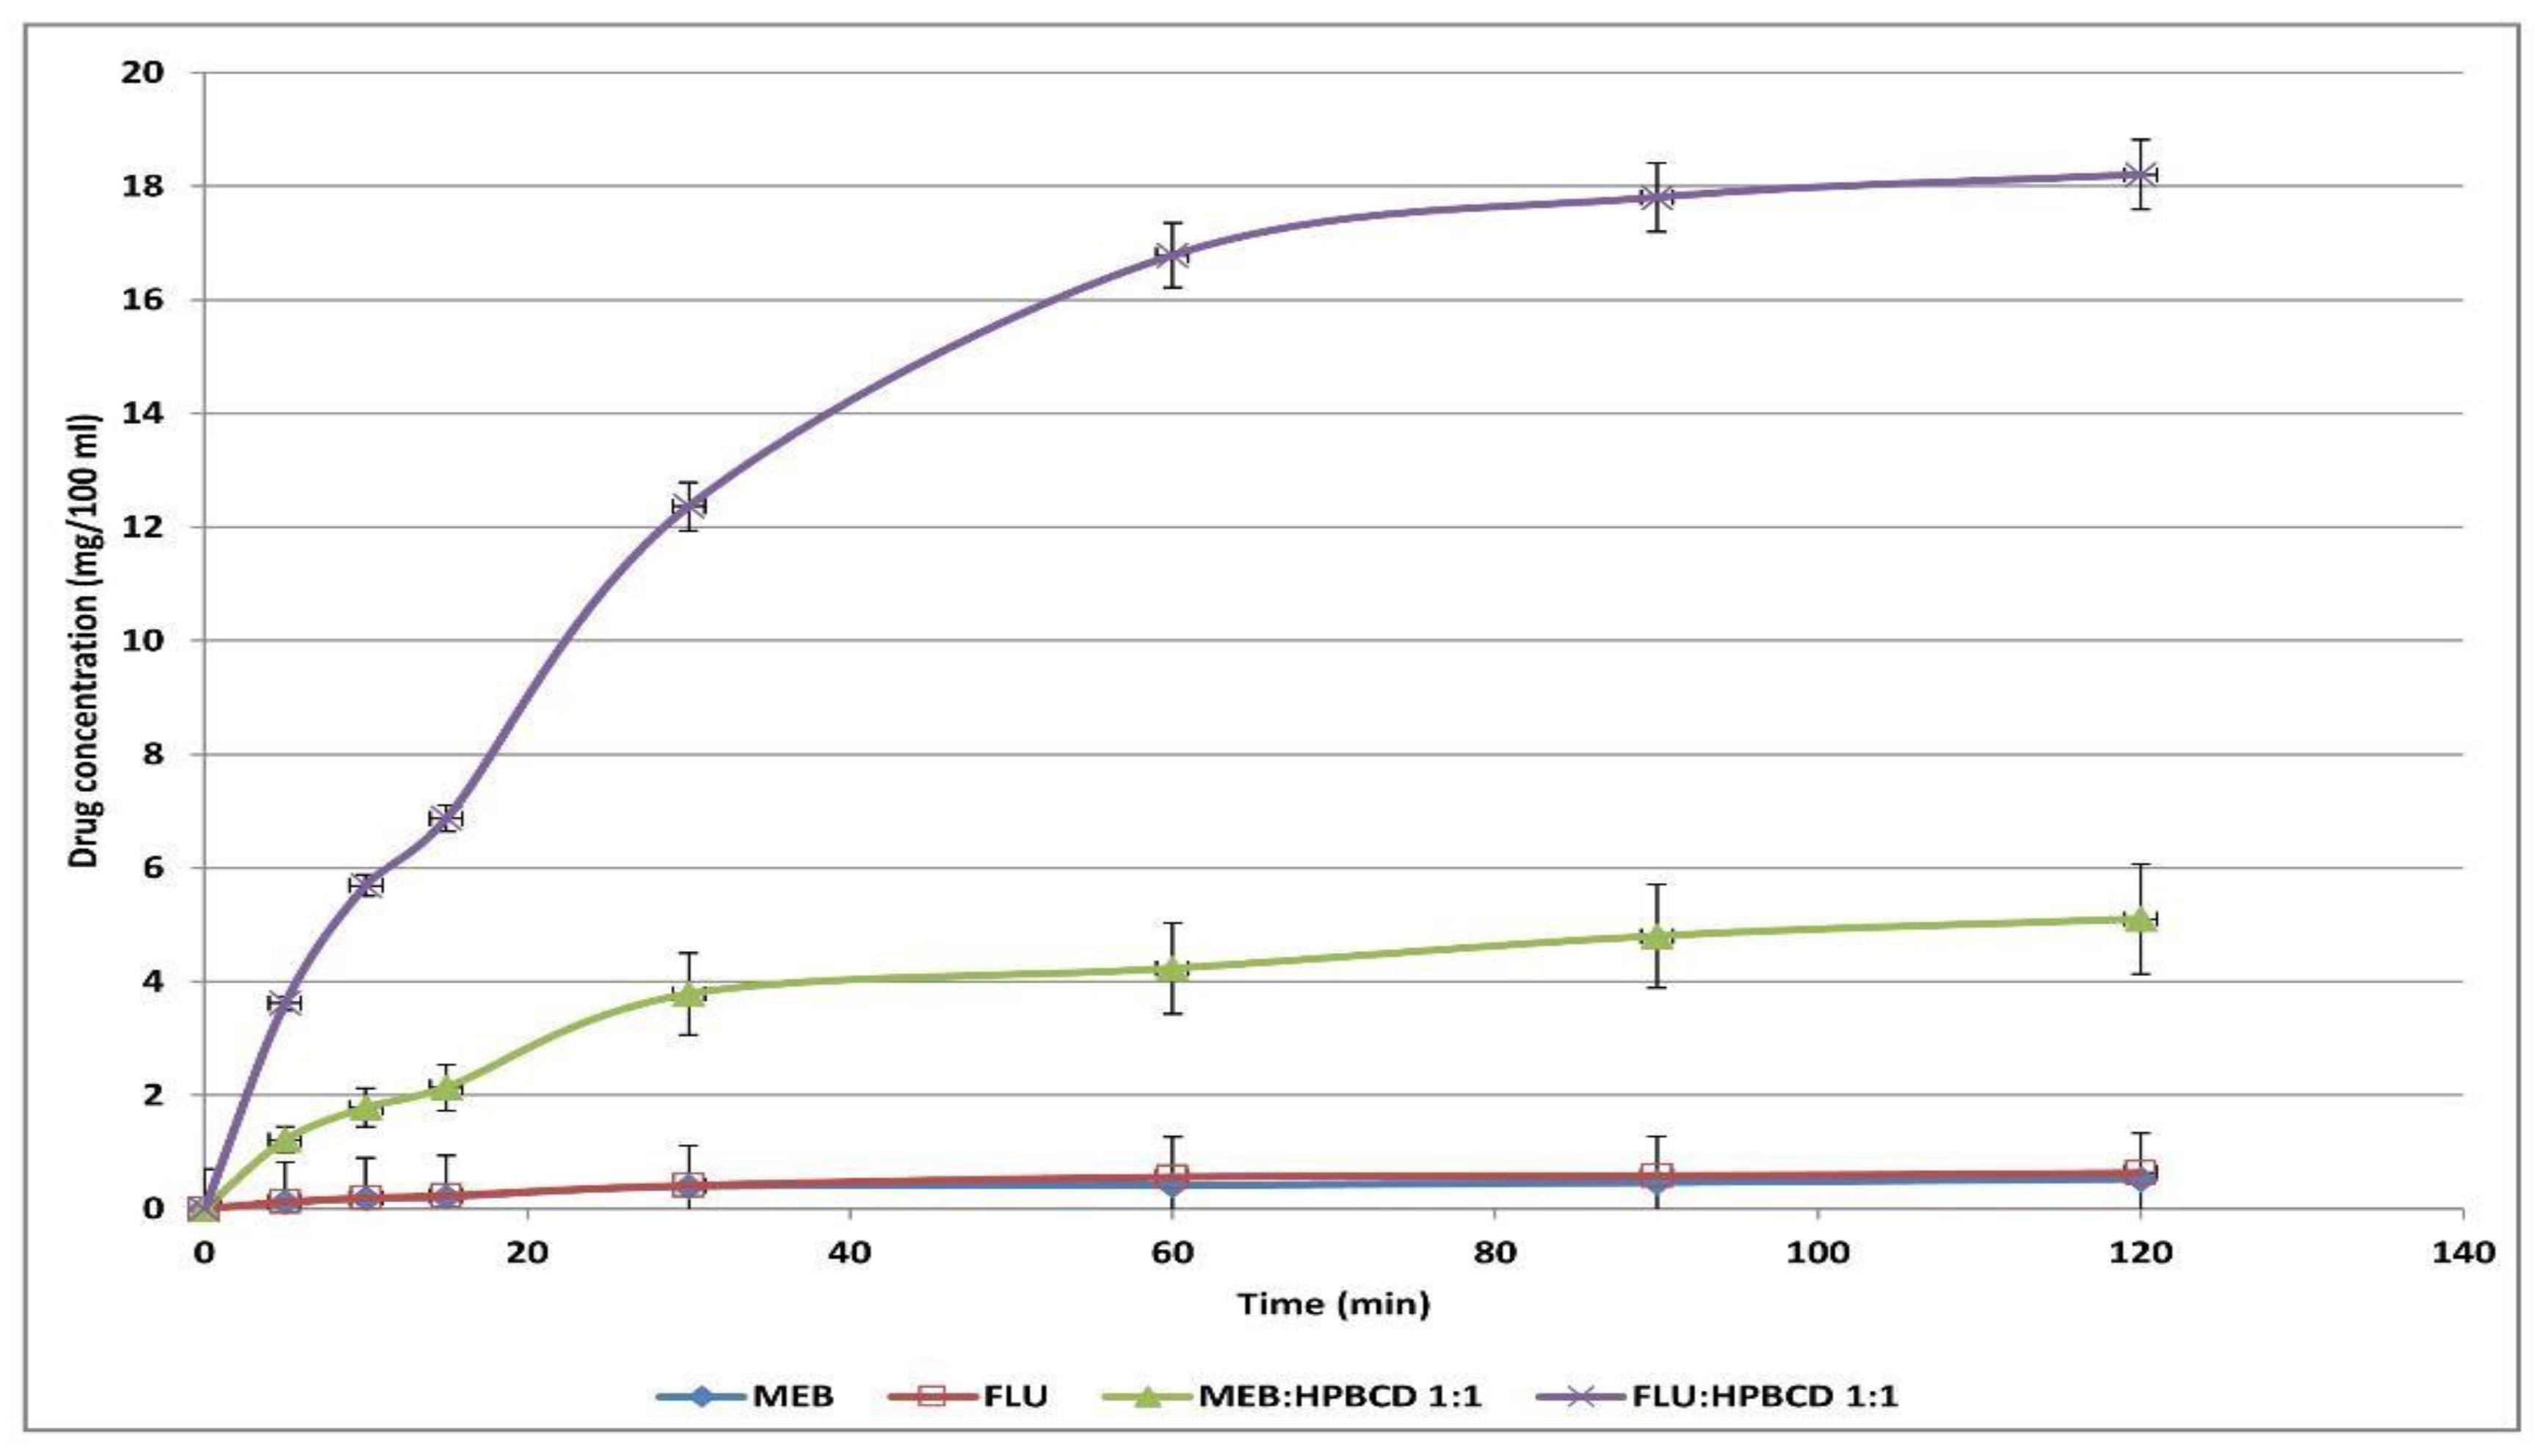
3.1. In Vitro Dissolution Test

The dissolution tests showed the poor water solubility of both pure benzimidazole compounds, with maximum solubilized drug amounts of 0.53 mg/100 mL MEB and 0.63 mg/100 mL FLU. The binary 1:1 conjugates exhibited significantly increased water solubilities and dissolution speed (Figure 3); thus, HPBCD was able to promote the dissolution of 10-fold the amount of MEB and 30-fold the amount of FLU compared to the pure drugs. The increased aqueous solubility can be explained by either the formation of inclusion complexes between the drugs and the cyclodextrin, respectively, or the formation of intermolecular drug:cyclodextrin associations. In both cases, the hydrophilic outer surface of HPBCD induces the transport of an additional amount of pure drug into the aqueous environment.

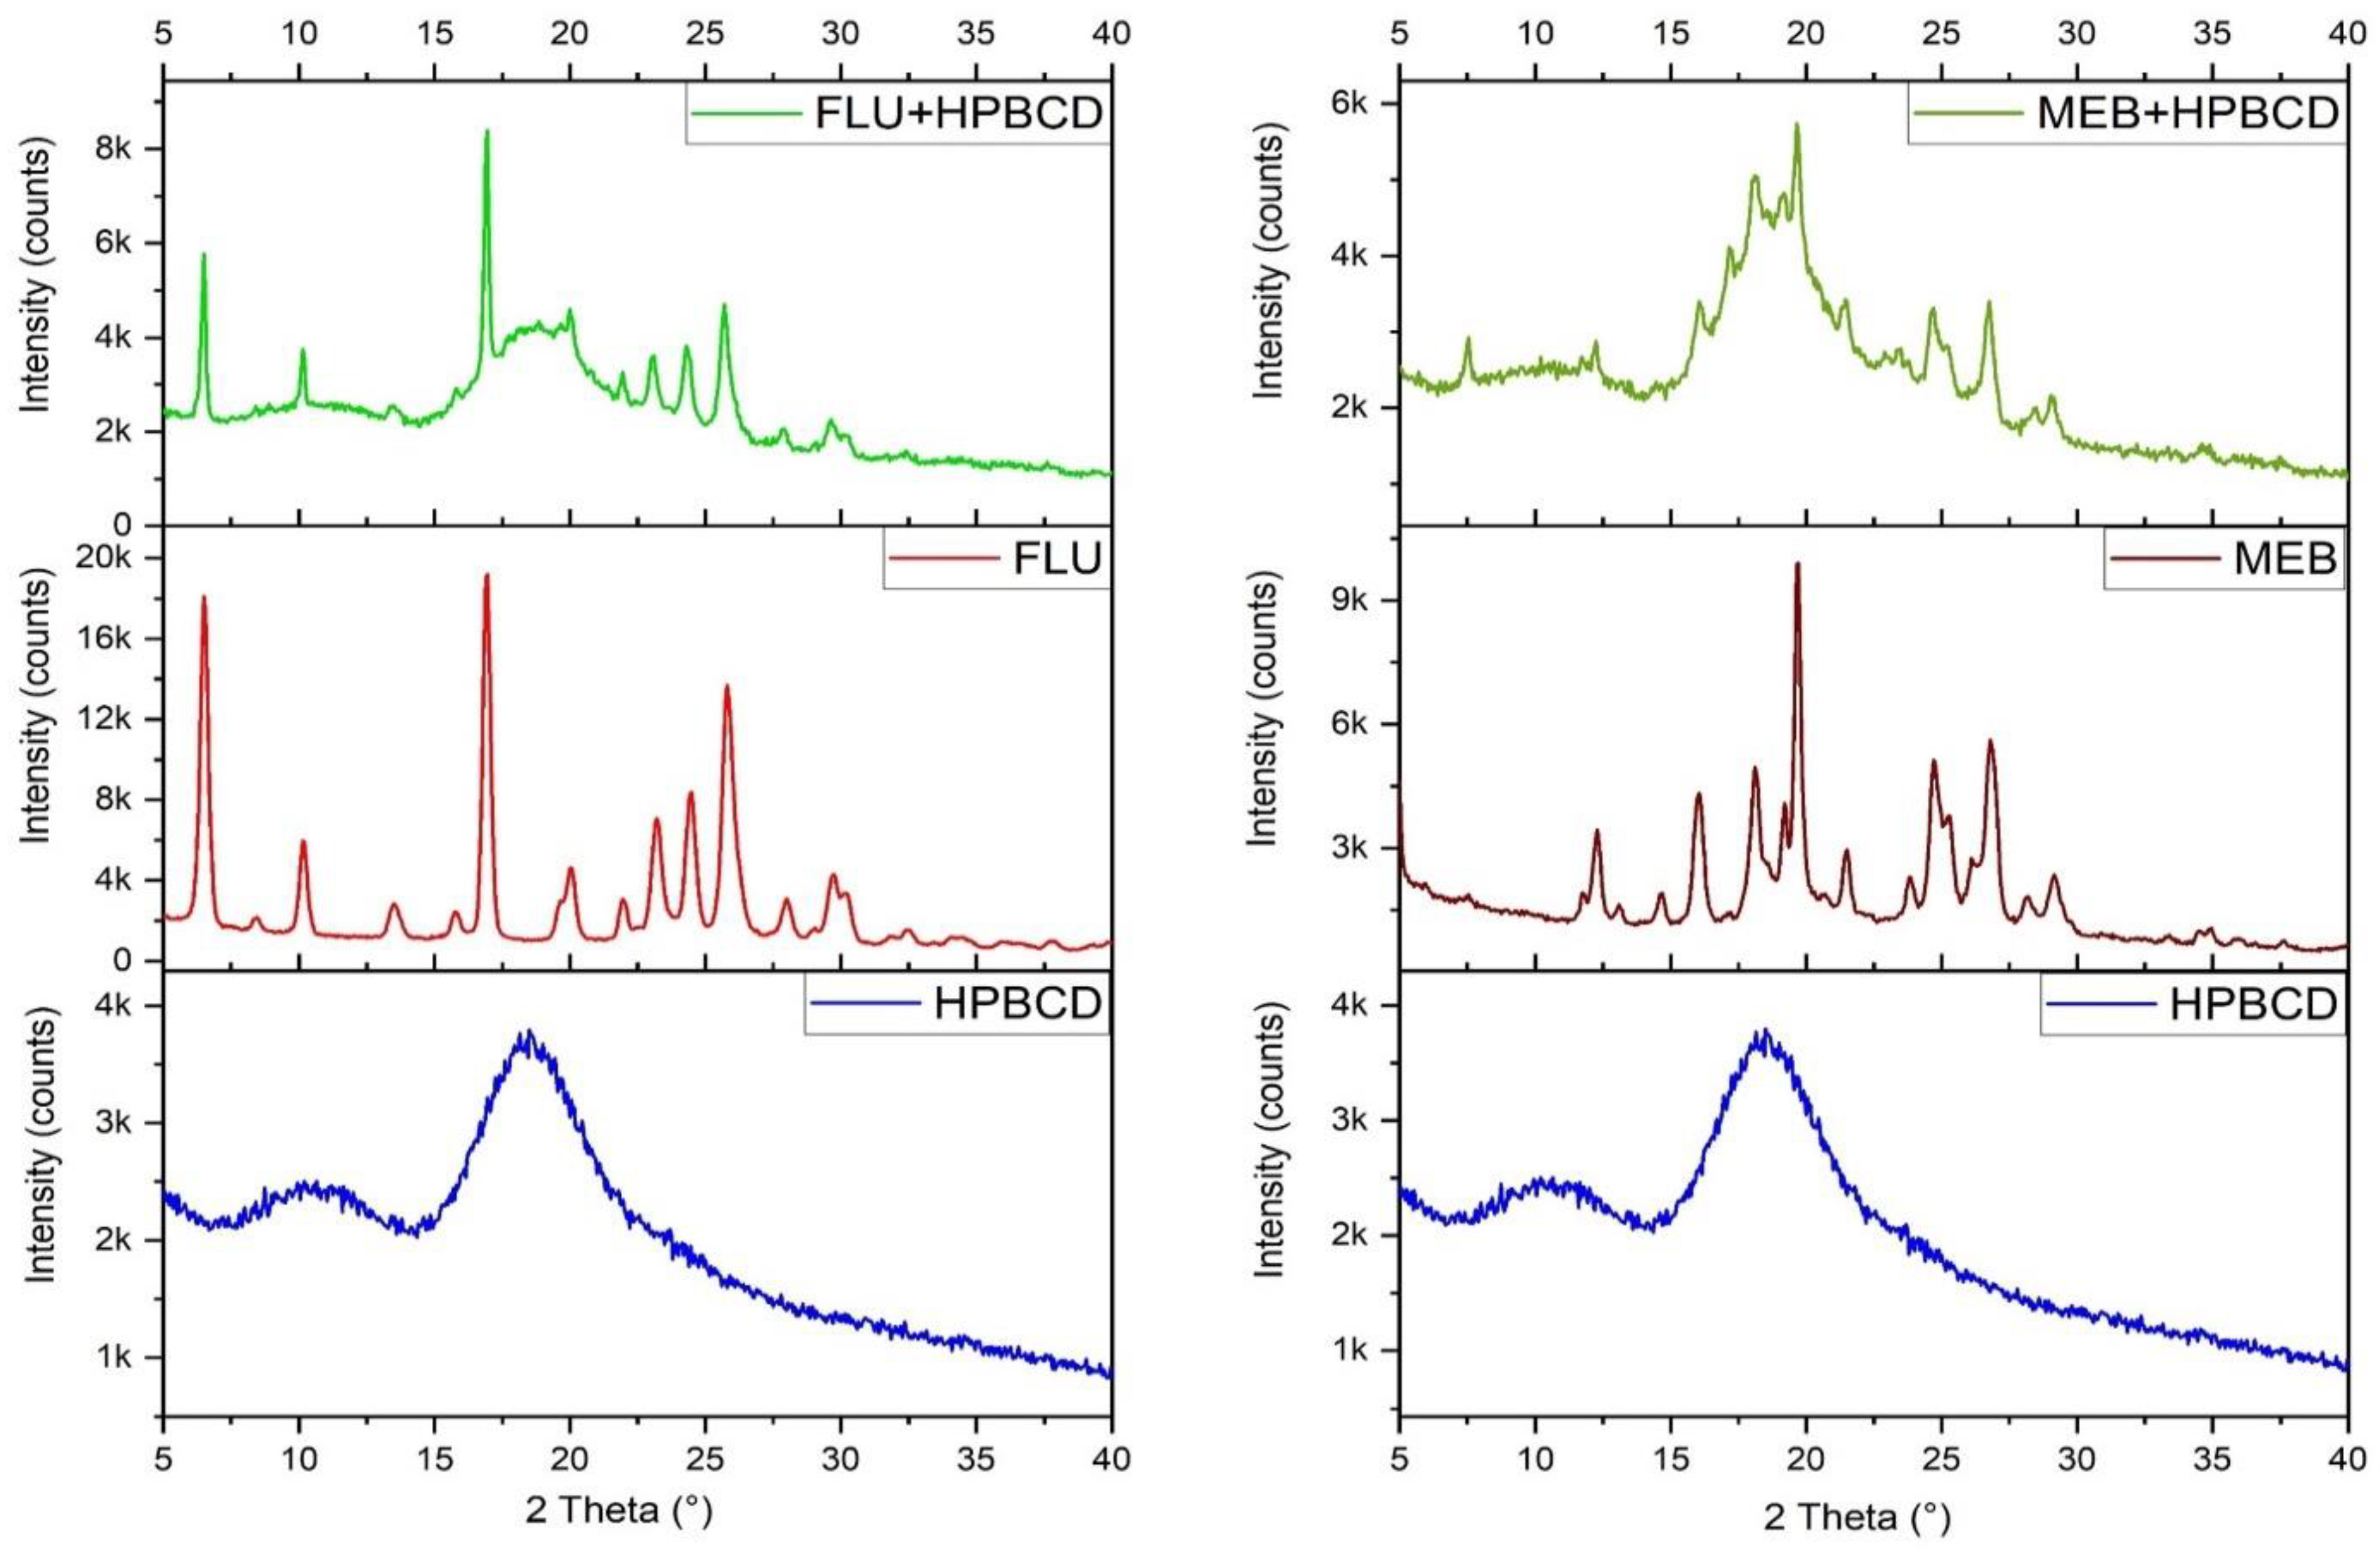
3.2. X-ray Diffraction

In order to establish the phase composition and the occurrence of solid-state interactions, the investigated samples were characterized by X-ray diffraction.
As one can notice in Figure 4, HPBCD shows a XRD spectrum characteristic for amorphous substances. On the entire 2θ range, between 5° and 40°, there are only two wide peaks quite poorly defined, the first being in the range of 7° to 14°, with a maximum at 10.75°, while the second occurs in the range of 15°–22°, with a maximum at 18.75°. Jianyu Su et al. [41] reported a similar spectrum recorded for HPBCD, namely of an amorphous sample, noting that the two wide peaks are found in the ranges of 5°–15° and 15°–25° (2θ). Similar results were also reported by Topal B et al. [42] when they studied the complexes formed between HPBCD and melatonin.
The XRD spectrum recorded for FLU shows well-defined peaks of a narrow and elongated shape. Diffraction peaks suggest a high degree of crystallinity as expected in the case of a pure crystalline substance. One can also notice the high value of the achieved intensity; the three most intense well-defined peaks were recorded at scattering 2θ angle values of 6.5°, 16.95°, and 25.8°, with intensity values of 18,094, 19,212, and 13,686, respectively.
In order to fully display the FLU spectrum, we have to mention all the recorded maximums and their corresponding intensities: 8.4°–2081, 10.15°–5971, 13.5°–2851, 15.75°–2447, 19.65°–2996, 20.05°–4620, 21.95°–3052, 23.2°–7068, 24.5°–8406, 28°–3091, 29.05°–1633, 29.75°–4298, 30.2°–3382, 31.8°–1246, 32.45°–1500, 34.05°–1170, and 37.75°–964.
The same allure of the FLU spectrum was also presented by Vialpando et al. [43], who studied different techniques to obtain amorphous formulations in order to improve the oral availability of FLU. A thorough analysis was recently presented by Bezzon et al. [44] regarding the dispersion of FLU in hydroxypropyl methylcellulose and its long-term stability under a controlled temperature and humidity. In this case, the shape of the FLU spectrum is similar to the one recorded by our team as shown in Figure 4. Vigh et al. [45] reported an identical spectrum for FLU. Their research focused on improving the bioavailability of FLU by formulating the drug with HPBCD and polyvinyl pyrrolidone.
The diffraction spectrum recorded for the mixture of FLU with HPBCD shows FLU specific diffraction peaks as well as the baseline with the two broad HPBCD peaks. In this case, the three most intense peaks maintain the angle values depicted in the FLU analysis, namely 6.5°, 16.95°, and 25.8°, while a change can be observed only in terms of intensity, with the mixture displaying much lower values.
The diffraction spectrum recorded for MEB shows the characteristic profile of well-crystallized substances, with well-defined and narrow diffraction peaks. The three most intense peaks were recorded at 2θ angles of 19.7°, 26.8°, and 24.7°, with corresponding intensities of 9908, 5627, and 5130, respectively. The other recorded peaks and their corresponding intensities are as follows: 7.65°–1761, 11.7°–1838, 12.3°–3432, 13.1°–1625, 14.6°–1881, 16.15°–4336, 17.3°–1451, 18.1°–4964, 18.6°–2634, 19.2°–4087, 20.7°–1889, 21.5°–2956, 23.8°–2266, 25.2°–3716, 26.1°–2746, 28.2°–1832, 29.15°–2342, 34.45°–969, and 34.9°–1004.
A study by Saidman et al. [21] shows the XRD spectra for the polymorphic phases A and C of MEB. Comparing the two spectra of the polymorphic phases with the spectrum recorded by our team, one can notice a high degree of similarity. Moreover, the 2θ angles for three of the most intense diffraction peaks are very similar, namely 16.2°, 19.8°, and 24.79° obtained by Saidman et al. [21] compared to 16.15°, 19.7°, and 24.7°, respectively, reported in the current study.
The polymorphic phases A, B, and C of MEB were also investigated by Swanepoel et al. [46]. The MEB spectrum recorded in the present study is similar to the one previously reported for the polymorphic phase C of MEB. The same conclusion was drawn by Cami et al. [47], who comparatively presented the XRD spectra for the MEB polymorphic phases A and C as well as its mesylate and hydrochloride salts.
The mixture of MEB and HPBCD shows a similar behavior compared with the mixture obtained between FLU and HPBCD. The diffraction peaks recorded for the mixture include both the specific peaks of MEB as well as the two cyclodextrin broad bands. The angles for the three most intense bands are also preserved, namely 19.7°, 26.8°, and 24.7°, but a reduction in intensity clearly occurs, with values of 5734, 3403, and 3313, respectively.
In both cases, the diffraction spectra recorded for the combination of the drug (FLU or MEB) with HPBCD suggest the existence of a physical mixture between the two components of the formulation, the spectra being practically a summation of the individual spectra of the associated compounds.
Similar results were obtained by Geng et al. [48] for the physical mixtures of bensulfuron-methyl with BCD and 2-HPBCD, respectively. They comparatively presented the spectra recorded for bensulfuron-methyl, BCD, and 2-HPBCD, respectively, as well as for their physical mixture and inclusion complexes. The conclusion drawn by the authors was that the spectrum of physical mixtures was the sum of individual spectra recorded for the pure compounds, while for inclusion complexes, the number and intensity of peaks decreased and the formation of new peaks was reported.
Physical mixtures between duloxetine hydrochloride and HPBCD and SBEBCD (sulfobutileter BCD), respectively, were prepared by Kumar et al. [49] in order to prepare buco-adhesive tablets with systemic delivery of the active drug. The XRD spectrum for each component was compared to the one recorded for the corresponding physical mixture. The physical mixtures’ spectra presented an overlap of the peaks recorded for the mixture’s components, with the predominant profile of HPBCD due to its high ratio (81% w/w). In the current study, the molar ratio being 1:1, neither components can be considered predominant, but the presence of the drug may induce more intense peaks due to its high degree of crystallinity compared to the amorphous HPBCD.
Another interesting study that approached the characterization of some physical mixtures by X-ray diffraction also comparatively presented the formation of some inclusion complexes of cyanazine with HPBCD. This study, conducted by Gao et al. [50], reported a similar spectrum for the physical mixture to the one for cyanazine but with much lower intensities than those recorded for the pure compound. For the inclusion complex, a similar spectrum to the one recorded for the amorphous HPBCD was reported, thus suggesting the dispersion of cyanazine molecules within the HPBCD cavity.
According to the above presented data as a result of the X-ray diffraction analysis, HPBCD, FLU, and MEB were successfully identified. Taking into account that both XRD spectra recorded for the combinations of pure drugs with HPBCD clearly displayed the specific peaks of the respective crystalline drug, even if at a lower intensity, one can report the presence of physical mixtures between the two drugs and HPBCD, respectively. The experimental data could not demonstrate the formation of real inclusion complexes of drug:cyclodextrin probably due to the inability of the kneading method to achieve the cyclodextrin:drug complexes.

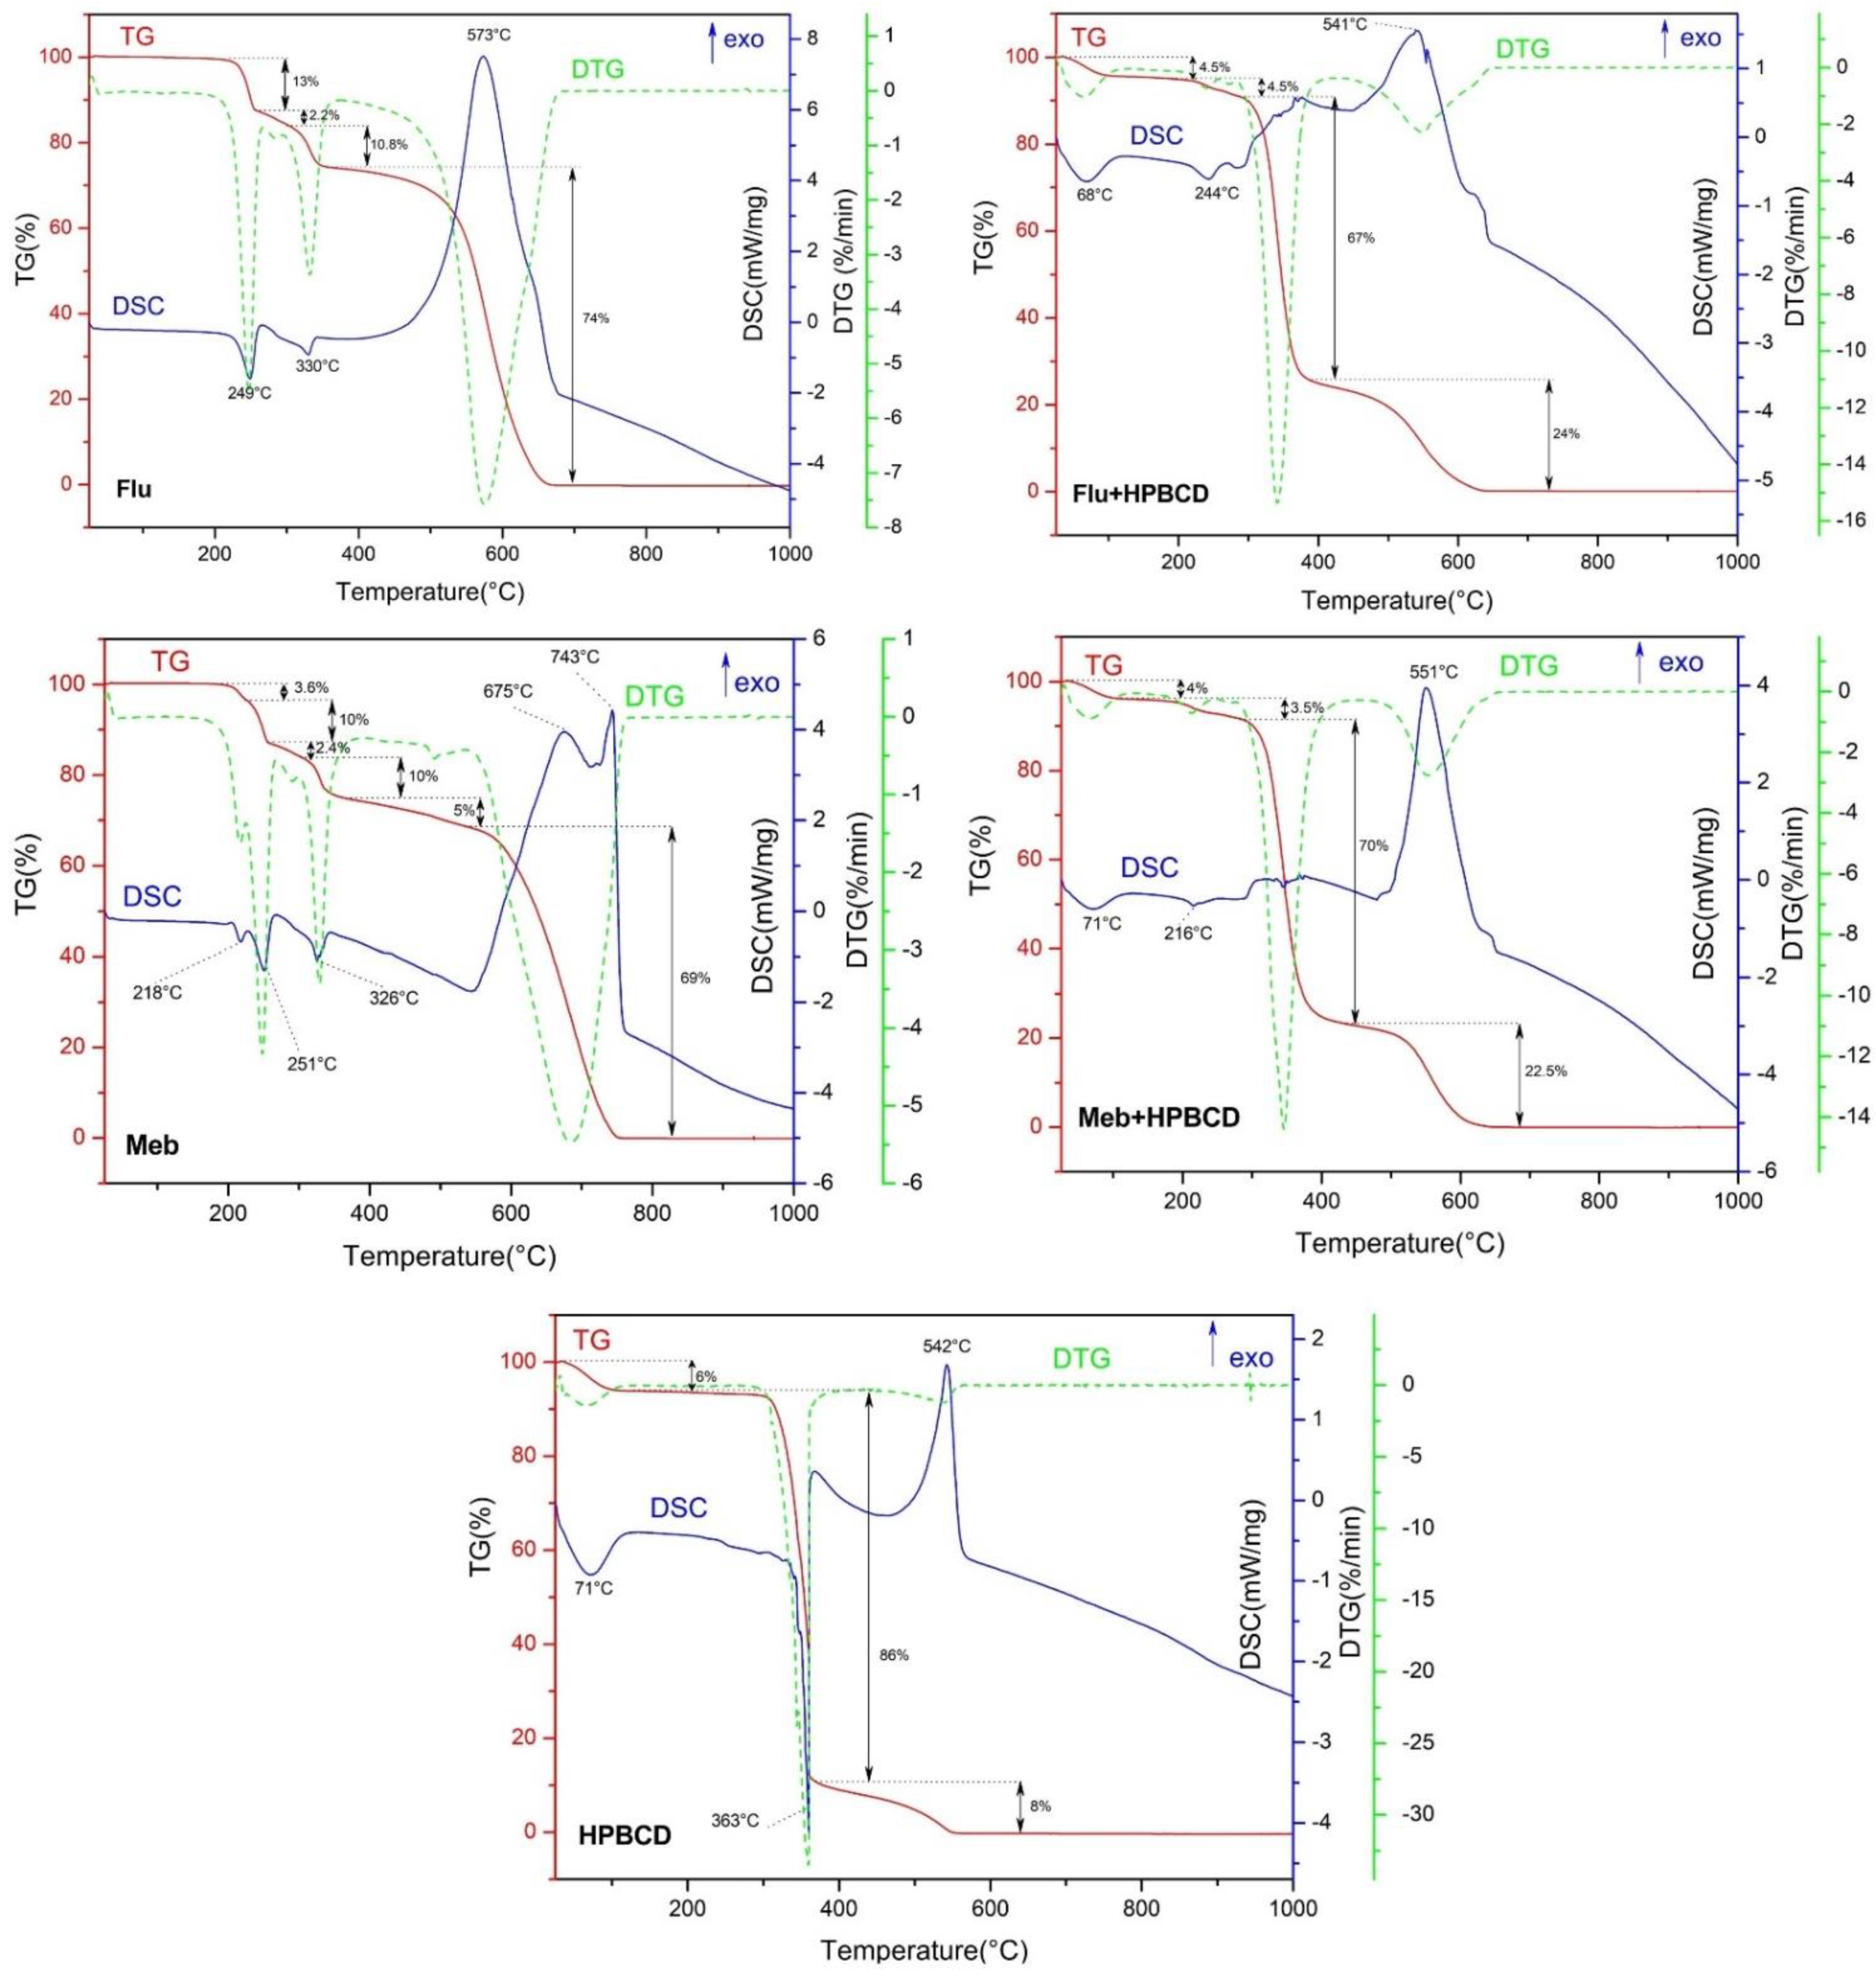
3.3. Thermal Analysis

For all the analyzed samples, the TG, DSC, and DTG curves were recorded in the 25°–1000 °C temperature range (Figure 5). For FLU, all three recorded heating profiles show the existence of one minor and three major stages. In the first stage, a 13% mass loss can be noted on the TG/DTG curve, which is associated with an endothermal effect located at 249 °C on the DSC curve. One less obvious stage is actually a slight change with 2.2% mass loss without any correspondence on the DSC curve, followed by a more pronounced loss of 10.8%, which is correlated with an endothermal process at 330 °C. The last stage is the one in which the mass loss reaches a value of 74%, the process leading to practically up to the zero mass, associated with an exothermic process that reaches the maximum at 573 °C. Similar results were reported by Al Nahary et al. [51], who studied the heating behavior of FLU, showing a highly similar decomposition pattern in the same three well-differentiated stages.
For MEB, six stages of various intensities were highlighted on the TG/DTG curves. The first two stages reside in the 200–300 °C temperature range, with 2 peaks at 218 °C and 251 °C, respectively, attributed to endothermic processes and correlated with mass loss (3.6% and 10%). The next stage can only be noted due to the variation on the DTG profile, the mass loss being merely 2.4%. Another endothermal peak at 326 °C is correlated with a mass loss of 10% while a fifth stage highlighted by TG/DTG is associated with a mass loss of 5% and a plateau appearance, without any peaks on the DSC curve. The last stage shows a mass loss of 69%, basically leading to zero mass, while on the DSC curve, one can notice two exothermic processes at 675 and 743 °C, respectively.
Holanda et al. [52] described the decomposition of MEB in five stages either consecutive and/or superimposed, also noting that MEB is stable up to a temperature of 203 °C. The stages presented in this study are similar to those depicted in the current study, the differences being justified by the endothermic or exothermic reactions that occur simultaneously and make some processes hardly visible. A study conducted by Garbuio et al. [53] comparatively presented the DSC thermograms for the MEB polymorphic phases A and C, in the temperature range of 25–400 °C. On the DSC curve, three processes were recorded for polymorph C: a less defined endothermic/exothermic thermal event with a maximum at 195 °C and two very clearly defined endothermic effects. The first well-defined endothermal effect is located at 253 °C and is followed by another endothermic effect with a maximum at 330 °C, which is associated with the melting of the compound. Similar thermal decomposition patterns, corelated with MEB’s polymorph C, were also reported by De Villiers et al. [54] and Calvo et al. [55], with slight variations. Collectively, previously published data confirm that the heating behavior of MEB in the current study corresponds to that of polymorph C.
The heating behavior of HPBCD shows three stages highlighted both in terms of TG/DTG mass variation and endothermic/exothermic effects on DSC. The first stage corresponds to a 6% mass loss associated with an endothermic effect located at 71 °C. The second stage’s highest mass loss (86%) is correlated with an intense endothermic effect that displays a maximum at 363 °C while the last stage produces a mass loss of 8%, indicating a rather intense exothermic effect with a maximum at 542 °C. Devine et al. [56] reported two endothermic processes for HPBCD on the DSC profile, the first located in the range of 25–103 °C and associated with water loss and the second between 280 and 340 °C and correlated with the cyclodextrin decomposition.
According to the TG/DTG mass variation, four steps are highlighted on the thermograms recorded for the mixture of FLU with HPBCD (Figure 5). Both individual heating behaviors of FLU and HPBCD can be identified on the mixture thermogram, thus suggesting the formation of a mechanical mixture. The first step is corelated by HPBCD degradation due to water loss followed by the already described FLU decomposition.
For the mixture of MEB with HPBCD, four stages are described in relation to the mass variation on the TG/DTG profile. As shown on the DSC curve, the first endothermal process is located at 71 °C and is correlated with a 4% mass loss (Figure 5). Similar to FLU, the first process derives from the decomposition of HPBCD while the second endothermal process is specific for the thermal degradation of MEB (Figure 5).
The same observations were reported by Devine et al. [56] regarding the thermal analysis of a physical mixture. They noted that, for the mixture consisting of RTC1 (4-(thiophen-2-yl)-1-(4-(4-(trifluoromethyl)phenyl)-piperazin-1-yl)butane-1-one) and HPBCD, the characteristic peaks of both RTC1 and HPBCD occur, with an endothermal maximum located at 94 °C due to RTC1 melting and a wide endothermal band between 25 and 103 °C indicating the loss of water from the HPBCD cavity. The authors concluded that no interaction occurred between the two components. Additionally, the study conducted by Rojas-Aguirre et al. [57] led to similar conclusions regarding the heating behavior of the physical mixture between 6-chloro-5-(1-naphthyloxy)-2-(trifluoromethyl)-1H-benzimidazole and HPBCD.
In our current case, the analyzed samples exhibited thermograms in accordance with those reported in the literature, thus being easily identifiable. The thermal analysis validates the nature of a physical mixture for the combinations of FLU and MEB with HPBCD, eliminating the possibility of an inclusion complexation, which would have required the occurrence of physicochemical interactions between the two components. Additionally, the thermal analysis data are consistent with the above-reported XRD results. The occurrence of physical mixtures can presumably be attributed to the use of the kneading method, which in this case was probably detrimental to achieving inclusion complexes.

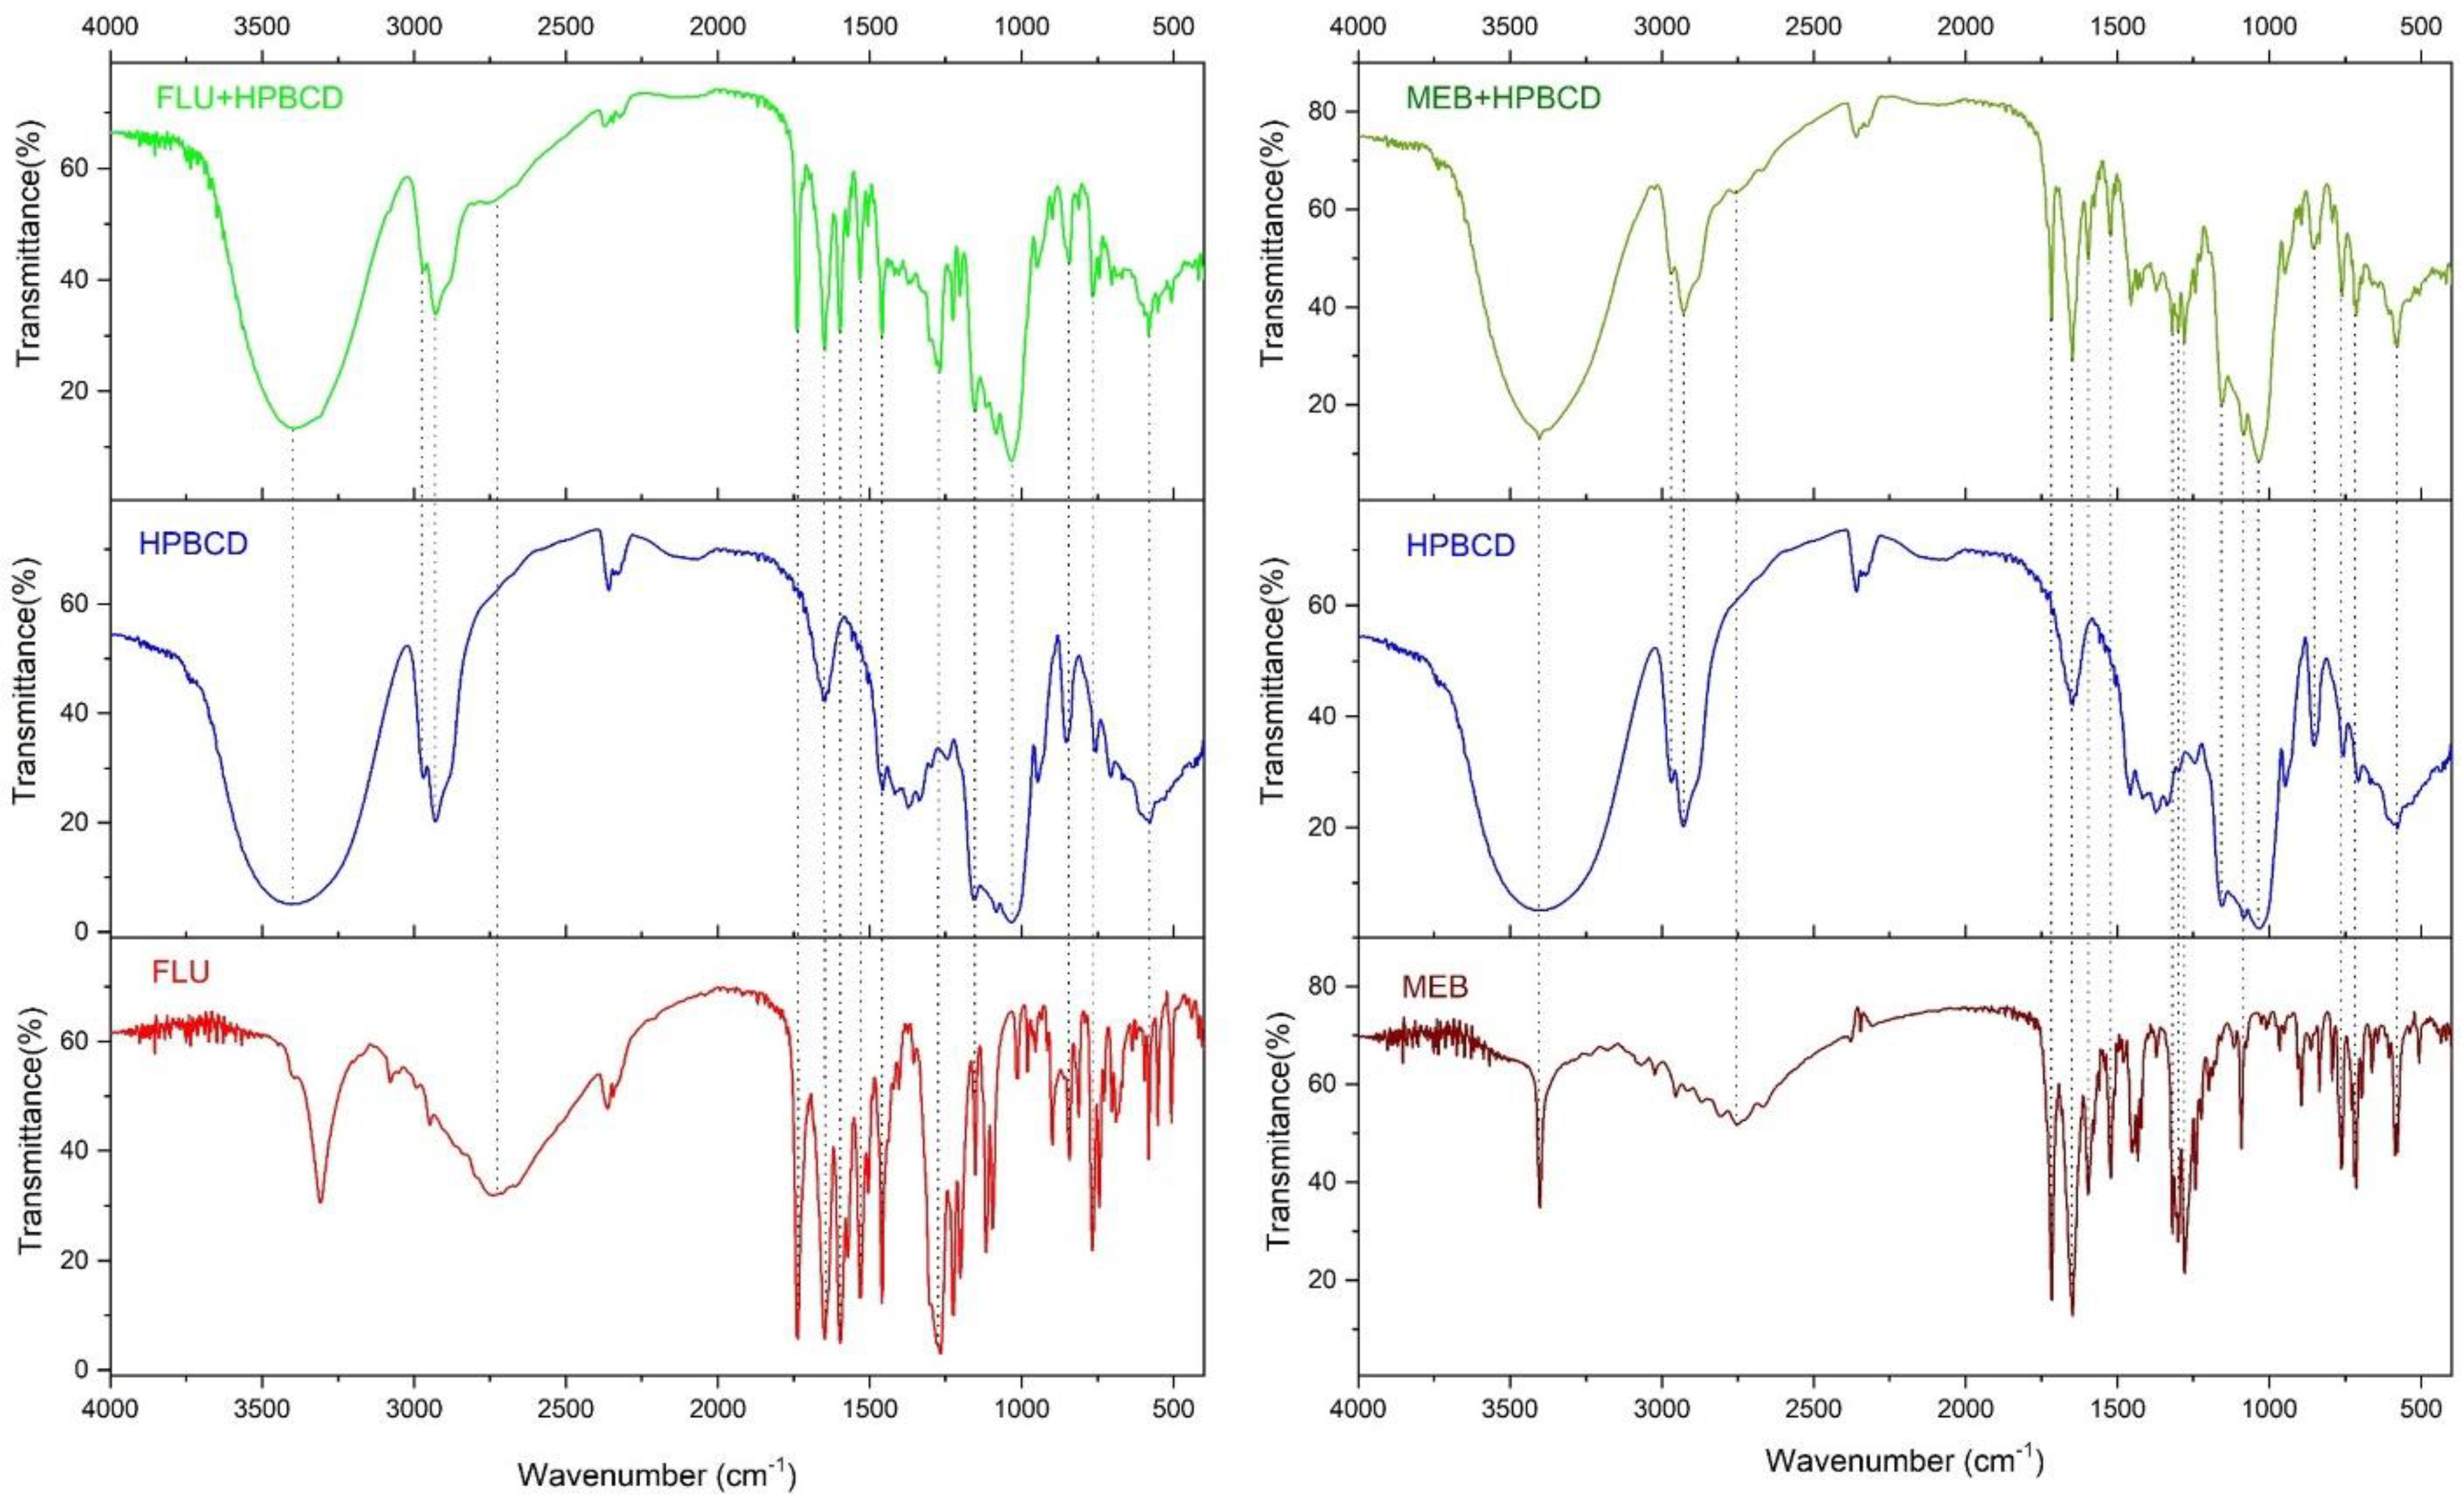
3.4. FTIR Spectroscopy

The FTIR specta for FLU and MEB were confirmed by comparison with spectraBase–Wiley, Spectrum ID G4QNNsCsCOb and Spectrum ID I27rgBxh3Gy (“SpectraBase” n.d.), which allowed the identification of all absorption bands. The bands identified for FLU on the IR spectrum are located at the wave numbers (cm−1) 3305, 3080, 2945, 2725, 1737, 1650, 1596, 1572, 1531, 1506, 1460, 1264, 1225, 1202, 1154, 1118, 1095, 1013, 983, 954, 897, 843, 812, 768, 743, 730, 702, 690, 636, 598, 583, 552, and 507. For MEB, the recorded absorption bands occur at the following wave numbers (cm−1): 3402, 3020, 2958, 2873, 2806, 2754, 1716, 1644, 1597, 1577, 1522, 1454, 1433, 1423, 1372, 1319, 1300, 1278, 1244, 1224, 1199, 1112, 1093, 1008, 966, 906, 894, 864, 835, 792, 761, 713, 696, 661, 605, 578, and 507.
For HPBCD, the IR spectrum shows absorption bands located at the following wave numbers (cm−1): 3405, 2970, 2928, 1652, 1458, 1417, 1376, 1337, 1244, 1157, 1084, 1032, 946, 853, 755, 707, and 577. The characteristic bands reported by Calvo et al. [55] for the polymorphic phase C of MEB are consistent with those reported in the current study: the 3404 cm−1 band was assigned to carbamate ν(N–H); the intense band at 1716 cm−1 corresponds to carbamate ν(C=O); at 1647 cm−1, a very intense band occurred due to the benzoyl ν(C=O); in-plane scissoring δ(N–H) vibrations appear at 1520 cm−1; while the corresponding band ν(N=C) of benzimidazole can be identified at 1371 cm−1.
The characteristic bands for HPBCD were depicted by Kumar et al. [49] as follows: at 3405 cm−1, associated with the –OH stretching vibration; at 2927 cm−1, attributed to the C–H stretch vibration of the CH and CH2 groups; at 1377 and 1159 cm−1, allocated to the C–H deformation vibration of the CH2OH and CHOH groups, respectively; and at 1031 cm−1, corresponding to the C–O–C group.
As one can see in Figure 6, the physical mixture between FLU/MEB and HPBCD shows absorption bands from both FLU or MEB spectra, respectively, as well as from the HPBCD spectrum, with some overlapping bands or a decrease in their intensity. This correspondence between the individual bands and those identified in the spectra of physical mixtures was highlighted on the graphs with a dotted line. Kumar et al. [58] came to the same conclusion, namely that the FTIR spectra of duloxetine with the cyclodextrins HPBCD and SBEBCD, respectively, show the overlapped characteristic bands of both the drug–duloxetine- and cyclodextrins–HPBCD or SBEBCD, respectively, without the occurrence of new absorption bands, which would have validated the formation of real inclusion complexes. Topal et al. [42] concluded that the FTIR spectrum of melatonin and HPBCD physical mixture does not differ significantly from the spectra of the pure components. Some significant differences in the spectrum of the inclusion complex have, however, been highlighted. Other studies also revealed the FT-IR spectrum of physical mixtures between various drugs and HPBCD, respectively, as an approximate overlap of individual components’ spectrum [41,48,59].
For the mixture of FLU with maleic acid, the important absorbing bands identifiable on the IR spectrum of FLU were highlighted. The vibration bands were assigned by De Araujo et al. [60] as follows: ν(N–H) of carbamate located at 3303 cm−1; ν(C=O) of carbamate located at 1736 cm−1; and ν(C=O) of benzoyl, ν(C=N), and ν(C=C) at 1594 cm−1. For pure FLU, the range of high frequencies is dominated by ν(C–H) vibrations, but an intense band at about 3303 cm−1 can be noticed, attributable to the carbamate ν(N–H). A very wide band between 2000 and 3600 cm−1 with a maximum at about 2700 cm−1 is also present on the spectrum and can be attributed to a stretching benzimidazole ν(N–H) vibration, which interacts through intramolecular hydrogen bonds with the carbonyl group of the carbamate moiety. This wide band was also identified on the spectrum recorded for the mixture of FLU and maleic acid. In summary, the spectra recorded for FLU, MEB, and HPBCD, respectively, were in agreement with the previously published data while the drug:cyclodextrin combinations revealed the absence of molecular interactions between components. Thus, one can state that the binary conjugates were physical mixtures of individual drugs with HPBCD, probably due to the kneading method employed to obtain the drug:cyclodextrin conjugates, which failed to achieve the inclusion phenomena.
Collectively, the three physico-chemical applied methods, XRD, TG-DTG-DSC, and FTIR, allowed the complete characterization of both the individual substances and their binary conjugates with the cyclodextrin. The results of the physicochemical assessments are consistent, supporting each other and converging to the same conclusion in terms of the physical mixture nature of the binary conjugates. Although other studies have successfully obtained cyclodextrin inclusion complexes of benzimidazole derivatives, they did not employ kneading as a preparation method but rather more effective technics, such as solvent evaporation, coprecipitation, or freeze drying [21,22,24,61,62]. Presumably, in the current study, the kneading method was not suitable for achieving actual inclusion complexes. Previous studies have reported failure of the kneading procedure in preparing cyclodextrin inclusion complexes. As a result, it was replaced in the respective studies with more effective methods, which presumably ensured more intimate intermolecular interactions [63]. As an example, a similar work was reported by our group focusing on chlorthalidone-hydroxypropyl-β-cyclodextrin binary systems, where the kneading method clearly failed to produce inclusion complexes, being far less inferior to spray-drying [64].

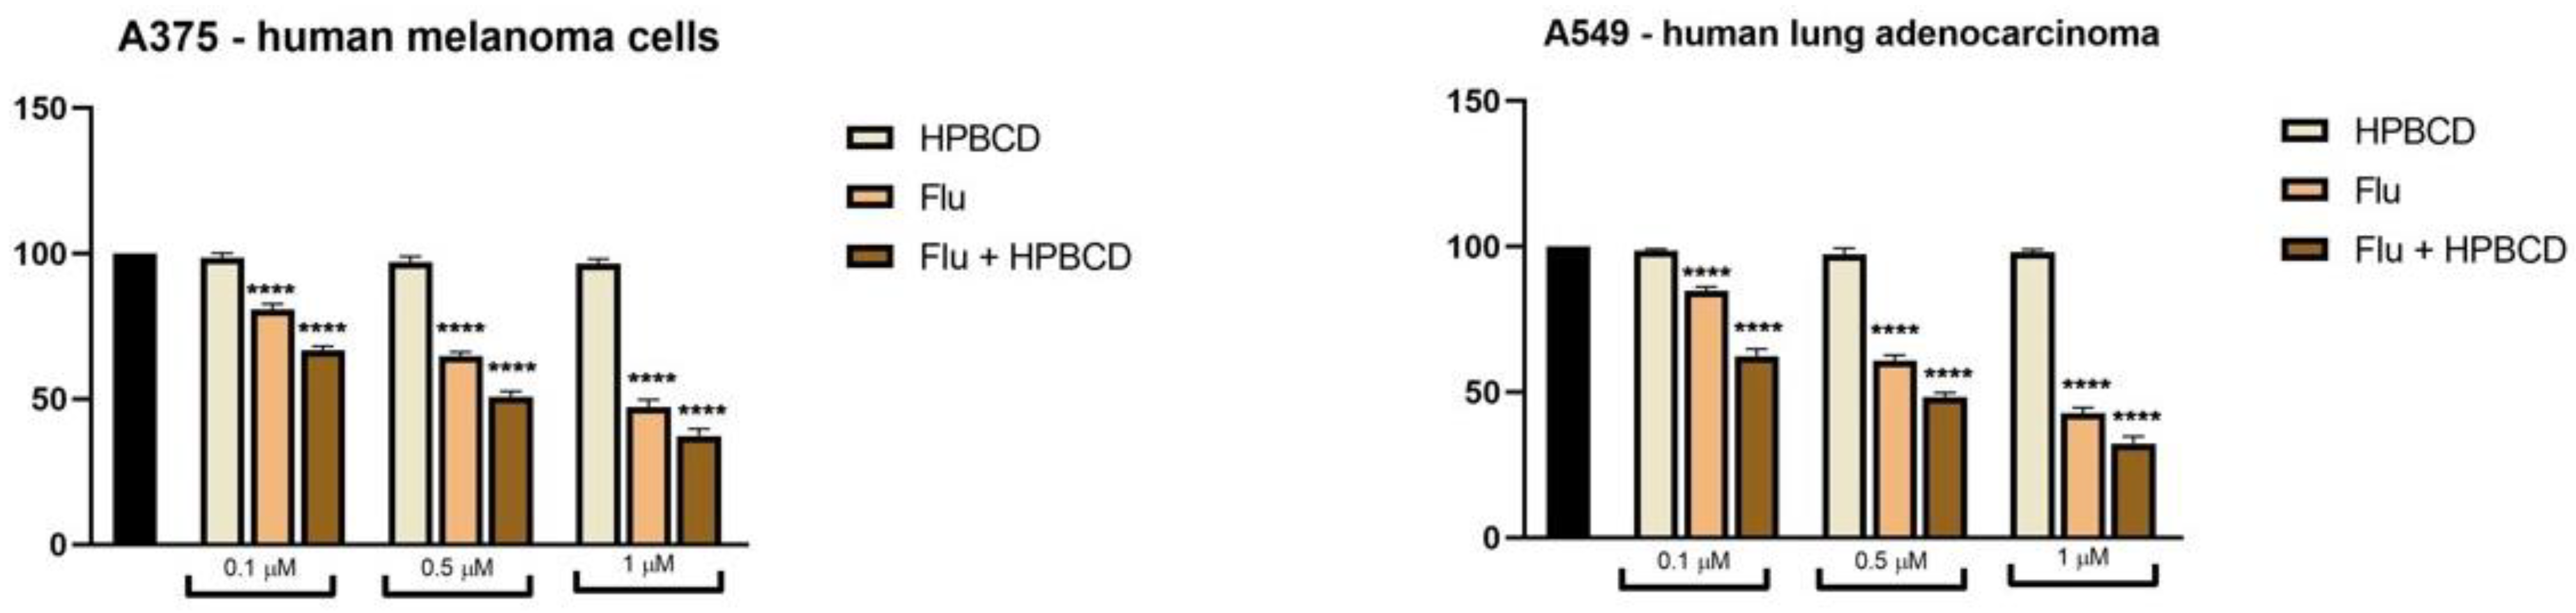
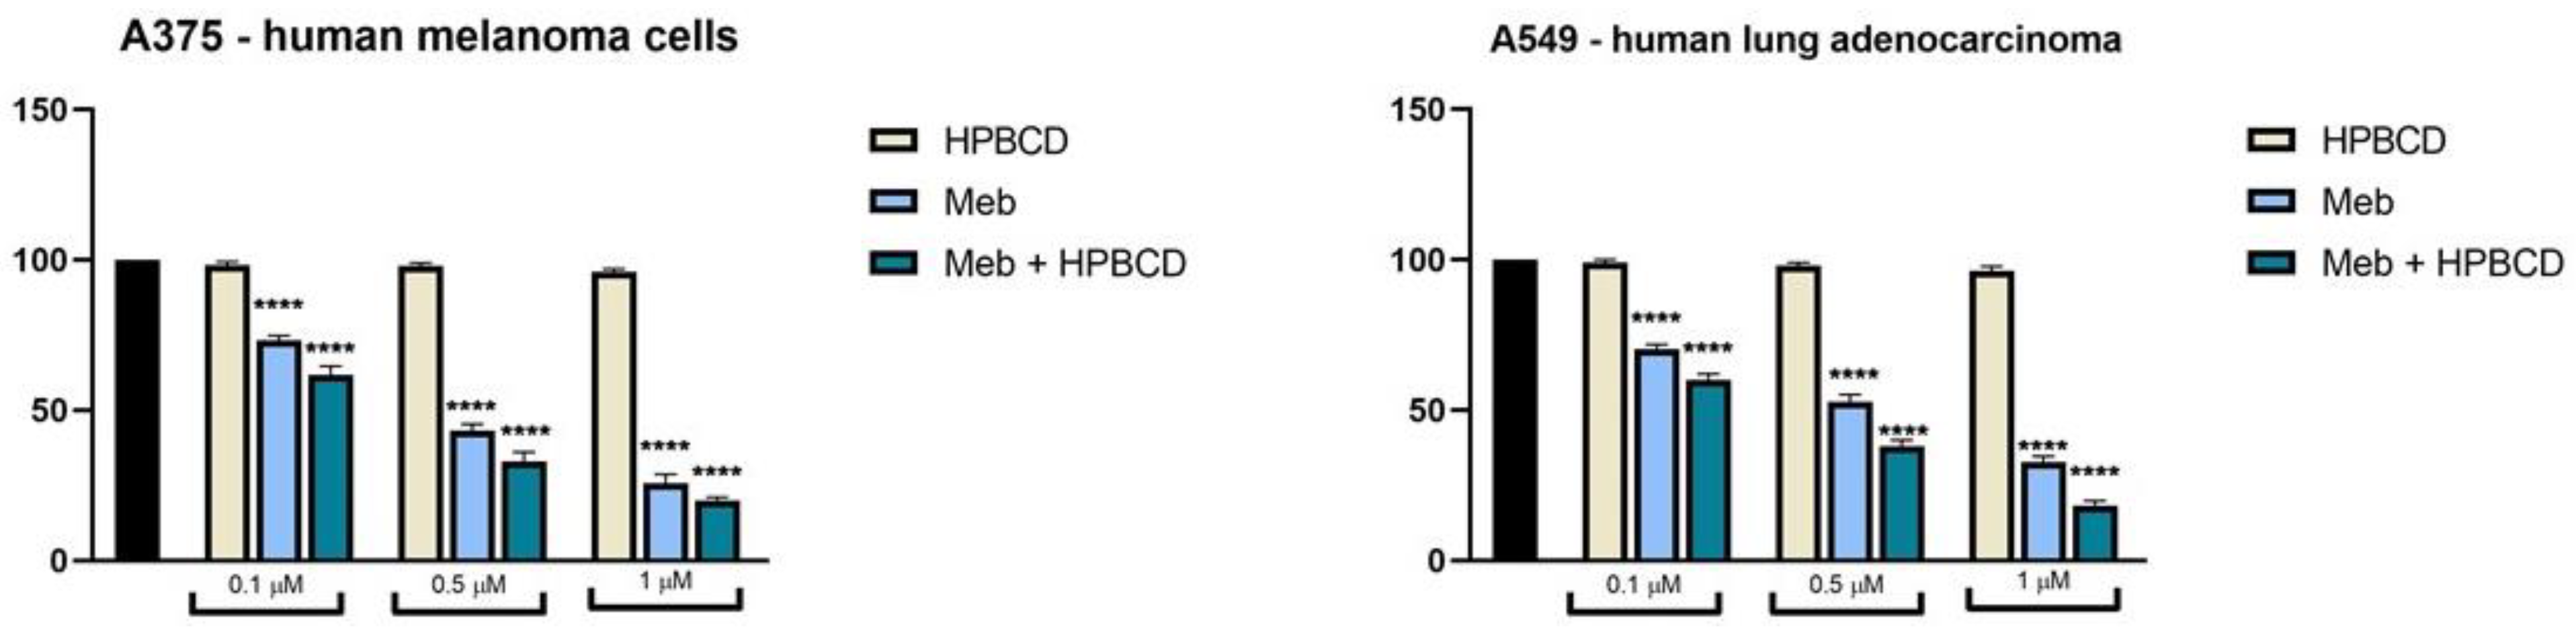
3.5. FLU and MEB Exert Dose-Dependent Cytotoxic Effects

In order to test the effect on the cell viability of FLU and MEB as well as their combination with HPBCD, the MTT technique was performed, using two tumor cell lines: human melanoma-A375 and pulmonary adenocarcinoma-A549. HPBCD was also tested in the same concentrations as the active substances to determine its potential cytotoxic effect.
In the tested cell lines (A375 and A549), stimulation for 72 h with FLU caused a dose-dependent reduction in the cell viability percentage compared to the control represented by unstimulated cells (Figure 7). The decrease in cell viability was observed starting with the lowest concentration tested (0.1 μM), of approximately 81% in the case of A375, respectively 85% in the case of A549. However, the most intense effect on decreased cell viability, in the case of FLU, was recorded at a concentration of 1 μM, with the cell viability being approximately 47% for A375 cells and 43% for A549 cells. Regarding the FLU + HPBCD combination, it is observed that it exerts a cytotoxic effect dependent on the concentration and much stronger than in the case of FLU alone. Thus, all tested concentrations induced a decrease in cell viability with approximately 10–15% more than FLU alone. At the highest concentration tested by FLU + HPBCD, the cell viability recorded for A375 was about 37%, and in the case of A549, about 32%. On the other hand, HPBCD does not exert an obvious cytotoxic effect, with the cell viability resembling that of control cells.
Similar to FLU, the stimulation for 72 h with MEB produced a dose-dependent decrease in cell viability, which was observed in both cell lines studied (Figure 8). However, MEB had a more pronounced cytotoxic effect than FLU, with the cell viability at the lowest concentration tested being approximately 73% for A375 and 70% for A549. At the highest concentration tested (1 μM), there is a sharp decrease in cell viability, with the percentage of viable cells being about 26% for A375 and 32% for A549. Concerning the combination of MEB + HPBCD, it has a more pronounced cytotoxic effect than MEB alone, with A375 and A549 cells showing a dramatic decrease in cell viability. In the case of the 1 μM concentration, the value of cell viability recorded for A375 was approximately 20% and for A549, approximately 18%. The cytotoxic effect exerted by HPBCD was negligible, the cell viability in this case being similar to that observed in the case of control cells.
The beneficial effect of HPBCD in terms of the increased antiproliferative activity of the binary conjugates against the melanoma cell lines may be attributed to the increased amount of drug that becomes available for the biological effect as a result of cyclodextrin association. In the presence of the highly hydrophilic HPBCD, the water solubility of the pure drugs increases, even in the absence of complex formation, and, subsequently, the drug reaches higher concentrations in the aqueous biologic in vitro environment, thus exhibiting stronger cytotoxic effects. Contrary to previous studies that reported the antiproliferative effect of another β-cyclodextrin derivative, methyl-β-cyclodextrin, able to inhibit the growth of breast and ovarian cancer cells (Grosse 1998), in the current study, HPBCD lacked any biological activity on both types of cancer cells. Moreover, the cyclodextrin also proved to be non-toxic on the healthy cell line HaCaT-immortalized human keratinocytes (data not shown). The lack of toxicity was previously reported for HPBCD, which also induces a longer lasting drug inhibitory effect [65]. This study also indicated that cyclodextrin may optimize drug delivery to the cell by disrupting the cell membrane through the complexation of phospholipids, cholesterol, and proteins. The literature also reports the formation of drug:cyclodextrin non-inclusion complexes that leave the active drug outside the cyclodextrin’s cavity but are capable of significantly increasing its biological activity [66]. In addition, cyclodextrins may form aggregates or may facilitate the formation and stabilization of supersaturated solutions [67]. In the current study, regardless of the nature of the drug:cyclodextrin association in solution, the presence of HPBCD clearly contributed to an increased antiproliferative activity against the targeted cells.

3.6. Molecular Docking

Ligand-based molecular docking is a computational technique that can be used, among other methods, as a starting point for understanding the targeted mechanism of action of a given molecular structure. The obtained results, in the form of free binding energy values, may indicate an increased/decreased affinity of the analyzed molecule towards the selected target compared to the native ligand (a known inhibitor), given that the binding energy decreases when the compounds’ affinity increases. For our current study, we used a method based on a molecular docking protocol to identify possible protein targets for the two benzimidazole derivatives, whose inhibition could be correlated with their in vitro antiproliferative activity. The chosen targets were key enzymes involved in the signaling pathways often overexpressed in various types of cancer. Our selected set of proteins included: apoptosis regulator Bcl-2 (Bcl-2), apoptosis regulator Bcl-X (Bcl-XL), epidermal growth factor receptor 1 (EGFR1), vascular endothelial growth factor receptor 2 (VEGFR2), RAC-alpha serine/threonine-protein kinase (AKT1), mammalian target of rapamycin target of rapamycin complex subunit LST8 (mTOR-LST8), phosphatidylinositol 4,5-bisphosphate 3-kinase catalytic subunit gamma isoform (PI3Kγ), dual specificity mitogen-activated protein kinase 1 (MEK1), and mitogen-activated protein kinase 1 (ERK2).
The results obtained indicate an increased affinity of MEB and FLU towards target proteins, such as VEGFR2, mTOR, MEK1, or ERK2, where the difference between the ∆G values for the tested compounds and the native ligands was below 1 kcal/mol (Table 2). In the case of VEGFR2, the results are consistent with the available literature. A study focused on assessing the pharmacological potency of MEB in different medulloblastoma models showed that the benzimidazole derivative interferes with VEGFR2 kinase by competing with ATP [68]. A more recent study aimed to propose a selection of pharmaceutically active substances to be repositioned as VEGFR2 inhibitors [69]. Following a virtual screening protocol, the selected compounds were further assessed to validate their predicted biological effect. FLU was identified as the most potent VEGFR2 inhibitor in this study, with an IC50 value of 0.47 μM.
In the case of mTOR, there are no available biological data that would suggest the direct inhibitory potential of the two benzimidazole derivatives towards mTOR kinase. However, a thorough study conducted to identify autophagy-inducing compounds concluded that FLU inhibits mTOR activity by microtubule dynamic disruption and by inhibiting upstream phosphorylation of AKT1 to a lesser extent. This is consistent with a recent study that also reported FLU’s antitumor effect by autophagy promotion via mTOR inhibition [70]. Western blot data on HCT116 cells stimulated with FLU showed a concentration-dependent reduction of p-mTOR activity while the activity of unphosphorylated mTOR was not affected.
An interesting case are the results obtained for ERK2 and especially MEK1, where both compounds obtained better scores compared to the native ligands (lower ∆G values). There is little biological data regarding the targeted activity of FLU on the MAPK pathway. However, FLU seems to have an inhibitory effect on some bacterial MAP kinases, analogs of human of MEK1/2 [71]. At the same time, the inhibitory activity of MEB on MEK/ERK is supported by biological results available in the literature. MEB seems to synergistically improve the effects of the MEK inhibitors trametinib and sorafenib in different types of cancer, such as hepatocellular carcinoma or NRAS refractory melanoma [72,73]. One of these studies also reports that MEB targeted downstream signaling of the MAPK pathway by inhibiting ERK1/2 phosphorylation [72].
Considering that both MEB and FLU obtained better docking scores for MEK1 as compared to the native ligand (Mirdametinib), binding interactions formed at the binding site are, however, quite different (Figure 9). Mirdametinib forms hydrogen bonds (HBs) with Ser212/Val211, Lys97, and ATP, while MEB and FLU are not bound within the interaction distance of ATP, and are mostly stabilized through hydrophobic interactions but also form HB with Asp208 (MEB, FLU), Asn78, and Phe209 (FLU). These scores do not suggest that the two compounds exert a stronger affinity towards MEK1 than Mirdametinib, because there are a lot of biological factors that computational methods cannot predict but taken together with existing biological data, we can propose that one of the mechanisms by which MEB and FLU act as antiproliferative agents is via MEK/ERK inhibition.

3.7. High-Resolution Respirometry Studies in Permeabilized Cells

Research efforts conducted in the last two decades uncovered that mitochondria are at the center of many cellular processes that control and influence cancer cell development, growth, and invasion. As a result, present studies are aimed at investigating compounds that target mitochondrial function and induce, through many possible mechanisms, mitochondrial dysfunction that will ultimately lead to cancer cell death.
The objective of the current study was to analyze the effects of MEB and FLU, given alone or in combination with HPBCD, as binary 1:1 conjugates, on mitochondrial respiration in permeabilized A375 human melanoma cells and A549 non-small cell lung cancer cells. The results showed that in the A375 cell line, the treatment with MEB and FLU (Figure 10) was able to significantly decrease the active respiration in the presence of CI and CII substrates (OXPHOS CI+II) and the maximal electron transport system capacity (ETS CI+II and ETS CII), suggesting mitochondrial respiratory inhibition. A slightly higher decrease could be observed when the compounds, MEB and FLU, were formulated with HPBCD.
In the A549 cell line, we observed a decreased tendency of these parameters when MEB and FLU were tested alone, but no statistical significance was reached (Figure 10). However, the formulation of MEB and FLU with HPBCD significantly improved their inhibitory effect in this cell line (Figure 10). Moreover, the combination of the two substances formulated with HPBCD (MEB + FLU + HPBCD) produced the highest degree of mitochondrial inhibition in both cell lines, observed by the decrease of OXPHOS CI, OXPHOS CI+II, and ETS CI+II (Figure 10 and Figure 11).
As recently demonstrated, and so far, overlooked in cancer cells, the mitochondrial respiration (OXPHOS) contribution for ATP production and metabolism is substantial. Although, as a result of metabolic reprograming, cancer cells rely on glycolysis to meet their rapid and high energy demand, it seems that the glycolytic contribution of the total ATP production is 50–60% [74]. However, the metabolic reprograming is more complex and depends on the type of cancer cell. More specifically, numerous studies have provided evidence that the actively proliferating cancer cells/bulk of tumor cells rely on both glycolysis and OXPHOS, whereas cancer stem cells, responsible for metastasis and drug resistance, rely on OXPHOS [75,76]. Considering the crucial role of OXPHOS for cancer cell metabolism and as supported by numerous studies, the inhibition of mitochondrial respiration is a desirable effect to be produced by a substance in cancer settings [77,78].
Another aspect worth mentioning is that both substances, associated or not with HPBCD, given alone or together, seem to have a higher effect on active respiration dependent on CI+II (Figure 9 and Figure 10). This effect might occur as a consequence of MEB’s and FLU’s action on certain mitochondrial enzymes. As demonstrated by the group of Van Den Bossche et al. [79], numerous benzimidazole derivatives, including MEB, inhibit fumarate reductase and succinate dehydrogenase. Therefore, this inhibition can stop the electron transfer via C II (succinate dehydrogenase) to the rest of the mitochondrial electron transport chain and can be responsible for the above-mentioned observed effects.
In addition, the substance association and formulation with HPBCD (MEB + FLU + HPBCD) decreased the routine respiration and leak respiration (State 4 CI+II) in the A375 cell line (Figure 9). These are promising results considering that in melanoma cells, both routine and leak respiration are higher than in normal melanocytes [80]. The decrease of routine respiration observed after the treatment with MEB + FLU + HPBCD could suggest that this association directly produces mitochondrial injuries or decreases the cancer cell energy demand and ATP turnover. Given that “energy production is a response to energy demand in the cell” [81] and the above-described direct inhibitory effect on mitochondrial respiration, MEB + FLU + HPBCD association highly limits the ATP availability, clearly needed in the settings of increased cancer cell metabolism, thus leading to severe impairments in cancer cell function and viability.

3.8. CAM Assay

The potential irritative effects of MEB, FLU and their HPBCD conjugates (10 mM) on mucosal tissues was assessed in ovo using the chorioallantoic membrane of the chick embryo and the HET-CAM assay. The protocol was focused on the monitorization for 300 s, by means of a stereomicroscope, of the potential damage (hemorrhage, lysis, and coagulability events) induced by the tested compounds. The results were interpreted according to the Luepke scale: 0–0.9–non-irritant, 1–4.9 weak irritant, 5–8.9 moderate irritant, and 9–21 strong irritant [82]. The positive control used here, SLS 1%—a known strong irritant— produced an IS of 18.56. In contrast, we observed no irritative effects after the treatment with 10 mM HPBCD (Table 3, Figure 11). Moreover, all the tested samples, MEB, FLU, and their HPBCD conjugates did not produce any negative effects on the evaluated vascular parameters, and did not induce any irritative events (Table 3, Figure 12). Therefore, with an irritation score of 0.0, these compounds as well as their binary conjugates with HPBCD can be considered as a non-irritant and biocompatible with mucosal tissues.

4. Conclusions

The current study aimed to assess the influence of a hydrophilic cyclodextrin, HPBCD, upon the cytotoxic activity of two benzimidazole drugs, MEB and FLU, against melanoma and pulmonary adenocarcinoma cells. The binary 1:1 conjugates were physico-chemically evaluated through XRD, thermal analysis, and FTIR spectroscopy, revealing the absence of intermolecular interactions and, subsequently, the formation of physical mixtures, which most likely occurred due to the preparation method chosen. However, the aqueous solubility of both benzimidazole derivatives significantly increased in the presence of the cyclodextrin, presumably due to its hydrophilic nature, which allows the transport of a higher amount of active drug into solution and, consequently, into the living cells. The in vitro analysis clearly showed an increased cytotoxic activity of both drugs when applied as binary conjugates with cyclodextrin on melanoma and lung cancer cells while normal cells remained unaffected. Molecular docking analysis showed that one of the mechanisms related to MEB and FLU cytotoxic activity may consist of the inhibition of MEK/ERK. As reported by high-resolution respirometry studies, both MEB and FLU, as well their formulation with HPBCD, produced significant mitochondrial respiratory inhibition in both cell lines. In the in vivo chorioallantoic membrane model, MEB, FLU, and their HPBCD conjugates did not showed any irritating effect on the membrane; thus, they can be considered to be biocompatible with mucosal tissues. This study advances the knowledge in the field of drug repurposing by bringing new evidence of an increased solubility and biological effect of two classical anti-helminthic drugs, MEB and FLU, as potential anticancer drugs.

Author Contributions

Conceptualization, C.T., C.B. and C.S.; methodology, A.V., A.M. (Andrei Motoc); software, A.V. and M.M.; validation, A.M. (Andrei Motoc), C.T. and C.S.; formal analysis, D.M., A.M. (Alexandra Mioc), R.R., M.M., I.M. and S.A.; investigation, D.M., A.M. (Alexandra Mioc), R.R., I.M. and S.A.; resources, C.B., C.S. and C.T.; data curation, C.B. and C.S.; writing—original draft preparation, D.M. and A.M. (Alexandra Mioc); writing—review and editing, C.T.; visualization, C.T.; supervision, C.B., C.S. and C.T.; funding acquisition, C.S. All authors have read and agreed to the published version of the manuscript.

Funding

This research was funded by an Internal grant at “Victor Babes” University of Medicine and Pharmacy, Grant 1EXP/1233/30.01.2020 LUPSKINPATH, Project Manager: Codruta Soica.

Institutional Review Board Statement

Not applicable.

Informed Consent Statement

Not applicable.

Conflicts of Interest

The authors declare no conflict of interest.

References

  1. Geary, T.G.; MacKenzie, C.D.; Silber, S.A. Flubendazole as a macrofilaricide: History and background. PLoS Negl. Trop. Dis. 2019, 13, e0006436. [Google Scholar] [CrossRef] [Green Version]
  2. Laclette, J.; Guerra, G.; Zetina, C. Inhibition of tubulin polymerization by Mebendazole. Biochem. Biophys. Res. Commun. 1980, 92, 417–423. [Google Scholar] [CrossRef]
  3. Guerini, A.E.; Triggiani, L.; Maddalo, M.; Bonù, M.L.; Frassine, F.; Baiguini, A.; Alghisi, A.; Tomasini, D.; Borghetti, P.; Pasinetti, N.; et al. Mebendazole as a Candidate for Drug Repurposing in Oncology: An Extensive Review of Current Literature. Cancers 2019, 11, 1284. [Google Scholar] [CrossRef] [Green Version]
  4. Popović, D.J.; Poša, M.; Popović, K.J.; Kolarović, J.; Popović, J.K.; Banović, P. Application of a widely-used tropical anti-worm agent, mebendazole, in modern oncology. Trop. J. Pharm. Res. 2017, 16, 2555–2562. [Google Scholar] [CrossRef]
  5. Huang, H.; He, Q.; Guo, B.; Xu, X.; Wu, Y.; Li, X. Progress in Redirecting Antiparasitic Drugs for Cancer Treatment. Drug Des. Dev. Ther. 2021, 15, 2747–2767. [Google Scholar] [CrossRef]
  6. Son, D.-S.; Lee, E.-S.; Adunyah, S.E. The Antitumor Potentials of Benzimidazole Anthelmintics as Repurposing Drugs. Immune Netw. 2020, 20, e29. [Google Scholar] [CrossRef] [PubMed]
  7. Nath, J.; Paul, R.; Ghosh, S.K.; Paul, J.; Singha, B.; Debnath, N. Drug repurposing and relabeling for cancer therapy: Emerging benzimidazole antihelminthics with potent anticancer effects. Life Sci. 2020, 258, 118189. [Google Scholar] [CrossRef] [PubMed]
  8. Pantziarka, P.; Bouche, G.; Meheus, L.; Sukhatme, V.; Sukhatme, V.P. Repurposing Drugs in Oncology (ReDO)-mebendazole as an anti-cancer agent. Ecancermedicalscience 2014, 8, 443. [Google Scholar] [CrossRef]
  9. Williamson, T.; de Abreu, M.C.; Trembath, D.G.; Brayton, C.; Kang, B.; Mendes, T.B.; de Assumpção, P.P.; Cerutti, J.M.; Riggins, G.J. Mebendazole disrupts stromal desmoplasia and tumorigenesis in two models of pancreatic cancer. Oncotarget 2021, 12, 1326–1338. [Google Scholar] [CrossRef] [PubMed]
  10. Skibinski, C.G.; Williamson, T.; Riggins, G.J. Mebendazole and radiation in combination increase survival through anticancer mechanisms in an intracranial rodent model of malignant meningioma. J. Neuro-Oncol. 2018, 140, 529–538. [Google Scholar] [CrossRef] [PubMed]
  11. Andersson, C.R.; Selvin, T.; Blom, K.; Rubin, J.; Berglund, M.; Jarvius, M.; Lenhammar, L.; Parrow, V.; Loskog, A.; Fryknäs, M.; et al. Mebendazole is unique among tubulin-active drugs in activating the MEK–ERK pathway. Sci. Rep. 2020, 10, 13124. [Google Scholar] [CrossRef]
  12. Xie, X.; Cai, X.; Tang, Y.; Jiang, C.; Zhou, F.; Yang, L.; Liu, Z.; Wang, L.; Zhao, H.; Zhao, C.; et al. Flubendazole Elicits Antitumor Effects by Inhibiting STAT3 and Activating Autophagy in Non-small Cell Lung Cancer. Front. Cell Dev. Biol. 2021, 9, 2260. [Google Scholar] [CrossRef] [PubMed]
  13. Hou, Z.-J.; Luo, X.; Zhang, W.; Peng, F.; Cui, B.; Wu, S.-J.; Zheng, F.-M.; Xu, J.; Xu, L.-Z.; Long, Z.-J.; et al. Flubendazole, FDA-approved anthelmintic, targets breast cancer stem-like cells. Oncotarget 2015, 6, 6326–6340. [Google Scholar] [CrossRef] [Green Version]
  14. Chai, J.-Y.; Jung, B.-K.; Hong, S.-J. Albendazole and Mebendazole as Anti-Parasitic and Anti-Cancer Agents: An Update. Korean J. Parasitol. 2021, 59, 189–225. [Google Scholar] [CrossRef] [PubMed]
  15. Santiago, T.; de la Torre-Iglesias, P.M.; Torrado, G.; Torrado, S.; Bolas, F.; Garcia, J.J. Enhanced bioavailability and anthelmintic efficacy of mebendazole in redispersible microparticles with low-substituted hydroxypropylcellulose. Drug Des. Dev. Ther. 2014, 8, 1467–1479. [Google Scholar] [CrossRef] [PubMed] [Green Version]
  16. Chaudhary, S.; Garg, T.; Rath, G.; Murthy, R.R.; Goyal, A.K. Enhancing the bioavailability of mebendazole by integrating the principles solid dispersion and nanocrystal techniques, for safe and effective management of human echinococcosis. Artif. Cells Nanomed. Biotechnol. 2016, 44, 937–942. [Google Scholar] [CrossRef]
  17. Studenovský, M.; Rumlerová, A.; Kostka, L.; Etrych, T. HPMA-Based Polymer Conjugates for Repurposed Drug Mebendazole and Other Imidazole-Based Therapeutics. Polymers 2021, 13, 2530. [Google Scholar] [CrossRef]
  18. Xu, S.; Zhang, X.; Yao, X.; Cai, Y. Synthesis of chloromethyl benzimidazole grafted polybenzimidazole with enhanced UV absorption and its effect as a stabilizer on the ultraviolet-aging behaviors of poly(vinyl chloride) films. J. Appl. Polym. Sci. 2019, 136, 47626. [Google Scholar] [CrossRef]
  19. Zimmermann, S.C.; Tichý, T.; Vávra, J.; Dash, R.P.; Slusher, C.E.; Gadiano, A.J.; Wu, Y.; Jančařík, A.; Tenora, L.; Monincová, L.; et al. N-Substituted Prodrugs of Mebendazole Provide Improved Aqueous Solubility and Oral Bioavailability in Mice and Dogs. J. Med. Chem. 2018, 61, 3918–3929. [Google Scholar] [CrossRef]
  20. Real, D.; Leonardi, D.; Williams, R.O.; Repka, M.A.; Salomon, C.J. Solving the Delivery Problems of Triclabendazole Using Cyclodextrins. AAPS PharmSciTech 2018, 19, 2311–2321. [Google Scholar] [CrossRef]
  21. Saidman, E.; Chattah, A.K.; Aragón, L.; Sancho, M.; Camí, G.; Garnero, C.; Longhi, M. Inclusion complexes of β-cyclodextrin and polymorphs of mebendazole: Physicochemical characterization. Eur. J. Pharm. Sci. 2019, 127, 330–338. [Google Scholar] [CrossRef] [PubMed]
  22. Lahiani-Skiba, M.; Coquard, A.; Bounoure, F.; Vérité, P.; Arnaud, P.; Skiba, M. Mebendazole complexes with various cyclodextrins: Preparation and physicochemical characterization. J. Incl. Phenom. Macrocycl. Chem. 2007, 57, 197–201. [Google Scholar] [CrossRef]
  23. Ceballos, L.; Moreno, L.; Torrado, J.J.; Lanusse, C.; Álvarez, L. Exploring flubendazole formulations for use in sheep. Pharmacokinetic evaluation of a cyclodextrin-based solution. BMC Vet. Res. 2012, 8, 71. [Google Scholar] [CrossRef] [Green Version]
  24. Michaelis, M.; Agha, B.; Rothweiler, F.; Löschmann, N.; Voges, Y.; Mittelbronn, M.; Starzetz, T.; Harter, P.N.; Abhari, B.A.; Fulda, S.; et al. Identification of flubendazole as potential anti-neuroblastoma compound in a large cell line screen. Sci. Rep. 2015, 5, 8202. [Google Scholar] [CrossRef] [PubMed]
  25. Ceballos, L.; Alvarez, L.; Mackenzie, C.; Geary, T.; Lanusse, C. Pharmacokinetic comparison of different flubendazole formulations in pigs: A further contribution to its development as a macrofilaricide molecule. Int. J. Parasitol. Drugs Drug Resist. 2015, 5, 178–184. [Google Scholar] [CrossRef] [Green Version]
  26. Priotti, J.; Baglioni, M.V.; García, A.; Rico, M.J.; Leonardi, D.; Lamas, M.C.; Márquez, M.M. Repositioning of Anti-parasitic Drugs in Cyclodextrin Inclusion Complexes for Treatment of Triple-Negative Breast Cancer. AAPS PharmSciTech 2018, 19, 3734–3741. [Google Scholar] [CrossRef] [Green Version]
  27. Carneiro, B.A.; El-Deiry, W.S. Targeting apoptosis in cancer therapy. Nat. Rev. Clin. Oncol. 2020, 17, 395–417. [Google Scholar] [CrossRef]
  28. Drosten, M.; Barbacid, M. Targeting the MAPK Pathway in KRAS-Driven Tumors. Cancer Cell 2020, 37, 543–550. [Google Scholar] [CrossRef]
  29. Press, M.F.; Lenz, H.-J. EGFR, HER2 and VEGF Pathways: Validated targets for cancer treatment. Drugs 2007, 67, 2045–2075. [Google Scholar] [CrossRef]
  30. Porta, C.; Paglino, C.; Mosca, A. Targeting PI3K/Akt/mTOR Signaling in Cancer. Front. Oncol. 2014, 4, 64. [Google Scholar] [CrossRef] [Green Version]
  31. Macașoi, I.; Pavel, I.Z.; Moacă, A.E.; Avram, Ș.; David, V.L.; Coricovac, D.; Mioc, A.; Spandidos, D.A.; Tsatsakis, A.; Șoica, C.; et al. Mechanistic investigations of antitumor activity of a Rhodamine B-oleanolic acid derivative bioconjugate. Oncol. Rep. 2020, 44, 1169–1183. [Google Scholar] [CrossRef]
  32. Jianu, C.; Stoin, D.; Cocan, I.; David, I.; Pop, G.; Lukinich-Gruia, A.; Mioc, M.; Mioc, A.; Șoica, C.; Muntean, D.; et al. In Silico and in Vitro Evaluation of the Antimicrobial and Antioxidant Potential of Mentha × smithiana R. GRAHAM Essential Oil from Western Romania. Foods 2021, 10, 815. [Google Scholar] [CrossRef] [PubMed]
  33. Berman, H.M.M.; Westbrook, J.; Feng, Z.; Gilliland, G.; Bhat, T.N.; Weissig, H.; Shindyalov, I.N.; Bourne, P.E. The Protein Data Bank. Nucleic Acids Res. 2000, 28, 235–242. [Google Scholar] [CrossRef] [Green Version]
  34. Trott, O.; Olson, A.J. AutoDock Vina: Improving the speed and accuracy of docking with a new scoring function, efficient optimization, and multithreading. J. Comput. Chem. 2010, 31, 455–461. [Google Scholar] [CrossRef] [Green Version]
  35. Wilson, T.; Steck, W. A modified HET–CAM assay approach to the assessment of anti-irritant properties of plant extracts. Food Chem. Toxicol. 2000, 38, 867–872. [Google Scholar] [CrossRef]
  36. Interagency Coordinating Committee on the Validation of Alternative Methods (ICCVAM) ICCVAM-Recommended Test Method Protocol: Hen’s Egg Test-Chorioallantoic Membrane. 2010. Available online: http://iccvam.niehs.nih.gov/ (accessed on 12 October 2021).
  37. Kishore, A.S.; Surekha, P.A.; Sekhar, P.V.R.; Srinivas, A.; Murthy, P.B. Hen Egg Chorioallantoic Membrane Bioassay: An in Vitro Alternative to Draize Eye Irritation Test for Pesticide Screening. Int. J. Toxicol. 2008, 27, 449–453. [Google Scholar] [CrossRef]
  38. Coricovac, D.; Farcas, C.; Nica, C.; Pinzaru, I.; Simu, S.; Stoian, D.; Soica, C.; Proks, M.; Avram, S.; Navolan, D.; et al. Ethinylestradiol and Levonorgestrel as Active Agents in Normal Skin, and Pathological Conditions Induced by UVB Exposure: In Vitro and In Ovo Assessments. Int. J. Mol. Sci. 2018, 19, 3600. [Google Scholar] [CrossRef] [Green Version]
  39. World Health Organization. Fact Sheets-Cancer. 2021. Available online: https://www.who.int/news-room/fact-sheets/detail/cancer (accessed on 12 October 2021).
  40. Rudrapal, M.; Khairnar, S.J.; Jadhav, A.G. Drug Repurposing (DR): An Emerging Approach in Drug Discovery. In Drug Repurposing: Hypothesis, Molecular Aspects and Therapeutic Applications; IntechOpen: London, UK, 2020; Available online: https://www.intechopen.com/chapters/72744 (accessed on 12 October 2021).
  41. Su, J.; Chen, J.; Li, L.; Li, B.; Shi, L.; Zhang, H.; Ding, X. Preparation of Natural Borneol/2-Hydroxypropyl-β-cyclodextrin Inclusion Complex and Its Effect on the Absorption of Tetramethylpyrazine Phosphate in Mouse. Chem. Pharm. Bull. 2012, 60, 736–742. [Google Scholar] [CrossRef] [PubMed] [Green Version]
  42. Topal, B.; Altindal, D.; Gümüşderelioğlu, M. Melatonin/HPβCD complex: Microwave synthesis, integration with chitosan scaffolds and inhibitory effects on MG-63CELLS. Int. J. Pharm. 2015, 496, 801–811. [Google Scholar] [CrossRef]
  43. Vialpando, M.; Smulders, S.; Bone, S.; Jager, C.; Vodak, D.; Van Speybroeck, M.; Verheyen, L.; Backx, K.; Boeykens, P.; Brewster, M.E.; et al. Evaluation of Three Amorphous Drug Delivery Technologies to Improve the Oral Absorption of Flubendazole. J. Pharm. Sci. 2016, 105, 2782–2793. [Google Scholar] [CrossRef] [Green Version]
  44. Bezzon, V.D.; Ferreira, F.F.; Smith, P.; Benmore, C.J.; Byrn, S.R.; de Araujo, G.L.B. Amorphous dispersions of flubendazole in hydroxypropyl methylcellulose: Formulation stability assisted by pair distribution function analysis. Int. J. Pharm. 2021, 600, 120500. [Google Scholar] [CrossRef] [PubMed]
  45. Vigh, T.; Démuth, B.; Balogh, A.; Galata, D.L.; Van Assche, I.; Mackie, C.; Vialpando, M.; Van Hove, B.; Psathas, P.; Borbás, E.; et al. Oral bioavailability enhancement of flubendazole by developing nanofibrous solid dosage forms. Drug Dev. Ind. Pharm. 2017, 43, 1126–1133. [Google Scholar] [CrossRef]
  46. Swanepoel, E.; Liebenberg, W.; Devarakonda, B.; De Villiers, M.M. Developing a discriminating dissolution test for three mebendazole polymorphs based on solubility differences. Die Pharm. 2003, 58, 117–121. [Google Scholar]
  47. Camí, G.E.; Brusau, E.V.; Narda, G.E.; Maggio, R.M. Dual approach for concomitant monitoring of dissolution and transformation at solid-state. Mebendazole salts case study. J. Drug Deliv. Sci. Technol. 2020, 55, 101344. [Google Scholar] [CrossRef]
  48. Geng, Q.; Li, T.; Wang, X.; Chu, W.; Cai, M.; Xie, J.; Ni, H. The mechanism of bensulfuron-methyl complexation with β-cyclodextrin and 2-hydroxypropyl-β-cyclodextrin and effect on soil adsorption and bio-activity. Sci. Rep. 2019, 9, 1882. [Google Scholar] [CrossRef]
  49. Kumar, R.; Sinha, V.R.; Dahiya, L.; Singh, G.; Sarwal, A. Impact of cyclodextrin derivatives on systemic release of duloxetine HCl via buccal route. Drug Dev. Ind. Pharm. 2020, 46, 931–945. [Google Scholar] [CrossRef] [PubMed]
  50. Gao, S.; Jiang, J.-Y.; Liu, Y.-Y.; Fu, Y.; Zhao, L.-X.; Li, C.-Y.; Ye, F. Enhanced Solubility, Stability, and Herbicidal Activity of the Herbicide Diuron by Complex Formation with β-Cyclodextrin. Polymers 2019, 11, 1396. [Google Scholar] [CrossRef] [Green Version]
  51. Al-Nahary, T.T.; El-Ries, M.A.N.; Mohamed, G.G.; Attia, A.K.; Mabkhot, Y.; Haroun, M.; Barakat, A. Multiclass analysis on repaglinide, flubendazole, robenidine hydrochloride and danofloxacin drugs. Arab. J. Chem. 2013, 6, 131–144. [Google Scholar] [CrossRef]
  52. Holanda, B.B.; Alarcon, R.T.; Guerra, R.B.; Rinaldo, D.; Spazzini, F.C.; Castro, R.A.; Bannach, G. Investigation of thermal degradation products of mebendazole by thermal and spectroscopic analysis. J. Anal. Appl. Pyrolysis 2018, 135, 76–84. [Google Scholar] [CrossRef]
  53. Garbuio, A.Q.P.; Hanashiro, T.; Markman, B.E.; Fonseca, F.A.; Perazzo, F.F.; Rosa, P.C.P. Evaluation and study of mebendazole polymorphs present in raw materials and tablets available in the Brazilian pharmaceutical market. J. Appl. Pharm. Sci. 2014, 4, 1–7. [Google Scholar] [CrossRef] [Green Version]
  54. de Villiers, M.M.; Terblanche, R.J.; Liebenberg, W.; Swanepoel, E.; Dekker, T.G.; Song, M. Variable-temperature X-ray powder diffraction analysis of the crystal transformation of the pharmaceutically preferred polymorph C of mebendazole. J. Pharm. Biomed. Anal. 2005, 38, 435–441. [Google Scholar] [CrossRef]
  55. Calvo, N.L.; Kaufman, T.S.; Maggio, R.M. Mebendazole crystal forms in tablet formulations. An ATR-FTIR/chemometrics approach to polymorph assignment. J. Pharm. Biomed. Anal. 2016, 122, 157–165. [Google Scholar] [CrossRef]
  56. Devine, R.; Martin, D.; Kinsella, G.; Findlay, J.; Stephens, J. Characterization of an aryl piperazine/2-hydroxypropyl-β-cyclodextrin association, a complex with antidiabetic potential. Results Chem. 2020, 2, 100026. [Google Scholar] [CrossRef]
  57. Rojas-Aguirre, Y.; Yépez-Mulia, L.; Castillo, I.; López-Vallejo, F.; Soria-Arteche, O.; Hernández-Campos, A.; Castillo, R.; Hernández-Luis, F. Studies on 6-chloro-5-(1-naphthyloxy)-2-(trifluoromethyl)-1H-benzimidazole/2-hydroxypropyl-β-cyclodextrin association: Characterization, molecular modeling studies, and in vivo anthelminthic activity. Bioorg. Med. Chem. 2011, 19, 789–797. [Google Scholar] [CrossRef]
  58. Kumar, R.; Sinha, V.; Dahiya, L.; Sarwal, A. Transdermal delivery of duloxetine-sulfobutylether-β-cyclodextrin complex for effective management of depression. Int. J. Pharm. 2021, 594, 120129. [Google Scholar] [CrossRef]
  59. El-Maradny, H.; Mortada, S.; Kamel, O.; Hikal, A. Characterization of ternary complexes of meloxicam-HPβCD and PVP or L-arginine prepared by the spray-drying technique. Acta Pharm. 2008, 58, 455–466. [Google Scholar] [CrossRef] [PubMed] [Green Version]
  60. De Araujo, G.L.B.; Ferreira, F.F.; Bernardes, C.E.S.; Sato, J.A.P.; Gil, O.M.; De Faria, D.L.A.; Loebenberg, R.; Byrn, S.R.; Ghisleni, D.D.M.; Bou-Chacra, N.A.; et al. A New Thermodynamically Favored Flubendazole/Maleic Acid Binary Crystal Form: Structure, Energetics, and in Silico PBPK Model-Based Investigation. Cryst. Growth Des. 2018, 18, 2377–2386. [Google Scholar] [CrossRef]
  61. Castillo, J.A.; Palomo-Canales, J.; Garcia, J.J.; Lastres, J.L.; Bolas, F.; Torrado, J.J. Preparation and Characterization of Albendazole β-Cyclodextrin Complexes. Drug Dev. Ind. Pharm. 1999, 25, 1241–1248. [Google Scholar] [CrossRef] [PubMed]
  62. Ehteda, A.; Galettis, P.; Chu, S.W.L.; Pillai, K.; Morris, D.L. Complexation of Albendazole with Hydroxypropyl-β-Cyclodextrin Significantly Improves its Pharmacokinetic Profile, Cell Cytotoxicity and Antitumor Efficacy in Nude Mice. Anticancer Res. 2012, 32, 3659–3666. [Google Scholar]
  63. Fernandes, C.M.; Veiga, F. Effect of the Hydrophobic Nature of Triacetyl-β-cyclodextrin on the Complexation with Nicardipine Hydrochloride: Physicochemical and Dissolution Properties of the Kneaded and Spray-dried Complexes. Chem. Pharm. Bull. 2002, 50, 1597–1602. [Google Scholar] [CrossRef] [Green Version]
  64. Soica, C.; Gyeresi, A.; Frentiu, B.; Dehelean, C.; Aluas, M. Preparation and physico-chemical characterization of chlorthalidone- hydroxypropyl-β-cyclodextrin binary systems. Rev. Chim. 2007, 58, 606–611. [Google Scholar]
  65. Pourgholami, M.H.; Wangoo, K.T.; Morris, D.L. Albendazole-cyclodextrin complex: Enhanced cytotoxicity in ovarian cancer cells. Anticancer Res. 2008, 28, 2775–2779. [Google Scholar] [PubMed]
  66. Matencio, A.; Hoti, G.; Monfared, Y.; Rezayat, A.; Pedrazzo, A.; Caldera, F.; Trotta, F. Cyclodextrin Monomers and Polymers for Drug Activity Enhancement. Polymers 2021, 13, 1684. [Google Scholar] [CrossRef] [PubMed]
  67. Brewster, M.E.; Loftsson, T. Cyclodextrins as pharmaceutical solubilizers. Adv. Drug Deliv. Rev. 2007, 59, 645–666. [Google Scholar] [CrossRef] [PubMed]
  68. Bai, R.-Y.; Staedtke, V.; Rudin, C.M.; Bunz, F.; Riggins, G.J. Effective treatment of diverse medulloblastoma models with mebendazole and its impact on tumor angiogenesis. Neuro-Oncology 2014, 17, 545–554. [Google Scholar] [CrossRef] [PubMed] [Green Version]
  69. Kang, D.; Pang, X.; Lian, W.; Xu, L.; Wang, J.; Jia, H.; Zhang, B.; Liu, A.-L.; Du, G.-H. Discovery of VEGFR2 inhibitors by integrating naïve Bayesian classification, molecular docking and drug screening approaches. RSC Adv. 2018, 8, 5286–5297. [Google Scholar] [CrossRef] [Green Version]
  70. Lin, S.; Yang, L.; Yao, Y.; Xu, L.; Xiang, Y.; Zhao, H.; Wang, L.; Zuo, Z.; Huang, X.; Zhao, C. Flubendazole demonstrates valid antitumor effects by inhibiting STAT3 and activating autophagy. J. Exp. Clin. Cancer Res. 2019, 38, 519. [Google Scholar] [CrossRef] [Green Version]
  71. Elissondo, M.C.; Ceballos, L.; Alvarez, L.; Bruni, S.S.; Lanusse, C.; Denegri, G. Flubendazole and ivermectin in vitro combination therapy produces a marked effect on Echinococcus granulosus protoscoleces and metacestodes. Parasitol. Res. 2009, 105, 835–842. [Google Scholar] [CrossRef] [PubMed]
  72. Younis, N.S.; Ghanim, A.M.H.; Saber, S. Mebendazole augments sensitivity to sorafenib by targeting MAPK and BCL-2 signalling in n-nitrosodiethylamine-induced murine hepatocellular carcinoma. Sci. Rep. 2019, 9, 19095. [Google Scholar] [CrossRef] [Green Version]
  73. Simbulan-Rosenthal, P.C.M.; Dakshanamurthy, S.; Gaur, A.; Chen, Y.-S.; Fang, H.-B.; Abdussamad, M.; Zhou, H.; Zapas, J.; Calvert, V.; Petricoin, E.F.; et al. The repurposed anthelmintic mebendazole in combination with trametinib suppresses refractory NRASQ61K melanoma. Oncotarget 2017, 8, 12576–12595. [Google Scholar] [CrossRef] [PubMed] [Green Version]
  74. Zu, X.L.; Guppy, M. Cancer metabolism: Facts, fantasy, and fiction. Biochem. Biophys. Res. Commun. 2004, 313, 459–465. [Google Scholar] [CrossRef]
  75. Viale, A.; Corti, D.; Draetta, G.F. Tumors and Mitochondrial Respiration: A Neglected Connection. Cancer Res. 2015, 75, 3687–3691. [Google Scholar] [CrossRef] [Green Version]
  76. Ashton, T.M.; McKenna, W.G.; Kunz-Schughart, L.A.; Higgins, G.S. Oxidative Phosphorylation as an Emerging Target in Cancer Therapy. Clin. Cancer Res. 2018, 24, 2482–2490. [Google Scholar] [CrossRef] [PubMed] [Green Version]
  77. Sica, V.; Pedro, J.-S.; Stoll, G.; Kroemer, G. Oxidative phosphorylation as a potential therapeutic target for cancer therapy. Int. J. Cancer 2020, 146, 10–17. [Google Scholar] [CrossRef]
  78. Macasoi, I.; Mioc, A.; Mioc, M.; Racoviceanu, R.; Soica, I.; Chevereșan, A.; Dehelean, C.; Dumitrașcu, V. Targeting Mitochondria through the Use of Mitocans as Emerging Anticancer Agents. Curr. Med. Chem. 2019, 27, 5730–5757. [Google Scholar] [CrossRef] [PubMed]
  79. Bossche, H.V.D.; Janssen, P.A. The biochemical mechanism of action of the antinematodal drug tetramisole. Biochem. Pharmacol. 1969, 18, 35–42. [Google Scholar] [CrossRef]
  80. Aminzadeh-Gohari, S.; Weber, D.D.; Catalano, L.; Feichtinger, R.G.; Kofler, B.; Lang, R. Targeting Mitochondria in Melanoma. Biomolecules 2020, 10, 1395. [Google Scholar] [CrossRef] [PubMed]
  81. Zheng, J. Energy metabolism of cancer: Glycolysis versus oxidative phosphorylation (Review). Oncol. Lett. 2012, 4, 1151–1157. [Google Scholar] [CrossRef] [PubMed] [Green Version]
  82. Luepke, N. Hen’s egg chorioallantoic membrane test for irritation potential. Food Chem. Toxicol. 1985, 23, 287–291. [Google Scholar] [CrossRef]
Figure 1. Chemical structures of FLU and MEB.
Processes 09 02185 g001
Figure 2. HRR protocol for permeabilized A375 and A549 cell lines. D: digitonin—a mild detergent; G: glutamate—CI substrate; M: malate—CI substrate; ADP: adenosine diphosphate; S: succinate—CII substrate; Omy: oligomycin—complex V inhibitor; FCCP: carbonyl cyanide p-(trifluoromethoxy) phenyl-hydrazone—a protonophore; Rot: rotenone—CI inhibitor and Ama: antimycin A—CIII inhibitor.
Processes 09 02185 g002
Figure 3. In vitro dissolution profiles of MEB, FLU, and their respective 1:1 mixtures with HPBCD.
Processes 09 02185 g003
Figure 4. XRD spectra for FLU, MEB, and their physical mixture with HPBCD.
Processes 09 02185 g004
Figure 5. Thermal analysis for FLU, MEB, and their HPBCD physical mixture.
Processes 09 02185 g005
Figure 6. FTIR spectra of FLU, MEB, and their HPBCD conjugates.
Processes 09 02185 g006
Figure 7. In vitro viability evaluation of FLU, HPBCD, and FLU + HPBCD (0.1, 0.5, and 1 μM) in A375 and A549 cells at 72 h post-stimulation by the MTT assay. The results are expressed as the cell viability percentage normalized to control cells (unstimulated). The data represent the mean values ± SD of three independent experiments performed in triplicate. One-way ANOVA analysis was applied to determine the statistical differences in rapport with control cells followed by Dunnett’s multiple comparisons post-test (**** p < 0.0001).
Processes 09 02185 g007
Figure 8. In vitro viability evaluation of MEB, HPBCD, and MEB + HPBCD (0.1, 0.5, and 1 μM) in A375 and A549 cells at 72 h post-stimulation by the MTT assay. The results are expressed as the cell viability percentage normalized to control cells (unstimulated). The data represent the mean values ± SD of three independent experiments performed in triplicate. One-way ANOVA analysis was applied to determine the statistical differences in rapport with control cells followed by Dunnett’s multiple comparisons post-test (**** p < 0.0001).
Processes 09 02185 g008
Figure 9. MEK1 (PDB ID: 3EQG) active site complexed with ATP and the native ligand Mirdametinib (A), MEB (B), and FLU (C); HB interactions are depicted as green dotted lines and hydrophobic interactions as purple dotted lines; interacting aminoacids are shown as purple sticks.
Processes 09 02185 g009
Figure 10. Mitochondrial respiration rates of permeabilized A375 human melanoma cells following 72 h of stimulation with 1 μM of HPBCD, MEB ± HPBCD, FLU ± HPBCD, and MEB + FLU ± HPBCD. The maximum concentration of DMSO used in this study was 0.25% and did not influence the mitochondrial function. The obtained data (pmol·s−1mL−110−6 cells) is presented as mean ± SD of five individual experiments. The statistical analysis was performed using two-way ANOVA, followed by Bonferroni post-test (* p < 0.05, ** p < 0.01, and *** p < 0.001).
Processes 09 02185 g010
Figure 11. Mitochondrial respiration rates of permeabilized A549 non-small cell lung cancer cells following 72 h of stimulation with 1 μM of HPBCD, MEB ± HPBCD, FLU ± HPBCD, and MEB + FLU ± HPBCD. The maximum concentration of DMSO used in this study was 0.25% and did not influence the mitochondrial function. The obtained data (pmol·s−1mL−110−6 cells) is presented as mean ± SD of five individual experiments. The statistical analysis was performed using two-way ANOVA, followed by Bonferroni post-test (* p < 0.05, ** p < 0.01, and *** p < 0.001).
Processes 09 02185 g011
Figure 12. Stereomicroscopic images of CAM after irritation with SDS and treatment with MEB, FLU, and their HPBCD conjugates.
Processes 09 02185 g012
Table 1. Molecular docking parameters used for each protein target.
ProteinPDB IDGrid Box Center CoordinatesGrid Box SizeConformers Generated Per Ligand
Apoptosis regulator Bcl-2 (Bcl-2)2W3Lcenter_x = 38.8892
center_y = 27.0675
center_z = −12.5145
size_x = 13.7411
size_y = 11.5648
size_z = 9.6457
8
Apoptosis regulator Bcl-X (Bcl-XL)2YXJcenter_x = −8.8801
center_y = −14.5418
center_z = 10.0100
size_x = 13.4584
size_y = 20.4060
size_z = 9.6457
8
Epidermal growth factor receptor 1 (EGFR1)4RJ8center_x = −53.5443
center_y = 1.1587
center_z = −25.1500
size_x = 10.5346
size_y = 10.7549
size_z = 13.7560
8
Vascular endothelial growth factor receptor 23VHKcenter_x = −27.5445
center_y = 26.9531
center_z = 16.6738
size_x = 10.0752
size_y = 11.0246
size_z = 11.6961
8
RAC-alpha serine/threonine-protein kinase (AKT1)3CQUcenter_x = 5.2027
center_y = 2.2676
center_z = 17.5609
size_x = 14.7068
size_y = 14.4124
size_z = 9.3509
8
Mammalian target of rapamycin- target of rapamycin complex subunit LST8 (mTOR-LST8)4JT5center_x = 52.1512
center_y = −0.7990
center_z = −49.2709
size_x = 14.3371
size_y = 11.0246
size_z = 810.8186
8
Phosphatidylinositol 4,5-bisphosphate 3-kinase catalytic subunit gamma isoform (PI3Kγ)4FA6center_x = 45.2920
center_y = 14.3911
center_z = 31.0579
size_x = 14.6994
size_y = 10.7549
size_z = 10.8186
8
Dual specificity mitogen-activated protein kinase 1 (MEK1)3EQGcenter_x = −3.5569
center_y = 57.7644
center_z = 34.5863
size_x = 14.7068
size_y = 10.9225
size_z = 9.7322
8
Mitogen-activated protein kinase 1 (ERK2)4G6Ncenter_x = 21.5960
center_y = 5.8329
center_z = 15.3508
size_x = 14.4689
size_y = 11.4524
size_z = 10.8186
8
Table 2. Docking results (binding energy, ∆G kcal/mol) for compounds MEB and FLU.
Bcl-2Bcl-XLEGFR1VEGFR2AKT1mTORPI3KMEK1ERK2
Free Binding Energy ∆G (kcal/mol)
Native ligand−10.3−10−8.8−9.7−10.5−8.5−9.3−8.7−7.5
FLU−7−8.3−7.5−9.6−8.9−8.2−8.2−9.4−7.7
MEB−7−7.9−7.5−9.3−9.1−8.7−8−9.3−7.7
Table 3. The irritant potential of MEB, FLU, and their HPBCD conjugates.
SamplesIrritation ScoreType of Effect
SLS 0.5%18.56Strong irritant
HPBCD 10 mM0.0Non-irritant
FLU 10 mM0.0Non-irritant
FLU-HPBCD 10 mM0.0Non-irritant
MEB 10 mM0.0Non-irritant
MEB-HPBCD0.0Non-irritant
Publisher’s Note: MDPI stays neutral with regard to jurisdictional claims in published maps and institutional affiliations.

