Article

Exploration of a Molecularly Imprinted Polymer (MIPs) as an Adsorbent for the Enrichment of Trenbolone in Water

by
Anele Mpupa
1,2,
Mehmet Dinc
3,
Boris Mizaikoff
1,4,* and
Philiswa Nosizo Nomngongo
1,2,5,*
1
Department of Chemical Sciences, University of Johannesburg, Doornfontein Campus, P.O. Box 17011, Johannesburg 2028, South Africa
2
DSI/NRF SARChI Nanotechnology for Water, University of Johannesburg, Doornfontein 2028, South Africa
3
Hahn-Schickard, Sedanstrasse 14, 89077 Ulm, Germany
4
Institute of Analytical and Bioanalytical Chemistry, Ulm University, 89081 Ulm, Germany
5
DSI/Mintek Nanotechnology Innovation Centre, University of Johannesburg, Doornfontein 2028, South Africa
*
Authors to whom correspondence should be addressed.
Submission received: 2 November 2020 / Revised: 31 December 2020 / Accepted: 7 January 2021 / Published: 20 January 2021
(This article belongs to the Special Issue Various Adsorbents for Water Purification Processes)

Abstract

:
The presence of endocrine disruptors in surface waters can have negative implications on wildlife and humans both directly and indirectly. A molecularly imprinted polymer (MIP) was explored for its potential to enhance the UV-Vis determination of trenbolone in water using solid-phase extraction (SPE). The synthesized MIP was studied using Fourier transform infrared spectra (FTIR) and scanning electron microscopy (SEM). Using the MIP resulted in a preconcentration and enrichment factor of 14 and 8, respectively. Trenbolone binding on the MIP was shown to follow a Langmuir adsorption and had a maximum adsorption capacity of 27.5 mg g−1. Interference studies showed that the MIP selectivity was not compromised by interferences in the sample. The MIP could be recycled three times before significant loss in analyte recovery.

1. Introduction

Water is the most important natural resource for the survival of all living organisms [1]. Due to the rise of urbanization, climate change, industrial production and population, the quality of water has been negatively affected [2,3,4]. As a result, many cities are facing water shortages [1]. Moreover, pollution to surface waters not only contributes to water shortages but can also lead to the degradation of grain quality. Pollutants entering the soil or water pose a varying number of threats to the functioning of the ecosystem as well as human health [5]. Soil is usually polluted with polycyclic aromatic hydrocarbons (PAHs), petroleum-related compounds, chlorophenols, heavy metals, organic pollutants and pesticides [5]. There is an overlap of the types of pollutants present in water and soil. This is because of water runoff from contaminated soils, wastewater and septic tanks [6]. The United States and European Union, in 2002 and 2009, reported the presence of organic pollutants, especially ones with endocrine-disrupting properties, in at least 80% of samples [7]. Since 2013, there have been approximately 1000 synthetic and natural compounds with endocrine-disrupting properties [7]. The most investigated endocrine disruptors include some personal care products, pharmaceuticals, poly brominated diphenyl ethers (PBDEs) and hormones [8].
Androgenic hormones such as testosterone are C19 steroids and are responsible for the development of masculine characteristics [9]. Thus, they are normally used as growth promoters in human and veterinary therapies [10]. Anabolic androgenic steroids such as testosterone are widely used by athletes to improve athletic performance because of their mytrophic action [11]. Trenbolone and zeranol are hormonally active substances that can be used as growth promoters [12]. The use of these anabolic growth agents is banned by the European Union, Russia and China [13]. This is because a number of studies have shown that residues of these substances can be found in meat and other food stuffs [14]. Whereas this is the case in some countries such as South Africa, there is no information on whether these substances are used legally or illegally. These substances have been detected in the liver, bile, plasma, kidney and urine of the cattle [15]. This means that hormonal residues can be found in animal excreta, which can directly pollute the soil and indirectly affects water quality through leaching [16]. In the environment, these substances are persistent [17]. More concerning is their endocrine-disrupting properties, even at extremely low concentrations [18]. It is suspected that trenbolone can result in neurodegenerative disorders such as Alzheimer’s disease when people are exposed to it for extended periods [19]. Therefore, analytical methods with the ability to detect these substances in water are required.
With modern analytical chemistry, it is possible to determine an analyte of interest in different kinds of sample matrices [20]. The analysis and quantification of hormones in water matrices has predominantly been done using chromatographic techniques coupled with different detectors [21,22,23] and electrochemical [24,25] and spectrophotometric [26,27] techniques. Among these, gas and liquid chromatography (GC and LC) are the most prevalent due to efficient separation and identification success [28]. However, the biggest limitation of GC determination is the need for derivatisation and conversion [29]. These manipulations can result in loss of analyte [29]. This has driven a surge in liquid chromatography (LC) methods, which do not require chemical pre-treatment for hormonal analysis and quantification [30]. LC methods often lack the GC specificity in complex matrices and thus require sample preparation in order to ensure accurate quantification [31]. Spectrophotometric determination offers short analysis run times. It is also readily available and simple, which makes it an attractive technique for routine analysis [32,33]. The major drawback of UV-Vis spectrophotometry is low sensitivity and poor selectivity in comparison to chromatographic and electrochemical methods [34,35]. A sample preparation step can be used to combat this disadvantage [34,35]. Hence, the goals of sample preparation include the preconcentration of analytes to concentrations higher than the instrument’s limits of detection, removal of interferences and isolation of the analytes from matrix effects [36].
Solid phase extraction (SPE) is the most widely used sample preparation technique for the preconcentration and analysis of organic pollutants [37,38]. This is due to its advantages, such as its simplicity, potential for automation, high enrichment factors and high selectivity [39]. In addition, the most attractive advantage for analytical chemists is the possibility of using a reduced amount of organic solvents and the fact that SPE is highly tuneable with regard to the adsorbents used [35]. Previously, silica-bonded phases such as C18 have been used for as adsorbents for SPE of wide range of organic pollutants [33,40,41,42,43,44]. However, recently, modified and tuned solid phase materials have been used to achieve more specificity [45]. One of the most promising adsorbents with regard to selectivity are molecularly imprinted polymers. Molecularly imprinted polymers (MIPs) have been demonstrated to be useful for the specific recognition, binding and isolation of chemically active target molecules [46]. MIPs can be prepared by moulding polymeric structures around a target molecule through polymerisation in the presence of a cross-linking agent and initiator [47]. The formation of a MIP follows a two-step process, where the first step includes the formation of a template-monomer complex followed by polymerisation around the template. Then, the template is removed by washing resulting in a polymer matrix with specific analyte-binding sites [47,48]. MIPs provide high selectivity combined with easy preparation and application. As such, they can be used for a variety of applications, such as sensors [49,50,51], catalysis [52,53], capillary electrophoresis and separation [54] and solid phase extraction [55,56].
The aim of this work was to prepare a molecularly imprinted polymer using trenbolone as a template. The synthesised MIP was then evaluated for its binding and adsorption characteristics. The effects of the sample pH, mass of the adsorbent, extraction time and eluent volume on the preconcentration of trenbolone using the prepared MIP were investigated using multivariate optimisation. Quantification and method performance evaluation were carried out using simple UV spectrophotometry. In our knowledge, molecularly imprinted polymers have not been explored for the quantification of trenbolone using UV-Vis spectrophotometry.

2. Materials and Methods

2.1. Materials

Ethanol, methanol, acetic acid, sodium hydroxide, methylacrylic acid, trenbolone (analytical grade), anhydrous toluene, ethyleneglycoldimethacryate (EGDMA) and azobisisobutyronitrile (AIBN) were all purchased from Sigma-Aldrich (München, Germany). A 1000 mg L−1 trenbolone stock solution was prepared by dissolving the accurate appropriate amount with methanol. The stock solution was stored at 2 °C in a fridge until it was required for use. Working solutions were prepared by diluting the stock solution with ultra-pure water (Thermo Scientific, Deionizer Nanopure Diamond UV TOC Water System, Waltham, MA, USA).

2.2. Instrumentation

A Heraeus Megafuge 16 centrifuge (Thermo Scientific) was used for all separations during the study. A Heraeus vacuum oven (Thermo Scientific) was used for drying, and a Thermomixer C (Eppendorf, Hamburg, Germany) was used for agitation. The polymer surface was studied using a Quanta 3DFEG scanning electron microscope. The Carl Ziess Axio light microscope was used to evaluate the surface of the particles using the Axiovision software. Analyte quantification was done using an Analytik Jena Specord S600 UV-Vis spectrophotometer in the wavelength range 180–400 nm with a 10 mm UV cuvette.

2.3. Synthesis of Molecularly Imprinted Polymer

The method for the synthesis of core-shell molecularly imprinted polymers (MIP) was adopted from the authors of [57]. First, we added 50 mL of anhydrous toluene to a 2-neck round bottom flask, followed by the template molecule (0.264 mmol), methacrylic acid (1.06 mmol), EGDMA (2.11 mmol) and 20 mg of AIBN. The solution was mixed for 10 min under a gentle stream of argon. The solution was heated at 50 °C for 6 h, then at 60 °C for a further 24 h. The products were then matured at a temperature of 85 °C for 6 h. The template was then removed by washing the resulting polymer using methanol/acetic acid mixture (9:1, v/v). The polymer was then dried under vacuum at 40 °C for 24 h before use. Nonimprinted polymers (NIPs) were synthesised in the same way in the absence of the template molecule.

2.4. Binding Characteristics and Adsorption Capacity

The binding studies were performed on solutions made using ultra-pure water at room temperature by appropriately modifying the method described by Fernandes et al., 2017 [58]. To investigate adsorption capacity, the MIP and NIP were weighed into centrifuge tubes containing 10 mL of the trenbolone solution with concentrations varying from 10–50 mg L−1 and shaken for 180 min at room temperature. The adsorbents were then separated by centrifuging at 3500 rpm for 10 min and the supernatant absorbance was measured at 350 nm. The difference between the initial and equilibrium trenbolone concentration, Equation (1), can be considered as the amount of trenbolone bound to the adsorbent. The adsorption capacity (Qe) was calculated using Equation (1).
Q e = C 0 C e × V w
where C0 and Ce represent the initial and equilibrium concentrations (mg L−1), respectively, V is the volume of the trenbolone solution used (L) and w is the amount of polymer used for the adsorption process (g). The specific MIP recognition properties were evaluated using the imprinting factor (IF), which is the ratio between the MIP and NIP adsorption capacity ratio, Equation (2):
IF   =   Q e M I P Q e N I P
where Qe(MIP) and Qe(NIP) are the MIP and NIP adsorption capacities, respectively.

2.5. Solid Phase Extraction of Trenbolone Using MIP

The extraction of trenbolone was done using solid-phase extraction in which an appropriate amount of polymer was weighed into a centrifuge tube containing 10 mL (3 mg L−1) of the trenbolone solution. The mixture was then agitated using a thermo mixer. After extraction, the polymer and bulk solution were separated by means of centrifugation at 3500 rpm for 10 min. After which, the analyte was eluted with a mixture of methanol and acetic acid (9:1, v/v) by agitation and separated by centrifugation. UV-Vis spectrophotometry was used to analyse the bulk and elute solution.

2.6. Optimisation of SPE Method

The optimisation of the factors (Table 1) that could affect the extraction of trenbolone was done multivariately using a 2-level central composite design with mass of adsorbent (MA), sample pH, extraction time (the time the sample and polymer were agitated, ET) and eluent volume (EV) as the factors of interest.

2.7. Analytical Performance and Validation of MIP Extraction Method

The selectivity of the MIP was tested using both adsorption and signal enhancement. Briefly, 30 mg of polymers (NIP and MIP) were weighed into 15 mL centrifuge tubes. Then, 10 mL of 3 mg L−1 spiked lake water was added to the tube. The tubes were then agitated for 20 min using a thermo mixer, after which centrifugation for 10 min at 3500 rpm was used to separate the polymers from the bulk solution. The analyte was then eluted using a methanol/acetic acid mixture (9:1, v/v) (700 μL). The elute and bulk solutions were both analysed using a UV-Vis spectrophotometer. The analytical performance of the method was evaluated using the limit of detection (LOD), limit of quantification (LOQ), linear range (LR) and preconcentration and enrichment factors (PF and EF).

2.8. Reusability Studies

The reusability and regeneration of the polymer was studied by weighing 30 mg of the polymer and 10 mL of a synthetic sample. The mixer was then agitated using a thermo mixer for minutes. The polymer and supernatant were separated using a centrifuge at 3500 rpm for 10 min. The analyte was then eluted with a mixture of methanol and acetic acid (9:1, v/v) by shaking the eluent with polymer in a thermo mixer for 10 min. Subsequently, centrifugation was used to separate the polymer and eluent. The elute was quantified using UV-Vis spectrophotometry at 350 nm.

2.9. Selectivity Studies

The selectivity of the MIP was assessed using β-estradiol, which is one of the most commonly detected hormones in the environment. In order to test the real sample selectivity of the MIP in comparison to the NIP, lake water was spiked with 3 mg L−1 of trenbolone and β-estradiol. After, the adsorption and preconcentration methods were applied on the samples. The distribution ratio was calculated according to Azodi-Deilami et al., 2014 [59] using the equation:
K D = C i C f V C f m
where Ci, Cf, V and m are the initial and equilibrium concentrations, solution volume and polymer mass, respectively. The KD was then used to calculate the selectivity coefficient (α) defined by the equation:
α = K D T r e n b o l o n e K D β e s t r a d i o l

3. Results and Discussion

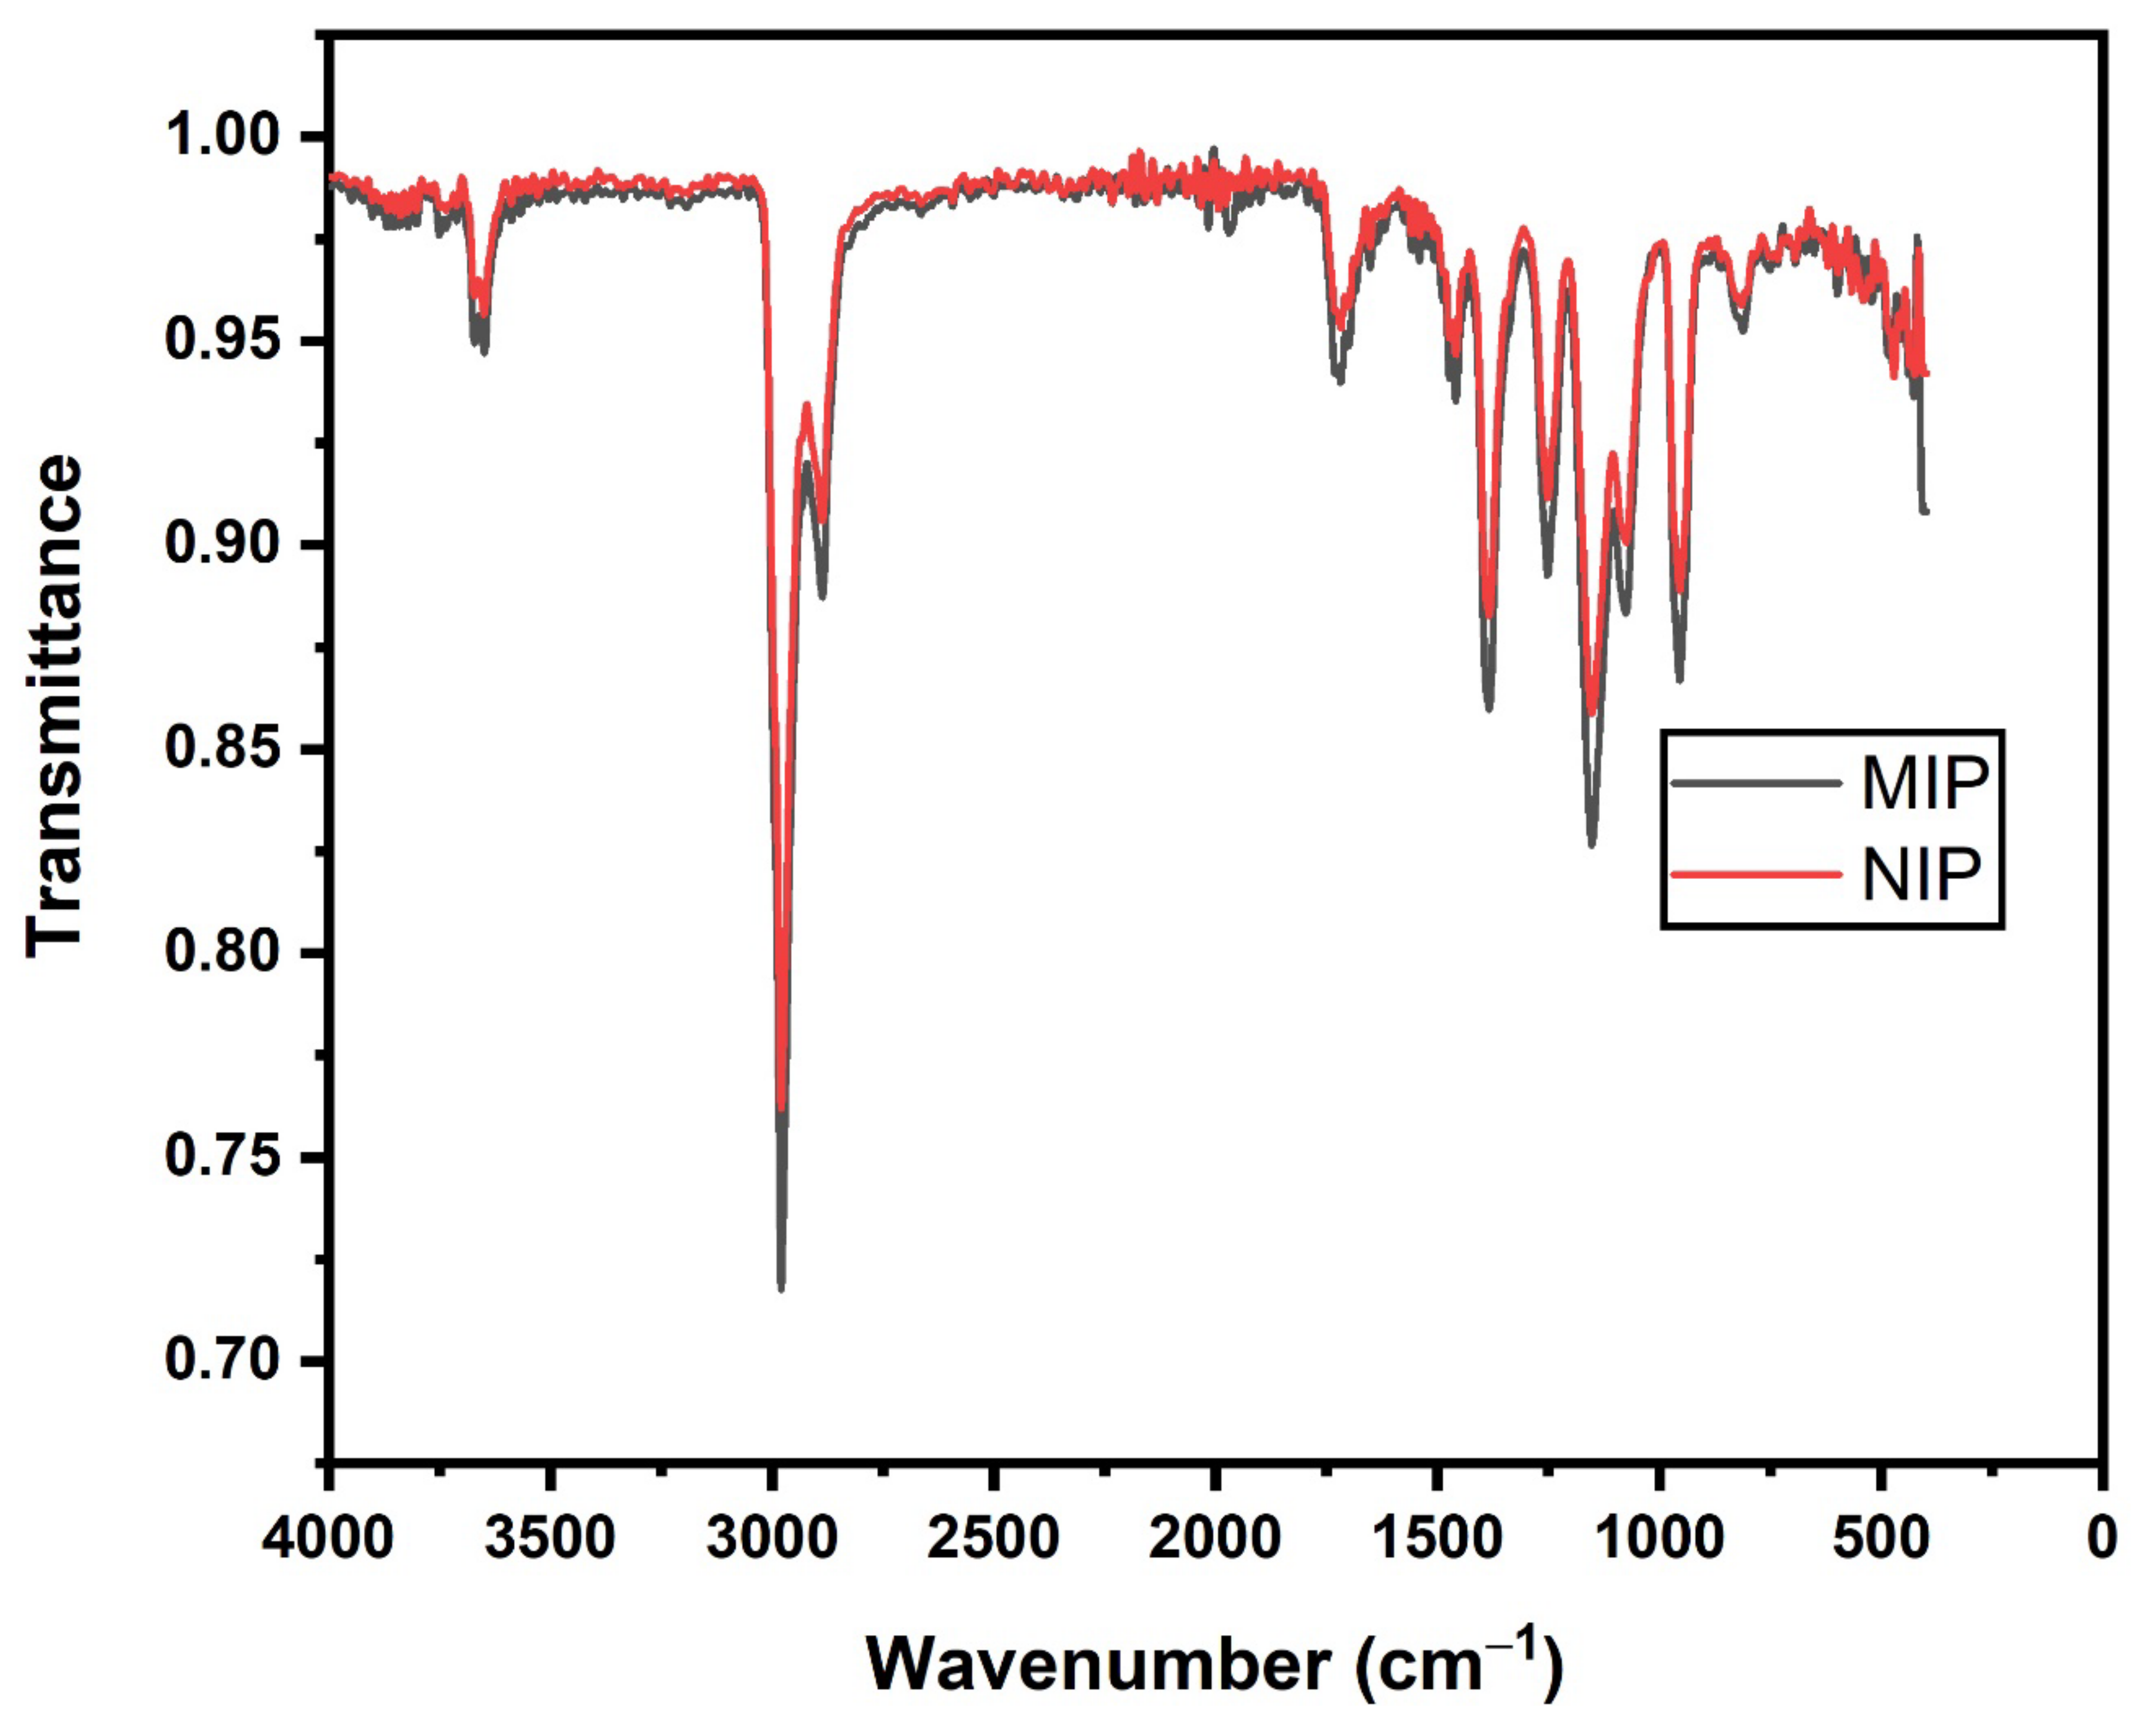
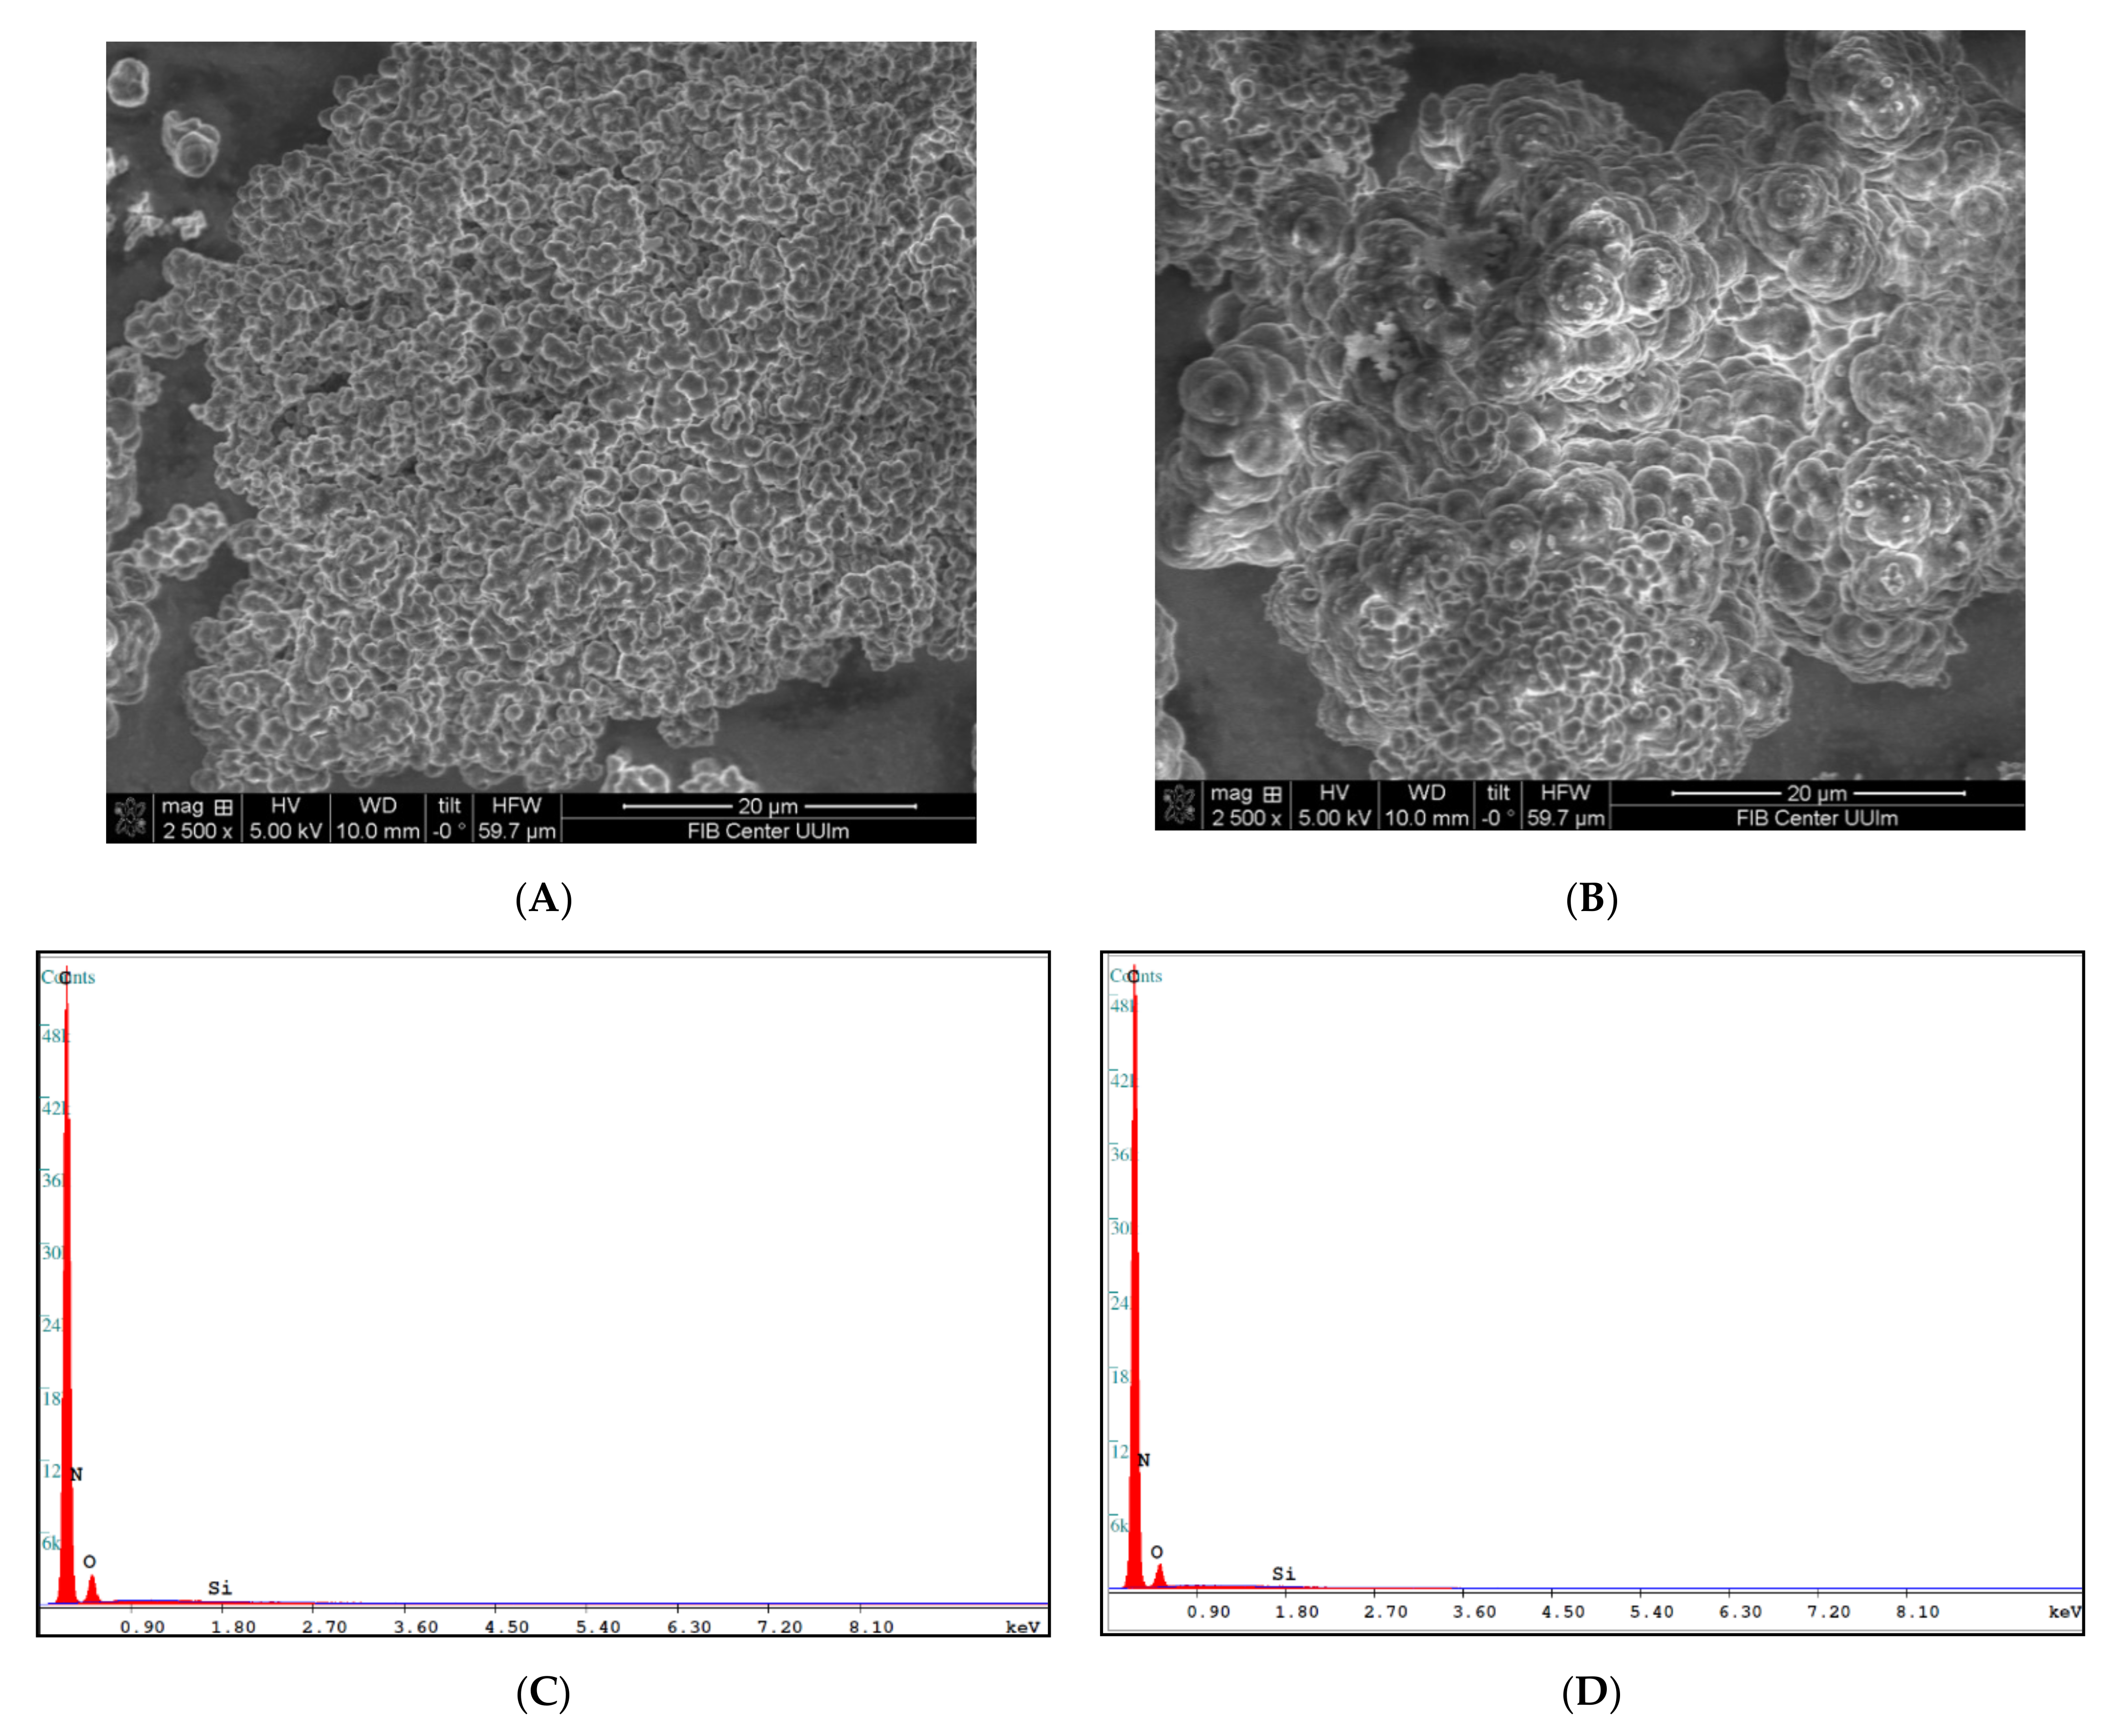
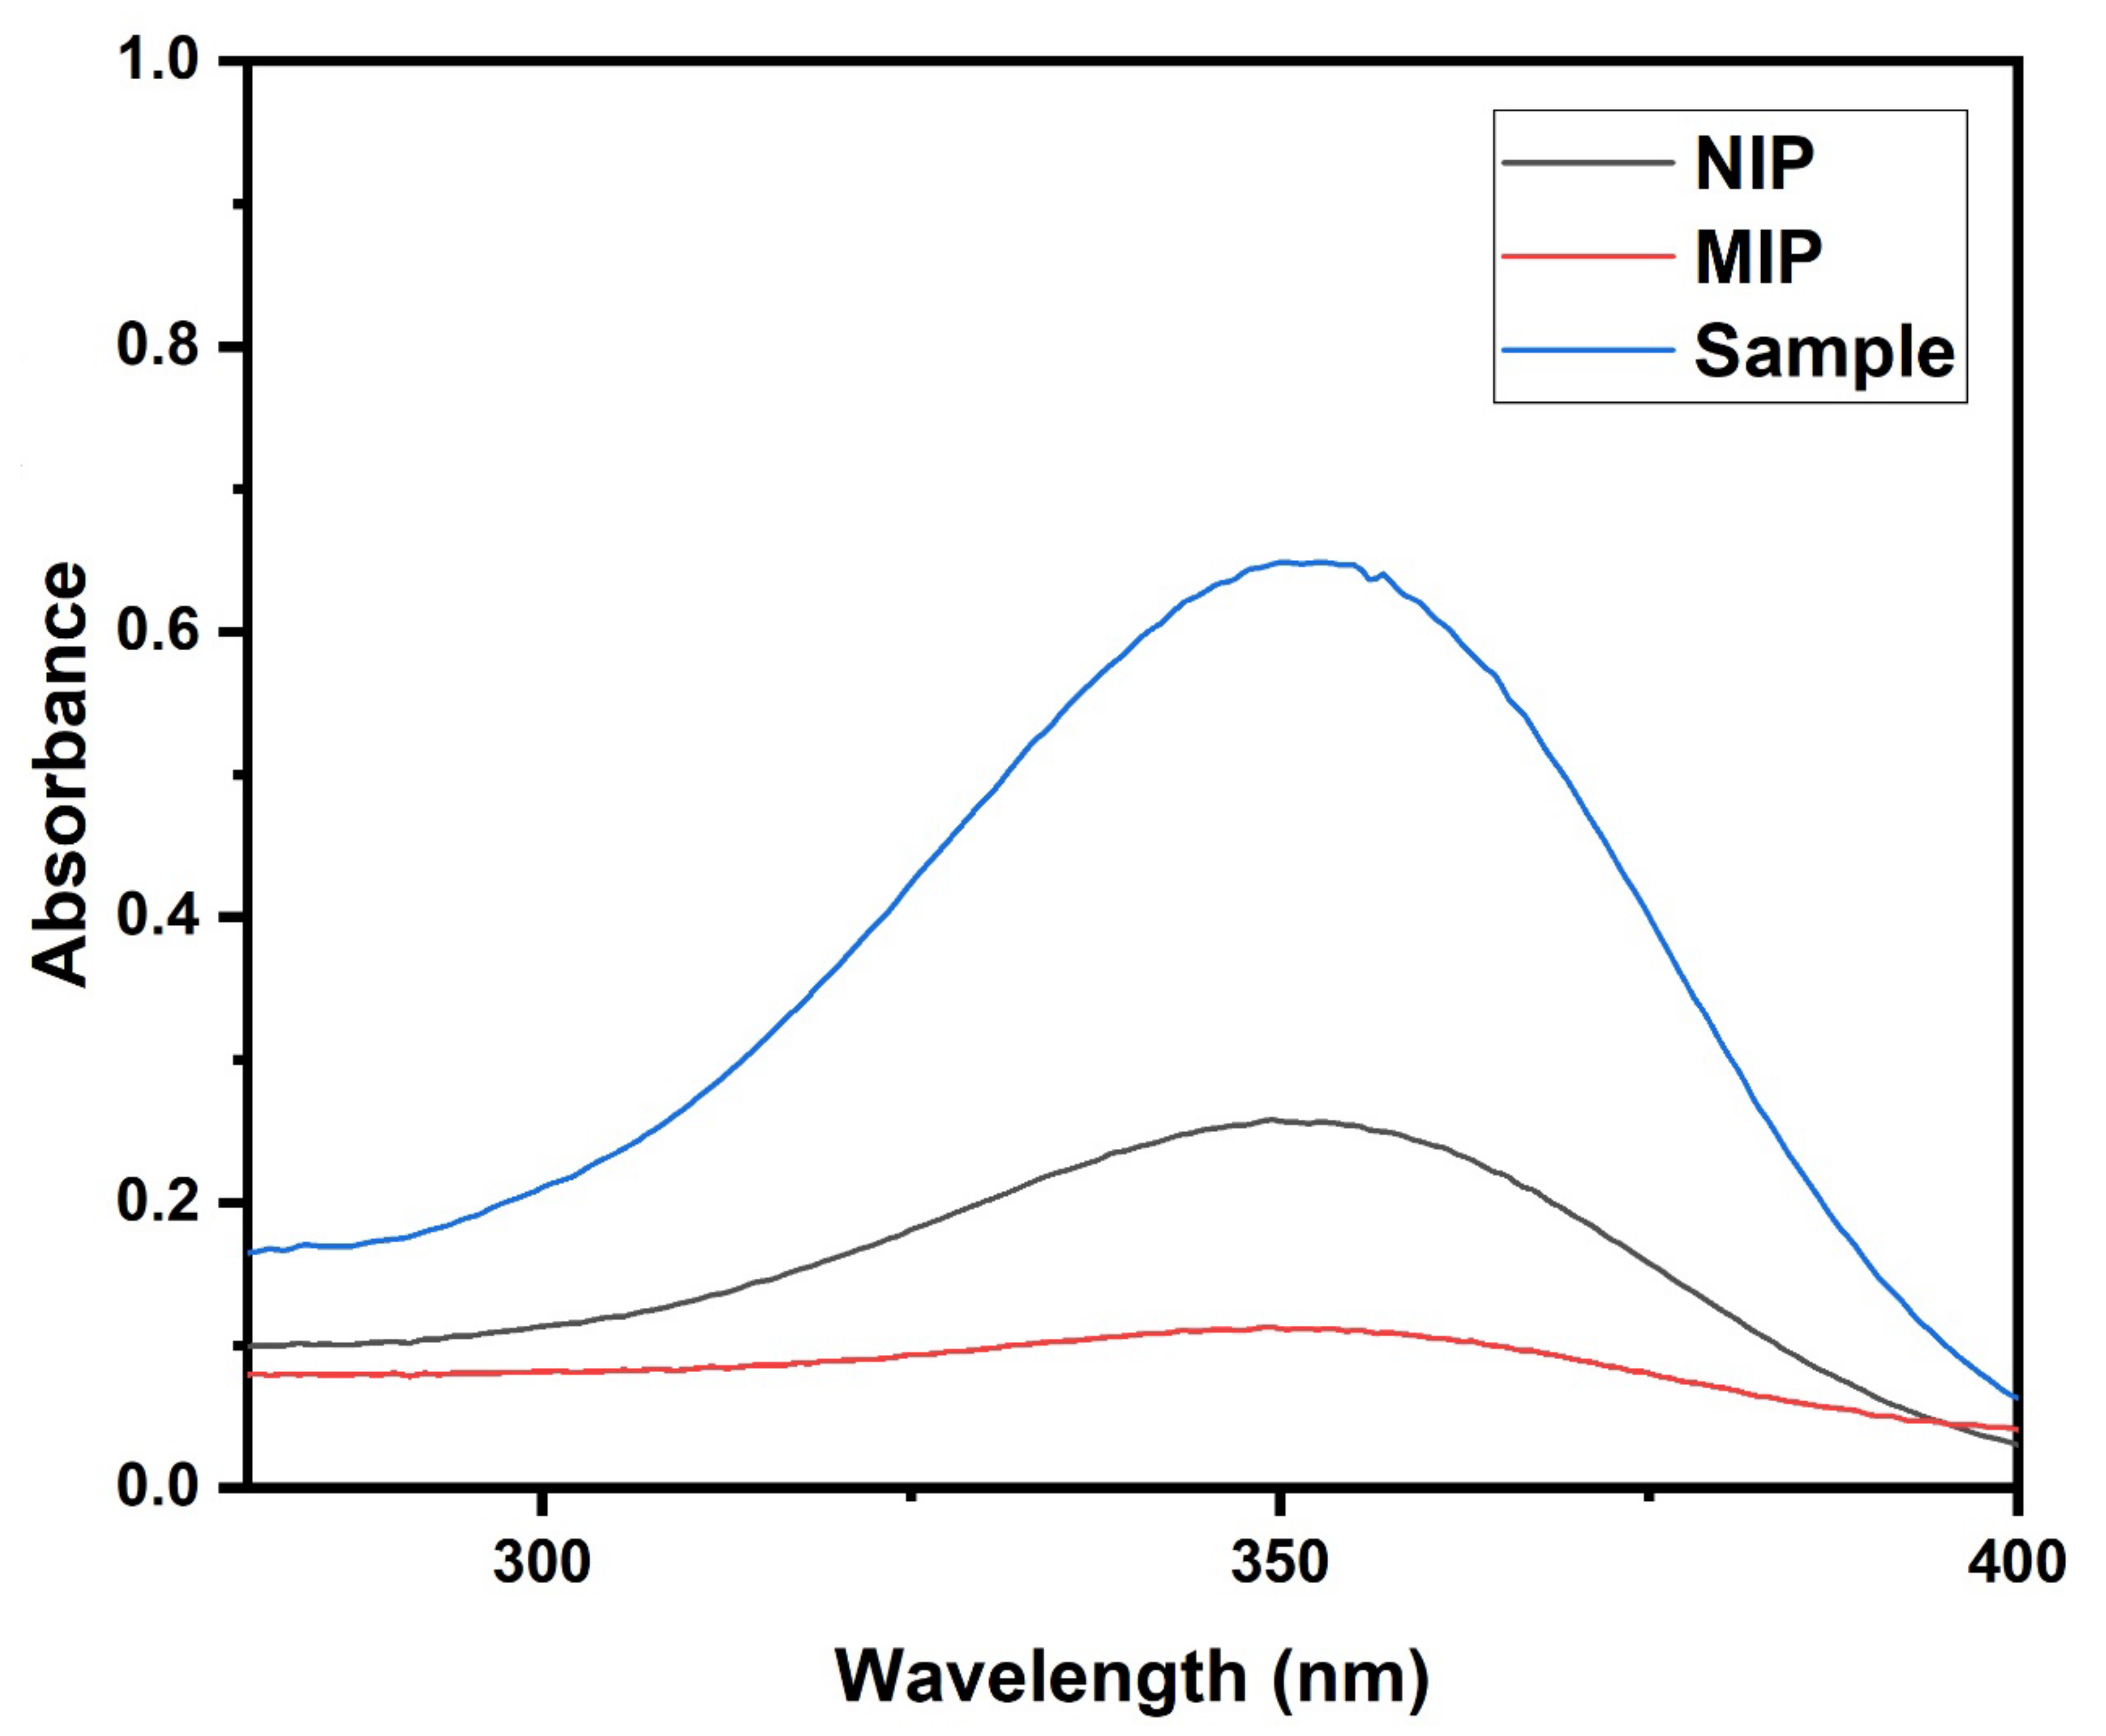
3.1. Characterisation

The characterisation of the molecularly imprinted polymer (MIP) was done after the removal of the template. The synthesized polymers were characterised to understand their most prominent functional groups using Fourier transform infrared spectra (FTIR) (Figure 1) and their surface characteristics were studied using scanning electron microscopy (SEM) equipped with an energy dispersive X-ray spectrometer (EDS) in order to investigate the chemical compositions of the polymers (Figure 2A–D).
As seen in Figure 1, the MIP and NIP spectra shared a similar FTIR profile. This was due to the fact that the MIP and NIP synthesis were similar except for the absence of the template molecule in the synthesis of the NIP. The band at 1720 cm−1 was a characteristic peak attributed to the COOH functional group. The second characteristic peak for poly methacrylic acid was found at 1456 cm−1, which was as a result of the C-C double bond, whereas the bands at 2900 cm−1 and 3000 cm−1 were due to the C-H stretching. A similar profile observed by Gupta and colleagues [60].
The SEM images of the MIP and NIP (Figure 2A,B) showed the presence of a bulk polymer. There were no significant differences between the MIP and NIP surfaces, as expected. This was because the synthesis routes of the two polymers was similar except for the presence of the template in the preparation of the MIP. The EDS spectra (Figure 2C,D) for both the MIP and NIP showed that both polymers had similar elemental compositions. This was due to the removal of the template from the MIP, resulting in the MIP and NIP having relatively similar elemental compositions [61].

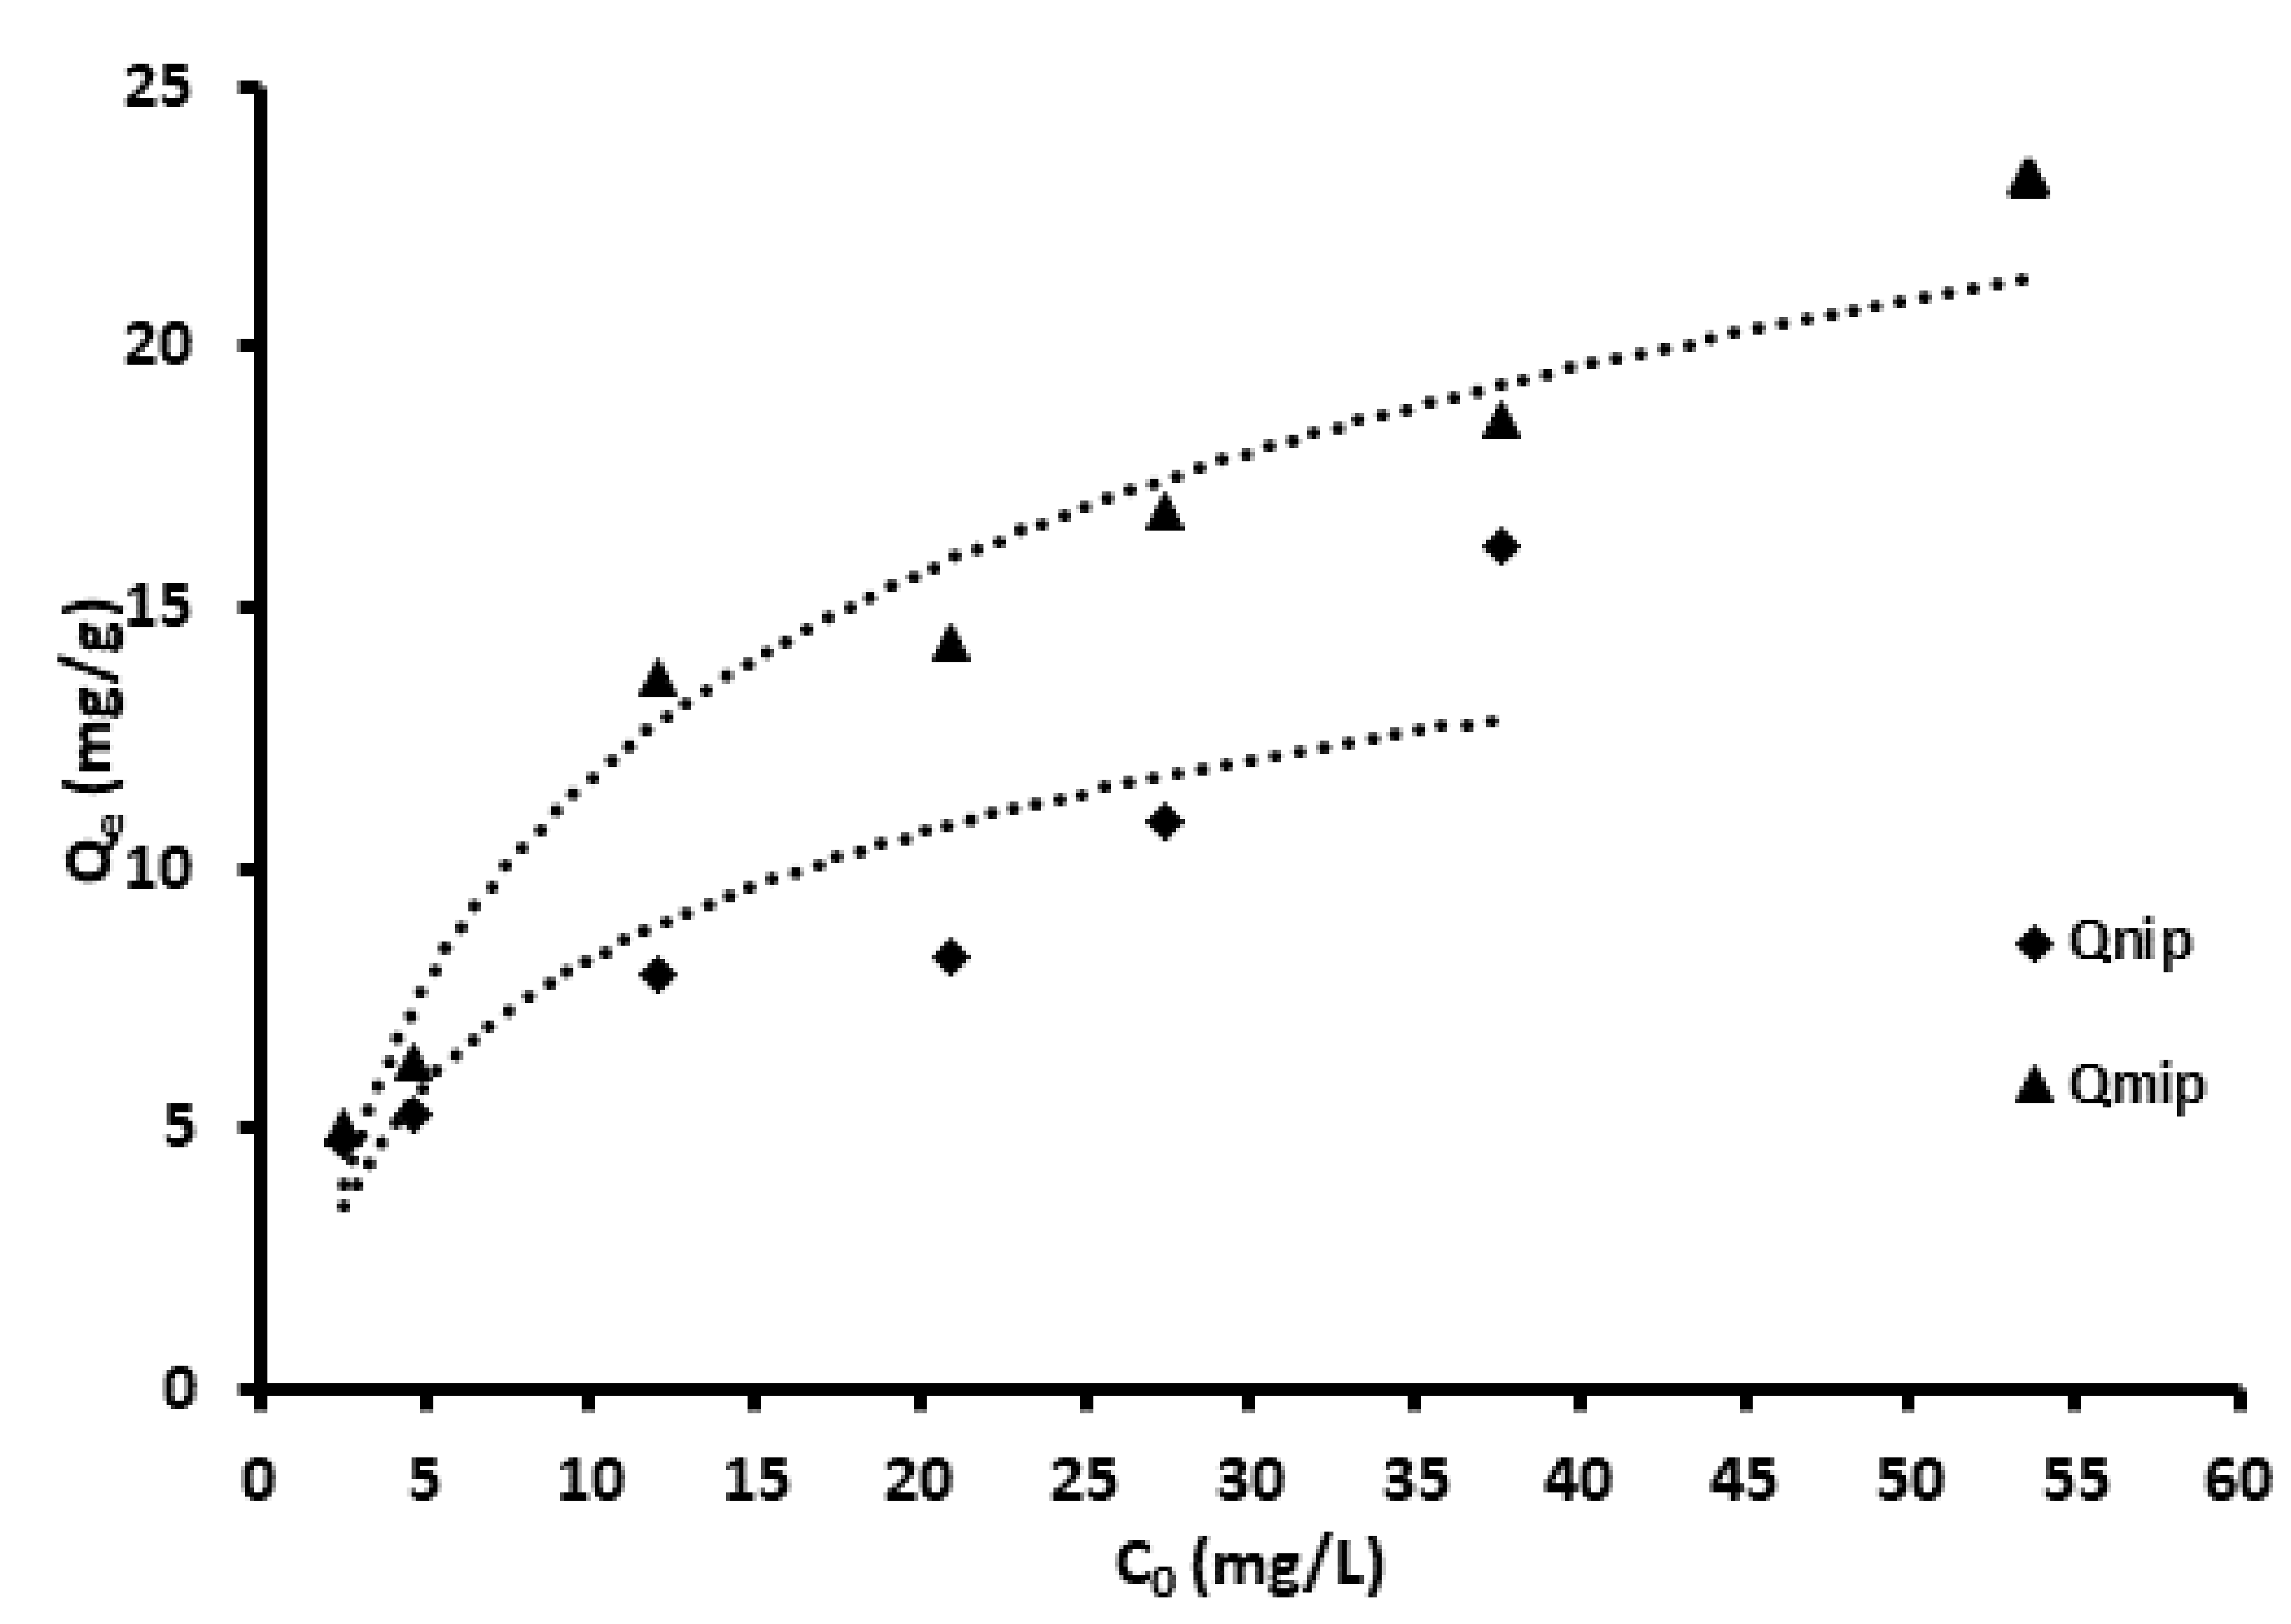
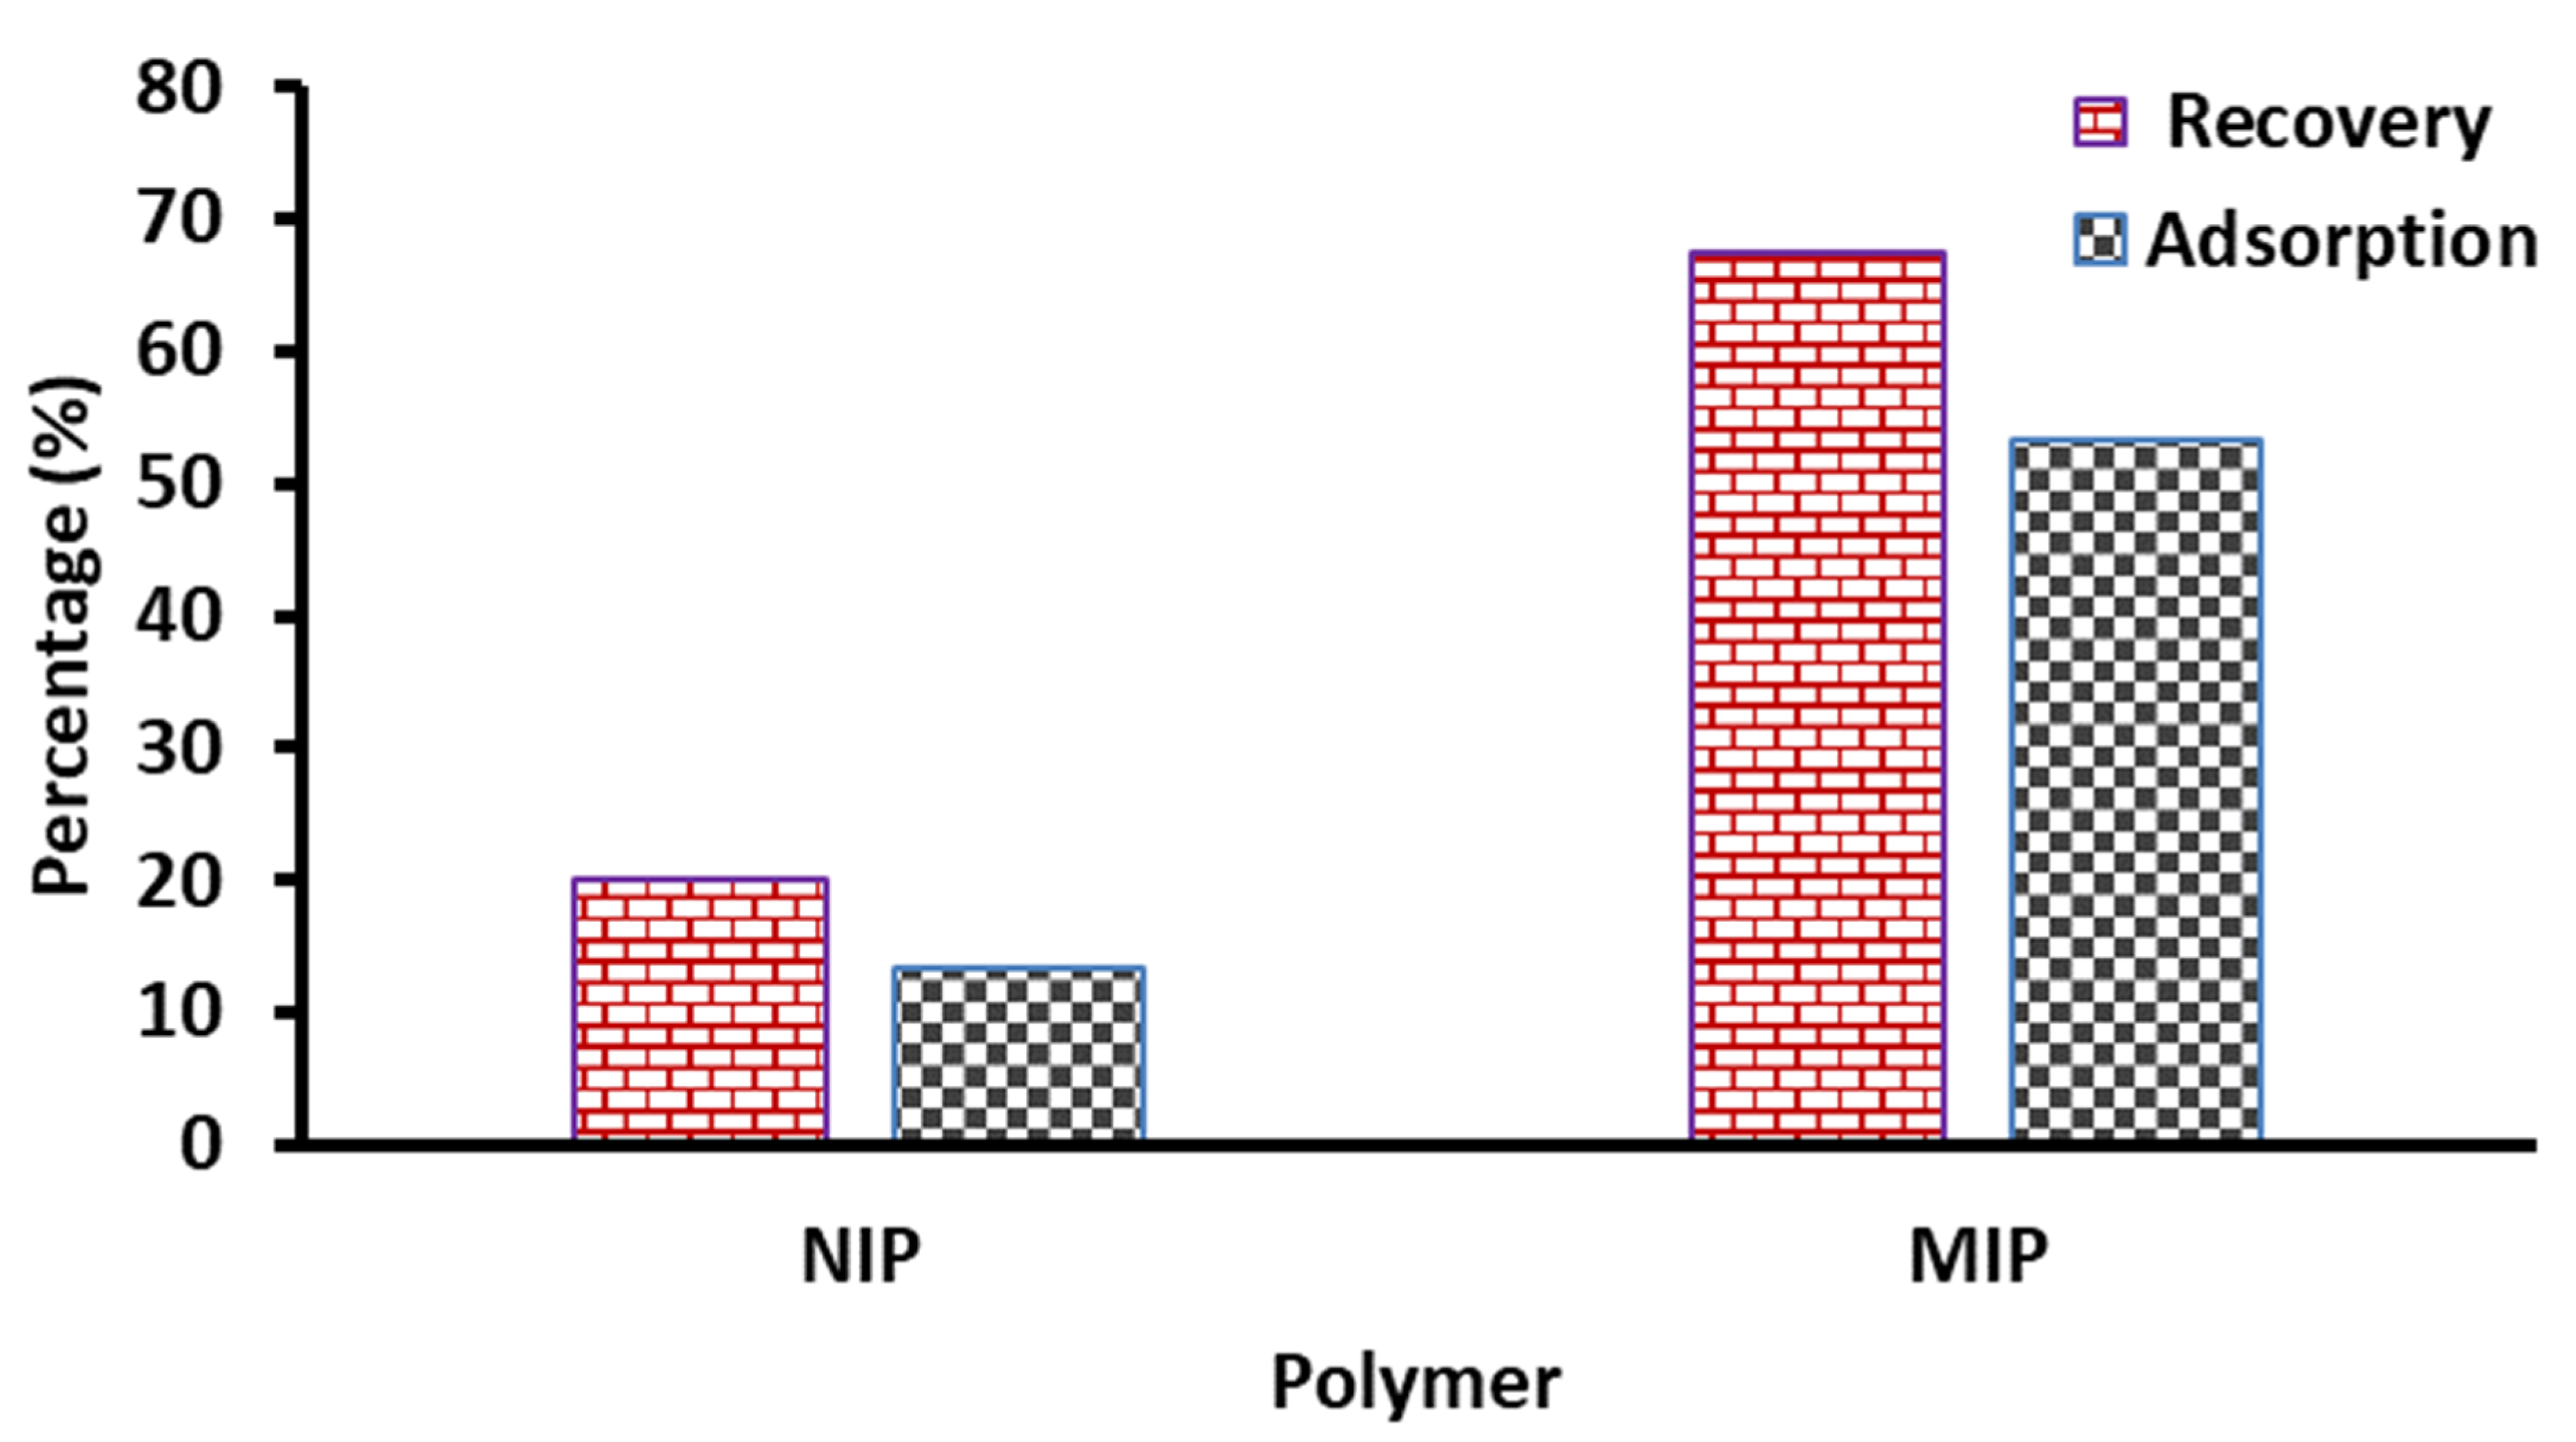
3.2. Binding Characteristics and Adsorption Capacity

The binding characteristics and adsorption capacity studies were carried out to evaluate the differences in analyte binding between the MIP and NIP. From the sorption studies, there was a clear difference between the adsorption of trenbolone on the MIP and NIP (Figure 3 shows the UV spectra for the analyte solution before incubation (sample) and the solutions after incubation on the MIP and NIP). This was shown by the difference in the absorbance, which can be directly correlated to the trenbolone concentration on the respective solutions. The imprinting factor was used to evaluate the MIP recognition properties. According to the literature, a MIP with an IF of >1.2 can be classified as suitable for the recognition of the analyte [55]. The calculated imprinting factor for the synthesized polymer was 2.41, which is greater than 1.2, meaning that the MIP had suitable recognition properties [62,63].
The concentration difference was further confirmed by actual concentrations in studying the adsorption capacities of the respective polymers, as shown in Figure 4. The MIP generally had higher adsorption capacity in comparison with the NIP. This was expected as the MIP has specific imprinted sites on the polymer for the analyte [56]. Thus, this informed the choice of using the MIP only for the optimisation of the extraction procedure. Adsorption studies were done to investigate the adsorption behaviour of the MIP and NIP. The equilibrium adsorption data for trenbolone onto the polymers was investigated using Langmuir [64] and Freundlich [64] isotherms with the nonlinear Equations (5) and (6).
Langmuir :   q e = q m k L C e 1 + k L C e
where qe, qm, kl and Ce are amount of trenbolone adsorbed, maximum adsorption capacity, Langmuir constant and concentration of trenbolone at equilibrium respectively.
Freundlich :   q e = K F C e 1 n
where KF, Ce and n are the measure of adsorption capacity, equilibrium concentration and indicator of adsorption effectiveness, respectively.
The adsorption data obtained for trenbolone adsorption onto the MIP were shown to fit the Langmuir isotherm with a correlation coefficient of 0.9263, which was greater than the R2 of 0.8100 for the Freundlich isotherm. This meant that the adsorption of trenbolone onto the MIP was homogenous and thus assumed monolayer adsorption [65,66,67]. The maximum adsorption capacity calculated using the Langmuir isotherm was found to be 27.5 mg g−1. Trenbolone adsorption onto the NIP was characterized by the Freundlich adsorption isotherm with an adsorption capacity of 11.4 mg g−1.

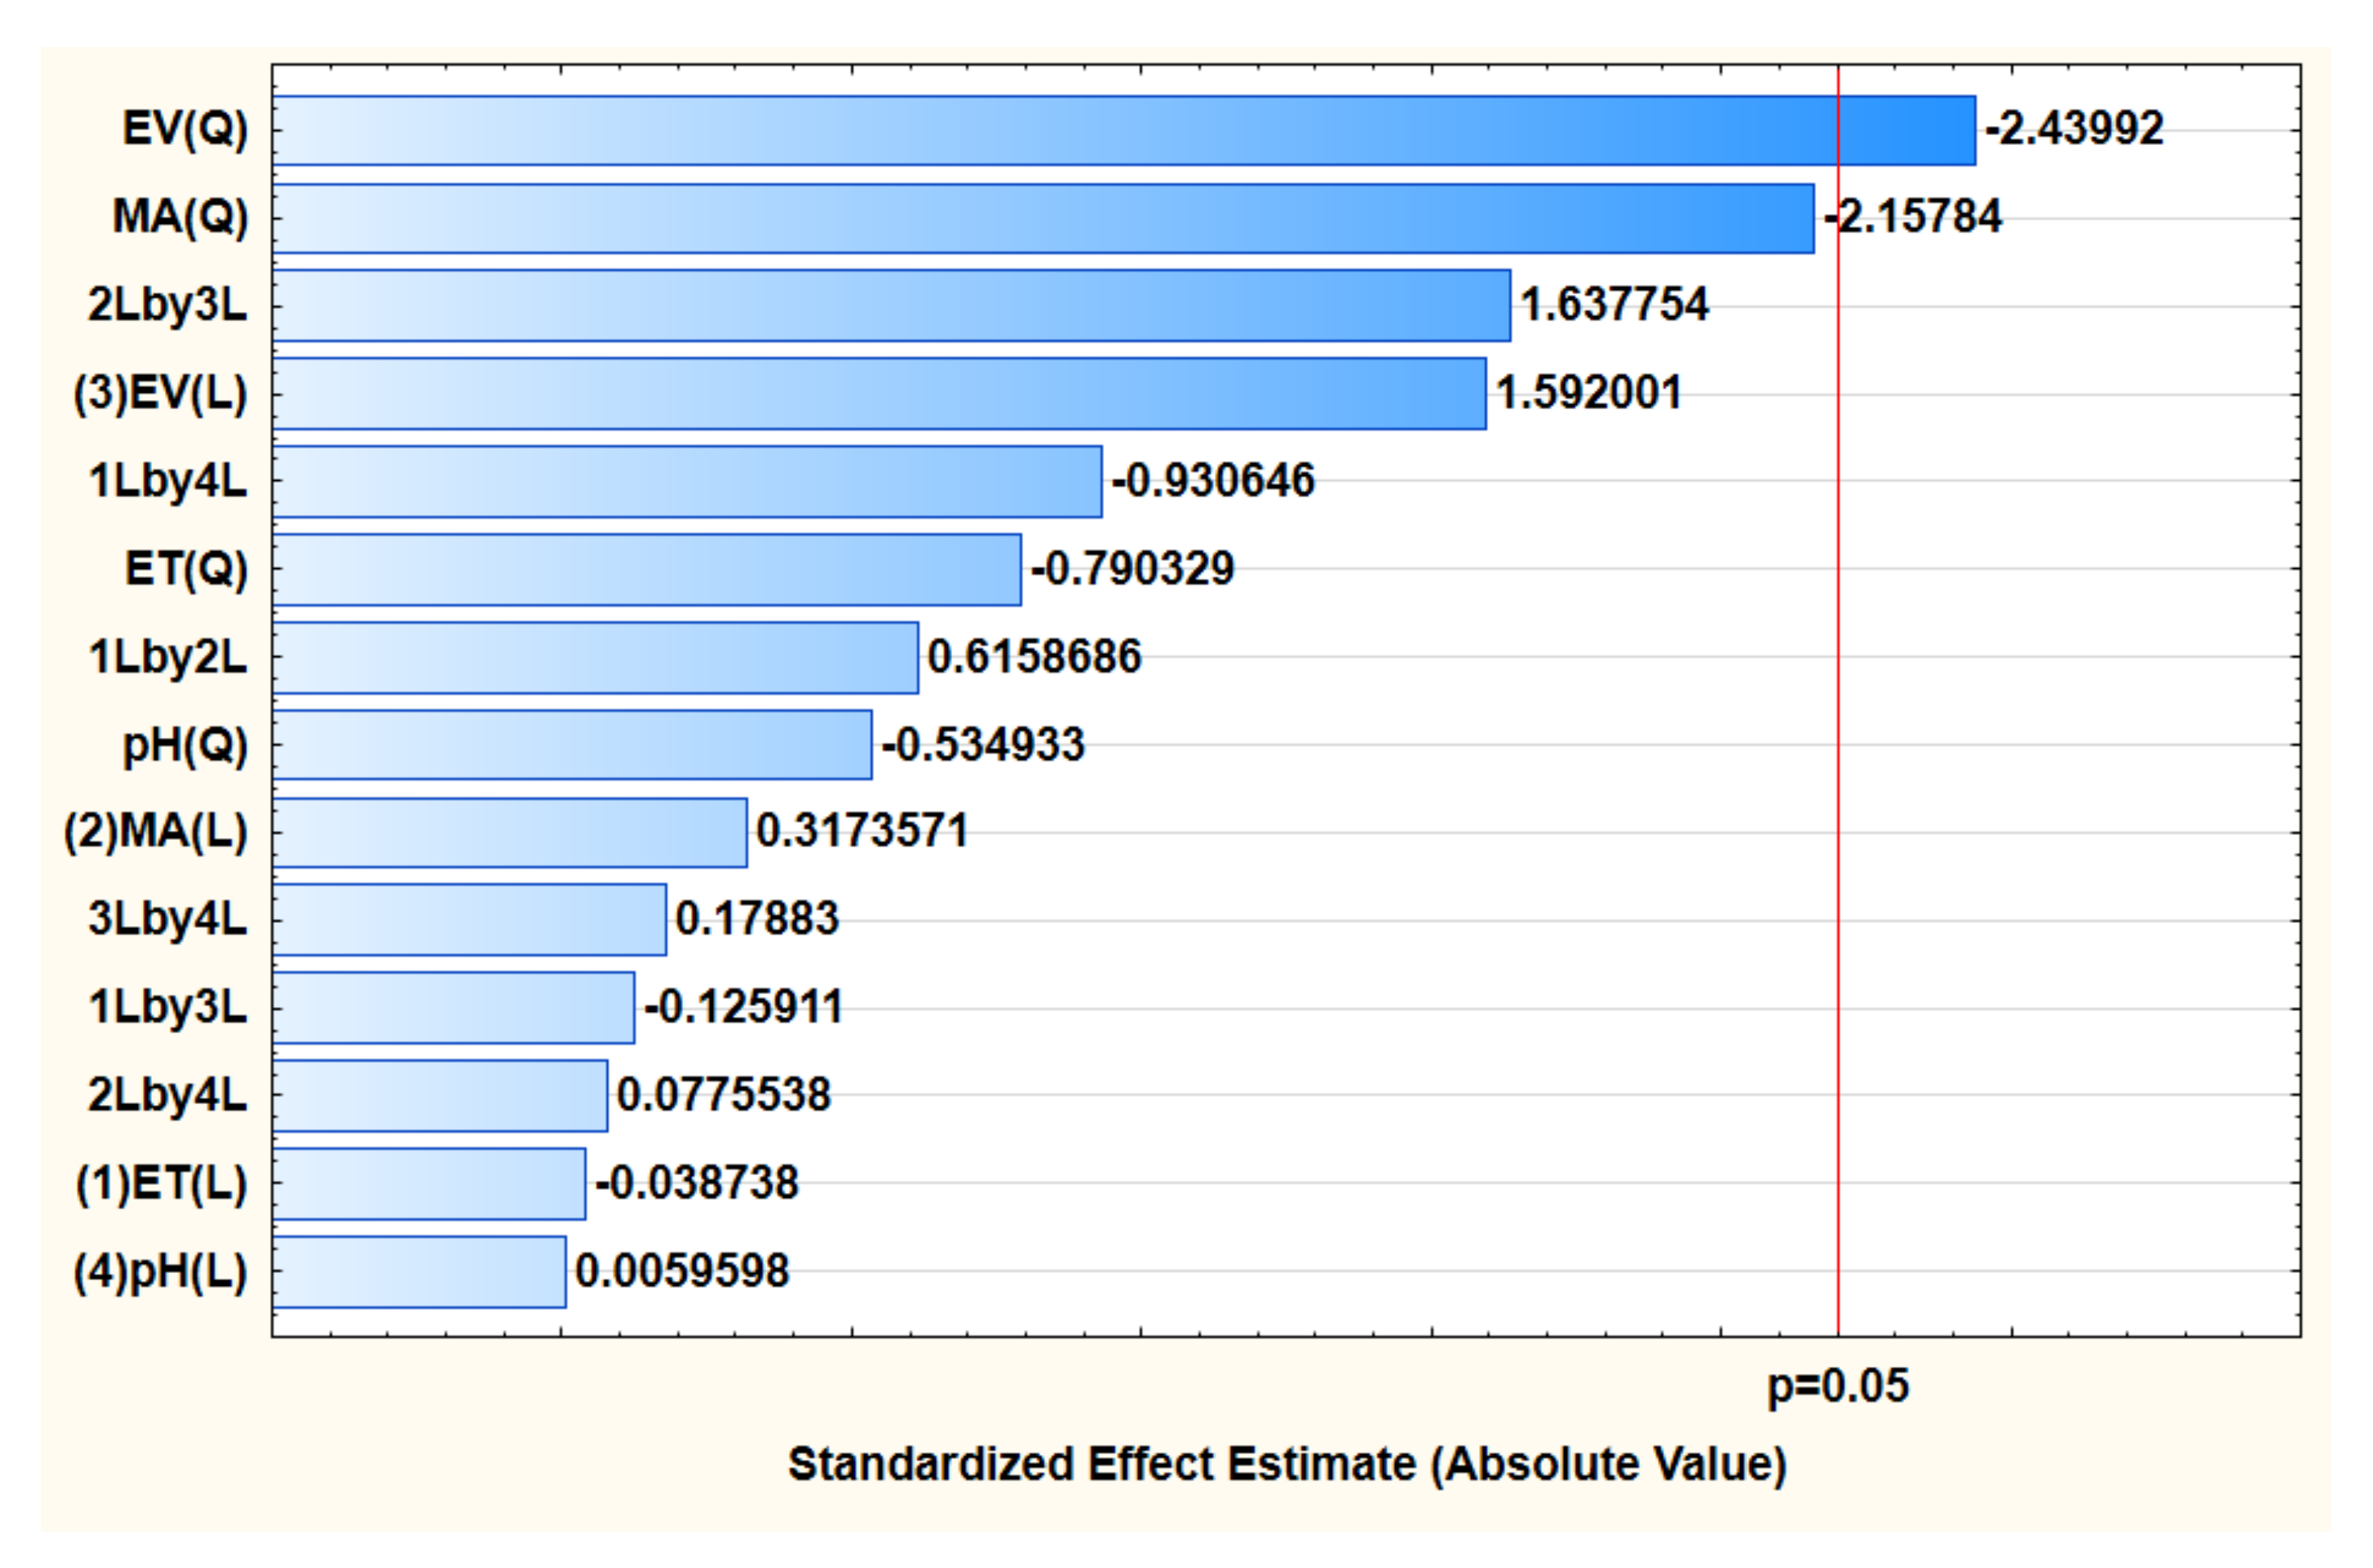
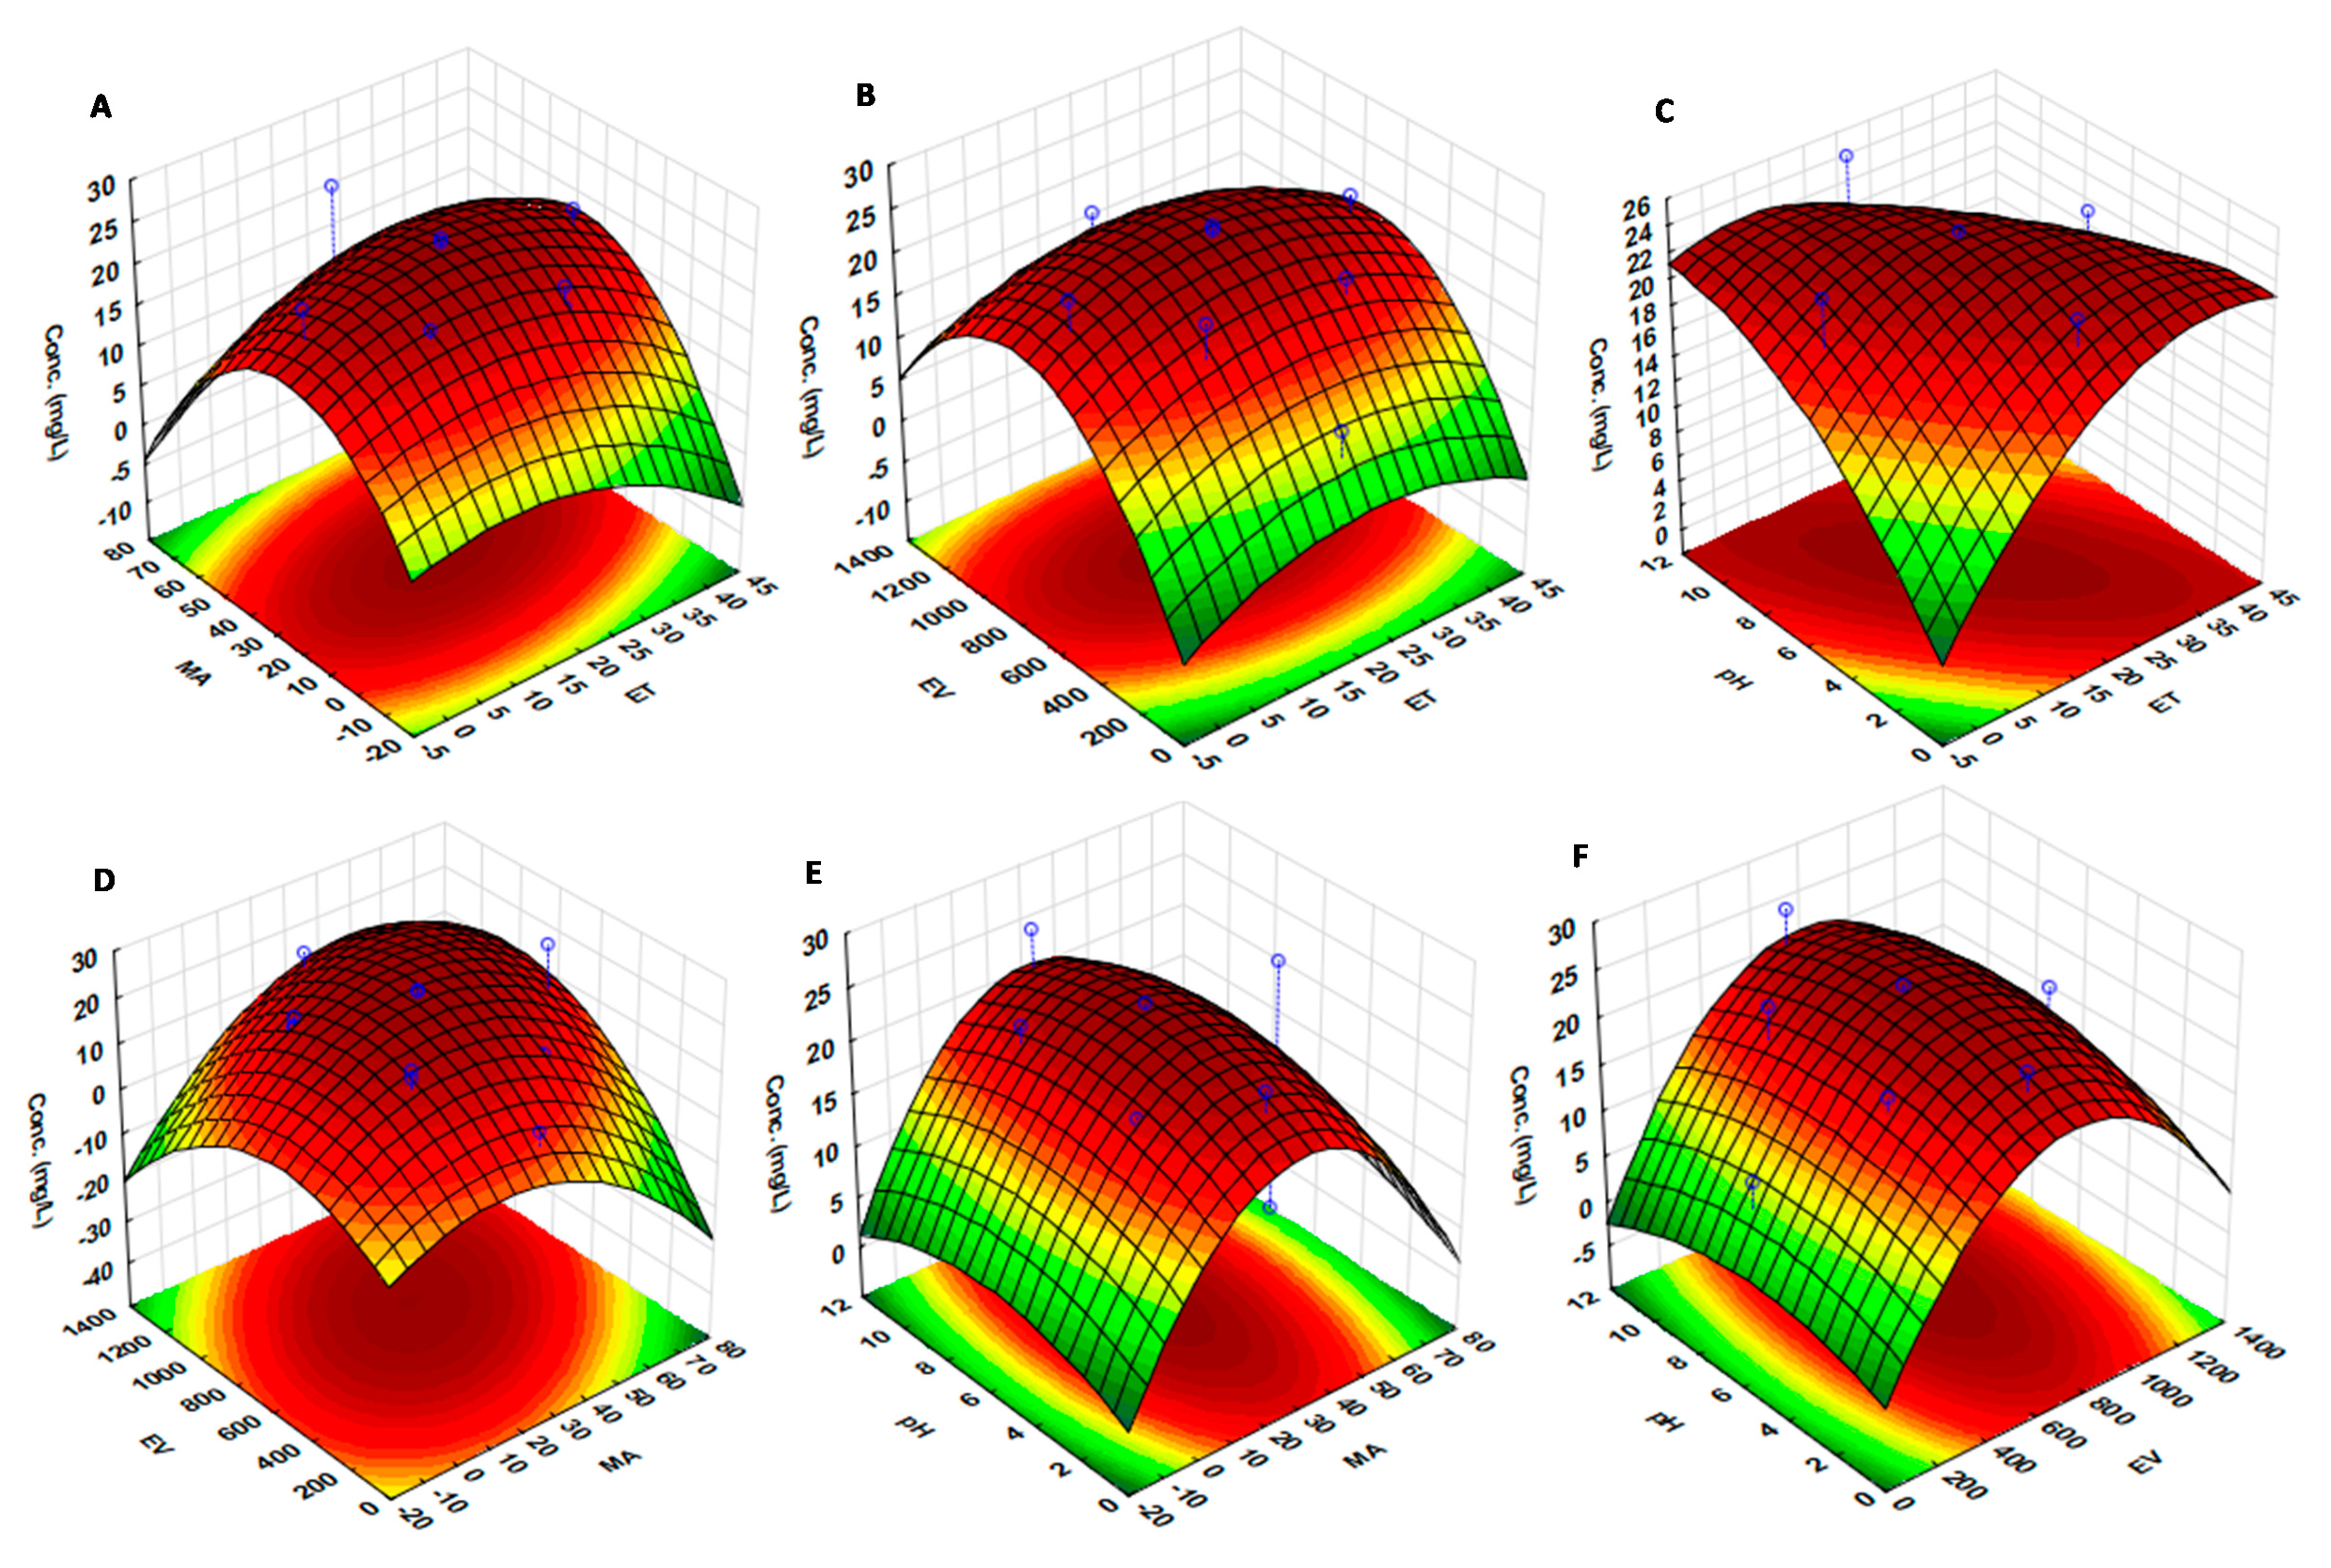
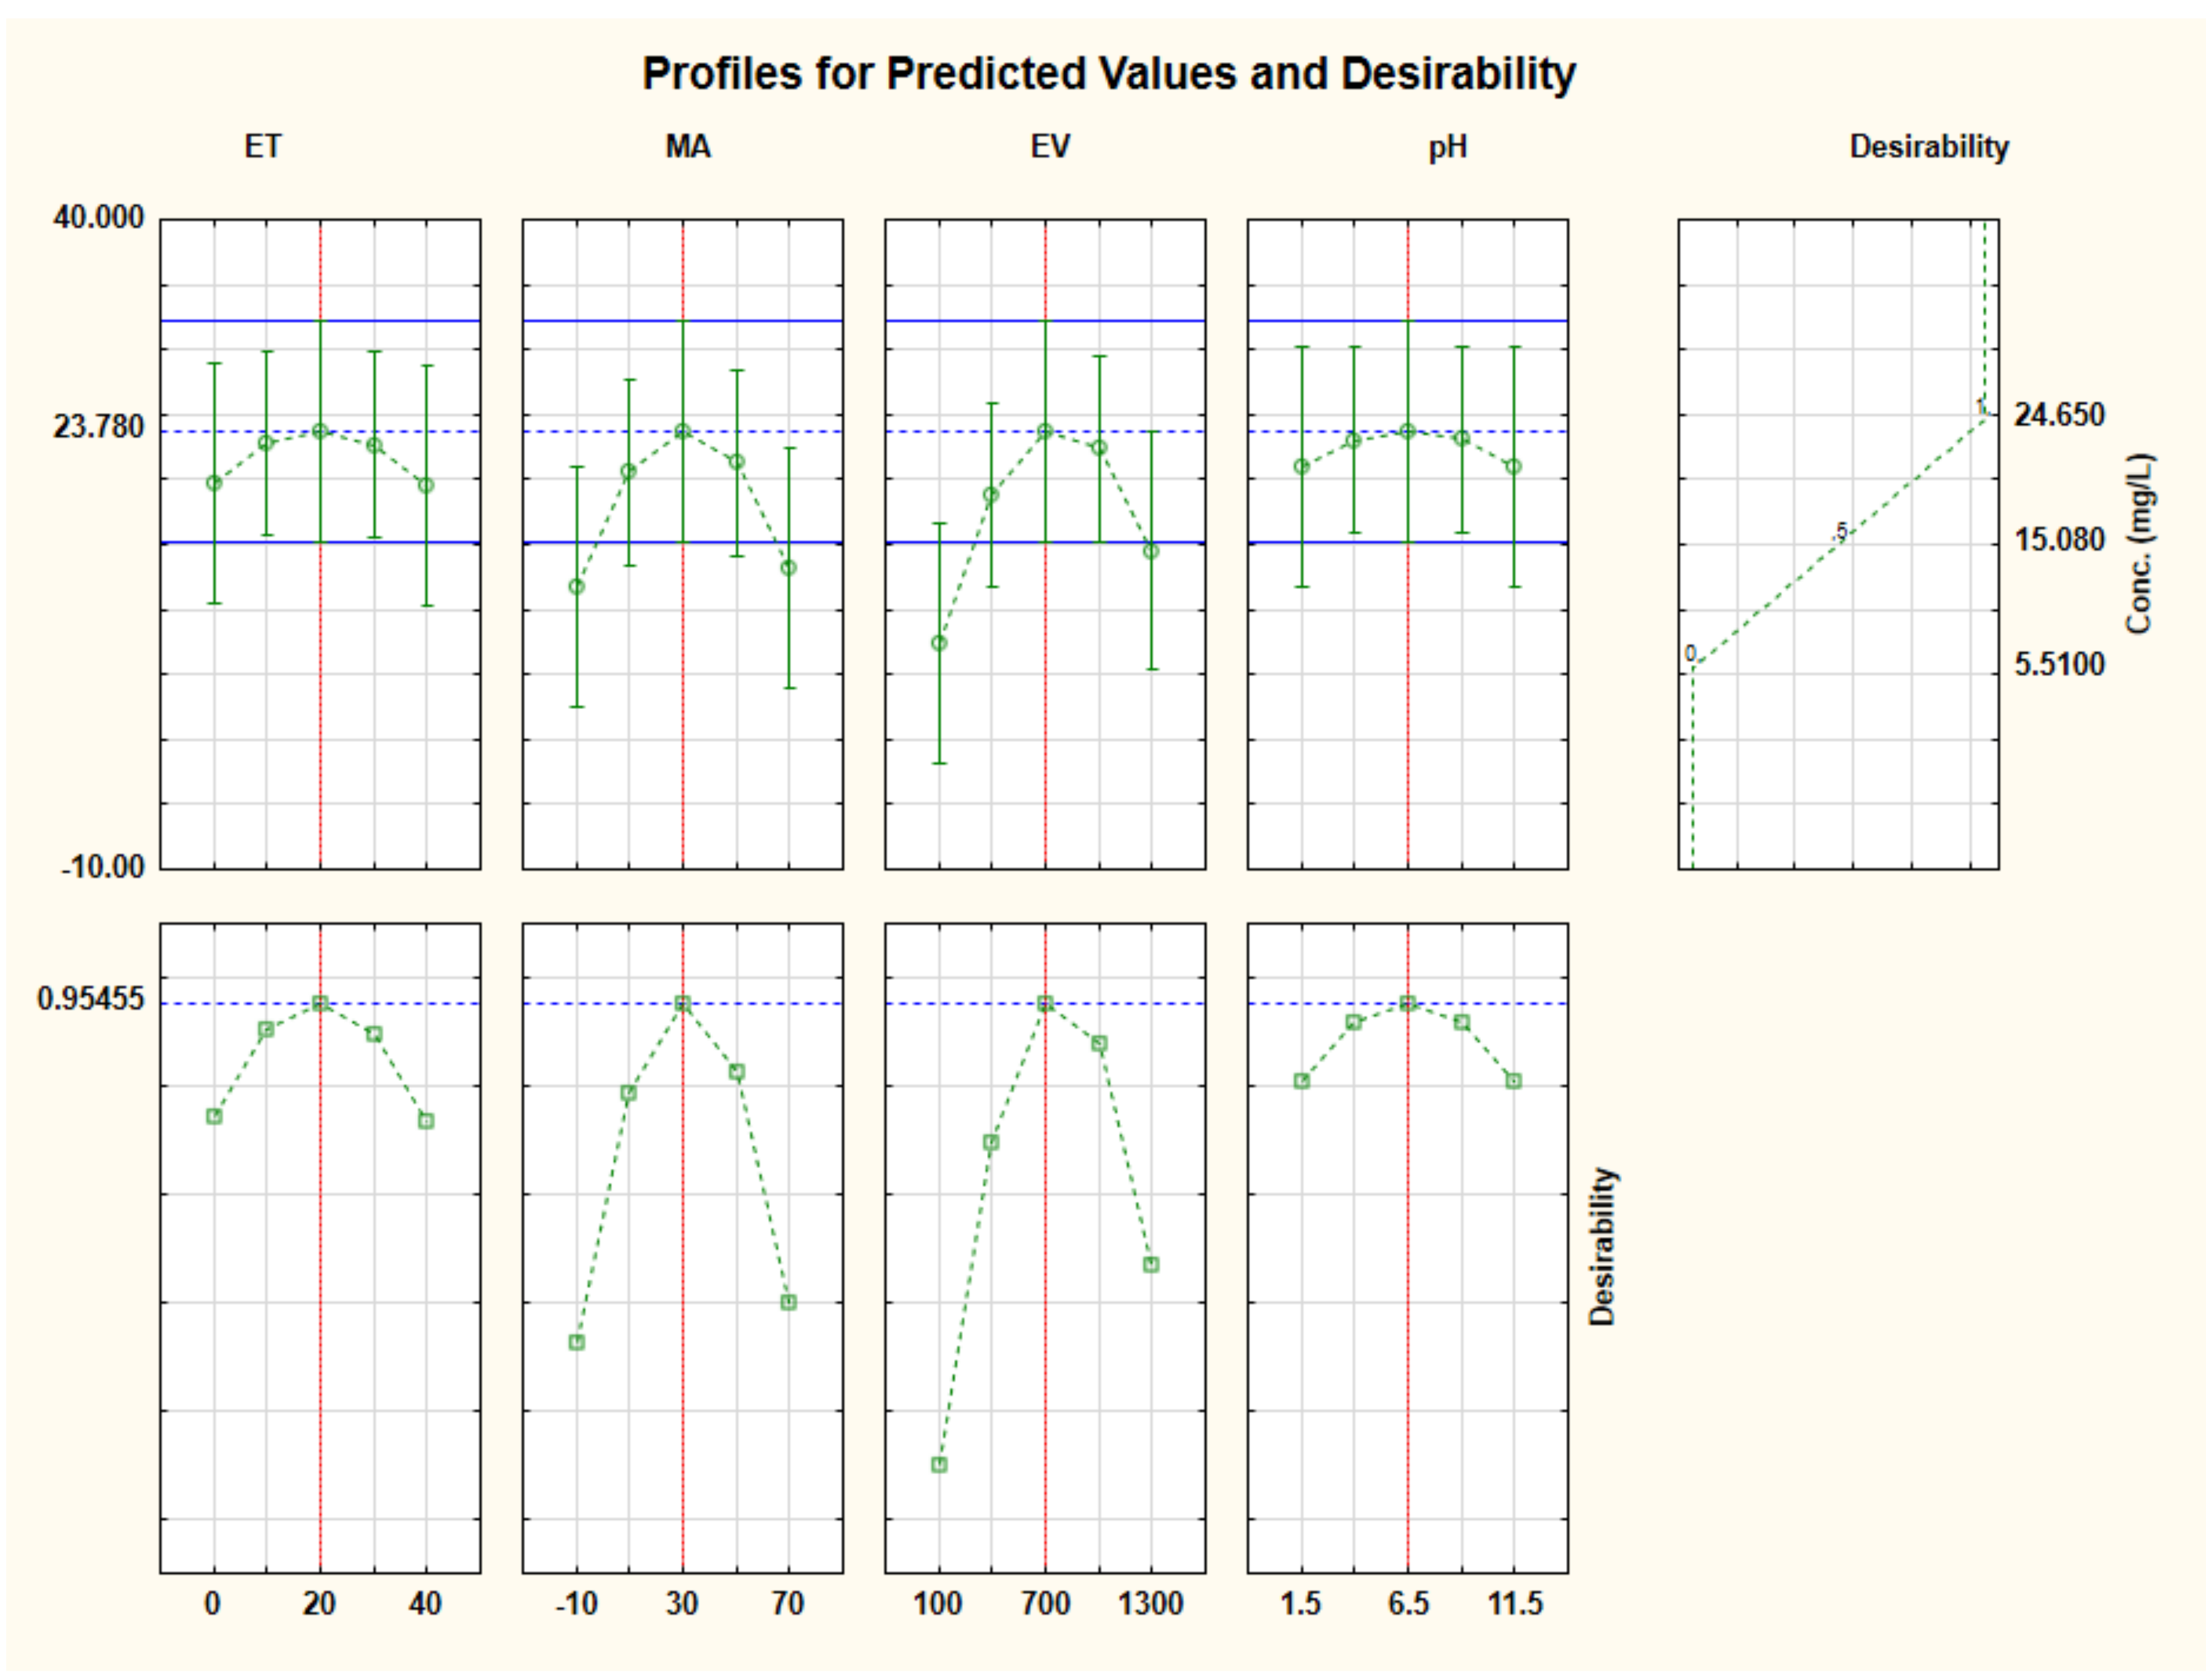
3.3. Multivariate Optimisation

The optimisation results were analysed using the analysis of variance (ANOVA), response surface methodology and desirability function in order to determine the significant factors, interaction effects and desirable conditions for optimum extraction [68]. The analysis of variance is reported in the form of a Pareto chart (Figure 5), where the redline is indicative of the 95% confidence interval that a factor has significant effect on the extraction of trenbolone using the MIP [69]. From the Pareto chart, there was no factor that was significant for the extraction at the 95% confidence level. The reason for this could be the dependency of the analyte adsorption on the sites created during the imprinting, resulting in the extraction being a result of the analyte removal from the MIP.
The response surface methodology was used to investigate the interactive effects of the independent factors on the analytical response (extracted trenbolone concentration). The 3D response surface plots are presented in Figure 6. The combined effected of MA and other factors (ET, pH and EV) revealed that better adsorption was obtained as the mass increased from 10–50 mg (Figure 6A,D,E). This suggests that an increased mass of a polymer increases the available template binding sites, thus leading to quantitative trenbolone extraction. The interactive effect between MA and EV shows that high recoveries were obtained when the eluent volume was between 700 µL and 800 µL (Figure 6D). This implies that higher eluent volumes (>500 µL) are required for the complete removal of the template (trenbolone) from the polymer. A similar trend was observed in Figure 6B,F. The combined effect of ET with pH, MA and EV shows that quantitative extraction of trenbolone took place at any point where ET > 0. These findings correspond to the Pareto chart results, which show that this factor was not significant at the 95% confidence level. The effect of pH showed that, at highly acidic pH < 4, the extraction efficiency of the adsorbent was low (Figure 6C,E,F). The reason for this could be that an acidic environment causes the unbinding of the analyte from the MIP.
The profile of desirability and predicted values (Figure 7) was used to estimate the optimum conditions based on the desirability of each factor [70]. The highest extraction was assigned a desirability of 1, while the central and lowest were assigned 0.5 and 0, respectively. A desirability value of 1 was selected as the target and used to estimate the conditions required for optimum signal enhancement. These conditions included a sample pH of 6.5, MA of 30 mg, ET of 20 min and EV of 700 µL. The predicted conditions were then experimentally confirmed and resulted in an average concentration of 19.57 ± 0.15 and enhancement factor of 7.8.

3.4. Analytical Performance and Validation of MIP Extraction Method

The analytical performance of the method was evaluated using the limits of detection (LOD) and quantification (LOQ), the linear range (LR), %RSD, enrichment factor (EF) and preconcentration factor (PF). The LOD and LOQ are described by the expressions L O D =   3 × s d m  and L O Q =   10 × s d m , respectively, where sd is the standard deviation of seven replicates of the lowest concentration standard sample prepared in ultra-pure water and m is the slope of the calibration curve [71]. From this method, the LOD, LOQ, LR, %RSD, EF and PF were found to be 0.07, 0.24 mg L−1, LOQ—10 mg L−1, 0.75, 7.2 and 14, respectively.
The adsorption and recovery % of trenbolone was then used to determine the effectiveness of the polymers in selectively binding trenbolone. The experimental results are presented in Figure 8, where it can be noted that the MIP had superior adsorption and enhancement in comparison to the NIP. This means that the MIP could selectively bind trenbolone in the presence of interferences better than the NIP. The selectivity coefficient (α) for the MIP was found to be 4.96, with distribution ratio (KD) values of 1.14 and 0.23 for trenbolone and b-estradiol, respectively. The α for the NIP was found to be 1.17, with KD values of 0.15 and 0.13, respectively. The higher KD for the trenbolone confirmed better MIP selectivity when compared to the NIP.

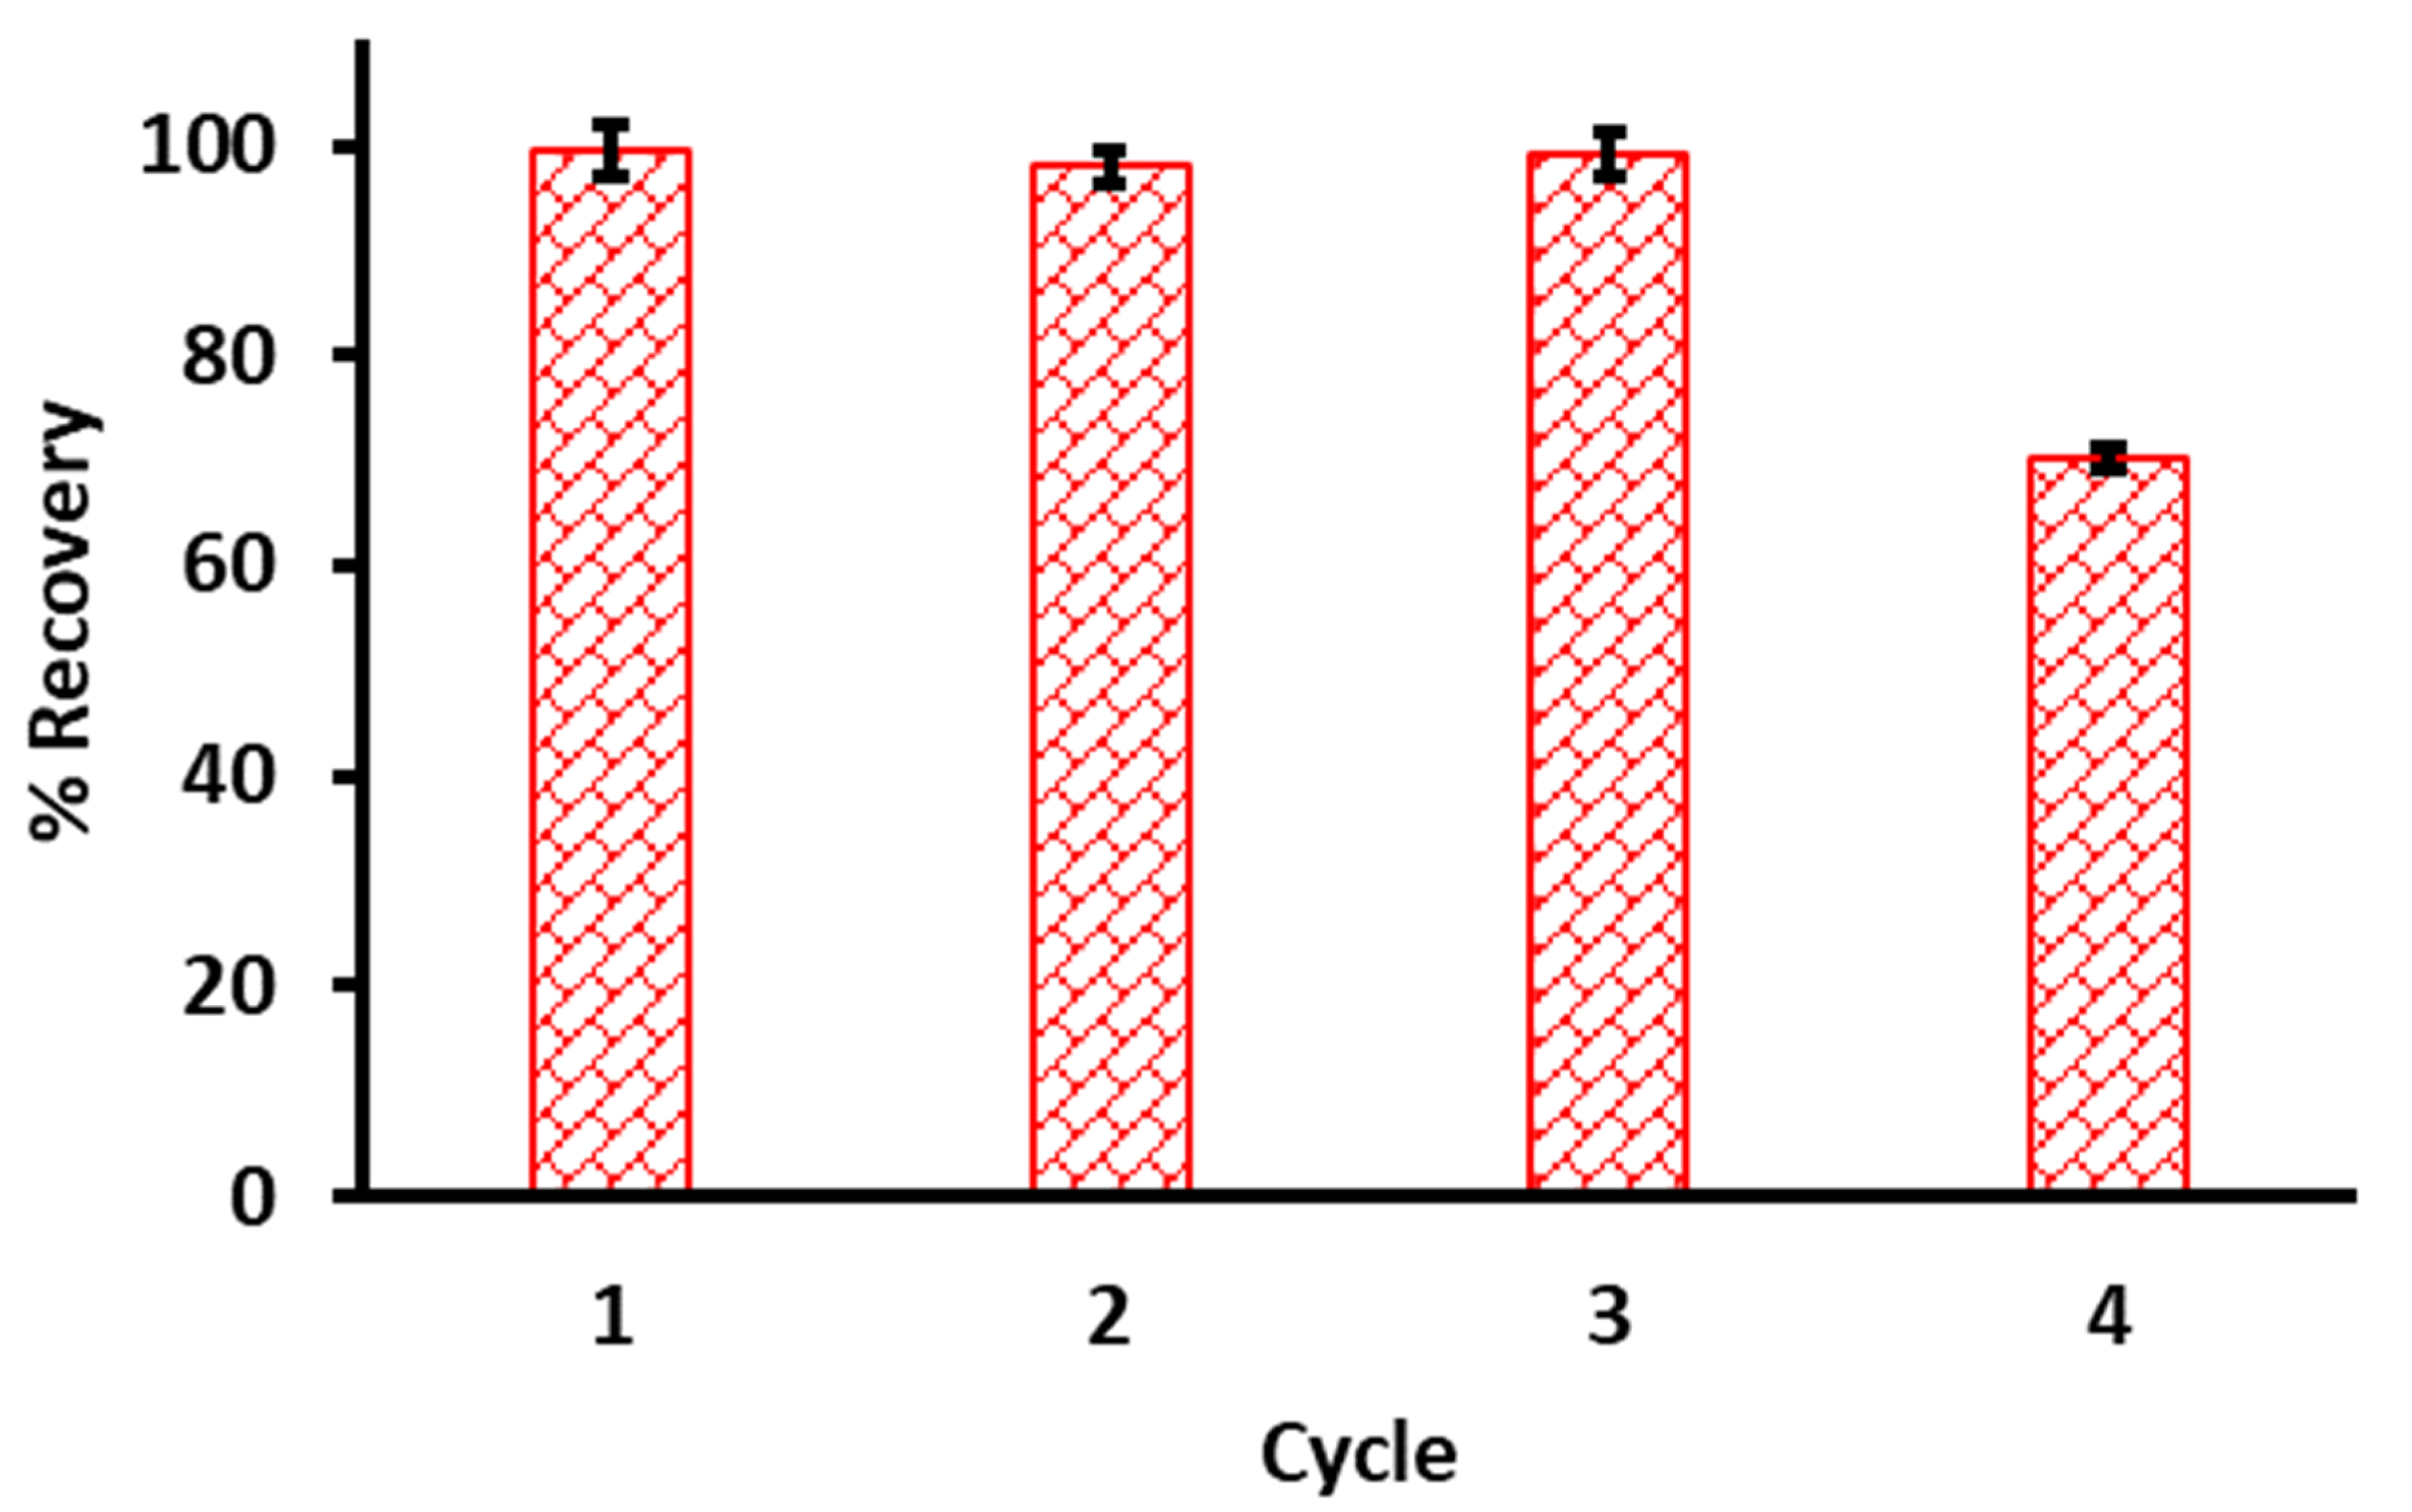
3.5. Polymer Reusability

The reusability studies of the polymer were carried out using the polymer in the preconcentration procedure, eluting the analyte, washing the polymer with the eluent and vacuum-drying the polymer for reuse after each cycle. The reusability results are presented in Figure 9, where it can be noted that, in cycles 1–3, the trenbolone recovery was above 95%. A significant decrease in recovery was observed in the fourth cycle, where the recovery was 70.7 ± 0.32%.

4. Conclusions

A molecularly imprinted polymer based on a trenbolone template was prepared. The FTIR spectra of MIP and NIP showed that the chemical compositions of the polymers were similar, while the SEM image of MIP was more ordered in comparison to that of NIP. Using UV-Vis spectrophotometry quantification and adsorption data, the imprinting factor and isotherms showed that the MIP was favourable. The MIP was then used in solid-phase extraction of trenbolone. The extraction procedure was optimised using a multivariate experimental design based on central composite, and the SPE optimum conditions were found to be pH of 6.5, MA of 30 mg, ET of 20 min and EV of 700 µL. The adsorption of trenbolone was found to favour Langmuir, which meant the adsorption followed a monolayer mechanism with an imprinting factor (IF) of 2.41. The MIP was found to be recyclable for up to three times with recoveries above 95%.

Author Contributions

A.M., M.D., B.M. and P.N.N., Conceptualization; A.M. and P.N.N., method development; P.N.N., chemometrics; A.M. and M.D., sampling; A.M. and M.D., investigation; A.M., M.D., synthesis and characterization, A.M. and M.D., data collection; A.M., writing—original draft; B.M. and P.N.N., writing—review and editing; B.M., resources; B.M. and P.N.N., supervision. All authors have read and agreed to the published version of the manuscript.

Funding

This research was funded by Deutscher Akademischer Austauschdienst (DAAD, Germany grant no. 91752008).

Institutional Review Board Statement

Not applicable.

Informed Consent Statement

Not applicable.

Data Availability Statement

The data presented in this study are available on request from the corresponding author.

Acknowledgments

National Research Foundation (NRF, South Africa, grant nos. 113010 and 91230).

Conflicts of Interest

The authors declare no conflict of interest.

References

  1. Halder, J.N.; Islam, M.N. Water Pollution and its Impact on the Human Health. J. Environ. Hum. 2015, 2, 36–46. [Google Scholar] [CrossRef]
  2. Kumar, P.; Masago, Y.; Mishra, B.K.; Fukushi, K. Evaluating future stress due to combined effect of climate change and rapid urbanization for Pasig-Marikina River, Manila. Groundw. Sustain. Dev. 2018, 6, 227–234. [Google Scholar] [CrossRef]
  3. Salerno, F.; Gaetano, V.; Gianni, T. Urbanization and climate change impacts on surface water quality: Enhancing the resilience by reducing impervious surfaces. Water Res. 2018, 144, 491–502. [Google Scholar] [CrossRef]
  4. Miller, J.D.; Hutchins, M. The impacts of urbanisation and climate change on urban flooding and urban water quality: A review of the evidence concerning the United Kingdom. J. Hydrol. Reg. Stud. 2017, 12, 345–362. [Google Scholar] [CrossRef] [Green Version]
  5. Chen, M.; Zhang, J. Bioremediation of soils contaminated with polycyclic aromatic hydrocarbons, petroleum, pesticides, chlorophenols and heavy metals by composting: Applications, microbes and future research needs. Biotechnol. Adv. 2015, 33, 745–755. [Google Scholar] [CrossRef]
  6. Jacobsen, C.S.; Hjelmsø, M.H. Agricultural soils, pesticides and microbial diversity. Curr. Opin. Biotechnol. 2014, 27, 15–20. [Google Scholar] [CrossRef]
  7. Kassotis, C.D.; Alvarez, D.A.; Taylor, J.A.; Frederick, S.; Nagel, S.C.; Tillitt, D.E. Characterization of Missouri surface waters near point sources of pollution reveals potential novel atmospheric route of exposure for bisphenol A and wastewater hormonal activity pattern. Sci. Total Environ. 2015, 524, 384–393. [Google Scholar] [CrossRef] [PubMed]
  8. Harley, K.G.; Gunier, R.B.; Kogut, K.; Johnson, C.; Bradman, A.; Calafat, A.M.; Eskenazi, B. Prenatal and early childhood bisphenol A concentrations and behavior in school-aged children. Environ. Res. 2013, 126, 43–50. [Google Scholar] [CrossRef] [PubMed] [Green Version]
  9. Palanza, P.; Nagel, S.C.; Parmigiani, S.; Saal, F.S. Perinatal exposure to endocrine disruptors: Sex, timing and behavioral endpoints. Curr. Opin. Behav. Sci. 2015, 7, 69–75. [Google Scholar] [CrossRef] [Green Version]
  10. Peng, H.; Luo, M.; Xiong, H.; Yu, N.; Ning, F.; Fan, J.; Zeng, Z.; Li, J.; Chen, L. Preparation of photonic-magnetic responsive molecularly imprinted microspheres and their application to fast and selective extraction of. J. Chromatogr. A 2016, 1442, 1–11. [Google Scholar] [CrossRef] [Green Version]
  11. López-García, M.; Romero-González, R.; Frenich, A.G. Determination of steroid hormones and their metabolite in several types of meat samples by ultra high performance liquid chromatography—Orbitrap high resolution mass spectrometry. J. Chromatogr. A 2015, 1540, 21–30. [Google Scholar] [CrossRef]
  12. Horie, M.; Nakazawa, H. Determination of trenbolone and zeranol in bovine muscle and liver by liquid chromatography—electrospray mass spectrometry. J. Chromatogr. A 2000, 882, 53–62. [Google Scholar] [CrossRef]
  13. Tomkins, P.; Saaristo, M.; Bertram, M.G.; Michelangeli, M.; Tomkins, R.B.; Wong, B.B.M. An endocrine-disrupting agricultural contaminant impacts sequential female mate choice in fish. Environ. Pollut. 2018, 237, 103–110. [Google Scholar] [CrossRef] [PubMed]
  14. Kaklamanos, G.; Theodoridis, G. Rapid multi-method for the determination of growth promoters in bovine milk by liquid chromatography—tandem mass spectrometry. J. Chromatogr. B 2013, 930, 22–29. [Google Scholar] [CrossRef]
  15. Lega, F.; Angeletti, R.; Stella, R.; Rigoni, L.; Biancotto, G.; Giusepponi, D.; Moretti, S.; Saluti, G.; Galarini, R. Abuse of anabolic agents in beef cattle: Could bile be a possible alternative matrix? Food Chem. 2017, 229, 188–197. [Google Scholar] [CrossRef]
  16. Zhang, F.; Xie, Y.; Li, X.; Wang, D.; Yang, L.; Nie, Z. Science of the Total Environment Accumulation of steroid hormones in soil and its adjacent aquatic environment from a typical intensive vegetable cultivation of North China. Sci. Total Environ. 2015, 538, 423–430. [Google Scholar] [CrossRef]
  17. Lagesson, A.; Saaristo, M.; Brodin, T.; Fick, J.; Klaminder, J.; Martin, J.M.; Wong, B.B.M. Fish on steroids: Temperature-dependent effects of 17 b-trenbolone on predator escape, boldness, and exploratory behaviors. Environ. Pollut. 2019, 245, 243–252. [Google Scholar] [CrossRef]
  18. Feng, R.; Zhang, Y.; Li, H.; Wu, D.; Xin, X.; Zhang, S.; Yu, H. Ultrasensitive electrochemical immunosensor for zeranol detection based on signal amplification strategy of nanoporous gold films and nano-montmorillonite as labels. Anal. Chim. Acta 2013, 758, 72–79. [Google Scholar] [CrossRef]
  19. Ma, F.; Liu, D. 17β-trenbolone, an anabolic–androgenic steroid as well as an environmental hormone, contributes to neurodegeneration. Toxicol. Appl. Pharmacol. 2015, 282, 68–76. [Google Scholar] [CrossRef]
  20. Płotka-wasylka, J.; Szczepan, N. Modern trends in solid phase extraction: New sorbent media. Trends. Anal. Chem. 2016, 77, 23–43. [Google Scholar] [CrossRef]
  21. Liu, K.; Kang, K.; Li, N.; An, J.; Lian, K.; Kang, W. Simultaneous Determination of Five Hormones in Milk by Automated Online Solid-Phase Extraction Coupled to High-Performance Liquid Chromatography. J. AOAC Int. 2020, 103, 265–271. [Google Scholar] [CrossRef] [PubMed]
  22. Sampaio, N.M.F.M.; Castilhos, D.B.N.; da Silva, B.C.; Riegel-Vidotti, I.C.; Silva, B.J.G. Evaluation of Polyvinyl Alcohol/Pectin-Based Hydrogel Disks as Extraction Phase for Determination of Steroidal Hormones in Aqueous Samples by GC-MS/MS. Molecules 2019, 24, 40. [Google Scholar] [CrossRef] [PubMed] [Green Version]
  23. Zheng, J.; Xi, C.; Wang, G.; Cao, S.; Tang, B.; Mu, Z. Rapid Screening and Determination of the Residues of Hormones and Sedatives in Milk Powder Using the UHPLC-MS/MS and SPE. Food Anal. Methods 2018, 11, 3435–3451. [Google Scholar] [CrossRef]
  24. Jodar, L.V.; Santos, F.A.; Zucolotto, V.; Janegitz, B.C. Electrochemical sensor for estriol hormone detection in biological and environmental samples. J. Solid State Electrochem. 2018, 22, 1431–1438. [Google Scholar] [CrossRef]
  25. Serafín, V.; Arévalo, B.; Martínez-García, G.; Aznar-Poveda, J.; Lopez-Pastor, J.A.; Beltrán-Sánchez, J.F.; Garcia-Sanchez, A.J.; Garcia-Haro, J.; Campuzano, S.; Yáñez-Sedeño, P. Enhanced determination of fertility hormones in saliva at disposable immunosensing platforms using a custom designed field-portable dual potentiostat. Sens. Actuators B Chem. 2019, 299, 126934. [Google Scholar] [CrossRef]
  26. Savaris, D.L.; Alberton, M.B.; de Matos, R.; Fernanda, M.; Zalazar, D.J.R.; Lindino, C.A. Development of Spectrophotometric Method for the Determination of 17α-Methyltestosterone. Br. J. Anal. Chem. 2019, 6, 12–19. [Google Scholar]
  27. Najim, S.S. Spectrophotometric determination of progesterone and dopamine in breast cancer serum. Univ. Thi Qar. J. 2017, 12, 1_21. [Google Scholar] [CrossRef]
  28. Pérez, R.L.; Escandar, G.M. Multivariate calibration-assisted high-performance liquid chromatography with dual UV and fluorimetric detection for the analysis of natural and synthetic sex hormones in environmental waters and sediments. Environ. Pollut. 2016, 209, 114–122. [Google Scholar] [CrossRef]
  29. Naldi, A.C.; Fayad, P.B.; Prévost, M.; Sauvé, S. Analysis of steroid hormones and their conjugated forms in water and urine by on-line solid-phase extraction coupled to liquid chromatography tandem mass spectrometry. Chem. Cent. J. 2016, 10, 30. [Google Scholar] [CrossRef] [Green Version]
  30. Tomšíková, H.; Aufartová, J.; Solich, P.; Nováková, L.; Sosa-Ferrera, Z.; Santana-Rodríguez, J.J. High-sensitivity analysis of female-steroid hormones in environmental samples. TrAC Trends Anal. Chem. 2012, 34, 35–58. [Google Scholar] [CrossRef]
  31. Migowska, N.; Caban, M.; Stepnowski, P.; Kumirska, J. Simultaneous analysis of non-steroidal anti-inflammatory drugs and estrogenic hormones in water and wastewater samples using gas chromatography–mass spectrometry and gas chromatography with electron capture detection. Sci. Total Environ. 2012, 441, 77–88. [Google Scholar] [CrossRef] [PubMed]
  32. Kazemi, E.; Dadfarnia, S.; Shabani, A.M.H.; Abbasi, A.; Vaziri, M.R.R.; Behjat, A. Iron oxide functionalized graphene oxide as an efficient sorbent for dispersive micro-solid phase extraction of sulfadiazine followed by spectrophotometric and mode-mismatched thermal lens spectrometric determination. Talanta 2016, 147, 561–568. [Google Scholar] [CrossRef] [PubMed]
  33. Mpupa, A.; Nomngongo, P.N. Multivariate-Assisted Solid Phase Extraction Procedure for Simultaneous Preconcentration and Assessment of UV-Filters in Wastewater Prior to UV-Vis Spectrophotometric Determination. In Emerging Pollutants: Some Strategies for the Quality Preservation of Our Environment; IntechOpen: London, UK, 2018; pp. 45–59. [Google Scholar]
  34. Mpupa, A.; Mashile, G.P.; Nomngongo, P.N. Vortex assisted-supramolecular solvent based microextraction coupled with spectrophotometric determination of triclosan in environmental water samples. Open Chem. 2017, 15, 255–262. [Google Scholar] [CrossRef]
  35. Sobańska, A.W.; Kałębasiak, K.; Pyzowski, J.; Brzezińska, E. Quantification of sunscreen benzophenone-4 in hair shampoos by hydrophilic interactions thin-layer chromatography/densitometry or derivative UV spectrophotometry. J. Anal. Methods Chem. 2015, 1–7. [Google Scholar] [CrossRef] [Green Version]
  36. Zygler, A.; Wasik, A.; Namie, J. Retention behaviour of some high-intensity sweeteners on different SPE sorbents. Talanta 2010, 82, 1742–1748. [Google Scholar] [CrossRef]
  37. Dimpe, K.M.; Nomngongo, P.N. Current sample preparation methodologies for analysis of emerging pollutants in different environmental matrices. TrAC Trends Anal. Chem. 2016, 82, 199–207. [Google Scholar] [CrossRef]
  38. Chigome, S.; Darko, G.; Torto, N. Electrospun nanofibers as sorbent material for solid phase extraction. Analyst 2011, 136, 2879–2889. [Google Scholar] [CrossRef] [Green Version]
  39. Wierucka, M.; Biziuk, M. Application of magnetic nanoparticles for magnetic solid-phase extraction in preparing biological, environmental and food samples. Trends Anal. Chem. 2014, 59, 50–58. [Google Scholar] [CrossRef]
  40. Sun, X.; Wang, M.; Peng, J.; Yang, L.; Wang, X.; Wang, F.; Zhang, X.; Wu, Q.; Chen, R.; Chen, J. Dummy molecularly imprinted solid phase extraction of climbazole from environmental water samples. Talanta 2019, 196, 47–53. [Google Scholar] [CrossRef]
  41. Zhang, M.; Mao, Q.; Feng, J.; Yuan, S.; Wang, Q.; Huang, D.; Zhang, J. Validation and application of an analytical method for the determination of selected acidic pharmaceuticals and estrogenic hormones in wastewater and sludge. J. Environ. Sci. Heal Part A 2016, 51, 914–920. [Google Scholar] [CrossRef]
  42. He, S.; Wang, R.; Wei, W.; Liu, H.; Ma, Y. Simultaneous determination of 22 residual steroid hormones in milk by liquid chromatography–tandem mass spectrometry. Int. J. Dairy Technol. 2020, 73, 357–365. [Google Scholar] [CrossRef]
  43. Medina, G.S.; Acquaviva, A.; Reta, M. Development of monolithic sorbent cartridges (m-SPE) for the extraction of non-steroidal anti-inflammatory drugs from surface waters and their determination by HPLC. Microchem. J. 2020, 159, 105447. [Google Scholar] [CrossRef]
  44. Raeke, J.; Lechtenfeld, O.J.; Wagner, M.; Herzsprung, P.; Reemtsma, T. Selectivity of solid phase extraction of freshwater dissolved organic matter and its effect on ultrahigh resolution mass spectra. Environ. Sci. Process Impacts 2016, 18, 918–927. [Google Scholar] [CrossRef] [PubMed]
  45. Bizkarguenaga, E.; Ros, O.; Iparraguirre, A.; Navarro, P.; Vallejo, A.; Usobiaga, A.; Zuloaga, O. Solid-phase extraction combined with large volume injection-programmable temperature vaporization—gas chromatography—mass spectrometry for the multiresidue determination of priority and emerging organic pollutants in wastewater. J. Chromatogr. A 2012, 1247, 104–117. [Google Scholar] [CrossRef] [PubMed]
  46. Gast, M.; Sobek, H.; Mizaikoff, B. Advances in Imprinting Strategies for Selective Virus Recognition A Review. Trends Anal. Chem. 2019, 114, 218–232. [Google Scholar] [CrossRef]
  47. Chen, L.; Wang, X.; Lu, W.; Wu, X.; Li, J. Molecular imprinting: Perspectives and applications. Chem. Soc. Rev. 2016, 45, 2137–2211. [Google Scholar] [CrossRef]
  48. Ming, W.; Wang, X.; Lu, W.; Zhang, Z.; Song, X.; Li, J.; Chen, L. Magnetic molecularly imprinted polymers for the fluorescent detection of trace 17β-estradiol in environmental water. Sens. Actuators B Chem. 2017, 238, 1309–1315. [Google Scholar] [CrossRef]
  49. Ahmad, O.S.; Bedwell, T.S.; Esen, C.; Garcia-Cruz, A.; Piletsky, S.A. Molecularly imprinted polymers in electrochemical and optical sensors. Trends Biotechnol. 2019, 37, 294–309. [Google Scholar] [CrossRef]
  50. Ansari, S.; Masoum, S. Molecularly imprinted polymers for capturing and sensing proteins: Current progress and future implications. TrAC Trends Anal. Chem. 2019, 114, 29–47. [Google Scholar] [CrossRef]
  51. Karaseva, N.; Ermolaeva, T.; Mizaikoff, B. Piezoelectric sensors using molecularly imprinted nanospheres for the detection of antibiotics. Sens. Actuators B Chem. 2016, 225, 199–208. [Google Scholar] [CrossRef]
  52. Zhang, Z.; Li, Y.; Zhang, X.; Liu, J. Molecularly imprinted nanozymes with faster catalytic activity and better specificity. Nanoscale 2019, 11, 4854–4863. [Google Scholar] [CrossRef] [PubMed]
  53. Muratsugu, S.; Shirai, S.; Tada, M. Recent progress in molecularly imprinted approach for catalysis. Tetrahedron. Lett. 2020, 61, 151603. [Google Scholar] [CrossRef]
  54. Turiel, E.; Martin-Esteban, A. Molecularly imprinted polymers: Towards highly selective stationary phases in liquid chromatography and capillary electrophoresis. Anal. Bioanal. Chem. 2004, 378, 1876–1886. [Google Scholar] [CrossRef] [PubMed]
  55. Zink, S.; Moura, F.A.; da Silva Autreto, P.A.; Galvao, D.S.; Mizaikoff, B. Efficient prediction of suitable functional monomers for molecular imprinting via local density of states calculations. Phys. Chem. Chem. Phys. 2018, 20, 13153–13158. [Google Scholar] [CrossRef]
  56. Fernandes, R.S.; Dinc, M.; Raimundo, I.M., Jr.; Mizaikoff, B. Synthesis and characterization of porous surface molecularly imprinted silica microsphere for selective extraction of ascorbic acid. Microporous Mesoporous Mater. 2018, 264, 28–34. [Google Scholar] [CrossRef]
  57. Ma, J.; Yuan, L.; Ding, M.; Wang, S.; Ren, F.; Zhang, J.; Du, S.; Li, F.; Zhou, X. The study of core-shell molecularly imprinted polymers of 17β-estradiol on the surface of silica nanoparticles. Biosens. Bioelectron. 2011, 26, 2791–2795. [Google Scholar] [CrossRef]
  58. Fernandes, R.S.; Dinc, M.; Raimundo, M.R., Jr.; Mizaikoff, B. Analytical Methods microspheres for the selective extraction of vanillin. Anal. Methods 2017, 9, 2883–2889. [Google Scholar] [CrossRef]
  59. Azodi-Deilami, S.; Najafabadi, A.H.; Asadi, E.; Abdouss, M.; Kordestani, D. Magnetic molecularly imprinted polymer nanoparticles for the solid-phase extraction of paracetamol from plasma samples, followed its determination by HPLC. Microchim. Acta 2014, 181, 1823–1832. [Google Scholar] [CrossRef]
  60. Gupta, N.V.; Shivakumar, H.G. Investigation of swelling behavior and mechanical properties of a pH-sensitive superporous hydrogel composite. Iran J. Pharm. Res. IJPR 2012, 11, 481. [Google Scholar]
  61. Arabi, M.; Ghaedi, M.; Ostovan, A. Synthesis and application of in-situ molecularly imprinted silica monolithic in pipette-tip solid-phase microextraction for the separation and determination of gallic acid in orange juice samples. J. Chromatogr. B 2017, 1048, 102–110. [Google Scholar] [CrossRef]
  62. Nantasenamat, C.; Naenna, T.; Ayudhya, C.I.N.; Prachayasittikul, V. Quantitative prediction of imprinting factor of molecularly imprinted polymers by artificial neural network. J. Comput. Aided Mol. Des. 2005, 19, 509–524. [Google Scholar] [CrossRef] [PubMed]
  63. Kidakova, A.; Boroznjak, R.; Reut, J.; Öpik, A.; Saarma, M.; Syritski, V. Molecularly imprinted polymer-based SAW sensor for label-free detection of cerebral dopamine neurotrophic factor protein. Sens. Actuators B Chem. 2020, 308, 127708. [Google Scholar] [CrossRef]
  64. Langmuir, I. The constitution and fundamental properties of solids and liquids. II. Liquids. J. Am. Chem. Soc. 1917, 39, 1848–1906. [Google Scholar] [CrossRef] [Green Version]
  65. Nqombolo, A.; Mpupa, A.; Gugushe, A.S.; Moutloali, R.M.; Nomngongo, P.N. Adsorptive removal of lead from acid mine drainage using cobalt-methylimidazolate framework as an adsorbent: Kinetics, isotherm, and regeneration. Environ. Sci. Pollut. Res. 2019, 26, 3330–3339. [Google Scholar] [CrossRef]
  66. Mashile, P.P.; Mpupa, A.; Nomngongo, P.N. Adsorptive removal of microcystin-LR from surface and wastewater using tyre-based powdered activated carbon: Kinetics and isotherms. Toxicon 2018, 145, 25–31. [Google Scholar] [CrossRef]
  67. Gugushe, A.S.; Nqombolo, A.; Nomngongo, P.N. Application of Response Surface Methodology and Desirability Function in the Optimization of Adsorptive Remediation of Arsenic from Acid Mine Drainage Using Magnetic Nanocomposite: Equilibrium Studies and Application to Real Samples. Molecules 2019, 24, 1792. [Google Scholar] [CrossRef] [Green Version]
  68. Mashile, G.P.; Mpupa, A.; Nomngongo, P.N. In-syringe micro solid-phase extraction method for the separation and preconcentration of parabens in environmental water samples. Molecules 2018, 23, 1450. [Google Scholar] [CrossRef] [Green Version]
  69. Mpupa, A.; Mashile, G.P.; Nomngongo, P.N. Ultrasound-assisted dispersive solid phase nanoextraction of selected personal care products in wastewater followed by their determination using high performance liquid chromatography-diode array detector. J. Hazard. Mater. 2019, 370, 33–41. [Google Scholar] [CrossRef]
  70. Khor, C.P.; Jaafar, M.B.; Ramakrishnan, S. Optimization of Conductive Thin Film Epoxy Composites Properties Using Desirability Optimization Methodology. J. Optim. 2016, 2016, 1–8. [Google Scholar] [CrossRef] [Green Version]
  71. Manzo, V.; Miró, M.; Richter, P. Programmable flow-based dynamic sorptive microextraction exploiting an octadecyl chemically modified rotating disk extraction system for the determination of acidic drugs in urine. J. Chromatogr. A 2014, 1368, 64–69. [Google Scholar] [CrossRef]
Figure 1. Fourier transform infrared spectra (FTIR) for the molecularly imprinted polymer (MIP) and nonimprinted polymer (NIP).
Processes 09 00186 g001
Figure 2. Scanning electronic microscopy (SEM) images for (A) MIP and (B) NIP and X-ray spectrometer (EDS) spectra for (C) MIP and (D) NIP.
Processes 09 00186 g002
Figure 3. Graph showing the effect of the MIP for the removal of trenbolone in a 10 mg/L solution. NIP = 10 mg/L solution after adsorption onto the nonimprinted polymer, MIP = 10 mg/L solution after adsorption onto the imprinted polymer and Sample = original 10 mg/L solution before adsorption.
Processes 09 00186 g003
Figure 4. Adsorption capacity studies for the NIP and MIP.
Processes 09 00186 g004
Figure 5. Pareto chart of standardized factors for the extraction of trenbolone. Factor (Q): Factor (quadratic); factor (L): Factor (linear); 2Lby3L: MA-EV (mass of adsorbent and eluent volume) interaction; 1Lby4L: ET-pH (extraction time—solution pH) interaction; 1Lby2L: ET-MA (extraction time—mass of adsorbent) interaction; 3Lby4L: EV-pH interaction; 1Lby3L: ET-EV interaction; 2Lby4L: MA-pH interaction.
Processes 09 00186 g005
Figure 6. Response surface methodology plots showing the interaction between the independent factors (A) MA and ET, (B) EV and ET, (C) pH and MA, (D) pH and ET, (E) EV and MA and (F) pH and EV.
Processes 09 00186 g006
Figure 7. Desirability profiles with predicted values for the investigated factors affecting the extraction of trenbolone.
Processes 09 00186 g007
Figure 8. Adsorption and extraction performance of the MIP in comparison to the NIP.
Processes 09 00186 g008
Figure 9. Trenbolone percent recovery during different cycles of reusing the MIP (n = 3).
Processes 09 00186 g009
Table 1. Parameter and levels used in central composite experimental design.
FactorsLow Level (−1)Central Point (0)High Level (+1)
Mass of adsorbent (MA) (mg)103050
pH46.59
Extraction time (ET) (min)102030
Eluent volume (µL)4007001000
Publisher’s Note: MDPI stays neutral with regard to jurisdictional claims in published maps and institutional affiliations.

