
Multi-Objective Optimization of Microstructure of Gravure Cell Based on Response Surface Method


Co-Innovation Center of Efficient Processing and Utilization of Forest Resources, Nanjing Forestry University, Nanjing 210037, China
*
Author to whom correspondence should be addressed.
Processes 2021, 9(2), 403; https://0-doi-org.brum.beds.ac.uk/10.3390/pr9020403
Submission received: 29 December 2020
/
Revised: 14 February 2021
/
Accepted: 15 February 2021
/
Published: 23 February 2021
(This article belongs to the Section Advanced Digital and Other Processes)
Abstract
:In order to improve the structural stiffness of the gravure cell structure in the solid printing process and realize a lightweight design, a multi-objective optimization design method was proposed to optimize the parameters of the direct laser engraving of the cell structure. In this paper, based on the characteristics of the cell structure and the analysis of the contact force, the ANSYS parametric design language (APDL) was used to conduct a finite element analysis on the microstructure of the regular hexagonal cell. We found that there is a certain optimization space. Then, a response surface (RSM) method optimization model, using a central composite design (CCD), was established to obtain, and then analyze, the sensitivity of each design variable to the objective functions. Finally, a multi-objective genetic algorithm (MOGA) was used to solve the model. The optimization results show that the maximum deformation was reduced by 44.4%, and the total volume was reduced by 46.3%. By comparing with the model before optimization, the rationality and effectiveness of this method were verified. This shows that the method can be effectively applied to the design optimization of gravure cell microstructure, and it provides theoretical support for new cell design.
1. Introduction
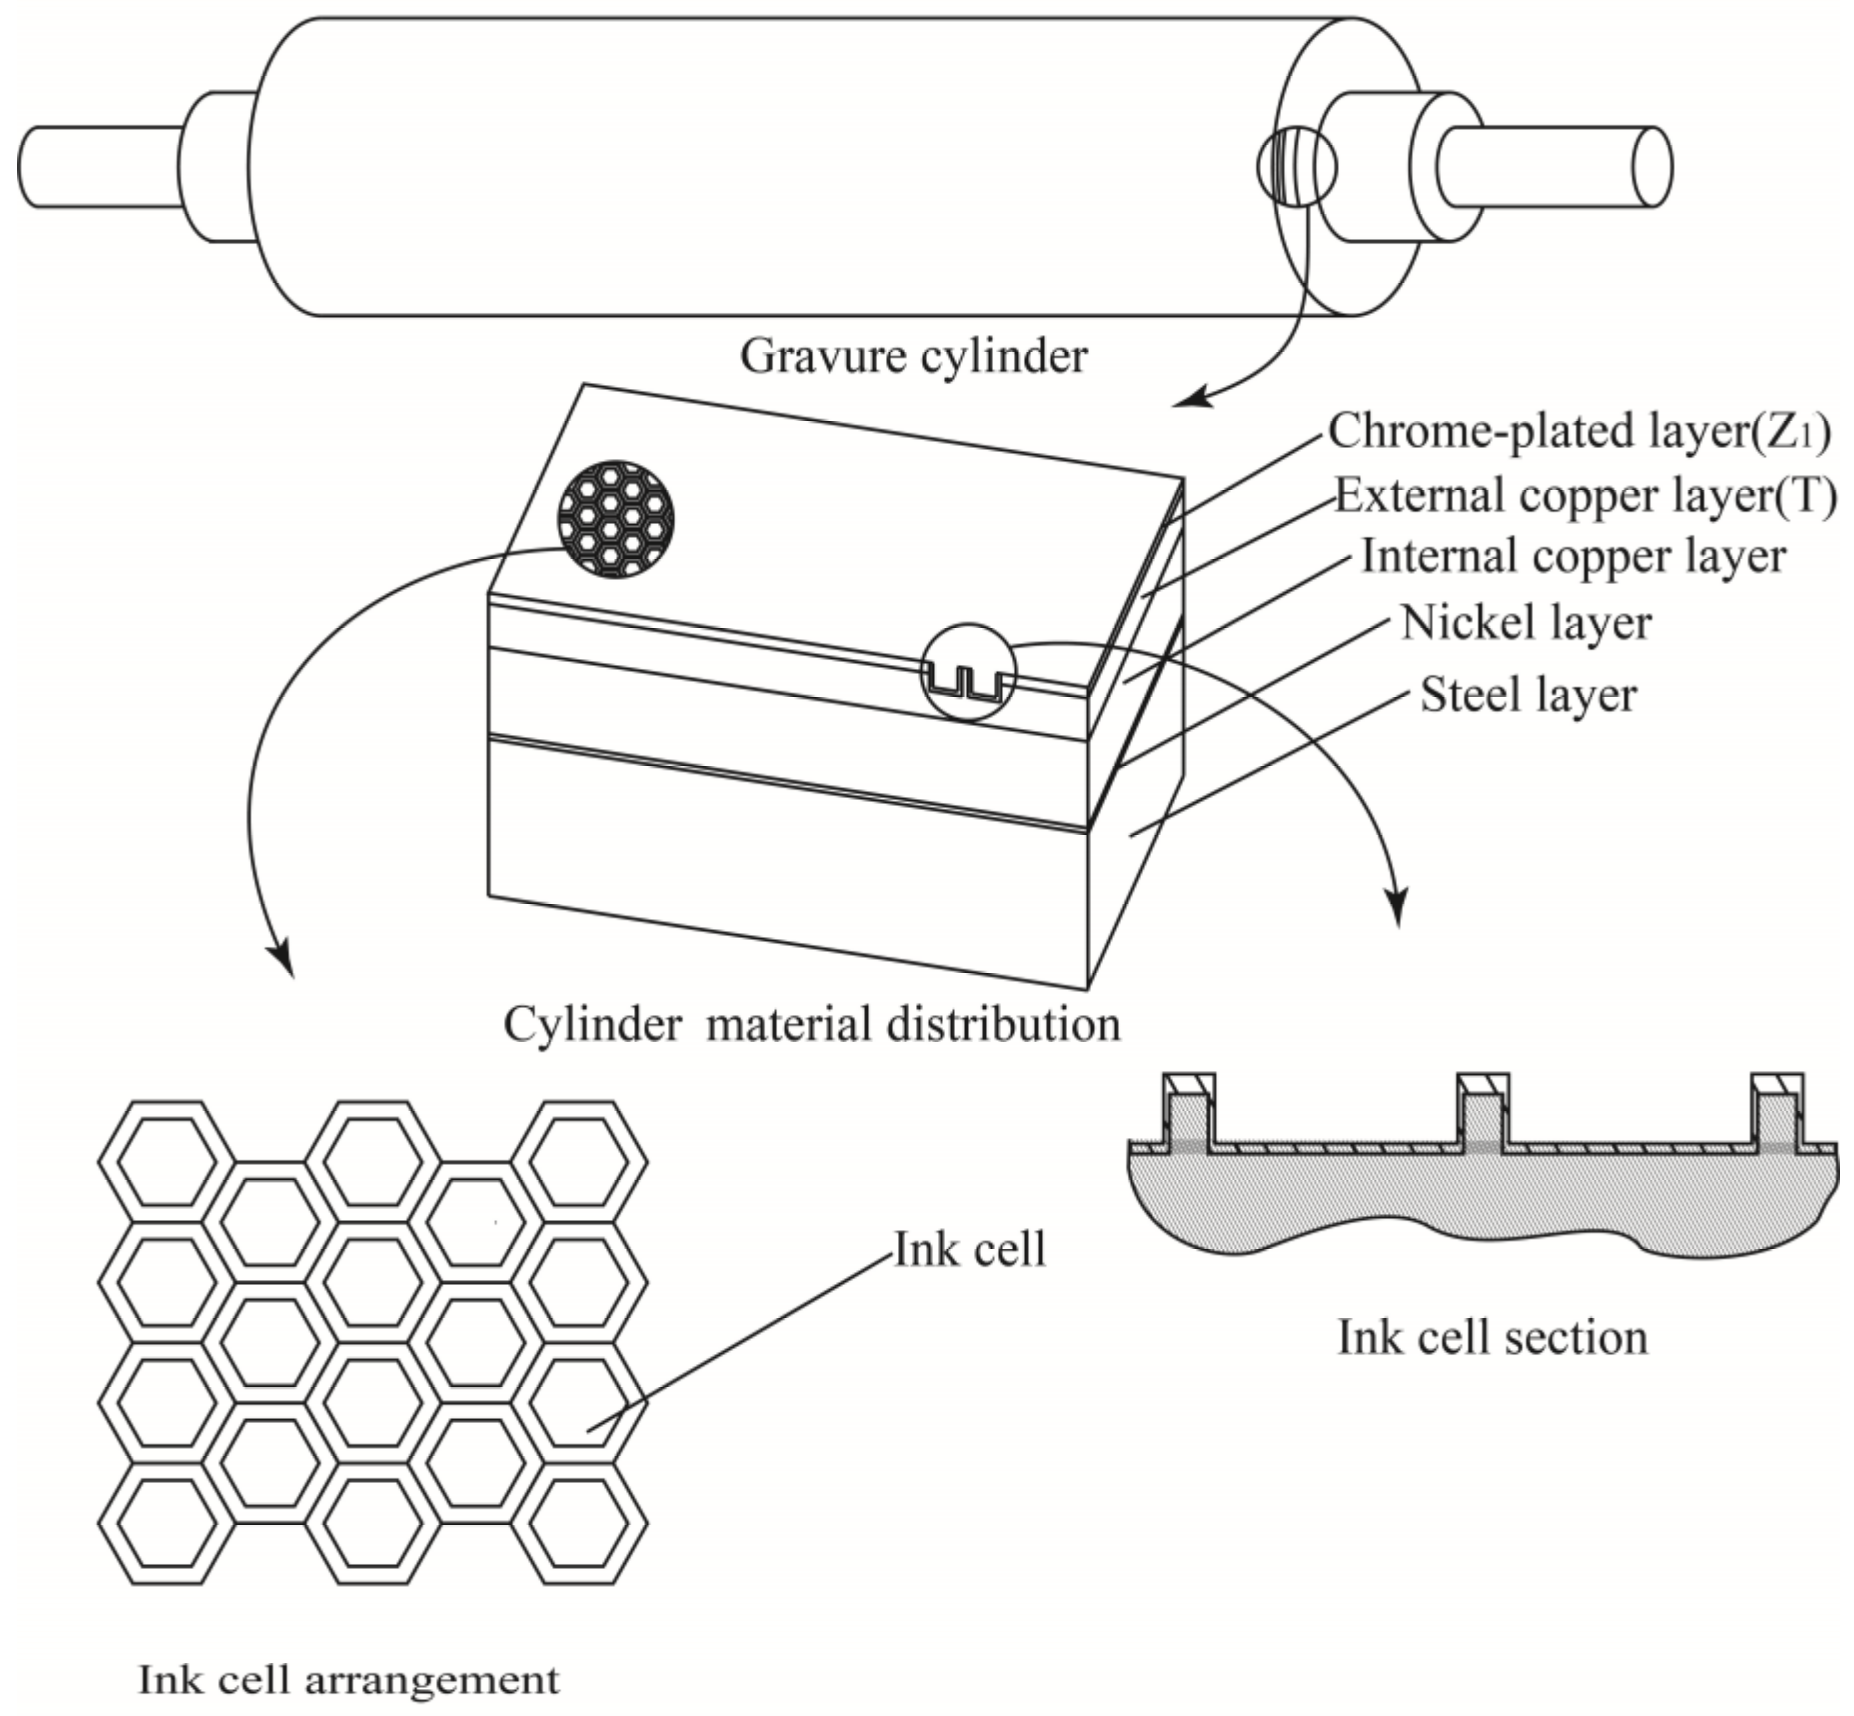
With the promotion of green printing technology, gravure printing has been widely studied due to its popularization and application of water-based ink. The gravure cylinder consists of a steel body, a nickel-plated layer, a (internal and external) copper layer, and a chromium-plated layer [1]. The traditional production process is complicated, and the manufacturing cost is high. Frequent plate making will increase the production cost. The gravure cell is the smallest unit that holds and transfers ink on the gravure cylinder. In order to achieve a uniform and thick ink layer, it is required that the cell opening is large and the screen wall narrow when solid printing or coating [2], but this will increase the wear of the printing plate. Therefore, different cell shapes and structural parameters will directly affect the stiffness and wear resistance of the printing plate, and then affect the printing durability of the cylinder. The opening of the traditional electronic engraving cell is diamond-shaped, the longitudinal section is inverted trapezoid, and the process of plate making is complicated. With the maturity of laser technology, direct laser engraving technology [3,4] has been applied in the field of gravure. Direct laser engraving technology can freely define the aspect ratio and shape of each cell by modulating the energy and pulse intensity of each single laser pulse through digital image data [5]. Direct laser engraving technology has quickly become a research hotspot in the field of gravure plate making because of its high speed, high resolution, and arbitrary cell design. At present, there are many kinds of cell structure, such as regular hexagon, square, and pillow shape, among which regular hexagon cells are the most widely used. Therefore, this article took the laser-engraved regular hexagonal cell structure with a U-shaped longitudinal section as the research object, and carried out a multi-objective optimization design of cell structure.
The direct laser engraving of a U-shaped cell structure has not been thoroughly studied. For example, Xiuyan Yin et al. [6] studied the liquid emptying process in the scaled-up U-shaped cells through liquid visualization, and the results can be applied to benchmark theoretical calculations and cell design processes. Henning G et al. [7] summarized the laser engraving process, and focused on the gravure cell microstructure process formed by direct laser engraving and the advantages and disadvantages of different cell shapes. Later, Henning G et al. [8] used high-power MOPA fiber lasers and fast extra cavity modulation to improve laser engraving technology. In order to solve the redundancy of the cell structure of laser gravure images, Li, Z.L. et al. [9] proposed a lossless compression method for laser gravure images that eliminates cell structure redundancy, and experiments proved that the method had certain applicability. Deng Pujun et al. [10,11] first studied the influence of the screen ruling and the angle of electronic engraving on the ink transfer rate, and then used electronic engraving experiments to obtain V-shaped cell size data, and then used MATLAB to establish a calculation model for the gravure cell volume. The results showed that the cell volume depended on the screening rules, cell angle, needle angle, and cell depth.
In addition, although there are many theoretical studies on microstructure optimization, it is still a nascent topic at the application level, especially in multi-physics applications. And, simulation tools are involved in various fields [12,13]. By using simulation tools, there have been some recent studies that tried to understand the effect of specific microstructure features on device performance [14,15]. For example, J. Guan et al. [16] used finite element analysis and a micro-genetic algorithm to optimize the microstructure of the forging process, and the results showed that the optimized H-shaped forging could obtain a small grain size and homogeneous grain distribution; Shabani, MO et al. [17] conducted a combination method of a genetic algorithm, finite element method, and artificial intelligence to determine the optimal preparation conditions of Al matrix nano-composites from the aspects of microstructure and mechanical properties. Yanyan Yin et al. [18] optimized the design parameters of the columnar microstructure through finite element analysis to achieve the goal of extending the efficiency of the thermal barrier coating. Noruzi, R et al. [19] used a genetic algorithm to optimize the microstructure of organic solar cells (OSC) by exploring the Non-Uniform Rational B-Splines (NURBS) representation. The results showed that the current density of the optimized microstructure was significantly improved. Therefore, it is feasible and innovative to use a response surface optimization method combining finite element analysis and a multi-objective genetic algorithm to optimize cell microstructure.
The remainder of the article is structured as follows: Section 2 introduces the principle of response surface optimization, the central combination design (CCD) method, and the multi-objective genetic algorithm; Section 3 studies the gravure cell microstructure parameters and the force contact analysis of the cell structure; Section 4 describes the multi-objective design optimization process; and Section 5 is the conclusion.
2. Materials and Methods
2.1. Response Surface Method (RSM)
The response surface method [20,21] was introduced by Box and Wilson. The RSM used in modeling and analysis of problems is a method that combines mathematical and statistical techniques [22]. Its principle is to obtain the response surface model of objective function on the design variables through the experimental design of the selected points, and to predict the value of the non-experimental points [23]. The response surface model is generally between the first to fourth order. As the order increases, the ability to simulate a nonlinear model becomes stronger [24]. Among them, the response surface model with second-order polynomial approximation has a higher calculating accuracy and solving efficiency. This paper uses this model to optimize the cell microstructure, and the general second-order response surface function expression is as follows [25]:
where is the objective function; , , , and are the polynomial coefficients; and are the experimental variables; is the number of experimental variables; and is the fitting error.
The polynomial regression method of least square estimation is used to obtain the undetermined coefficients of the response surface function expression.
where is the number of test points of the model; is the variable value of the test point; and is the function value of the test point.
The fitting accuracy of the RSM depends largely on the distribution of sample points in the design space [26]. Through the design of experiments (DOE), the expected results and scientific conclusions can be obtained on the basis of fewer trials and lower trial costs. The design of experiments of response surface methodology includes central composite design, optimal space-filling design, Box–Behnken design, sparse grid initialization, and Latin hypercube sampling design. Among them, the test points in the central composite design method follow specific rules [27,28], which can minimize the number of experiments on the premise of good accuracy. It has good fitting correlation and predictability, and is suitable for multi-factor and multi-level experiments with continuous variables.
The response surface method takes into account the random error of the experiment. Compared with orthogonal experiments, its advantage is that it can be analyzed at all levels of continuous experiment in the process of optimizing experimental conditions. The response surface method fits the complex unknown function relationship in a small area with a simple first or second polynomial. The calculation is relatively simple. It is an effective method for development cost, optimization of processing conditions, improvement of product quality, and solving practical problems in the production process. There are continuous variables and random errors between the parameters of the direct laser engraving of the cell microstructure in this paper, so this paper applies the response surface optimization based on a central composite design.
2.2. Multi-Objective Genetic Algorithm (MOGA)
A multi-objective genetic algorithm [29,30] was proposed by Fleming and Fonseca [31]. MOGA based on the Pareto optimal principle is one of the most representative methods. Its basic idea is to produce many feasible solutions at each generation in the genetic algorithm [32]. Individuals of the same generation are sorted by good or bad, and the individuals in the front have more chances to be inherited by the next generation, and the Pareto optimal solution can be obtained through a certain algebraic cycle. The objective vectors corresponding to the Pareto optimal are called the non-dominated target vector. All non-dominant goal vectors constitute the Pareto front of a multi-objective problem [30]. The multi-objective optimization problem can be expressed as:
where , , , and are the objective functions; is the design variable; and are the upper and lower limits of design variables; is the state variable; and are the upper and lower limits of state variables.
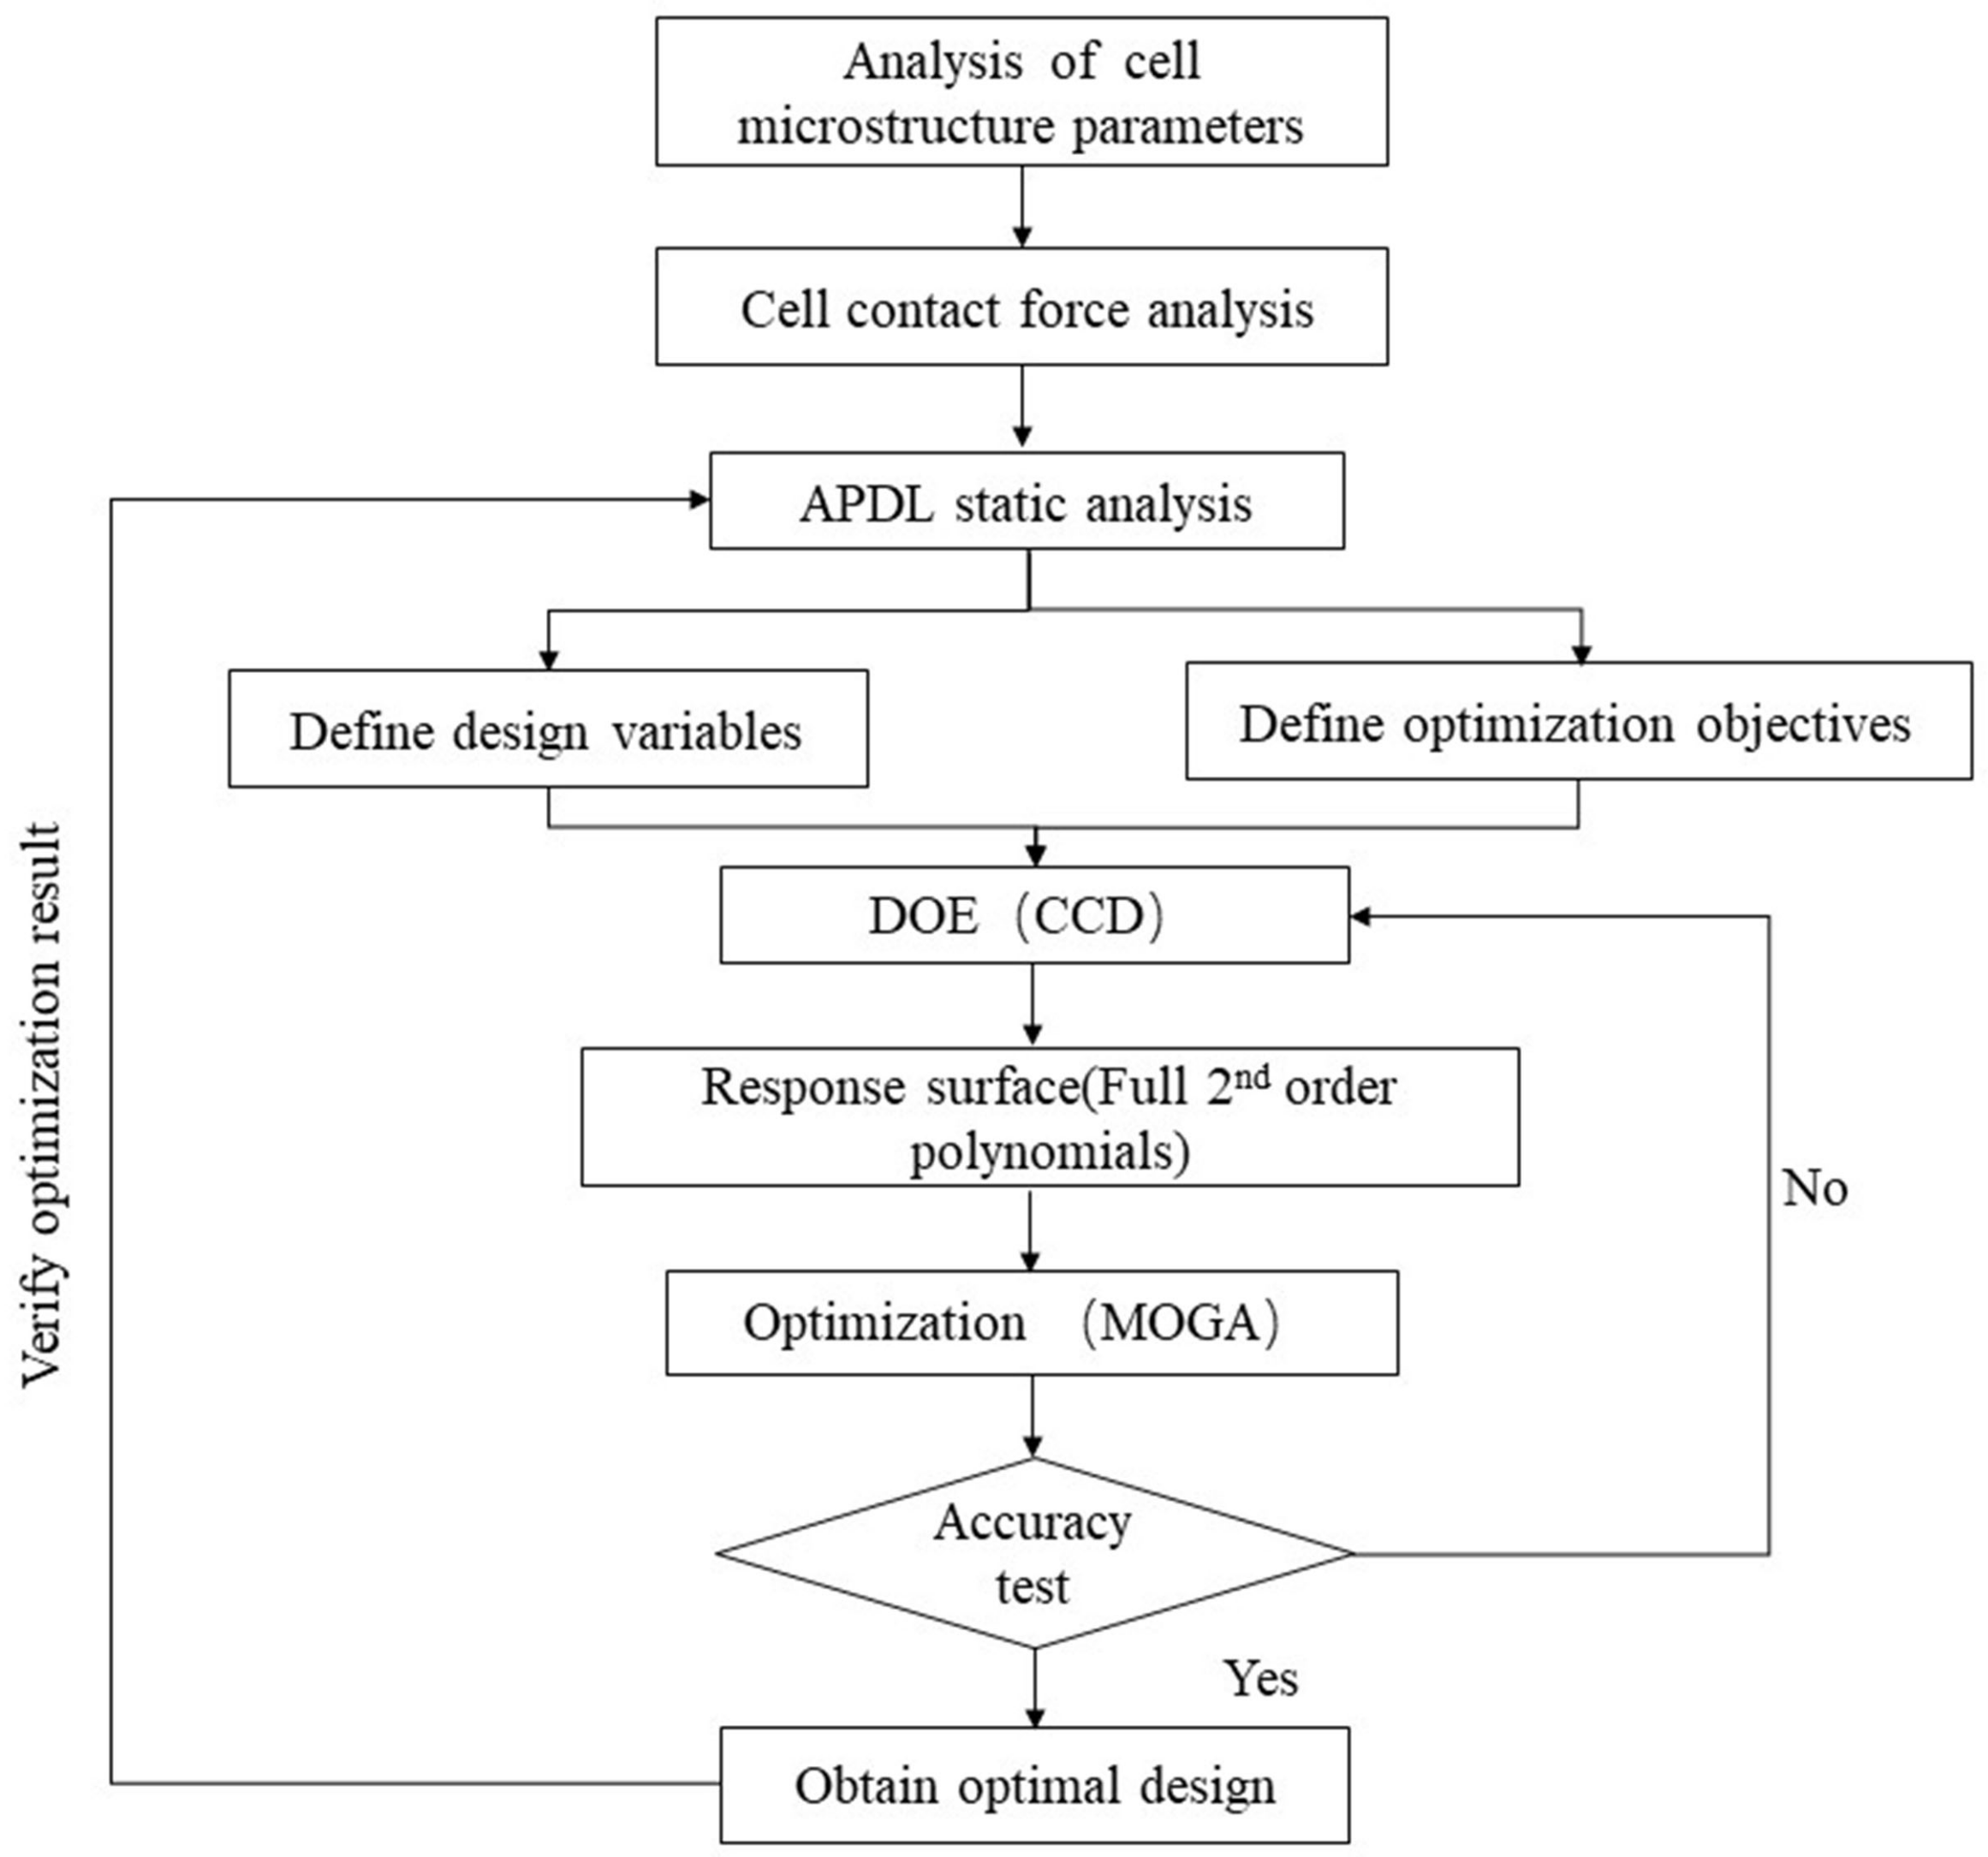
Therefore, the cell microstructure response surface optimization used in this paper is an optimization method based on the multi-objective genetic algorithm of the central composite design. First, this paper analyzed the regular hexagonal cell structure parameters and force conditions, then used ANSYS parametric design language (APDL) to compile a code file to perform periodic element modeling and static analysis of the cell structure, then import the code file into the Workbench platform for the central composite design and response surface method, and finally used multi-objective genetic algorithm to obtain the optimal solution. The optimization process is demonstrated in Figure 1.
3. Finite Element Analysis (FEA)
3.1. Regular Hexagonal Cell Microstructure
The gravure cylinder consists of a cylinder body, a nickel-plated layer, an internal copper layer, an external copper layer, and a chrome-plated layer. A typical gravure printing plate cylinder is shown in Figure 2.
With the popularization and development of laser engraving gravure technology, the shape and arrangement of the cells are no longer limited by the shape and processing of the engraving knife. Therefore, new cell shapes such as regular hexagonal cells and pillow cells can be designed arbitrarily. In actual printing production, it is found that the regular hexagonal cells arranged at a screen angle of 60° have the characteristics of compact structure and good ink transfer effect. Therefore, this paper selected regular hexagonal cell microstructure parameters for multi-objective structural optimization.
3.2. Modeling
It can be seen from Figure 2 that the cell structure is a periodic nested microstructure. If we study the cell structure with a complete printing plate cylinder as the substrate, it is seriously beyond the scope of the computer. Therefore, this article refers to the concept of a periodic unit [33,34,35] to simulate the establishment of periodic cells microstructure. In addition, because the thickness of several coating materials on the surface of the printing plate cylinder is too variable, it is difficult to achieve an overall modeling mesh. Moreover, the cells are only in the external copper layer and the chrome-plated layer, therefore, the external copper layer and the chrome-plated layer were selected for parametric modeling of the cell periodic unit of the printing plate.
The chromium plating process shows that the chromium plating layer is in the shape of a “dog bone”, that is the surface layer (Z1) is the thickest, the two side walls (Z2) are the thinnest, and the bottom layer (Z3) is thicker. The size relationship between the three is roughly
The size of the regular hexagonal cell is shown in Figure 3. Where, A is the size of the base cell, which is determined by the number of screen lines (); A1 is the cell size of the copper layer after engraving; and A2 is the cell size after chrome plating.
The ANSYS parametric design language (APDL) was used to write code for the regular hexagonal cell microstructure in this study. The surface chrome layer was simulated with shell93. The shell93 element is a structural shell element with eight nodes, which is especially suitable for curved shell models. The external copper layer was simulated with solid95. The solid95 element is a solid element with 20 nodes, which can adapt to irregular models. The density of the surface chromium layer was 6900 kg/m-3, elastic modulus was 250 Gpa, and Poisson’s ratio was 0.12. The density of the external copper layer was 8940 kg/m-3, elastic modulus was 117 Gpa, and Poisson’s ratio was 0.35. The initial parameters of the model are shown in Table 1. Free meshing was used, and 1,462,424 nodes and 958,026 elements were generated, as shown in Figure 4.
3.3. Static Analysis
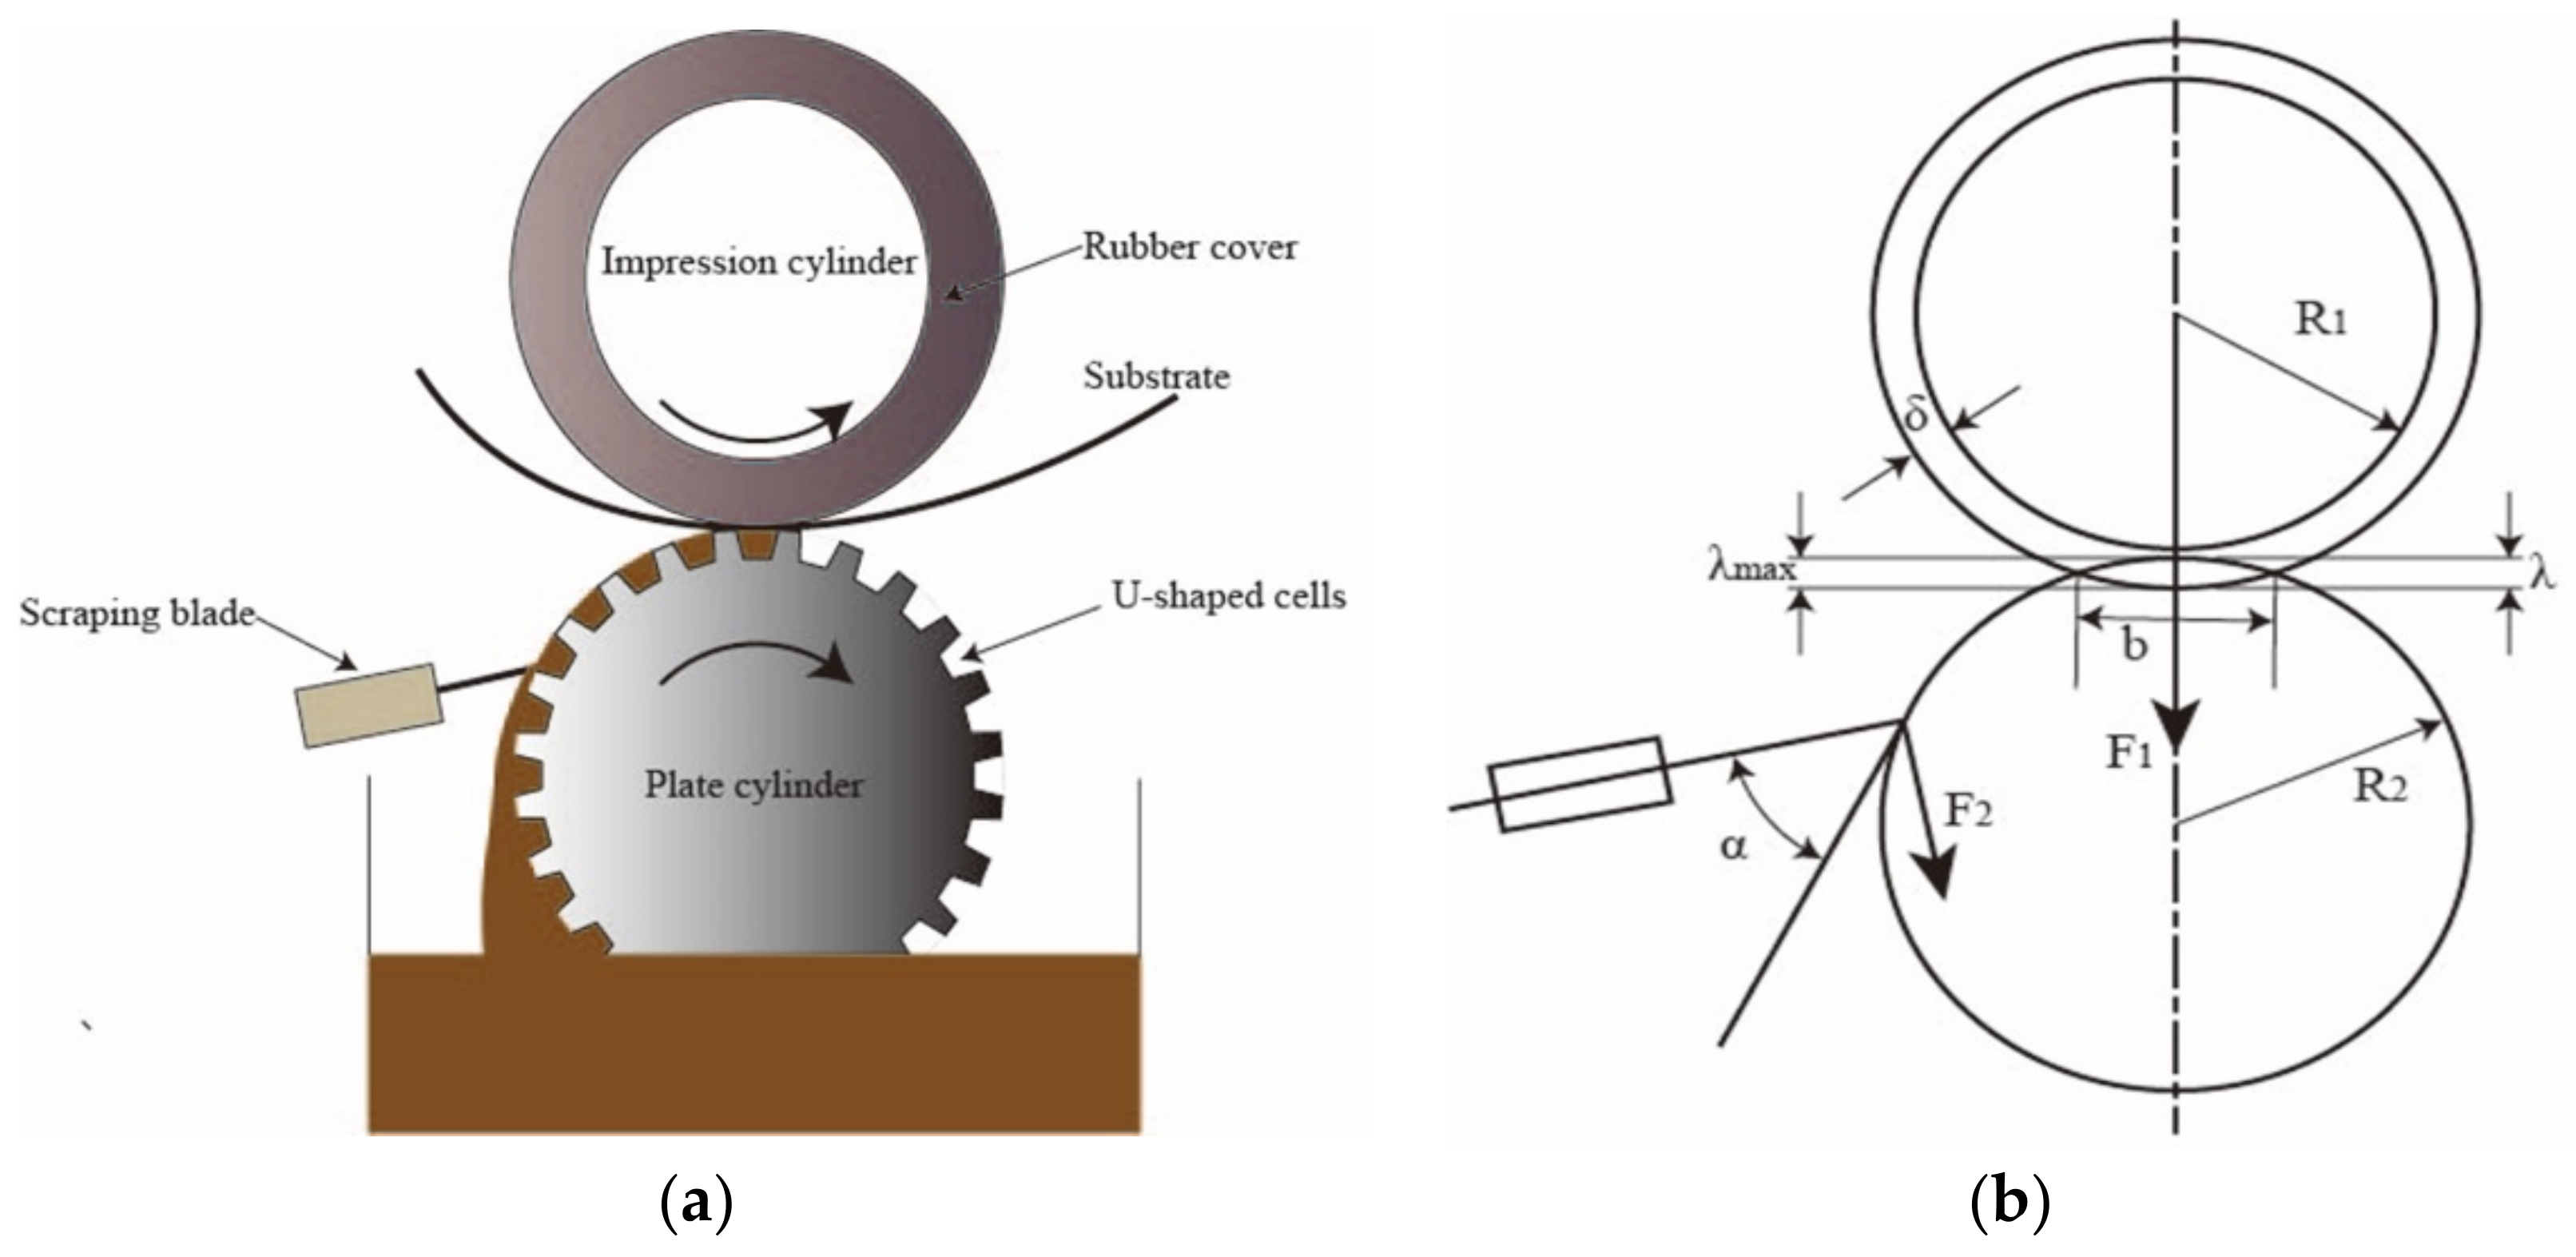
In the printing production process, the printing plate cylinder is subjected to not only its own weight and centrifugal force of rotation, but also the printing pressure of the impression cylinder, as well as the friction and pressure from the scraping blade. The working schematic diagram of the printing plate is shown in Figure 5a. In the static analysis, only the contact force part of the printing plate cell was considered. The contact force analysis of the printing plate cylinder is shown in Figure 5b. Where F1 is the printing pressure, and F2 is the scraping blade pressure.
Printing pressure generally refers to the pressure exerted by the impression cylinder on the plate cylinder surface during the ink transfer process. The printing pressure is adjusted by the pressure regulating valve [36] and the actual pressure formula is as follows:
where is the printing pressure; is the dial reading; and is the cylinder diameter.
Under static conditions, according to the empirical formula, the relationship between the printing pressure at the contact midpoint and the deformation of the lining is:
where is the printing pressure at the midpoint of the contact width; is the elastic modulus of the lining material; is the absolute deformation of the lining; and is the original thickness of the lining.
Analyzing the contact situation of the two rollers, the local elastic deformation of the contact surface generates an approximate rectangular contact area. The contact width (b) can be obtained from the Hertzian elastic theory [37,38]:
where is the length of the contact line; and are the Poisson ratios of the two cylinders; and are the elastic modulus of the material; is the contact width; and , respectively, are the radius of the printing cylinder.
However, as the elastic modulus of the plate cylinder is large, and the elastic modulus of imprint cylinder is too small, and the radius of the two cylinders R are equal, the above Formula (8) can be evolved into:
From the radius of the two rollers and the width of the impression contact it is not difficult to find the compression of the rubber roller .
Based to the actual printer model parameters, it can be calculated that the printing pressure at the midpoint of the contact width is 0.44 Mpa. From the shape and deformation of the roller, we can easily know that the pressure in the contact center is the largest in the imprint contact area, so the printing contact center pressure was used for simulation.
The pressure of the scraping blade was set by setting the pressure of the pressure reducing valve. Different scraping blade angles have different force effects on the printing plate. According to the scraper blade contact model [39], the actual scraper pressure of the scraper blade was taken, which is about 0.2 MPa, calculated from the force component formula. The force component formula is as follows:
where is the scraping blade angle; is the scraping blade pressure; is the normal component; and is the tangential component.
The load was the surface effect unit, surf154. Symmetric constraints were imposed on the model, and the deformation nephogram of the cell structure was calculated, as illustrated in Figure 6a. The Von Mises stress nephogram of the cell structure was calculated, as illustrated in Figure 6b. As can be seen from Figure 6, the maximum deformation (DMAX) was 0.278 , the Von Mises stress (SMAX) was 2.739 , and the total volume (VTOT) was 1.284 × 10⁸ . From the perspective of mechanics and solid printing production technology, the three values all have a certain optimization space.
4. Results and Discussions
4.1. Design of Experiment (DOE)
Based on the APDL codes written above, the external copper layer thickness (T), the surface chromium layer thickness (Z1), the base cell size (A), the screen wall width (C), and the cell depth (D) were used as design variables. The variation range of each variable depended on the common solid printing process. The thickness of the external copper layer was 100~150 , the thickness of the surface chrome layer was 6~12 , the number of screen line was 170~210 lpi, and the dot area percentage was between 80% and 90%. The design and combination of the experimental points was carried out by the CCD method, as shown in Table 2.
4.2. Response Surface Analysis
4.2.1. Full Second-Order Polynomials Response Surface Model
According to the data in Table 2, regression analysis was used to determine the coefficients of the mathematical model, so as to construct the quadratic polynomial response surface function of each response value as follows:
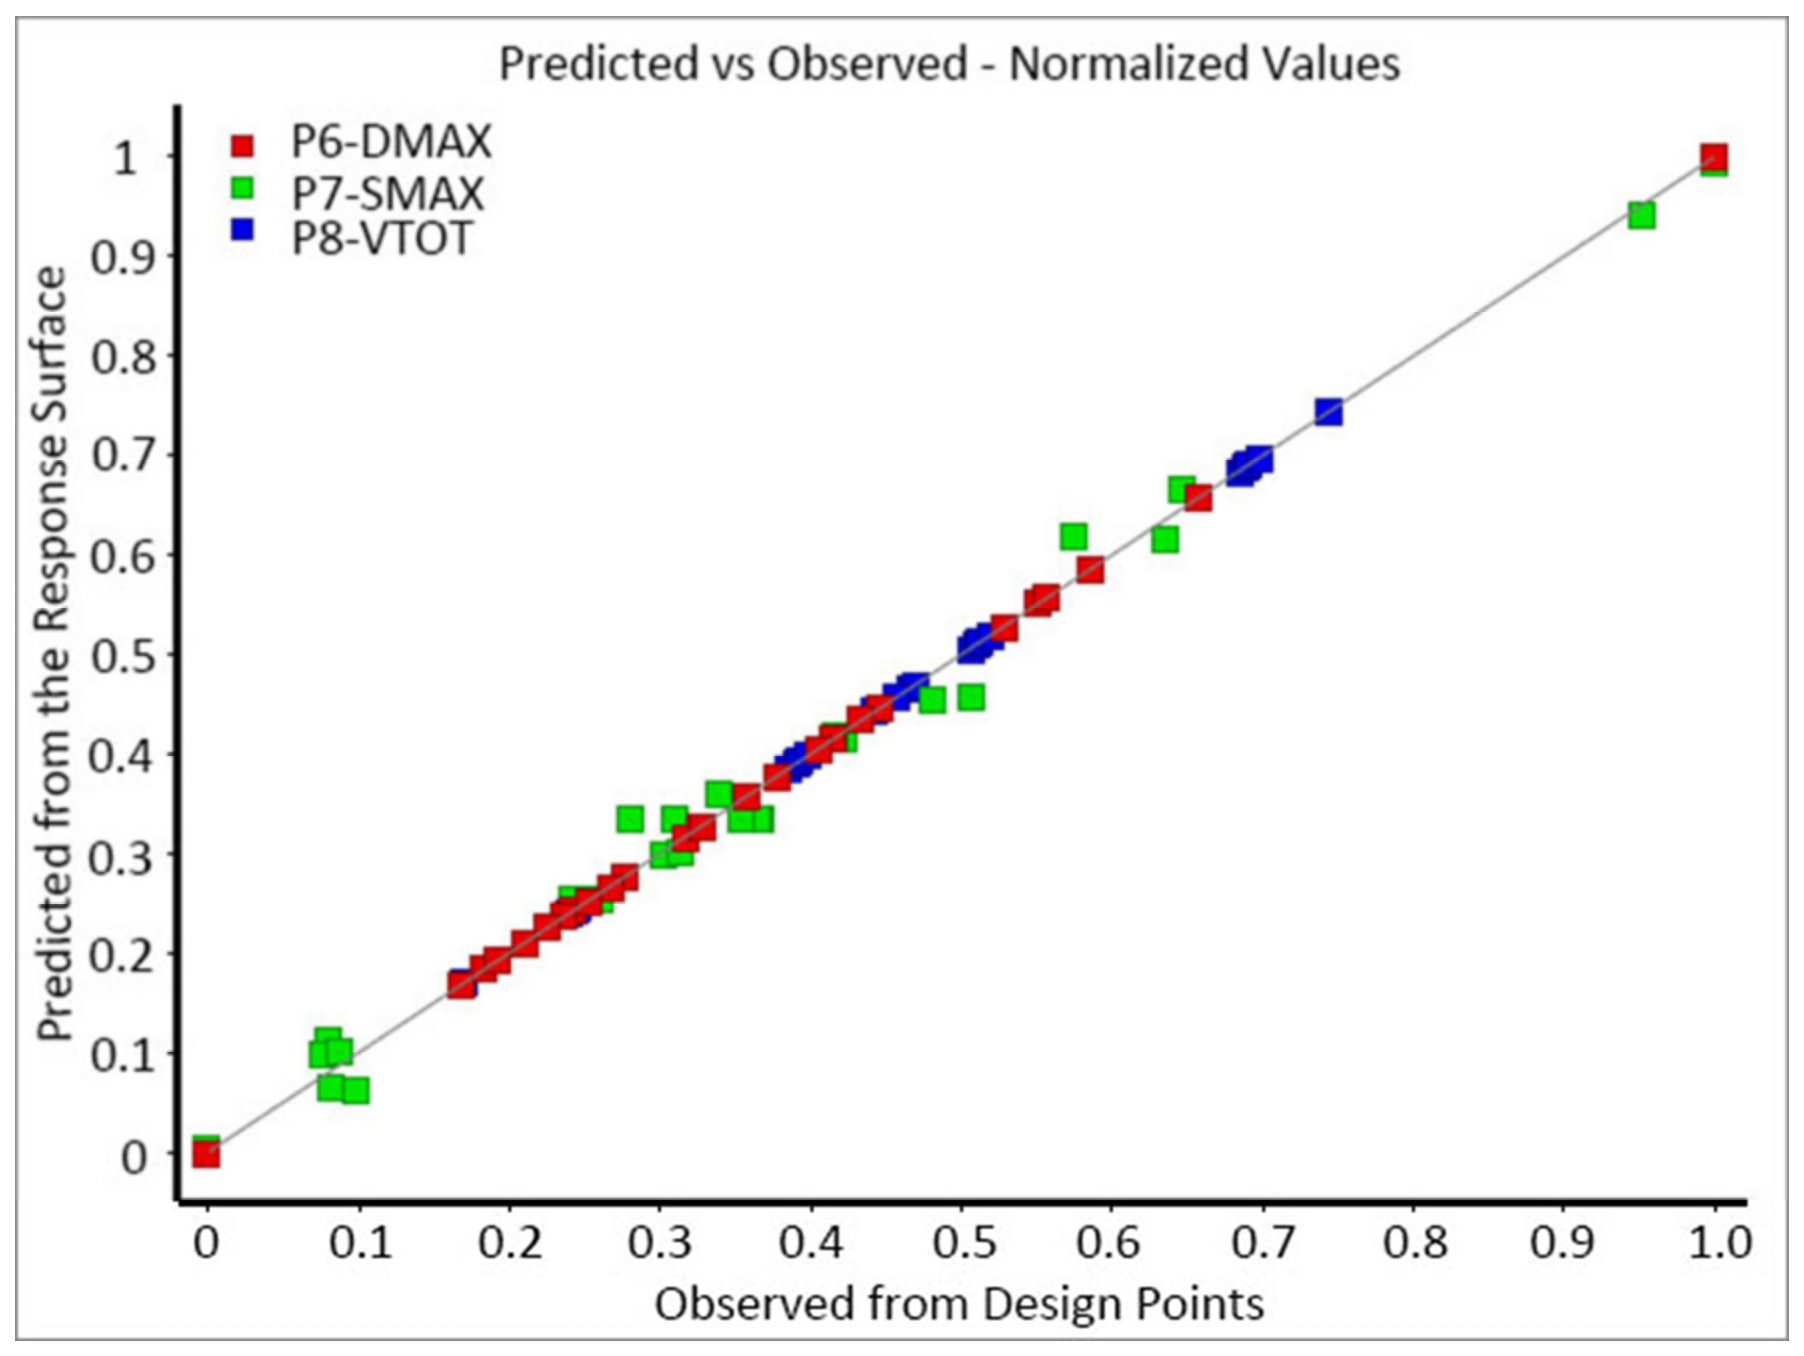
In statistical analysis, the p-value is the probability for hypothesis testing. The P-values in formulas 12–14 are all less than the significance level, indicating that they are highly significant in the regression model. The coefficient determination of [40] is a measure used to assess how well a model can explain and predict outcomes. It is also commonly known as “R-squared”, and used as a guideline for measuring the accuracy of the model. It ranges from 0 to 1 and will be closer to 1 when the model is more precise [41]. The values of DMAX, SMAX, and VTOT were 0.9875, 0.9865, and 0.9229, respectively. The points corresponding to DMAX, SMAX, and VTOT in Figure 7 are all near the diagonal, which means that the sample points obtained by the CCD and its response surface fitting value were very consistent. Therefore, the obtained full second-order polynomials response surface model was consistent with the actual finite element calculation results, and met the needs of the subsequent design analysis.
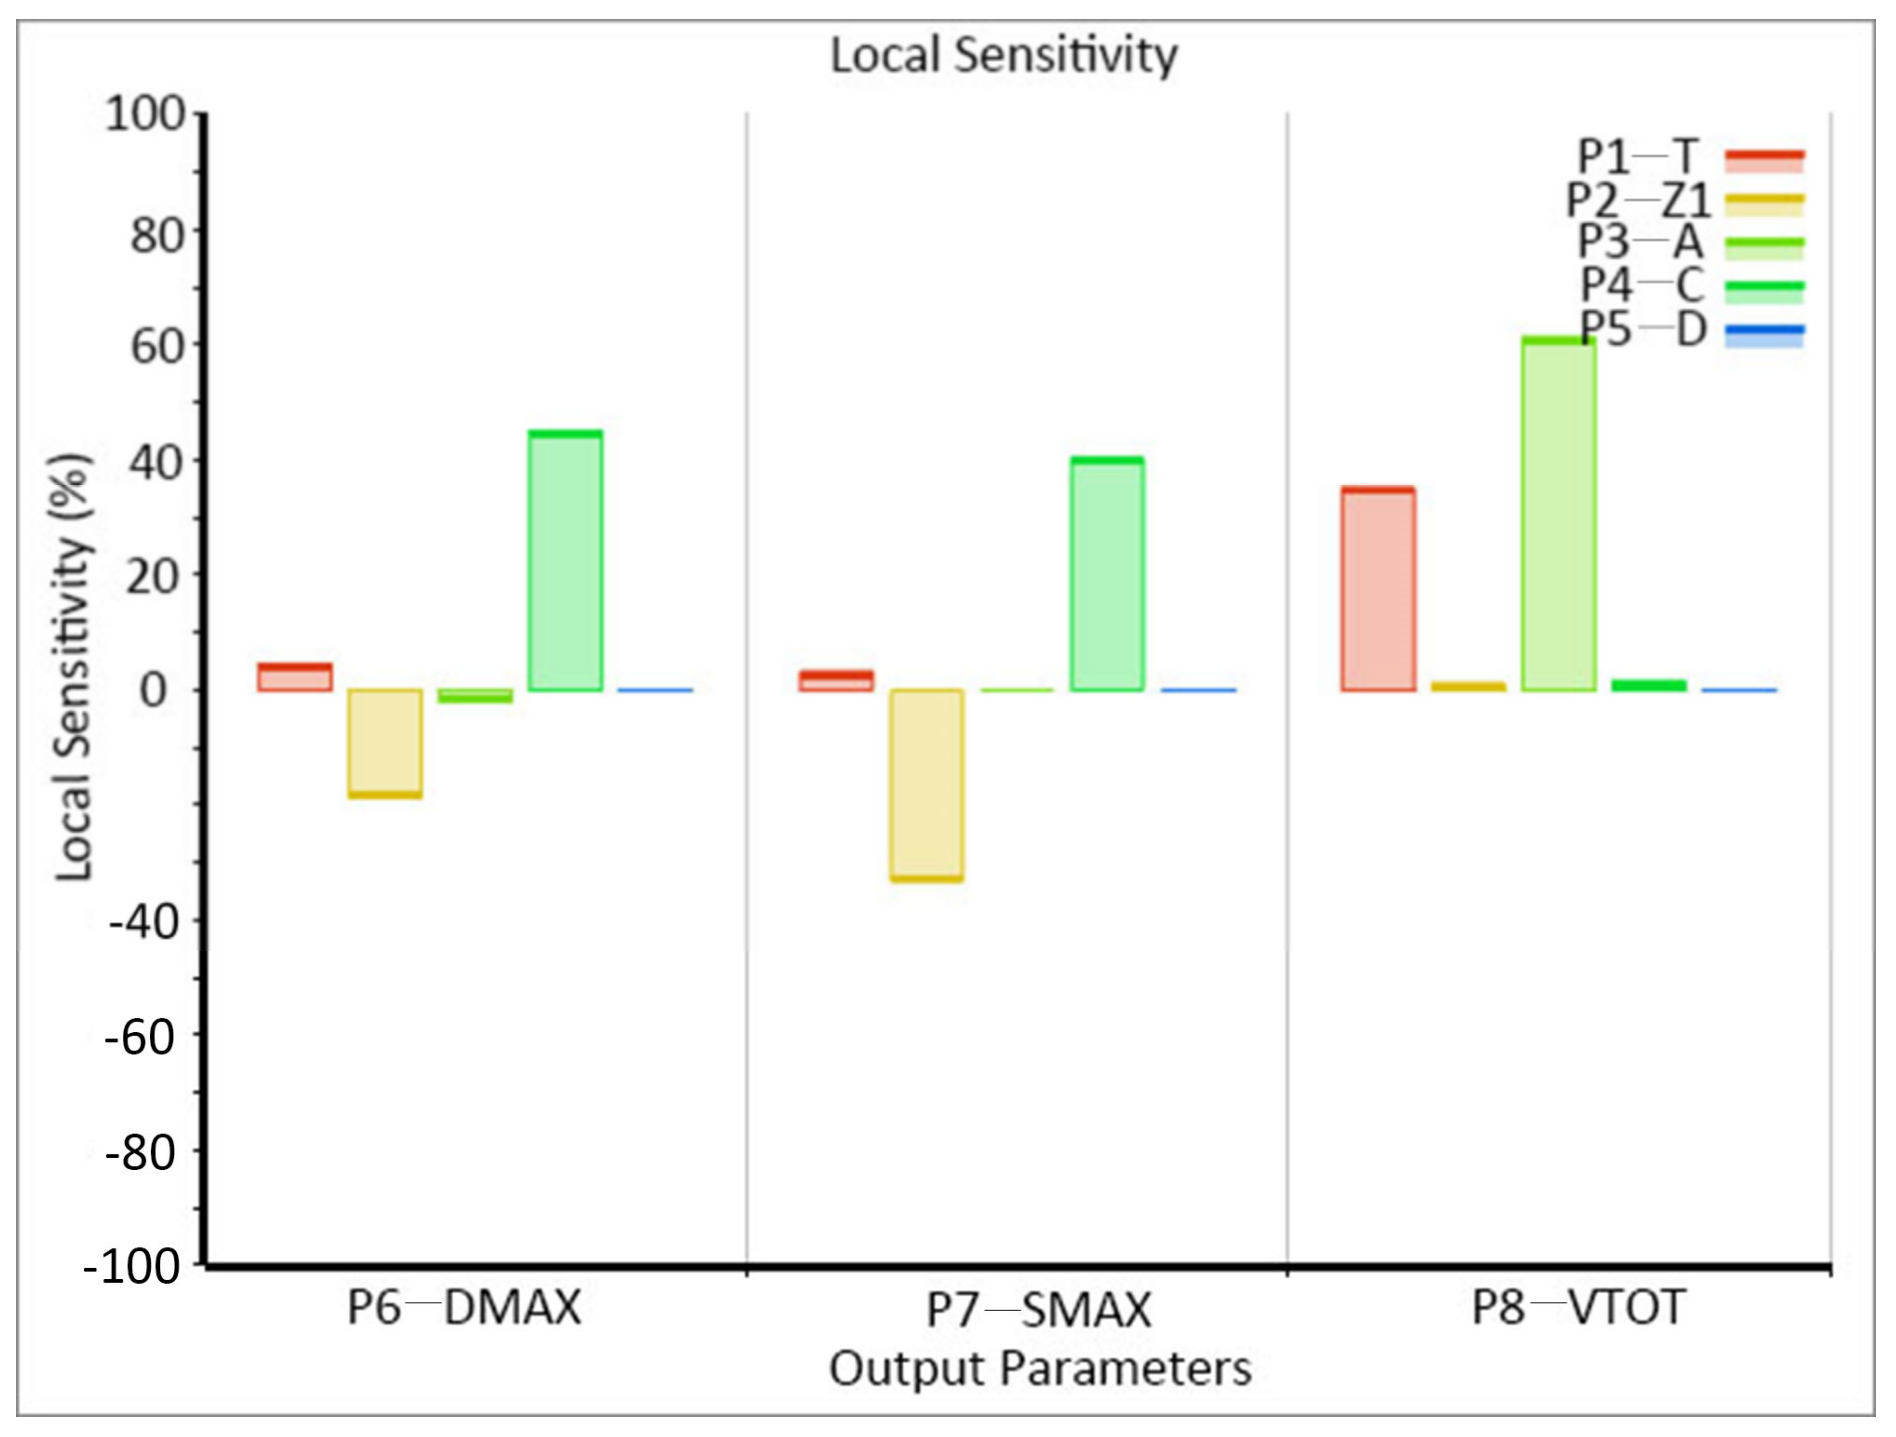
4.2.2. Sensitivity Analysis of Optimized Parameters
After establishing the full second-order polynomials response surface model, we obtained the sensitivity of the design variables of the external copper layer thickness (T), the surface chromium layer thickness (Z1), the base cell size (A), the screen wall width (C), and the cell depth (D) to the maximum deformation (DMAX), the maximum Von Mises stress (SMAX), and total volume (VTOT), which are shown in Figure 8.
Figure 8 shows that the surface chromium layer thickness and the screen wall width had greater effect on the maximum deformation and the maximum Von Mises stress. For the total volume, the external copper layer thickness and the base cell size had the greatest sensitivity. A response surface diagram of the above variable relationship is shown in Figure 9.
It can be seen from Figure 9a,b that the two response surface graphs are similar. When other variables were constant, the maximum deformation and the maximum Von Mises stress decreased with the increased of the surface chromium layer thickness, which was mainly attributed to: the larger the surface chrome layer thickness, the larger the strength and stiffness performance of the cell structure. In addition, when other variables were constant, the maximum deformation increased with the increase of the screen wall width, and the maximum Von Mises stress decreased and then increased with the increase of the screen wall width. Therefore, in the structural design process, a greater thickness of the surface chromium layer and a smaller screen wall width should be selected as far as possible within a reasonable range.
It can be seen from Figure 9c that when other variables were constant, the total volume increased with the increase of the thickness of the external copper layer. In addition, when other variables were constant, the total volume increased with the increase of the base cell size. Therefore, in the structural design process, the external copper layer thickness and the base cell size should be selected as small as possible when the mechanical properties are satisfied.
4.3. Pareto Optimal in Multi-objective Optimization
Taking the maximum deformation DMAX and the total volume of the model VTOT as the objective function, and the maximum Von Mises stress SMAX as the state function, the optimization range of SMAX was 0~5Mpa, and the objective functions took the minimum.
Through the multi-objective genetic algorithm, the response surface was optimized, and a Pareto optimal set was obtained, as shown in Table 3. The first set was chosen as the optimal solution, due to its objective function being the smallest. Therefore, when T is 100.76 , Z1 is 8.949 , A is 120.15 , C is 6.53 , D is 29.948 , it is the design optimization solution.
According to the optimized cell parameter modeling, the FEA of the optimized cell structure was carried out, and the deformation and Von Mises stress of the cell under the action of printing pressure and scraping blade pressure were analyzed. Eight nodes were randomly selected to obtain the displacement of deformation (DOF) and Von Mises stress to verify the optimization result. The results are shown in Figure 10.
It can be seen from Figure 9 that the displacement of deformation and the Von Mises stress of the cell model were significantly reduced after multi-objective optimization, indicating that the optimized solution reduced the stiffness and strength requirements of the cell microstructure, while reducing the weight. However, the Von Mises stress of the fourth node before optimization was lower than that after optimization in Figure 9b. This is because errors are prone to occur at the boundary when the sub-model is constrained, and this node may be a boundary point.
By comparing the optimal solution with that before optimization, as shown in Table 4, it can be seen that compared with before optimization, the maximum deformation was reduced by 44.4%, and the total volume was reduced by 46.3%, while the maximum Von Mises stress was also greatly reduced. The optimization solution improved the stiffness and strength of the cell structure, reduced the risk of stress concentration, and the wear of the gravure cylinder, and therefore improved the printing durability of the gravure. At the same time, it produced a lightweight design, reduced the cost of plate making of the gravure cylinder, and achieved the optimization goal.
5. Conclusions
The innovation of this paper is that based on the solid printing process, the multi-objective optimization design method of regular hexagonal cells was proposed for the first time. Based on gravure cell structure analysis and cell contact force analysis, a finite element model was established by APDL. A full second-order polynomials response surface method based on CCD was used to establish the cell optimization model, and a multi-objective genetic algorithm was used to obtain the optimal solution. The cell microstructure optimization design was converted from experience to a theoretical method. Compared with the traditional factory measurement of cell quality, this method greatly reduces the cost of cell microstructure optimization and improves the efficiency of cell microstructure design. It is more practical and effective.
The results show that the surface chromium layer thickness and the screen wall width have a greater effect on the maximum deformation and the maximum Von Mises stress. For the total volume, the external copper layer thickness and the base cell size have the greatest sensitivity. The optimal design parameters determined by this study are , , , , and . The optimization solution improved the stiffness and strength of the cell structure, and realized a lightweight design. Comparing the optimization solution with the finite element method, the effectiveness of the optimization method was verified.
The multi-objective optimization method used in this paper not only solves the problem of regular hexagonal cell microstructure optimization, but also provides a very useful reference value for other more custom-defined new cell structure designs. In addition, the structural optimization of the microstructure, in combination with the actual process, is conducive to the development of microstructure application optimization. However, this article only makes a preliminary study on the mechanical properties of the cell microstructure under the effect of printing pressure and scraping blade pressure. There are many, and complex, factors that affect the cell structure, such as ink transfer, substrate, printing speed, etc. More in-depth applied research is ongoing.
Author Contributions
Methodology, S.W., J.X.; software, S.W., J.X.; validation, S.W., J.X. and L.D.; formal analysis, S.W.; investigation, S.W., J.X.; resources, J.X.; data curation, S.W.; writing—original draft preparation, S.W.; writing—review and editing, S.W., J.X., H.Z.; visualization, S.W.; supervision, J.X. All authors have read and agreed to the published version of the manuscript.
Funding
This research received no external funding.
Institutional Review Board Statement
Not applicable.
Informed Consent Statement
Not applicable.
Data Availability Statement
The data presented in this study are available on request from the corresponding author.
Conflicts of Interest
The authors declare no conflict of interest.
References
- Grau, G.; Cen, J.; Kang, H.; Kitsomboonloha, R.; Scheideler, W.J.; Subramanian, V. Gravure-printed electronics: Recent progress in tooling development, understanding of printing physics, and realization of printed devices. Flex. Print. Electron. 2016, 1, 23. [Google Scholar] [CrossRef]
- Deng, P.J.; Fang, W.; Lu, J.D. Study about Influencing of printing process on gravure printing ink transfer. In Research on Food Packaging Technology; Yun, O., Min, X., Li, Y.T., Xunting, L., Eds.; Trans Tech Publications Ltd.: Stafa-Zurich, Switzerland, 2014; Volume 469, pp. 301–304. [Google Scholar]
- Dong, W. Research of Gravure Plate-Making Engraving Directly By Laser; South China University of Technology: Guangzhou, China, 2013. [Google Scholar]
- Chen, W.; Lai, W.; Wang, Y.; Wang, K.; Lin, S.; Yen, Y.; Hong, H.; Chou, T. Ultrafast laser engraving method to fabricate gravure plate for printed metal-mesh touch panel. Micromachines 2015, 6, 1483–1489. [Google Scholar] [CrossRef] [Green Version]
- Hennig, G.; Selbmann, K.H.; Brockelt, A. Laser Engraving in Gravure Industry. In Workshop on Laser Applications in Europe; Gries, W., Pearsall, T.P., Eds.; SPIE: Bellingham, WA, USA, 2006; Volume 6157. [Google Scholar]
- Yin, X.; Kumar, S. Flow visualization of the liquid-emptying process in scaled-up gravure grooves and cells. Chem. Eng. Sci. 2006, 61, 1146–1156. [Google Scholar] [CrossRef]
- Henniga, G.; Selbmann, K.H.; Pfinninger, S.; Brendel, J.; Bruning, S. Large scale laser microstructuring of gravure print rollers. In Photon Processing in Microelectronics and Photonics Vii; Holmes, A.S., Meunier, M., Arnold, C.B., Niino, H., Geohegan, D.B., Trager, F., Dubowski, J.J., Eds.; Spie-Int Soc Optical Engineering: Bellingham, WA, USA, 2008; Volume 6879. [Google Scholar]
- Hennig, G.; Resing, M.; Mattheus, S.; Neuenschwander, B.; Bruening, S. Laser Microstructuring and Processing in Printing Industry. In 2011 Conference on Lasers and Electro-Optics; IEEE: New York, NY, USA, 2011. [Google Scholar]
- Li, Z.L.; Xia, Q.X.; Qin, X.F.; Wang, S.Z. Research on Laser Gravure Image Loss Less Compression; IEEE Computer Soc.: Los Alamitos, CA, USA, 2009; p. 72. [Google Scholar]
- Deng, P.; Zhang, G.; Fang, W.; Guo, J. Research on Computing Model of the Cell Volume for Electronic Engraved Gravure. In Advances in Printing and Packaging Technologies; Yun, O.Y., Min, X., Li, Y., Liu, X.T., Eds.; Scientific.Net: Bäch SZ, Sitzerland, 2013; Volume 262, p. 355. [Google Scholar]
- Deng, P.; Zhang, G.; Wang, Y.; Fang, W. Influence of Screen Ruling and Engraving Needle Tip Angle on Ink Transfer for Gravure. In Printing and Packaging Study; Yun, O.Y., Min, X., Li, Y., Eds.; Scientific.Net: Bäch SZ, Sitzerland, 2011; Volume 174, pp. 215–218. [Google Scholar]
- Tian, J.; Zhang, C.; Wang, Q. Analysis of craniocerebral injury in facial collision accidents. PLoS ONE 2020, 15, e0240359. [Google Scholar] [CrossRef]
- Tian, J.; Chen, Y.; Ma, Z. Numerical Simulation of Performance of an Air-Water Separator with Corrugated Plates for Marine Diesel Engines. Processes 2020, 8, 1617. [Google Scholar] [CrossRef]
- Sundararaghavan, V.; Zabaras, N. Classification and reconstruction of three-dimensional microstructures using support vector machines. Comput. Mater. Sci. 2005, 32, 223–239. [Google Scholar] [CrossRef]
- Fullwood, D.T.; Niezgoda, S.R.; Adams, B.L.; Kalidindi, S.R. Microstructure sensitive design for performance optimization. Prog. Mater. Sci. 2010, 55, 477–562. [Google Scholar] [CrossRef]
- Guan, J.; Wang, G.C.; Guo, T.; Song, L.B.; Zhao, G.Q. The microstructure optimization of H-shape forgings based on preforming die design. Mater. Sci. Eng. A Struct. Mater. Prop. Microstruct. Process. 2009, 499, 304–308. [Google Scholar] [CrossRef]
- Shabani, M.O.; Mazahery, A. The GA optimization performance in the microstructure and mechanical properties of MMNCs. Trans. Indian Inst. Metals 2012, 65, 77–83. [Google Scholar] [CrossRef]
- Yin, Y.; Qi, R.; Zhang, H.; Xi, S.; Zhu, Y.; Liu, Z. Microstructure design to improve the efficiency of thermal barrier coatings. Theor. Appl. Mech. Lett. 2018, 8, 18–23. [Google Scholar] [CrossRef]
- Noruzi, R.; Ghadai, S.; Bingol, O.R.; Krishnamurthy, A.; Ganapathysubramanian, B. NURBS-based microstructure design for organic photovoltaics. Comput. Aided Des. 2020, 118, 13. [Google Scholar] [CrossRef]
- Hambli, R. Application of response surface method for FEM bending analysis. Int. J. Veh. Des. 2005, 39, 1–13. [Google Scholar] [CrossRef]
- Brooghani, S.Y.A.; Khalili, K.; Shahri, S.E.E.; Kang, B.S. Loading path optimization of a hydroformed part using multilevel response surface method. Int. J. Adv. Manuf. Technol. 2014, 70, 1523–1531. [Google Scholar] [CrossRef]
- Subasi, A.; Sahin, B.; Kaymaz, I. Multi-objective optimization of a honeycomb heat sink using Response Surface Method. Int. J. Heat Mass Transf. 2016, 101, 295–302. [Google Scholar] [CrossRef]
- Liu, S. Multi-objective optimization design method for the machine tool’s structural parts based on computer-aided engineering. Int. J. Adv. Manuf. Technol. 2015, 78, 1053–1065. [Google Scholar] [CrossRef]
- Zhou, G.; Ma, Z.D.; Cheng, A.G.; Li, G.Y.; Huang, J. Design optimization of a runflat structure based on multi-objective genetic algorithm. Struct. Multidiscip. Optim. 2015, 51, 1363–1371. [Google Scholar] [CrossRef]
- Wen, T.; Xu, F.; Lu, T.J. Structural optimization of two-dimensional cellular metals cooled by forced convection. Int. J. Heat Mass Transf. 2007, 50, 2590–2604. [Google Scholar] [CrossRef]
- Liu, G.; Hou, D.H.; Zhao, X.J.; Yuan, D.W.; Li, L.; Sun, Y.L. Power transformer’s electrostatic ring optimization based on ANSYS parametric design language and response surface methodology. Appl. Sci. 2019, 9, 4286. [Google Scholar] [CrossRef] [Green Version]
- Raeisian, L.; Niazmand, H.; Ebrahimnia-Bajestan, E.; Werle, P. Thermal management of a distribution transformer: An optimization study of the cooling system using CFD and response surface methodology. Int. J. Electr. Power Energy Syst. 2019, 104, 443–455. [Google Scholar] [CrossRef]
- Li, J.I.; Liu, Z.J.; Jabbar, M.A.; Gao, X.K. Design optimization for cogging torque minimizatior using response surface methodology. IEEE Trans. Magn. 2004, 40, 1176–1179. [Google Scholar] [CrossRef]
- Kazakov, P.V. The genetic algorithms for multi-objective optimization: Review. Inf. Tekhnologii 2011, 10, 2–8. [Google Scholar]
- Liu, G.; Luo, R.; Liu, S. A new interval multi-objective optimization method for uncertain problems with dependent interval variables. Int. J. Comput. Methods 2020, 17. [Google Scholar] [CrossRef]
- Fleming, C.F.P. Genetic algorithms for multiobjective optimization: Formulation discussion and generalization. Proceedings of The 5th International Conference on Genetic Algorithms; Morgan Kaufmann Publishers Inc.: San Francisco, CA, USA, 1993; pp. 416–423. [Google Scholar]
- Zhu, Z.; Cai, Y.-F.; Chen, L.; Xia, C.-G.; Destech Publicat, I.N.C. Research on the Parameters Optimization of Hydro-Mechanical Compound Transmission with Moga. In Proceedings of the 2018 International Conference on Electrical, Control, Automation and Robotics, Munich, Germany, 20–24 August 2018; Volume 307, pp. 47–54. [Google Scholar]
- Barbarosie, C.; Toader, A.-M. Shape and topology optimization for periodic problems. Struct. Multidiscip. Optim. 2010, 40, 381–391. [Google Scholar] [CrossRef]
- Barbarosie, C.; Toader, A.M. Optimization of bodies with locally periodic microstructure by varying the periodicity pattern. Netw. Heterog. Media 2014, 9, 433–451. [Google Scholar] [CrossRef] [Green Version]
- Li, H.; Li, H.; Xiao, M.; Zhang, Y.; Fu, J.J.; Gao, L. Robust topology optimization of thermoelastic metamaterials considering hybrid uncertainties of material property. Compos. Struct. 2020, 248, 16. [Google Scholar] [CrossRef]
- Li, N. Researcher on the Printing Pressure of the Gravure Printer; Xi’an University of Technology: Xi’an, China, 2009. [Google Scholar]
- Kuninaka, H.; Hayakawa, H. Contact and quasi-static impact of Hamilton system. J. Phys. Soc. Jpn. 2006, 75. [Google Scholar] [CrossRef] [Green Version]
- Sohn, D.; Won, H.-S.; Jang, B.; Kim, J.-H.; Lee, H.-J.; Choi, S.T. Extended JKR theory on adhesive contact between elastic coatings on rigid cylinders under plane strain. Int. J. Solids Struct. 2015, 71, 244–254. [Google Scholar] [CrossRef]
- Lu, J.; Zhang, G.; Li, L. Research on Friction between Gravure Roller and Scraping Blade. In Research on Food Packaging Technology; Yun, O., Min, X., Li, Y.T., Xunting, L., Eds.; Scientific.Net: Bäch SZ, Sitzerland, 2014; Volume 469, pp. 399–403. [Google Scholar]
- Draper, N.R.S. Applied Regression Analysis; Wiley-Interscience: New York, NY, USA, 1998. [Google Scholar]
- Hsiao, J.C.; Shivam, K.; Chou, C.L.; Kam, T.Y. Shape design optimization of a robot arm using a surrogate-based evolutionary approach. Appl. Sci. 2020, 10, 2223. [Google Scholar] [CrossRef] [Green Version]
Figure 1.
Flow chart of cell microstructure optimization.

Figure 2.
Multi-level description diagram of gravure printing plate cylinder.

Figure 3.
Regular hexagonal cell size.

Figure 4.
Regular hexagonal cell microstructure after meshing.

Figure 5.
(a) Working schematic diagram of the printing plate. (b) Contact force analysis of the printing plate cylinder.
Figure 5.
(a) Working schematic diagram of the printing plate. (b) Contact force analysis of the printing plate cylinder.

Figure 6.
(a) Deformation nephogram of the cell structure. (b) Von Mises stress nephogram of the cell structure.
Figure 6.
(a) Deformation nephogram of the cell structure. (b) Von Mises stress nephogram of the cell structure.

Figure 7.
Goodness of fit of the model.

Figure 8.
The sensitivity of design variables to objective functions.

Figure 9.
Surface response diagram between three variables: (a) Z1, C, and DMAX. (b) Z1, C, and SMAX. (c) T, A, and VTOT.
Figure 9.
Surface response diagram between three variables: (a) Z1, C, and DMAX. (b) Z1, C, and SMAX. (c) T, A, and VTOT.

Figure 10.
(a) Displacement of deformation. (b) Von Mises stress of a random node.


Table 1.
Model initial parameters.
| Name | Size | Name | Size |
|---|---|---|---|
| External copper layer thickness (T) | 120 μm | Base cell size (A) | 150 μm |
| Surface chrome layer thickness (Z1) | 8 μm | Screen wall width (C) | 10 μm |
| Number of cells | 8 × 8 | Cell depth (D) | 30 μm |
Table 2.
Numerical experiment design and calculated data.
| Node | T | Z1 | C | D | DMAX | SMAX | ||
|---|---|---|---|---|---|---|---|---|
| 1 | 100 | 9 | 145 | 11.5 | 35.5 | 0.294 | 2.788 | 1.01 × 10⁸ |
| 2 | 117.916 | 8.149 | 137.916 | 9.942 | 42.442 | 0.276 | 2.461 | 1.07 × 10⁸ |
| 3 | 117.916 | 8.149 | 137.916 | 13.058 | 28.558 | 0.424 | 4.008 | 1.07 × 10⁸ |
| 4 | 117.916 | 8.149 | 152.083 | 9.942 | 28.558 | 0.27 | 2.639 | 1.3 × 10⁸ |
| 5 | 117.916 | 8.149 | 152.083 | 13.058 | 42.442 | 0.413 | 4.058 | 1.3 × 10⁸ |
| 6 | 117.916 | 9.85 | 137.916 | 9.942 | 28.558 | 0.250 | 1.71 | 1.07 × 10⁸ |
| 7 | 117.916 | 9.85 | 137.916 | 13.058 | 42.442 | 0.359 | 3.372 | 1.08 × 10⁸ |
| 8 | 117.916 | 9.85 | 152.083 | 9.942 | 42.442 | 0.244 | 1.802 | 1.3 × 10⁸ |
| 9 | 117.916 | 9.85 | 152.083 | 13.058 | 28.558 | 0.355 | 3.098 | 1.31 × 10⁸ |
| 10 | 125 | 6 | 145 | 11.5 | 35.5 | 0.474 | 5.315 | 1.25 × 10⁸ |
| 11 | 125 | 9 | 120 | 11.5 | 35.5 | 0.333 | 2.552 | 0.86 × 10⁸ |
| 12 | 125 | 9 | 145 | 6 | 35.5 | 0.164 | 1.392 | 1.24 × 10⁸ |
| 13 | 125 | 9 | 145 | 11.5 | 11 | 0.318 | 2.849 | 1.25 × 10⁸ |
| 14 | 125 | 9 | 145 | 11.5 | 35.5 | 0.318 | 2.902 | 1.25 × 10⁸ |
| 15 | 125 | 9 | 145 | 11.5 | 60 | 0.319 | 2.671 | 1.25 × 10⁸ |
| 16 | 125 | 9 | 145 | 17 | 35.5 | 0.635 | 5.507 | 1.27 × 10⁸ |
| 17 | 125 | 9 | 170 | 11.5 | 35.5 | 0.314 | 2.900 | 1.72 × 10⁸ |
| 18 | 125 | 12 | 145 | 11.5 | 35.5 | 0.278 | 1.720 | 1.26 × 10⁸ |
| 19 | 132.083 | 8.1499 | 137.916 | 9.942 | 28.558 | 0.29 | 2.391 | 1.19 × 10⁸ |
| 20 | 132.083 | 8.1499 | 137.916 | 13.058 | 42.442 | 0.44 | 3.76 | 1.2 × 10⁸ |
| 21 | 132.083 | 8.1499 | 152.083 | 9.942 | 42.442 | 0.283 | 2.688 | 1.45 × 10⁸ |
| 22 | 132.083 | 8.1499 | 152.083 | 13.058 | 28.558 | 0.427 | 4.053 | 1.46 × 10⁸ |
| 23 | 132.083 | 9.85 | 137.916 | 9.942 | 42.442 | 0.263 | 1.753 | 1.2 × 10⁸ |
| 24 | 132.083 | 9.85 | 137.916 | 13.058 | 28.558 | 0.375 | 3.478 | 1.2 × 10⁸ |
| 25 | 132.083 | 9.85 | 152.083 | 9.942 | 28.558 | 0.255 | 1.733 | 1.45 × 10⁸ |
| 26 | 132.083 | 9.85 | 152.083 | 13.058 | 42.442 | 0.369 | 3.107 | 1.46 × 10⁸ |
| 27 | 150 | 9 | 145 | 11.5 | 35.5 | 0.342 | 3.133 | 1.5 × 10⁸ |
Table 3.
Pareto optimal set of multi-objective optimization.
| Node | T | Z1 | C | D | DMAX | SMAX | ||
|---|---|---|---|---|---|---|---|---|
| 1 | 100.76 | 8.949 | 120.15 | 6.53 | 29.95 | 0.155 | 0.094 | 6.878 × 10⁷ |
| 2 | 100.52 | 9.042 | 120.24 | 6.269 | 55.04 | 0.158 | 1.4886 | 6.882 × 10⁷ |
| 3 | 100.3 | 8.5 | 120.96 | 6.349 | 38.68 | 0.157 | 0.220 | 6.943 × 10⁷ |
Table 4.
Comparison of cell microstructure before and after optimization.
| Node | T | Z1 | C | D | DMAX | SMAX | ||
|---|---|---|---|---|---|---|---|---|
| Before | 120 | 8 | 150 | 10 | 30 | 0.27 | 2.739 | 1.284 × 10⁸ |
| After | 100.76 | 8.949 | 120.15 | 6.53 | 29.95 | 0.155 | 0.094 | 6.879 × 10⁷ |
| Change | The maximum deformation was reduced by 44.4%, and the total model volume was reduced by 46.3%. | |||||||
Publisher’s Note: MDPI stays neutral with regard to jurisdictional claims in published maps and institutional affiliations. |
© 2021 by the authors. Licensee MDPI, Basel, Switzerland. This article is an open access article distributed under the terms and conditions of the Creative Commons Attribution (CC BY) license (http://creativecommons.org/licenses/by/4.0/).
Share and Cite
MDPI and ACS Style
Wu, S.; Xing, J.; Dong, L.; Zhu, H. Multi-Objective Optimization of Microstructure of Gravure Cell Based on Response Surface Method. Processes 2021, 9, 403. https://0-doi-org.brum.beds.ac.uk/10.3390/pr9020403
AMA Style
Wu S, Xing J, Dong L, Zhu H. Multi-Objective Optimization of Microstructure of Gravure Cell Based on Response Surface Method. Processes. 2021; 9(2):403. https://0-doi-org.brum.beds.ac.uk/10.3390/pr9020403
Chicago/Turabian StyleWu, Shuang, Jiefang Xing, Ling Dong, and Honjuan Zhu. 2021. "Multi-Objective Optimization of Microstructure of Gravure Cell Based on Response Surface Method" Processes 9, no. 2: 403. https://0-doi-org.brum.beds.ac.uk/10.3390/pr9020403
Note that from the first issue of 2016, this journal uses article numbers instead of page numbers. See further details here.