
Development of a New Sensor Module for an Enhanced Fuel Flexible Operation of Biomass Boilers


Fraunhofer Institute for Environmental, Safety and Energy Technology UMSICHT Institute Branch Sulzbach-Rosenberg, 92237 Sulzbach-Rosenberg, Germany
*
Author to whom correspondence should be addressed.
Processes 2021, 9(4), 661; https://0-doi-org.brum.beds.ac.uk/10.3390/pr9040661
Submission received: 15 March 2021
/
Revised: 5 April 2021
/
Accepted: 7 April 2021
/
Published: 9 April 2021
(This article belongs to the Special Issue Modelling, Simulation and Control in Combustion Processes of Renewable Fuels)
Abstract
:The heterogeneity of biogenic fuels, and especially biogenic residues with regard to water and ash content, particle size and particle size distribution is challenging for biomass combustion, and limits fuel flexibility. Online fuel characterization as a part of process control could help to optimize combustion processes, increase fuel flexibility and reduce emissions. In this research article, a concept for a new sensor module is presented and first tests are displayed to show its feasibility. The concept is based on the principle of hot air convective drying. The idea is to pass warm air with 90 °C through a bulk of fuel like wood chips and measure different characteristics such as moisture, temperatures and pressure drop over the bulk material as a function over time. These functions are the basis to draw conclusions and estimate relevant fuel properties. To achieve this goal, a test rig with a volume of 0.038 m3 was set up in the laboratory and a series of tests was performed with different fuels (wood chips, saw dust, wood pellets, residues from forestry, corn cobs and biochar). Further tests were carried out with conditioned fuels with defined water and fines contents. The experiments show that characteristic functions arise over time. The central task for the future will be to assign these functions to specific fuel characteristics. Based on the data, the concept for a software for an automated, data-based fuel detection system was designed.
1. Introduction
The use of biomass as solid fuel is of great importance worldwide. Automated biomass furnaces in a range of 10 kW to 10 MW predominantly generate heat and electricity. For a steady and clean combustion process, a consistent quality of fuel characteristics is very important. Biogenic solid fuels and especially residues have a large heterogeneity in terms of fuel characteristics, causing higher emissions and even technical failures [1,2]. That is why plant operators invest a lot in fuel quality management, supported by research activities aiming to standardize fuel quality [3,4] and optimize densification technology [5,6]. Manufacturers of biomass boilers and plants as well as gasification units are trying to increase the fuel flexibility of their plants in order to maximize both profitability and safety [7,8]. Key to a more fuel flexible operation is the ability of the plant to react to changing fuel qualities. The ability to gain knowledge of the fuel properties utilized in that moment would be of central importance to this step. Researchers as well as industry try to achieve this goal, following different approaches for small-scale biomass boilers up to large municipal solid-waste incineration plants.
Currently, fuel characteristics are determined offline by laboratory analyses. Laboratory analyses allow for high measurement accuracy [9], but it is hardly possible to use the information gained from the analysis in the process. This is mainly due to the time delay caused by the extensive steps, ranging from sampling to the final results of the analysis. The results are usually only available a few hours, or even a few days later, which has a direct influence on the combustion process impossible. Furthermore, a number of errors can occur along the process chain, from sampling to sample transport and preparation. In addition, the effort and challenges of representative sampling from large piles of bulk goods is huge.
To enable a direct influence on the process control during the combustion, an online measurement and real-time analysis of relevant fuel properties is necessary. In the literature, as well as in industry, different approaches can be found:
One possibility is to make an estimation of the composition or moisture content of the fuel based on the measured flue gas composition. There are a number of research activities in the field of waste incineration [10], but also for biomass combustion [11]. For example, Striugas et al. [12] developed an algorithm to estimate the fuel moisture from the flue gas. The algorithm is based on the process parameters of the plant and especially on the emission values. In a test on a 6 MW plant, the fuel moisture could be calculated with an accuracy of 2.4%. Lange [13] investigated different residual and waste materials using the example of a circulating fluidized bed, where the CO2 value or the theoretical maximum of CO2 are the main components used for the back calculation. Approaches with model-based control, for example, that described in [12,14], are able to achieve a considerable improvement in flexibility. However, the implementation of such a system requires extensive knowledge of the plant and the fuel, and involves considerable efforts in research and development. For decentralized combustion plants, this effort is not economically feasible to date. Warnecke et al. [15] discuss the challenges associated with back calculation from flue gas values and identify the water content in particular as a weak point, due to the large number of possible sources in municipal solid waste incineration. The authors point out that a reliable conclusion can only be drawn about the fuel moisture content if the hydrogen content in the fuel is approximately constant. There are also a series of patents with different approaches to forming the estimation and implementing this information into the process control [16,17,18,19].
Other approaches aim to directly measure relevant properties of the fuel prior to the feed input. Additionally, in this research area, most of the concepts originate from waste incineration. Technical solutions for this rely on different technologies and methods. Such systems for online fuel characterization use infrared-, microwave- [20,21] and radiation- [22] based technologies. None of the solutions have found widespread application in industry.
In [20], a concept based on microwave detectors aiming to determine the water content of a fuel is described. In this case, waste in a waste-to-energy plant is measured. In [21], a control concept for biomass combustion plants is described, which continuously detects the fuel moisture and adjusts the plant parameters (feed-in, speed of grate motion, air volume and distribution, etc.) according to the moisture content. Microwave measurement has weaknesses regarding highly inhomogeneous bulk materials. For this purpose, the measurement is mainly suitable for the determination of the water content. Other relevant parameters cannot be determined.
Other solutions, as in [22], rely on radiation-based measuring devices to record the density. In combination with a moisture sensor, more precise information about the fuel (residual waste) can be obtained. For small- and medium-scale biomass plants and boilers, radiation-based sensors are not applicable due to economic reasons.
Near-infrared sensors (NIR) are used in recycling applications and have received more attention in recent years for integration into combustion process control. NIR technology is able to distinguish between different groups of substances in a material by means of the interaction between matter and electromagnetic radiation. In this process, the fuel molecules are vibrated with electromagnetic radiation, causing a certain amount of the radiation energy to be absorbed. The absorption intensity over the wavelength is referred to as a spectrum and is compared with reference spectra from the database in the system to identify the fuel. In addition, material-specific data can be used to calculate fuel-relevant parameters such as water and ash content. This technology is notably used in the field of waste management for sorting various types of waste. The use of a continuous real-time analysis of refuse-derived fuels (RDF) is part of various development projects, such as [23].
NIR technology is also used in the field of biomass utilization, for example, to measure the moisture content of fuels [24,25]. Examples of available products include the NIR 6000 moisture meter from Sensortech Systems Inc. [26] and the ProcessOPT BO system from APOS GmbH [27]. With the ProcessOPT BC system, APOS GmbH has developed a control system that determines the calorific value, water and ash content of the fuel before it enters the combustion chamber. When combined with the CO concentration in the flue gas, the process control of the plant is optimized [28]. A project aiming for online characterization of wood chips is additionally linked to the concept of NIR technology. The developed system is able to measure water content, weigh the fuel online, and then calculate the energy content. In the system, the fuel moves along a conveyor belt integrated with a scale. An infrared sensor and a microwave sensor determine the water content. Initial tests in the laboratory and in the field have been successful. However, the aim of the project is not to optimize control of the combustion process, but to provide a tool for an optimized billing of fuels [29]. However, providing the information to the process control is conceivable in perspective.
For defined fuels, NIR technology delivers good results with appropriate calibration. However, the need for intensive calibration becomes a disadvantage with altering and challenging feedstocks. Furthermore, it should be noted that the technology is not able to detect dark materials and the detection of fine materials is also very difficult. The cost of measuring devices with NIR technology is relatively high, which means that the implementation of these systems in plants in the low power range usually proves uneconomical, and, therefore, applications are only known from the power plant scale. To date, no such system is available for small- and medium-sized biomass plants or has a significant relevance in terms of practical applications.
The basic motivation of this work is to search for an easy and robust low-cost solution enabling online measurement of fuel properties during operation before the fuel is fed into the furnace. The idea investigated in this research is based on the following hypothesis: If warm air passes through a bulk of solid fuel, the air interacts with the solid bed during the flow. As a result of physical processes like heat transfer, drying and changing pressure, the air properties are measurably changed. Based on these changes, it is possible to draw conclusions about relevant fuel properties.
For this purpose, the central objective of this scientific research is to show the technical feasibility of the idea and to identify correlations between fuel characteristics and the behavior of the feedstock in the test rig described below. These correlations should make it possible to identify fuels and specific fuel characteristics. For this purpose, a number of test fuels were selected for various test series, and these were analyzed systematically. For this purpose, a test rig was set up and series of measurements were carried out with different feedstocks in order to provide evidence of the general feasibility of the idea. The main goal of these tests is to answer the following questions: Do the data series of the different input materials show significant differences? Are the results reproducible? Can these differences be related to relevant fuel properties? How can the data profiles be used for an evaluation?
Subsequently, a detailed series of measurements was performed to evaluate specific properties and correlations, and optimization was carried out on the test rig. In principle, this work first investigated whether corresponding correlations can be detected using simple measurement methods and whether usable correlations between fuel properties and measured values can be identified. The next step was to investigate whether, how and under what conditions a corresponding concept can be transferred to practical plants. Software integration and, in particular, different approaches for data evaluation and signals also played a major role.
If a robust, easy-to-operate and cost-effective system can be developed, this could be an important contribution to making processes such as combustion, gasification or pyrolysis more stable and, above all, more fuel-flexible. In addition to the development of the sensor system, this opens up further research fields and activities, especially in the area of process integration.
2. Materials and Methods
2.1. Lab Scale Test Rig
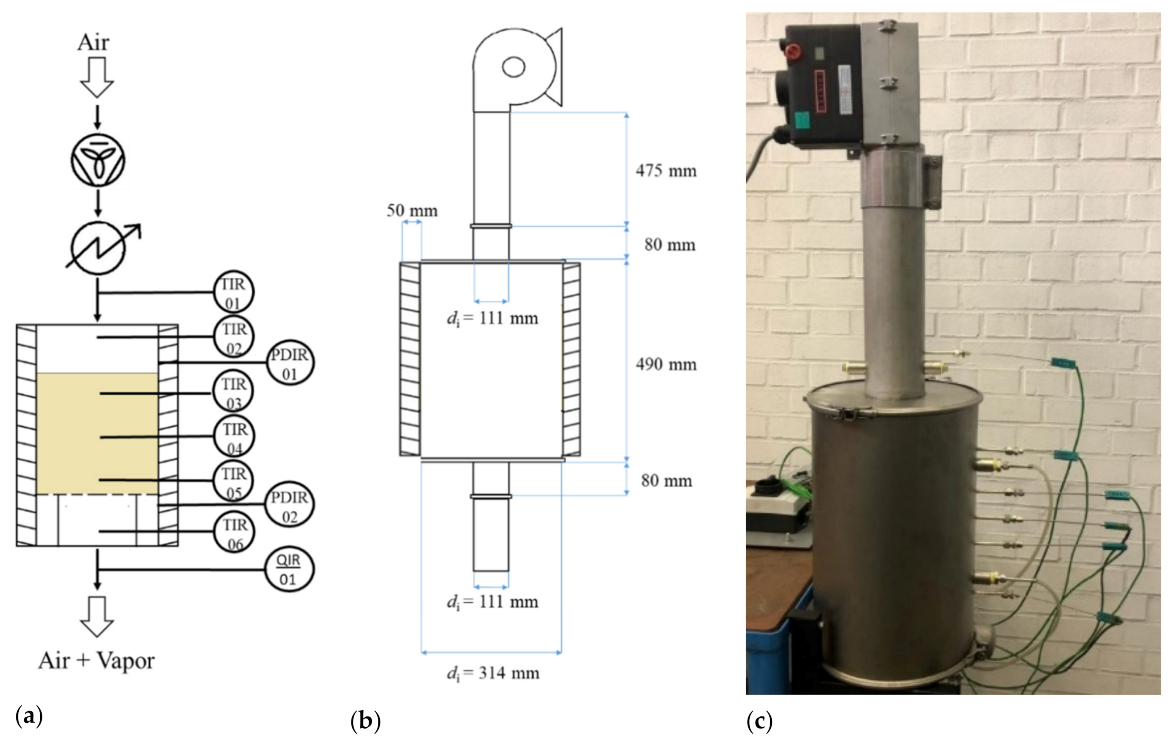
The test rig is an airtight metal cylinder, which can be filled with bulk material. The drying container consists of a tube with an inner diameter of 314 mm and a height of 490 mm. At the top and bottom of the container, there is a lid with a centered circular opening to which a tube is welded. The inner diameter of the openings and the welded pipes is 111 mm. The bottom and the lid are each fixed with a clamping ring and sealed by a silicone ring. The connection of the vessel to the blower as well as to the test rig is also made with clamping rings and sealed by means of silicone rings. The pipes have a wall thickness of 1 mm and are made of galvanized chrome-nickel steel (material: 1.4301; X5CrNi18-10) with a thermal conductivity of 15 W·(mK)−1. To insulate the pipe, its outer surface is covered with a 50 mm thick layer of rock wool, which is fixed by aluminum adhesive tape. The schematic setup and the dimensions of the test facility can be seen in Figure 1a,b.
A hot air blower—Vulcan System model (11 kW power; 950 L·min−1 max. air volume at 20 °C)—from the Leister company can be mounted on the metal pipes (see Figure 1c). According to the manufacturer, the hot air blower has a power of 11 kW and is capable of applying a maximum air flow of 950 L·min−1 at a temperature of 20 °C and a static pressure of 3100 Pa. The heating power of the blower can be adjusted by means of a potentiometer in the range between 50 °C and 650 °C in 5 °C steps. A built-in display shows the set temperature and the current temperature reached. In order to avoid thermal decomposition processes of the woody fuels and safety risks, the test series are carried out with a blower temperature of 90 °C.
Temperature sensors are attached before (TIR1, TIR2) and after the bulk material (TIR6), as well as three sensors in the bulk material (TIR3, TIR4 and TIR5). Two pressure sensors—one before (PIR1) and one after the bulk material (PIR2)—are also attached to the side of the container. All sensors are connected with an Almemo 2890-9 data logger from Ahlborn. Data were logged with 10 datapoints per second. Temperatures were measured with thermocouples (NiCr-Ni Typ K with a range from −200 °C … +1370 °C), pressure with Almemo (0 Pa … 6800 Pa) and gas velocities in a range from 0 m·s−1 to 2 m·s−1. Ambient temperature (−50 °C +200 °C) and relative humidity (0–100%) were also measured via Almemo. Ambient pressure was measured with a digital manometer (Keller Leo 2). Water content in the air was measured with an MCA 04 der Dr. Födisch Umweltmesstechnik (0–40 Vol.-%).
2.2. Test Procedure
Before each test, the fuel sample was filled into the container up to the mark of the first pressure measurement. In order to avoid irregularities and possible bridging, a rubber mallet was tapped lightly against the container wall after filling. The container was then filled back up to the mark, and the lid was placed on top and sealed airtight. Finally, the sensors were connected. The air volume flow was kept constant for all tests and amounted to 950 L·min−1. To start the test, the hot air blower was switched on and set to the required temperature. The measured values were automatically recorded at intervals of 10 s. The ambient pressure could not be logged, so the values were noted manually. As soon as the feedstock was completely dried and the temperature in the container was constant, or no changes in the measured water content in the exhaust air were apparent, the system was shut down. The test duration, therefore, varied from fuel to fuel, since the feedstock had different water contents and different particle size distributions. The dried feedstock was then analyzed in the laboratory for residual water content.
2.3. Feedstock
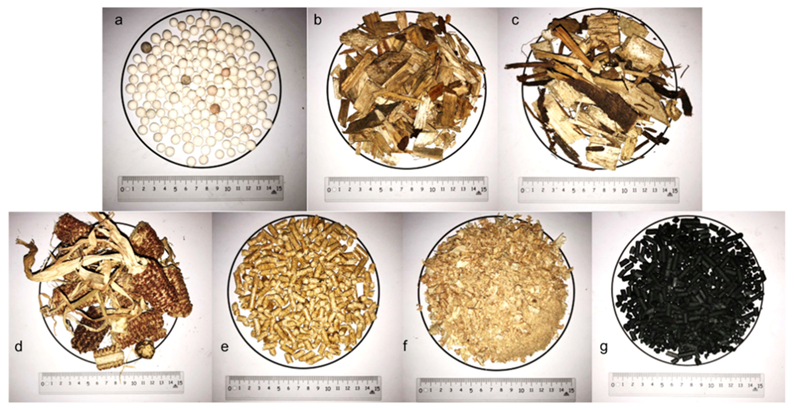
In a first series of test runs, a wide range of different biogenic fuels (wood chips, residues forestry residues, corn cobs, wood pellets, biochar and saw dust) was tested. In addition, alumina oxide spheres were also tested as a reference bulk good with defined characteristics. In Figure 2 shows pictures of all used feedstocks. In Table 1 water content, ash content and lower heating value (LHV) are shown, as well as the results of the chemical composition. Medium particle size, fines content (<3.15 mm) and large particles (>45 mm), as well as the bulk density, are shown in Table 2.
3. Results
The following section presents results from the laboratory test rig.
3.1. Screening of Biogenic Residues
3.1.1. Pressure Drop
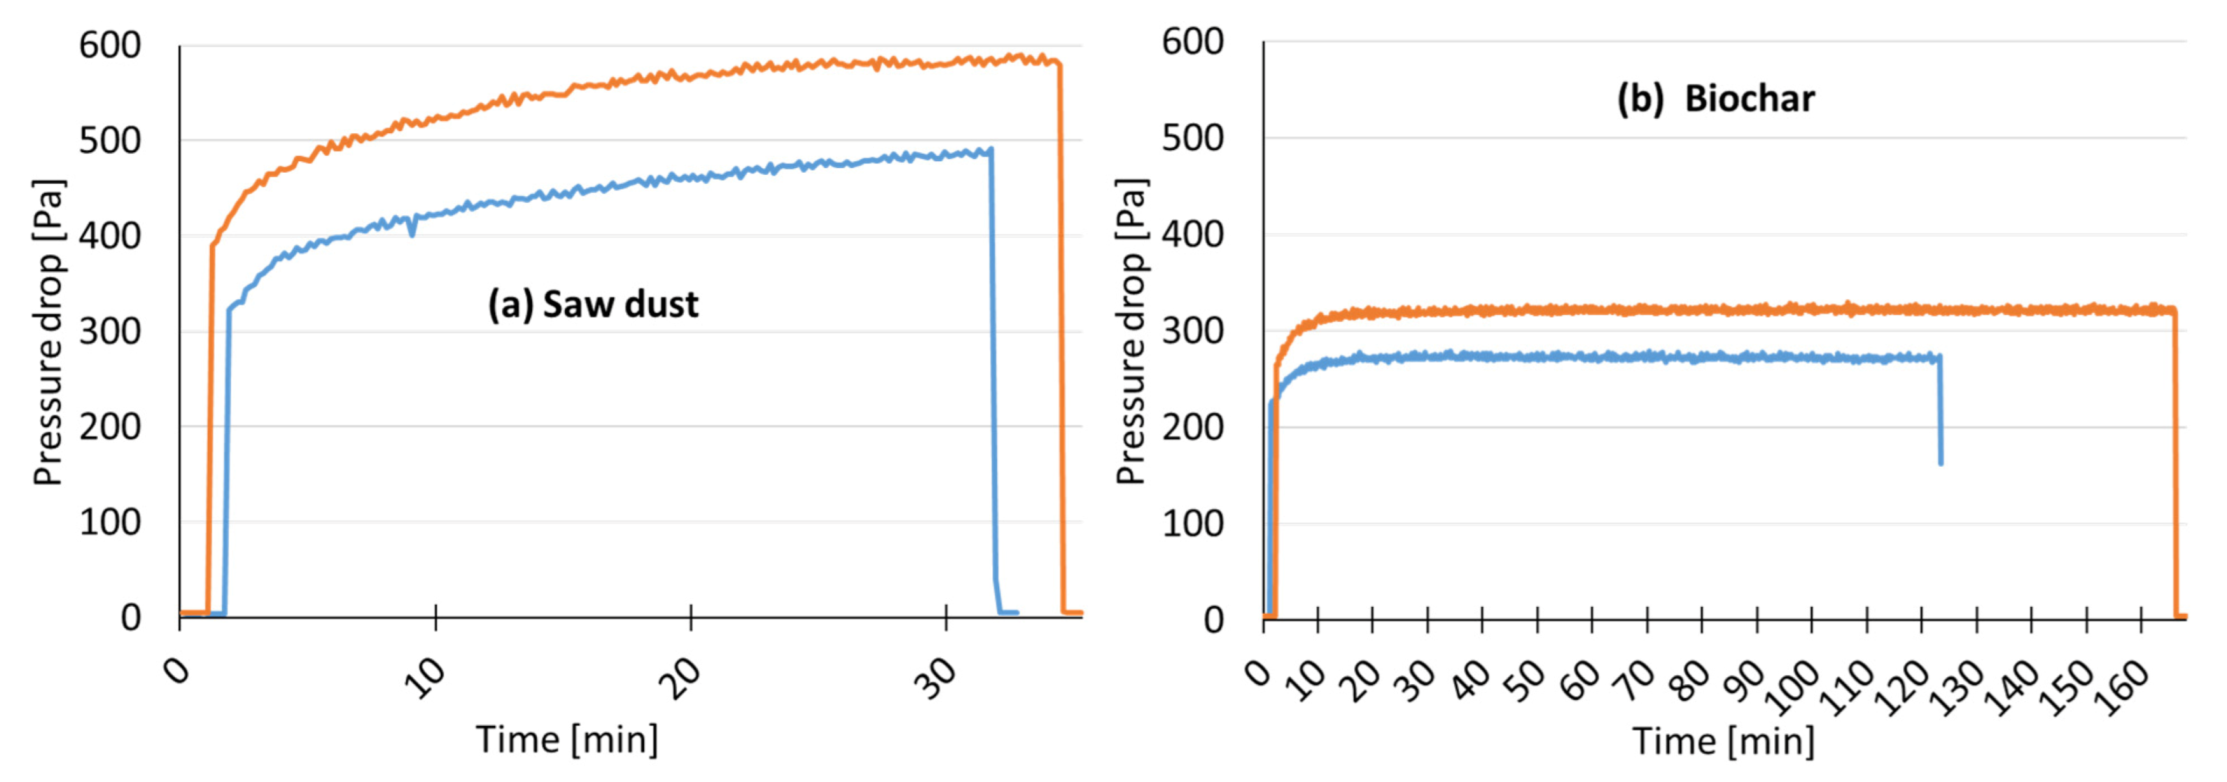
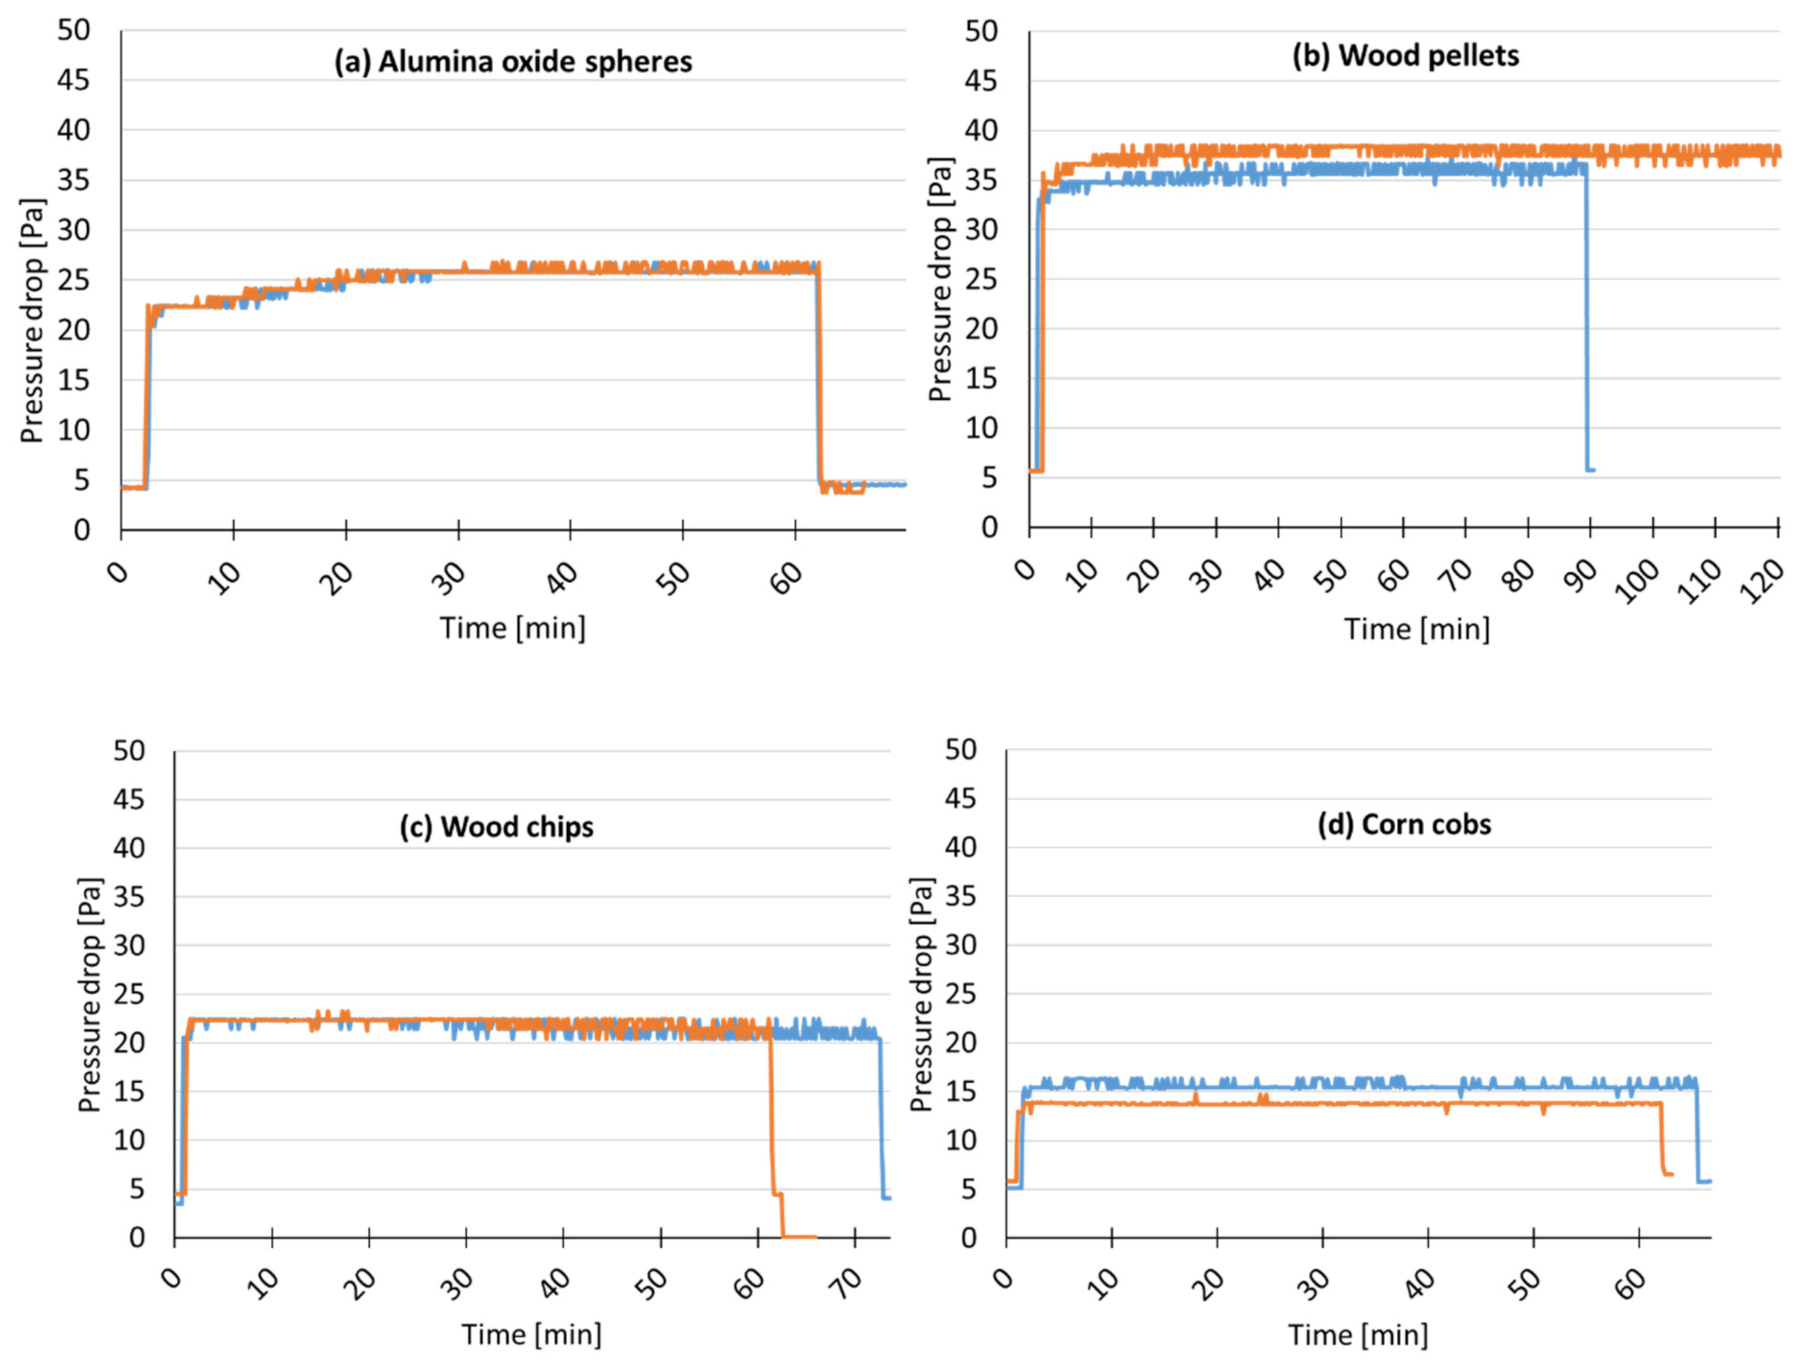
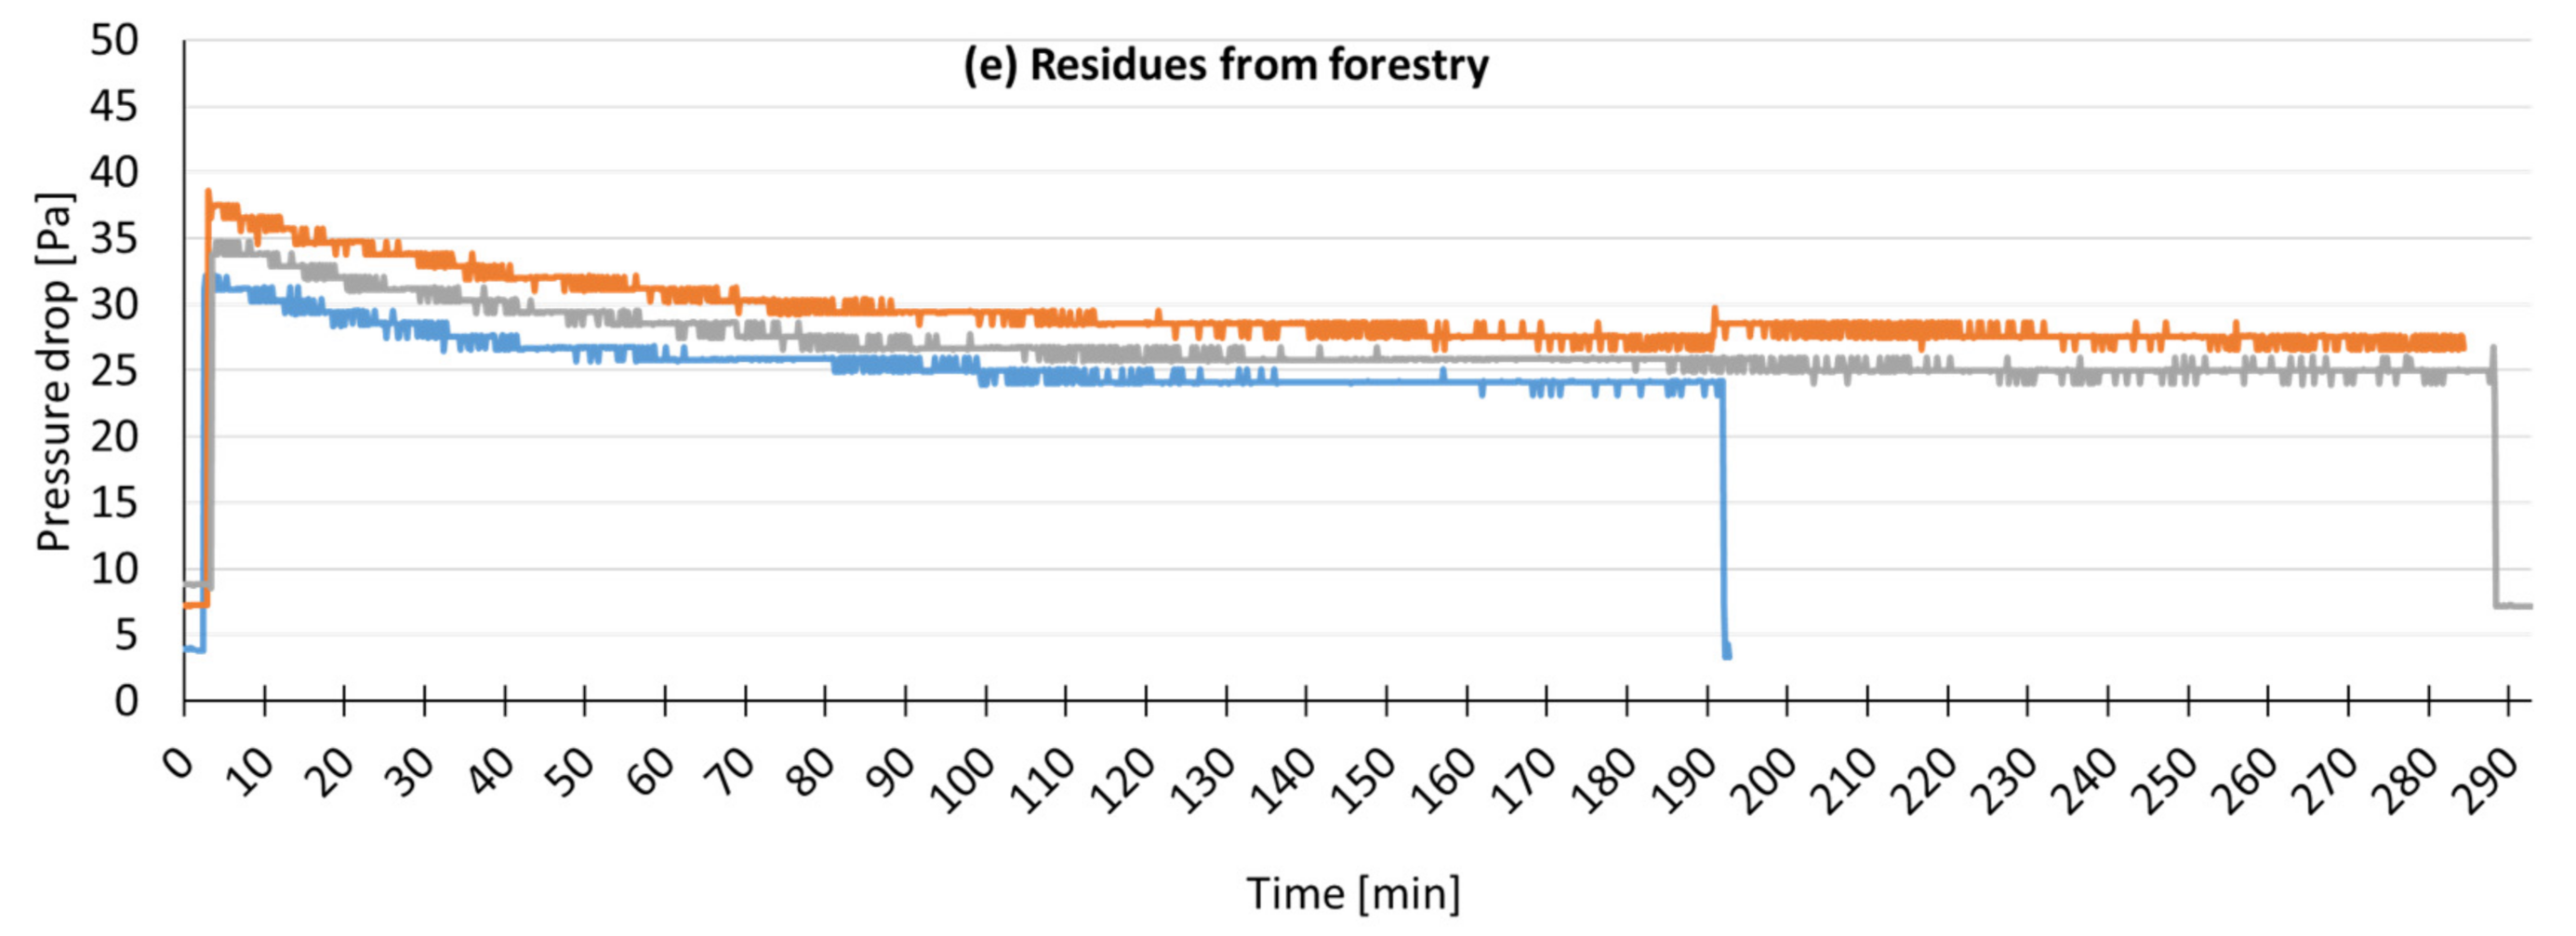
In a first step, a wide range of different feedstocks was tested by screening. Figure 3 shows the pressure drop (y-axis) against time (x-axis) for bulks of saw dust (a) and biochar (b), Figure 4 shows the same for alumina oxide spheres (a), wood pellets (b), wood chips (c), corn cobs (d) and residues from forestry (e). The measurements show a wide range, from 13 Pa (corn cobs) up to almost 600 Pa (saw dust). All tests show similar behavior, which indicates a high level of reproducibility. The different colors represent different test runs. Pressure drop remains more or less constant over the whole test run. Fuels with very small particles (saw dust and biochar) show a slight increase over time. The authors suspect that the porosity decreased over time in part due to the compression of the air, resulting in increased pressure losses. Another exception can be found in the curve of the residues from forestry (f). Here, the pressure drop decreases over time. The authors assume that this effect is related to drying. At the beginning, a comparatively large mass flow of water is evaporated from the fuel, which increases pressure drop. This effect weakens over time.
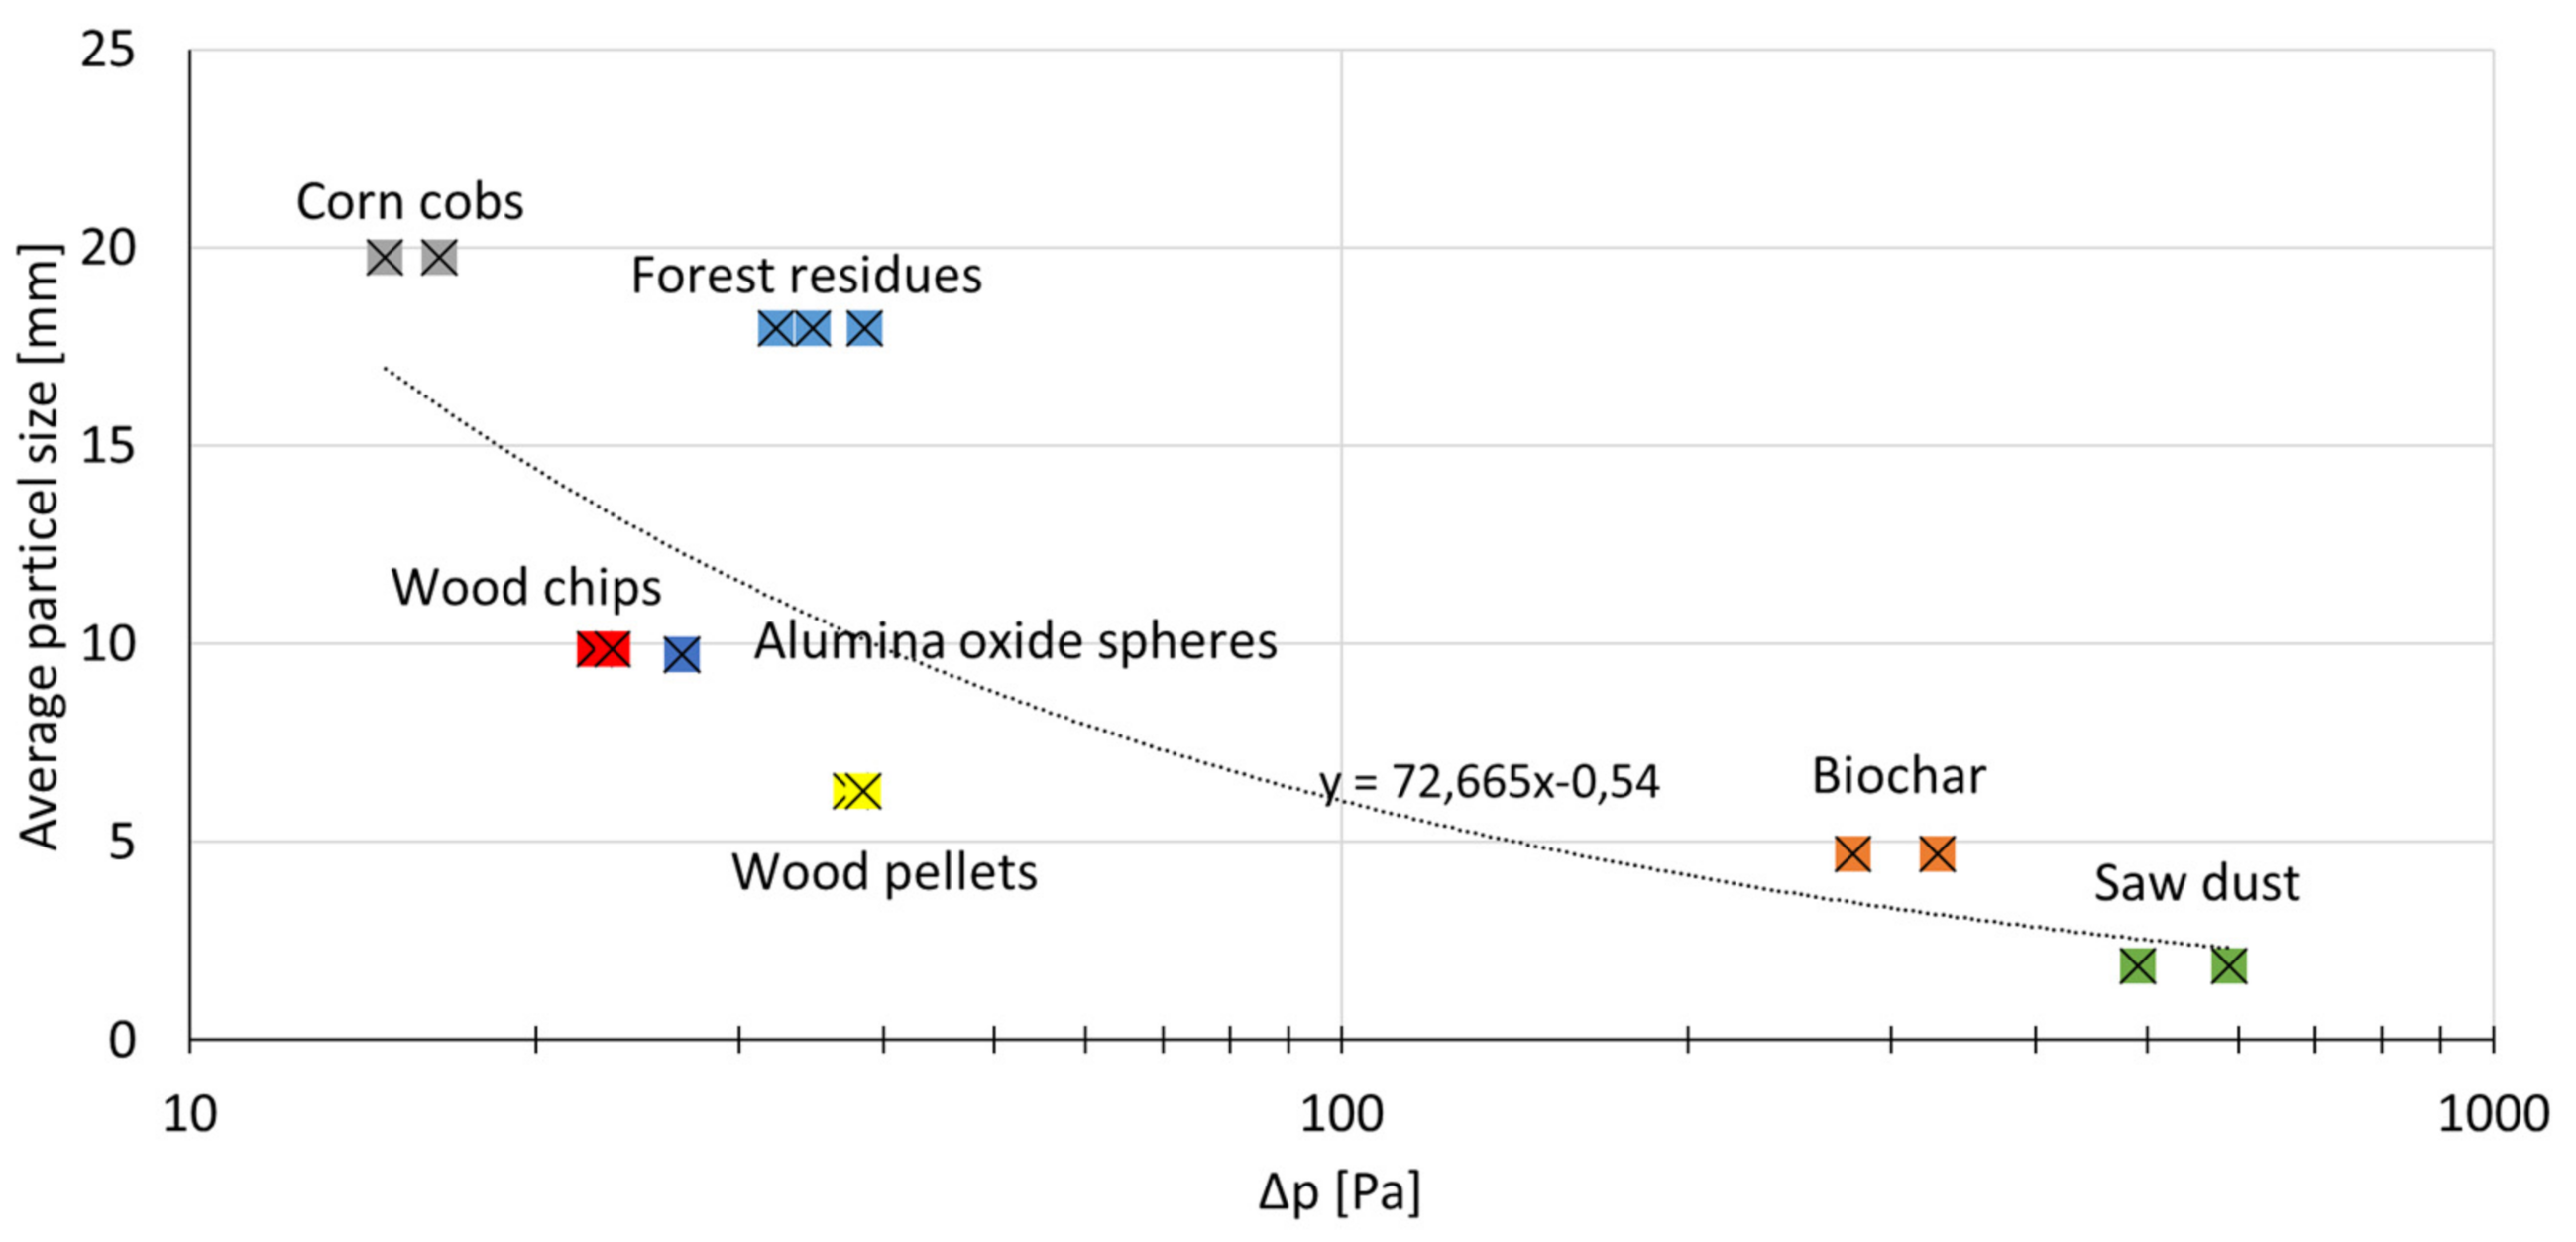
In Figure 5, the average pressure drop (x-axis) was plotted against the average particle size (y-axis). The figure shows, in a highly simplified view, that smaller particles tend to cause a higher pressure drop. Bulk solids with a broad particle size distribution and undefined shapes lead to higher pressure drop, such as residues from forestry or corn cobs, while more defined particle shapes and distributions tend to produce lower pressure drops, i.e., pellets or alumina oxide spheres.
3.1.2. Temperature
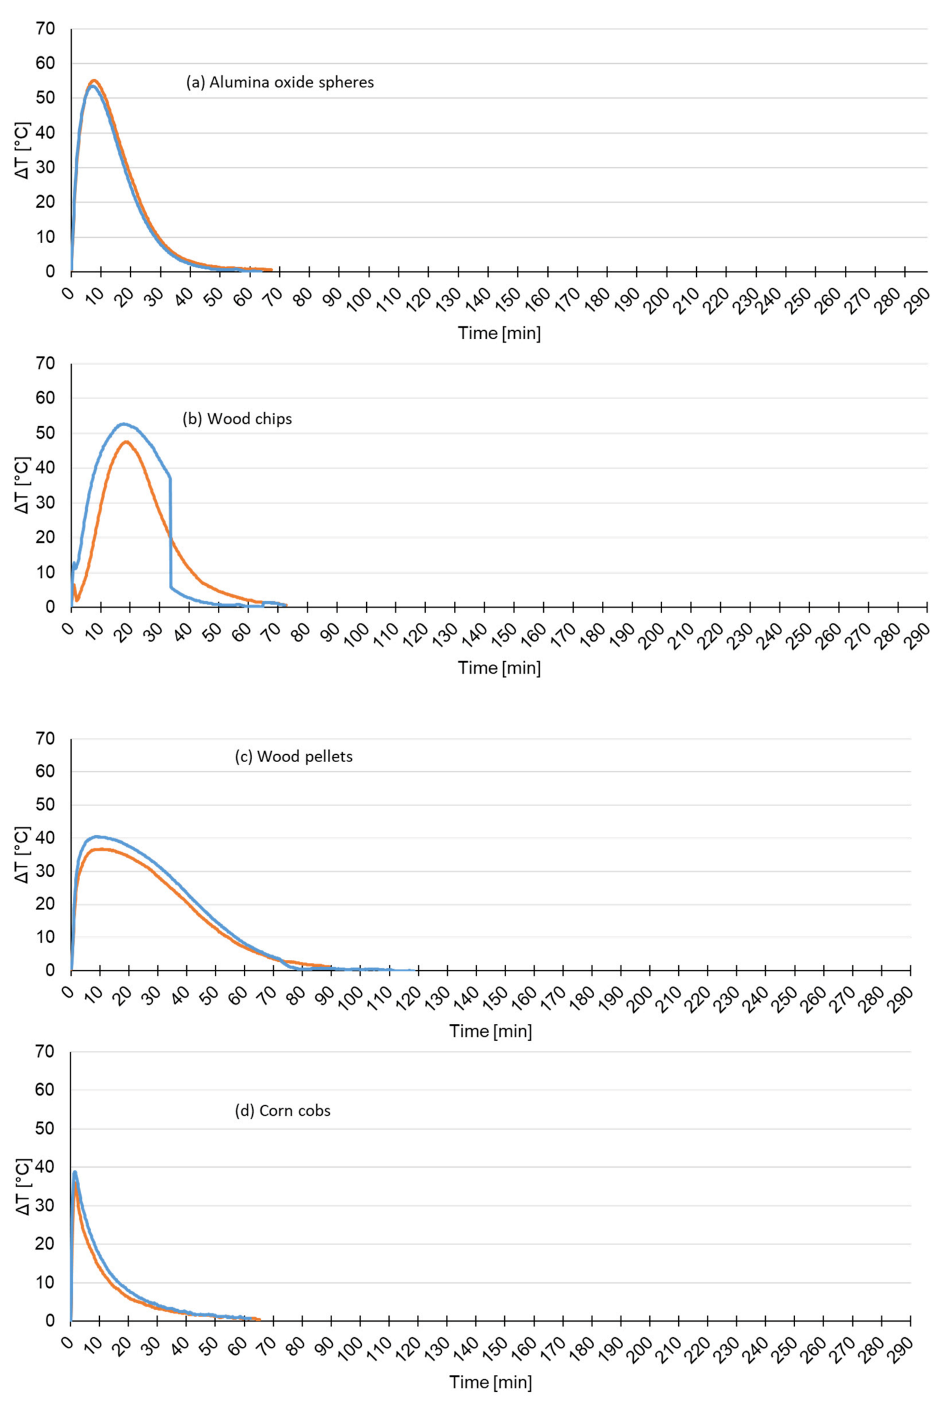
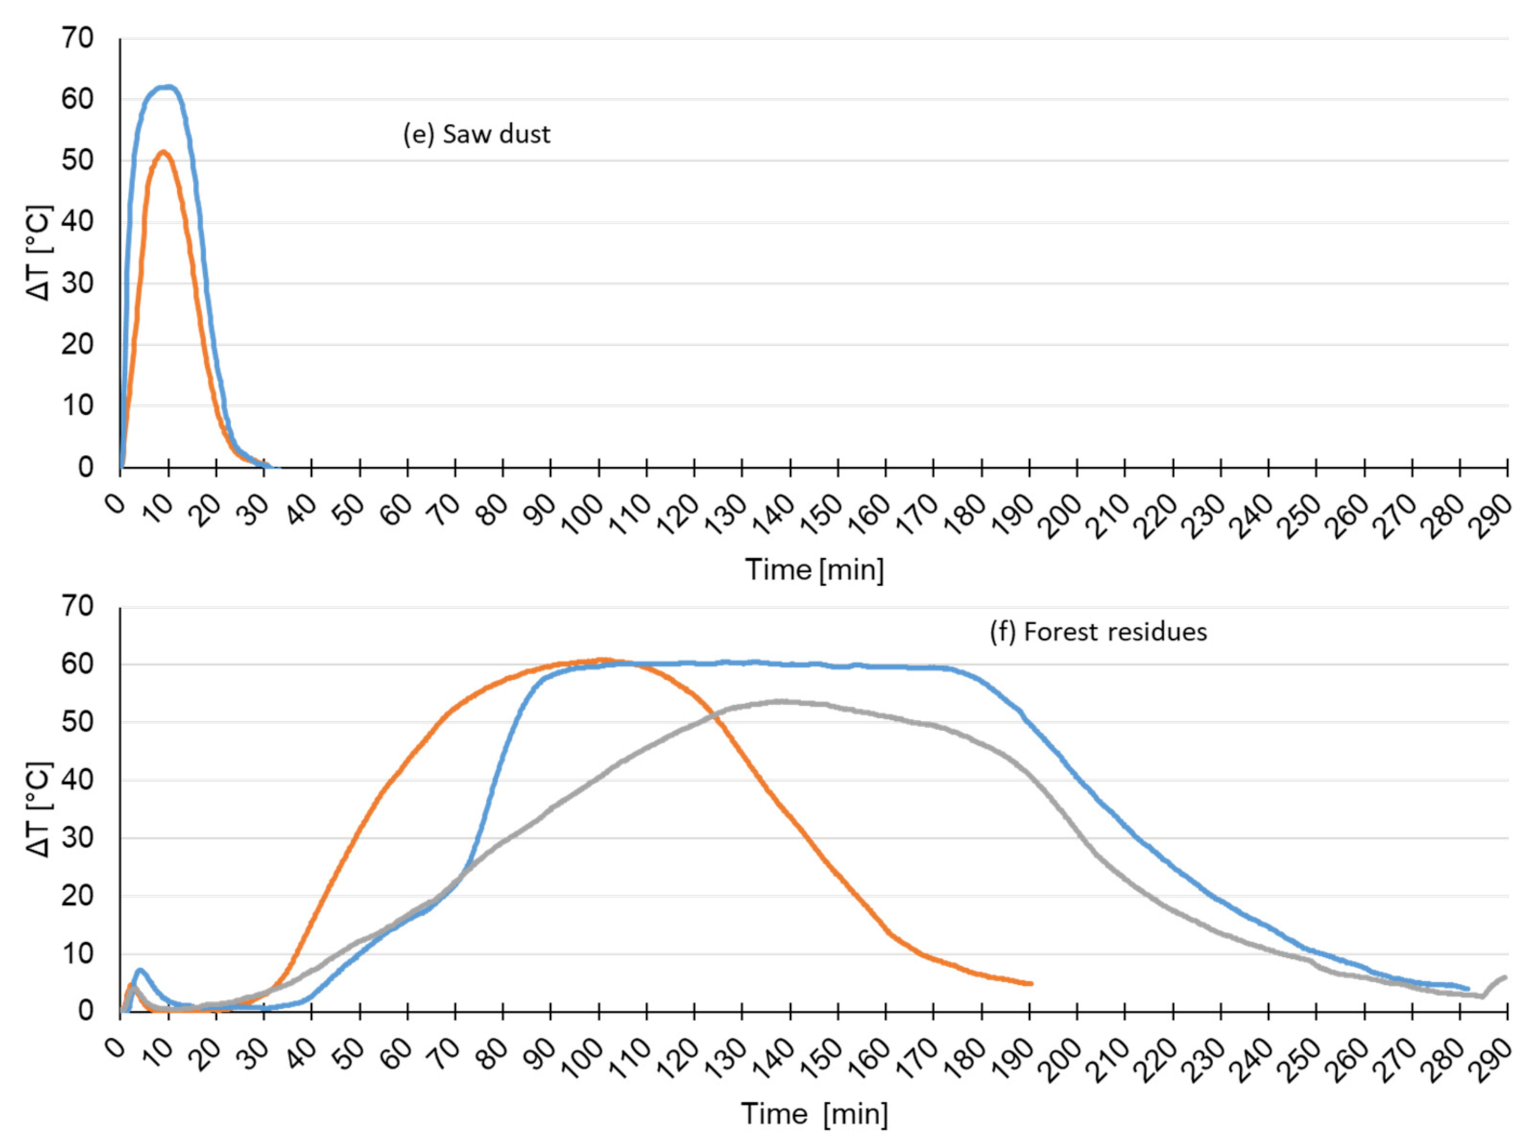
In the test, the temperatures (TIR 1-6) are also measured continuously. Obviously, the corresponding temperature profiles are dependent on time and location. For example, Figure 6 shows the difference between the temperature before and after the bulk good. For the different materials, alumina oxide (a), biochar (b), wood pellets (c), corn cobs (d), saw dust (e) and residues from forestry (f) specific distributions can be seen. Very wet materials, such as residues from forestry, show an offset time until a rise in the curve can be observed. The incline of the curve is very steep for very dry feedstock (alumina oxide spheres, wood pellets, corn cobs and saw dust), while a less steep increase in the slope can already be seen with slightly higher water contents (wood chips). These functions can be utilized later, either for data-based matching functions, of for analytical approaches to fuel recognition.
3.2. Specific Variation of Fuel Parameters
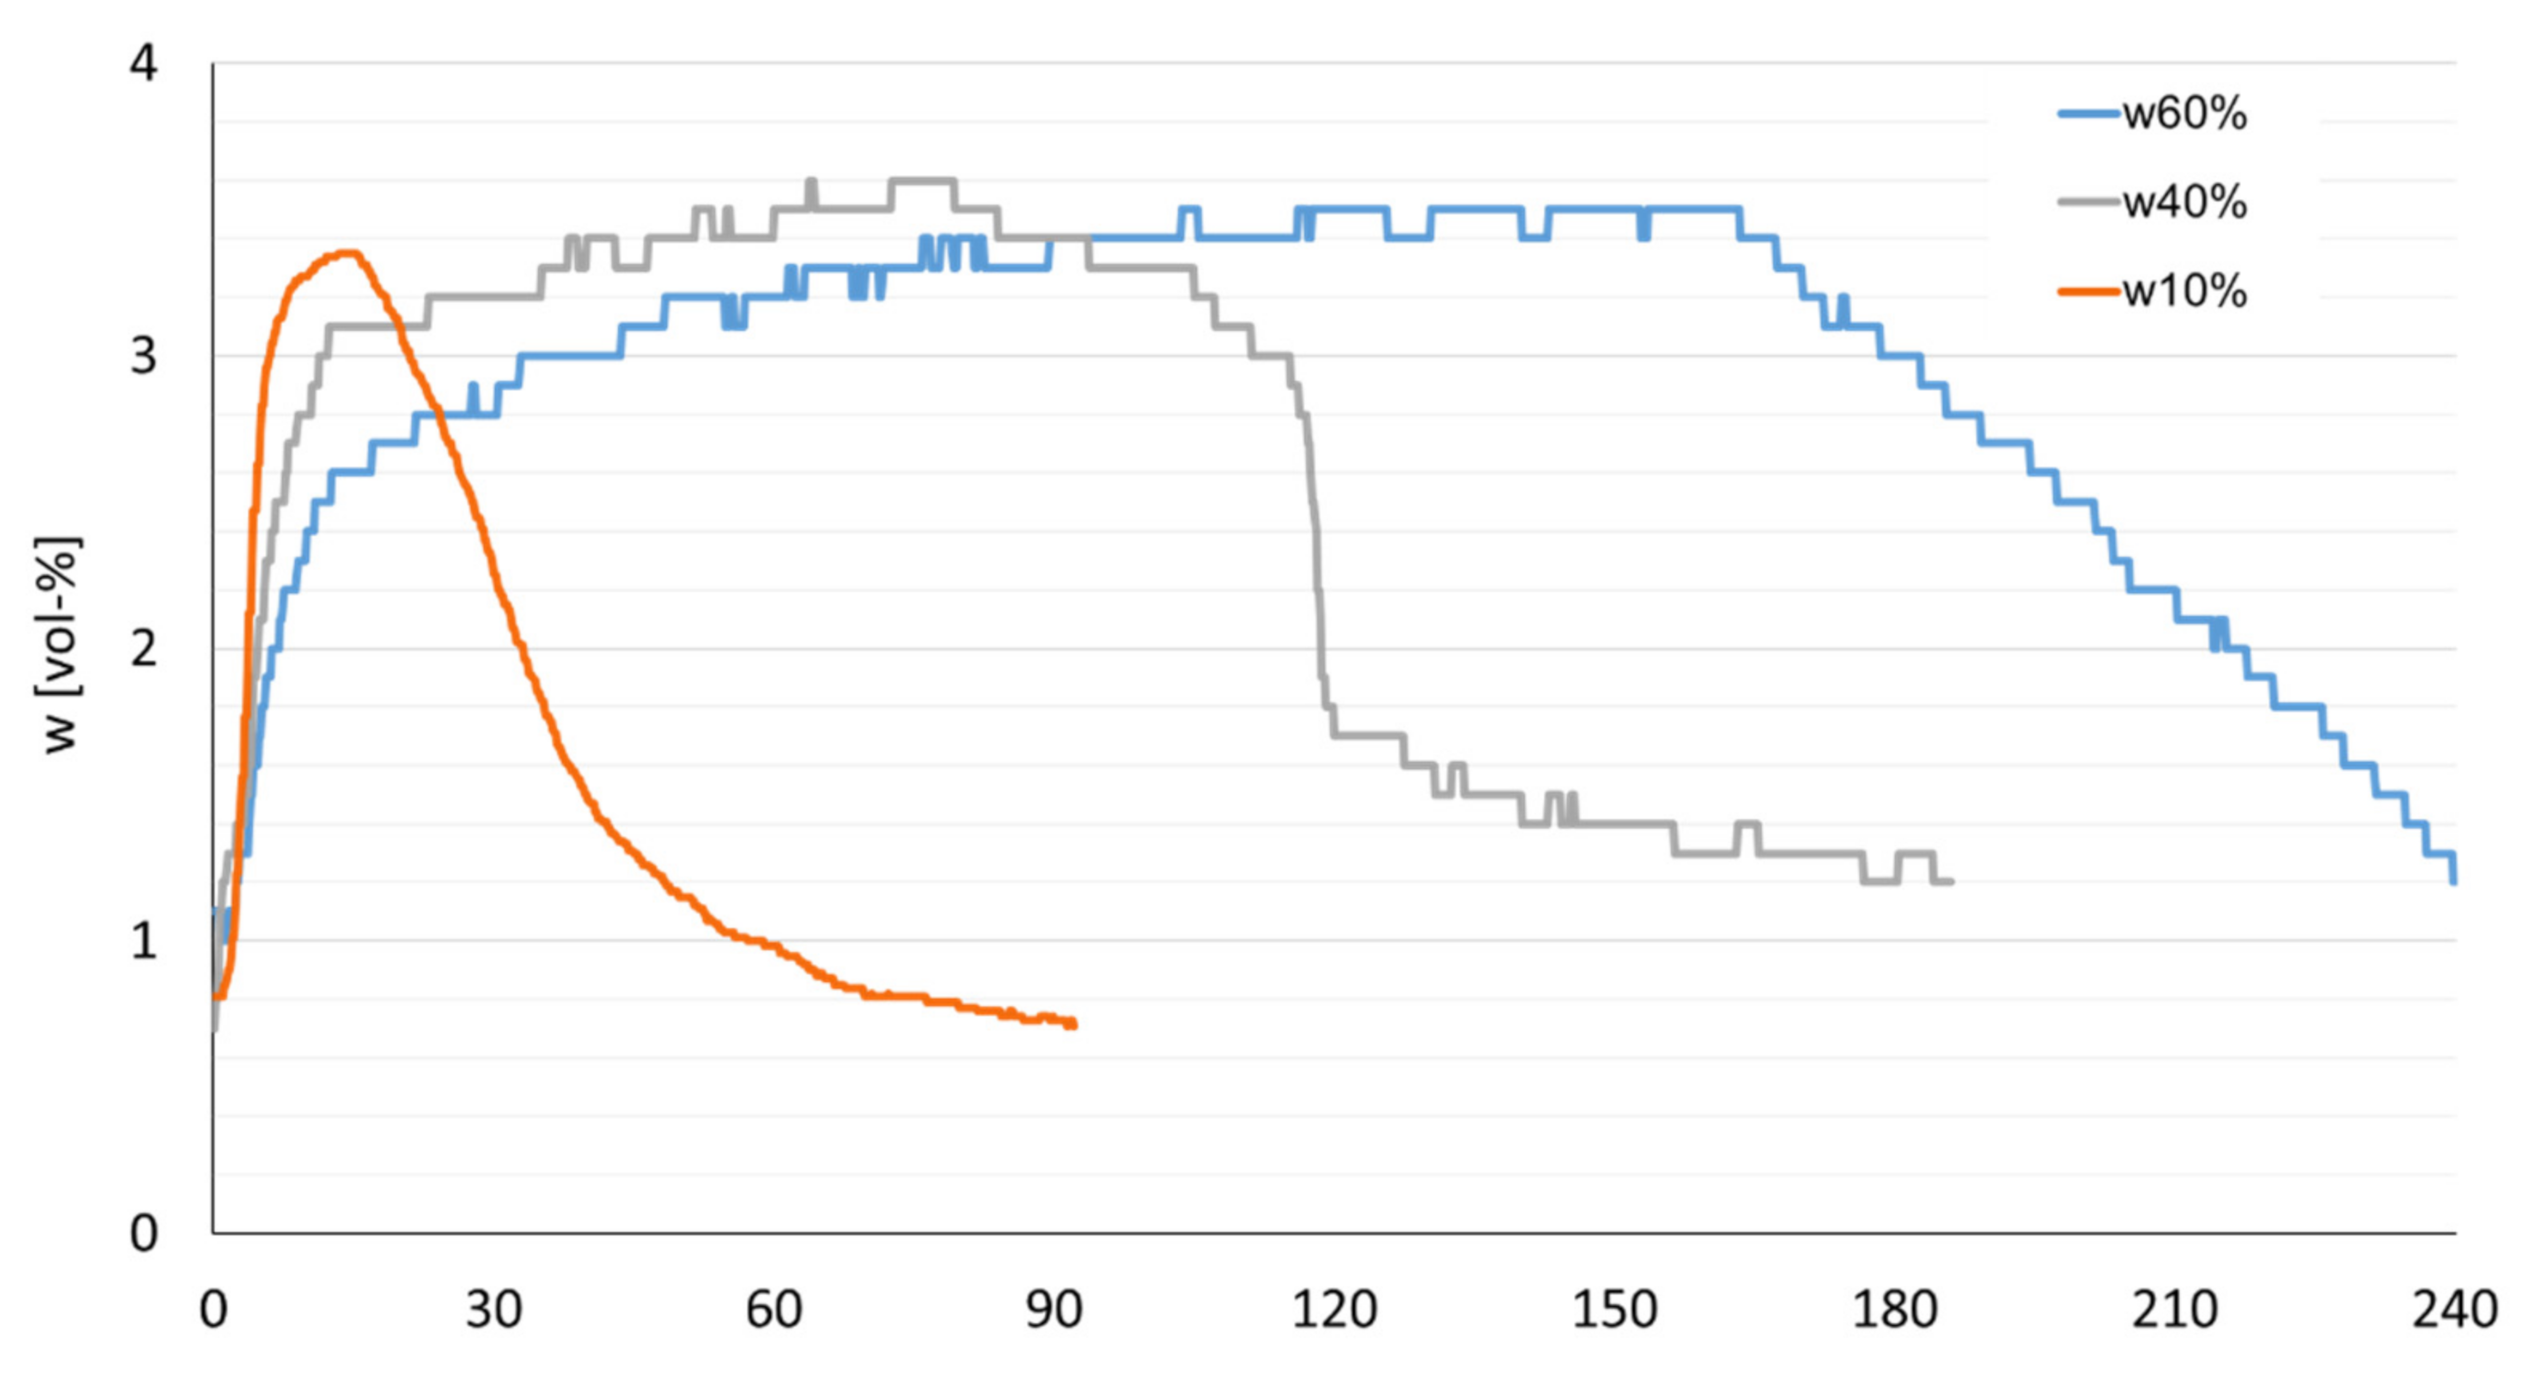
In a further series of tests, specific properties of individual bulk goods were manipulated in a targeted manner. For example, the water content or the fine fraction of a bed of wood chips was varied and measured on the test stand. Figure 7 shows the results from a test run with the water content of wood chips varying from 10%, over 40% and up to 60%, clearly influencing the drying process. Most significantly, this enhances the duration of the drying process.
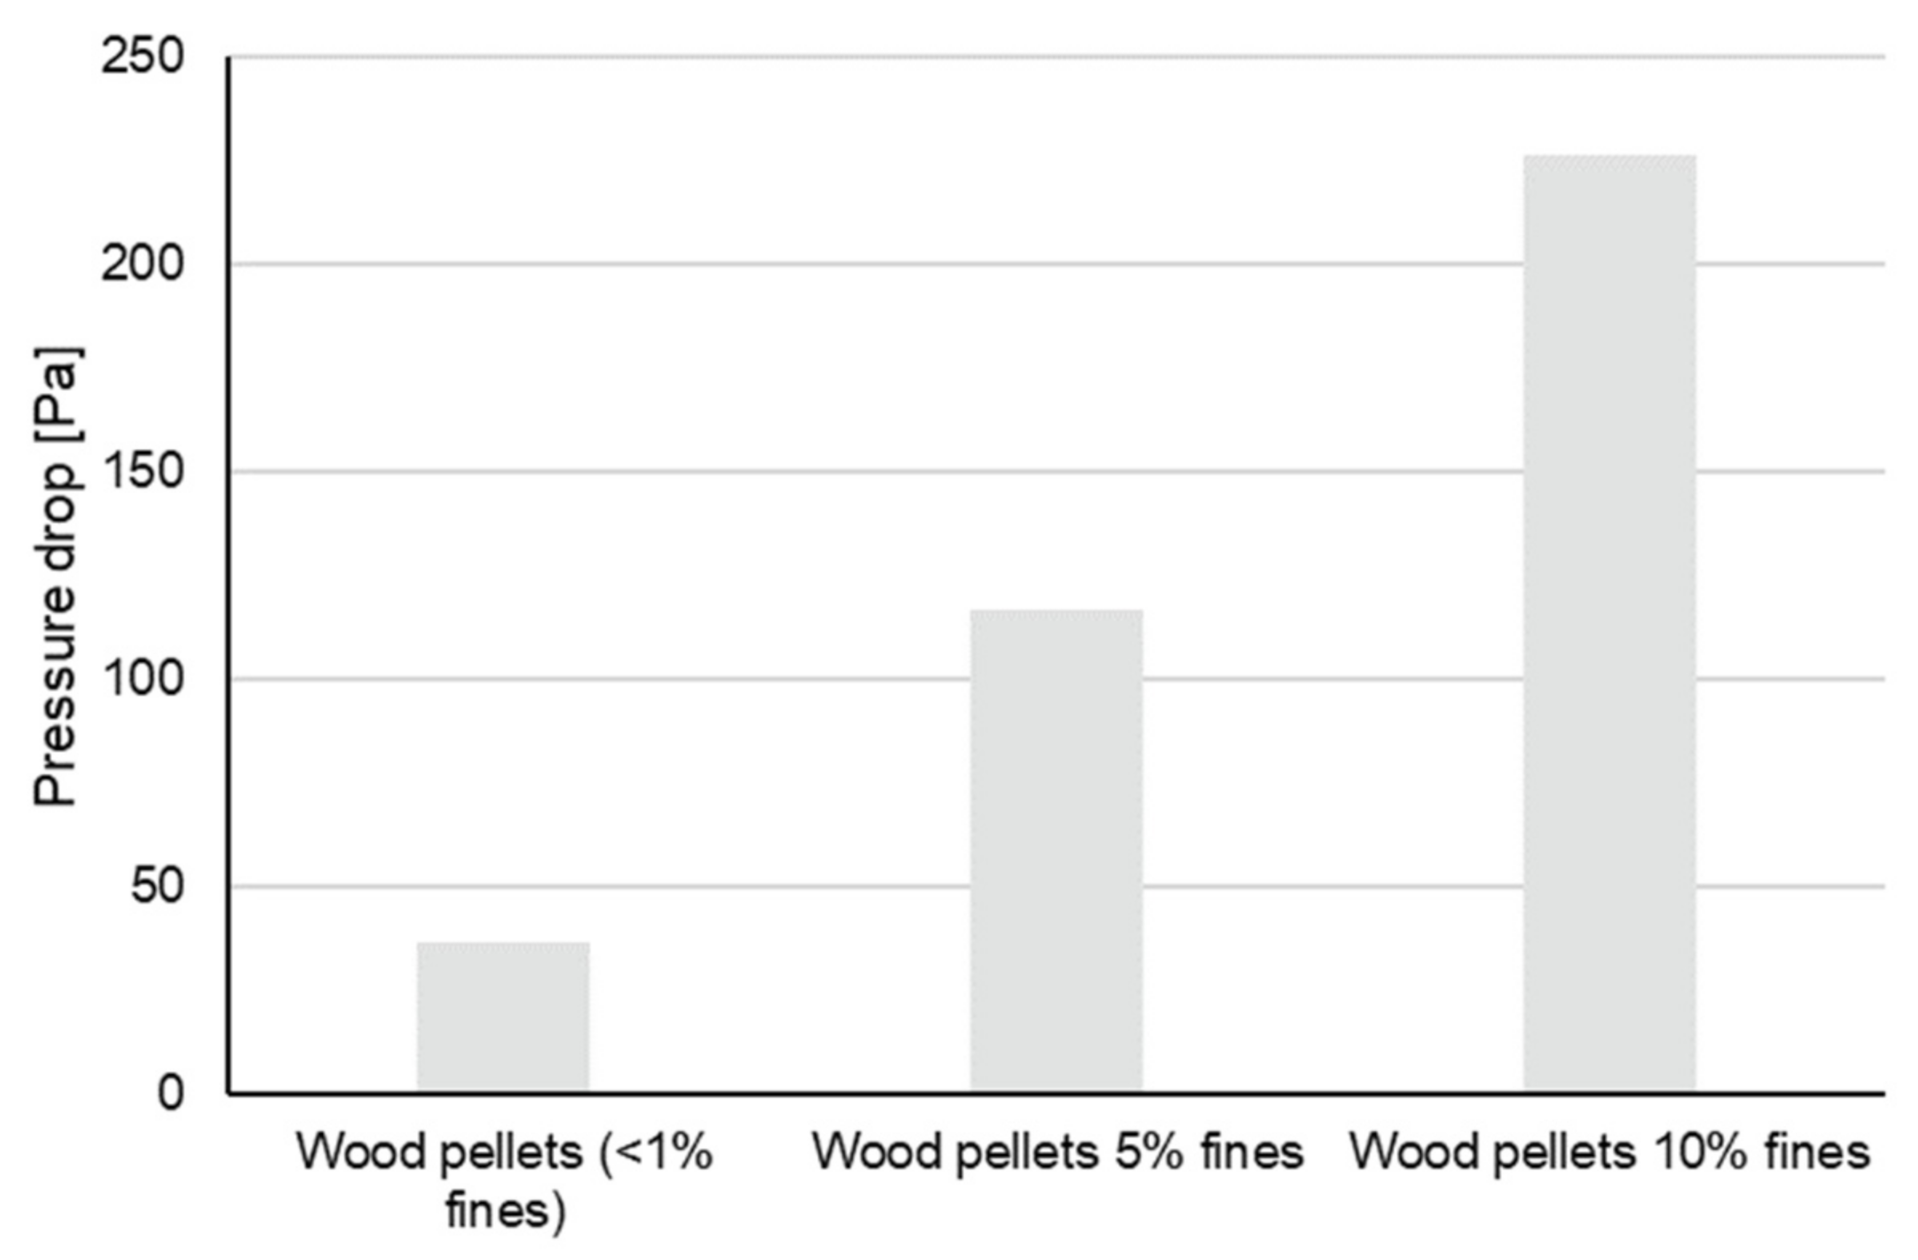
The following graphic (Figure 8) shows the pressure drop that occurs over a bulk of wood pellets with different proportions of fine particles. Three test points were chosen, and complete test runs with two or three repetitions each were carried out. At each test point, fines (particle size smaller 3.15 mm) were added once to the sieved, standardized pellets, with a guaranteed fines content of less than 1%. One test point was a mixture with 10% of fines, one with 5% of fines and another test point was the standardized pellets, to which no further fine particles were added. As expected, the pressure drop increased with a higher fines content (Table 3). The pressure drop set in quickly after the start of the experiment and remained largely constant in all experiments.
3.3. Energy and Mass Balance as a Basis for Data Evaluation
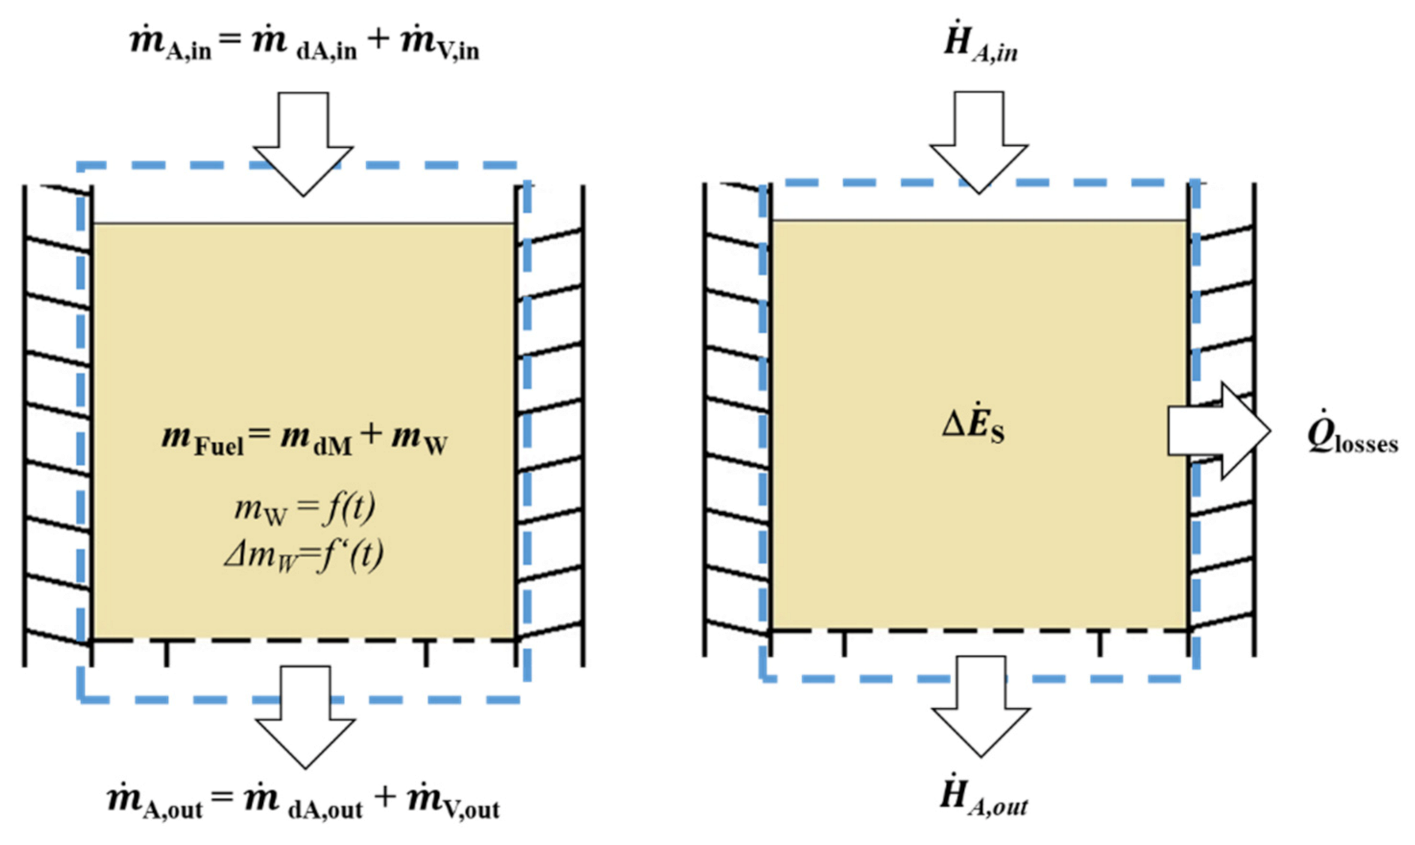
The energy and mass balance are the basis for an analytical evaluation of the data in terms of fuel detection. A corresponding evaluation is shown here, using the example of the calculation of the drying rate. The mass and energy balance are described with the following formulas and Figure 9.
The following applies to the balance of the incoming and outgoing mass flows
The following applies to the mass balance
The following simplifications or assumptions are applied:
It follows that
With a known volume flow and a known volume fraction of the water vapor in the output flow, the mass flow of the water from the fuel is calculated according to the equation
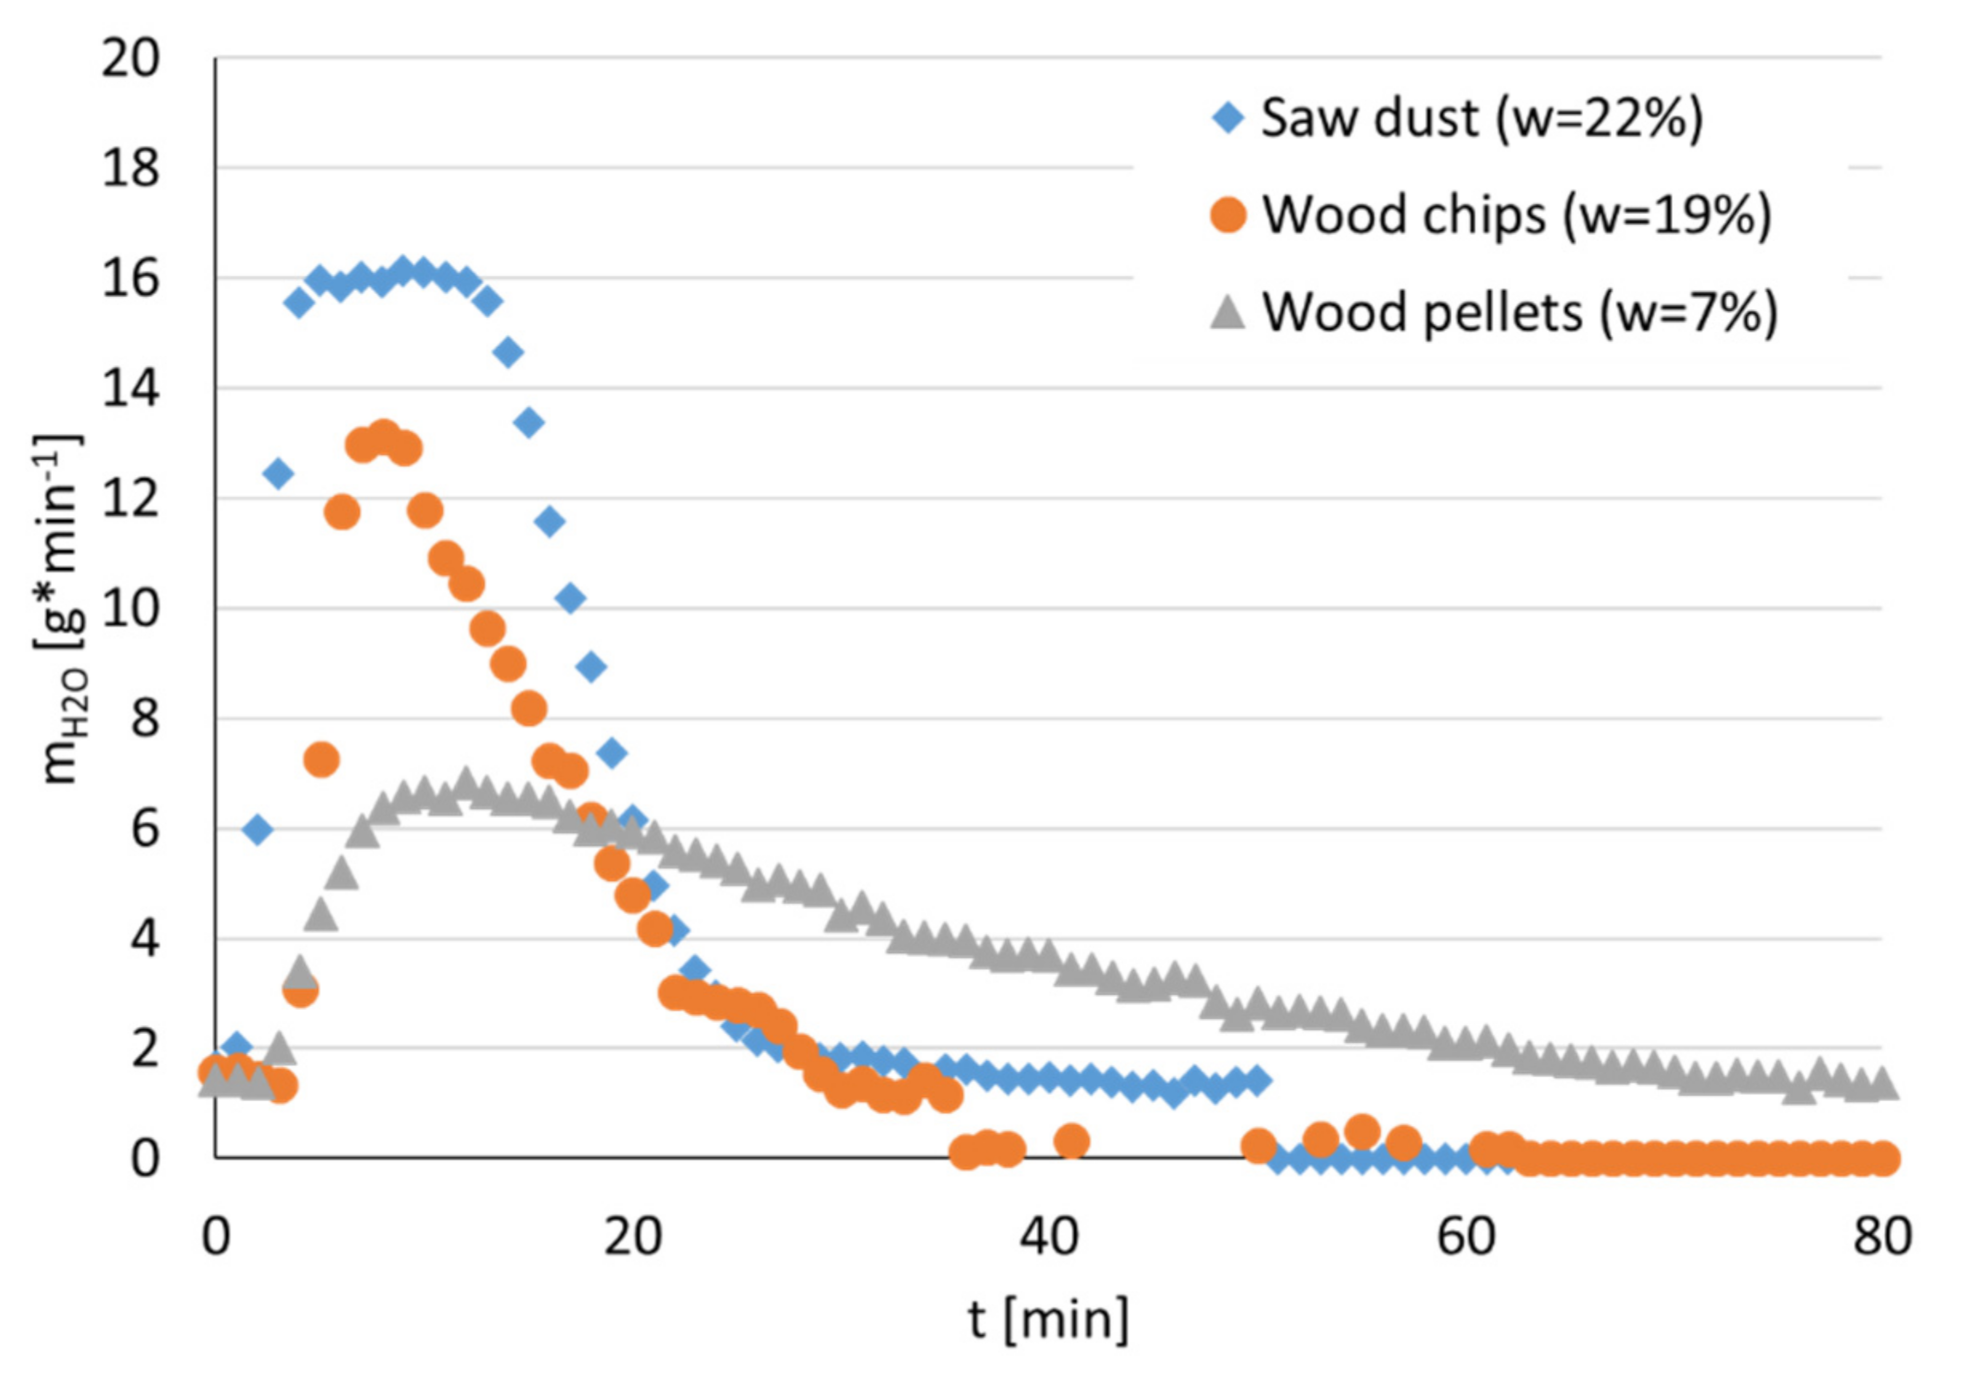
Based on this, it is possible to calculate the drying rate, i.e., the proportion of water evaporated from the fuel as a function of time. The results for an experiment with wood pellets, wood chips and sawdust are shown below (Figure 10).
4. Discussion
The experiments presented in the article are the basis for the development of a sensor module, with the aim of achieving the online detection of fuels or fuel properties. For this purpose, a defined test program was performed and the first datasets were generated. The data are the basis for the evaluation of the feasibility and the conceptual design of a later prototype and its software.
In a screening, different fuels were examined and compared with common fuel analyses from the laboratory. The results show that it is possible to generate reproducible datasets from the test rig in the laboratory and to relate the variations or specific result functions to fuel properties. It is shown that the pressure drop is quickly available as a comparative variable and that particle sizes and particle size distribution have a significant influence. The measurement of the water content in the exhaust air is a further important element for this, which enables an analytical evaluation of the water content, in particular by back calculation to the original water content. The temperature profiles are key to any analytical approach. Energy and mass balances enable indirect conclusions about different parameters, such as water content, as well as the mass or bulk density of the fuel.
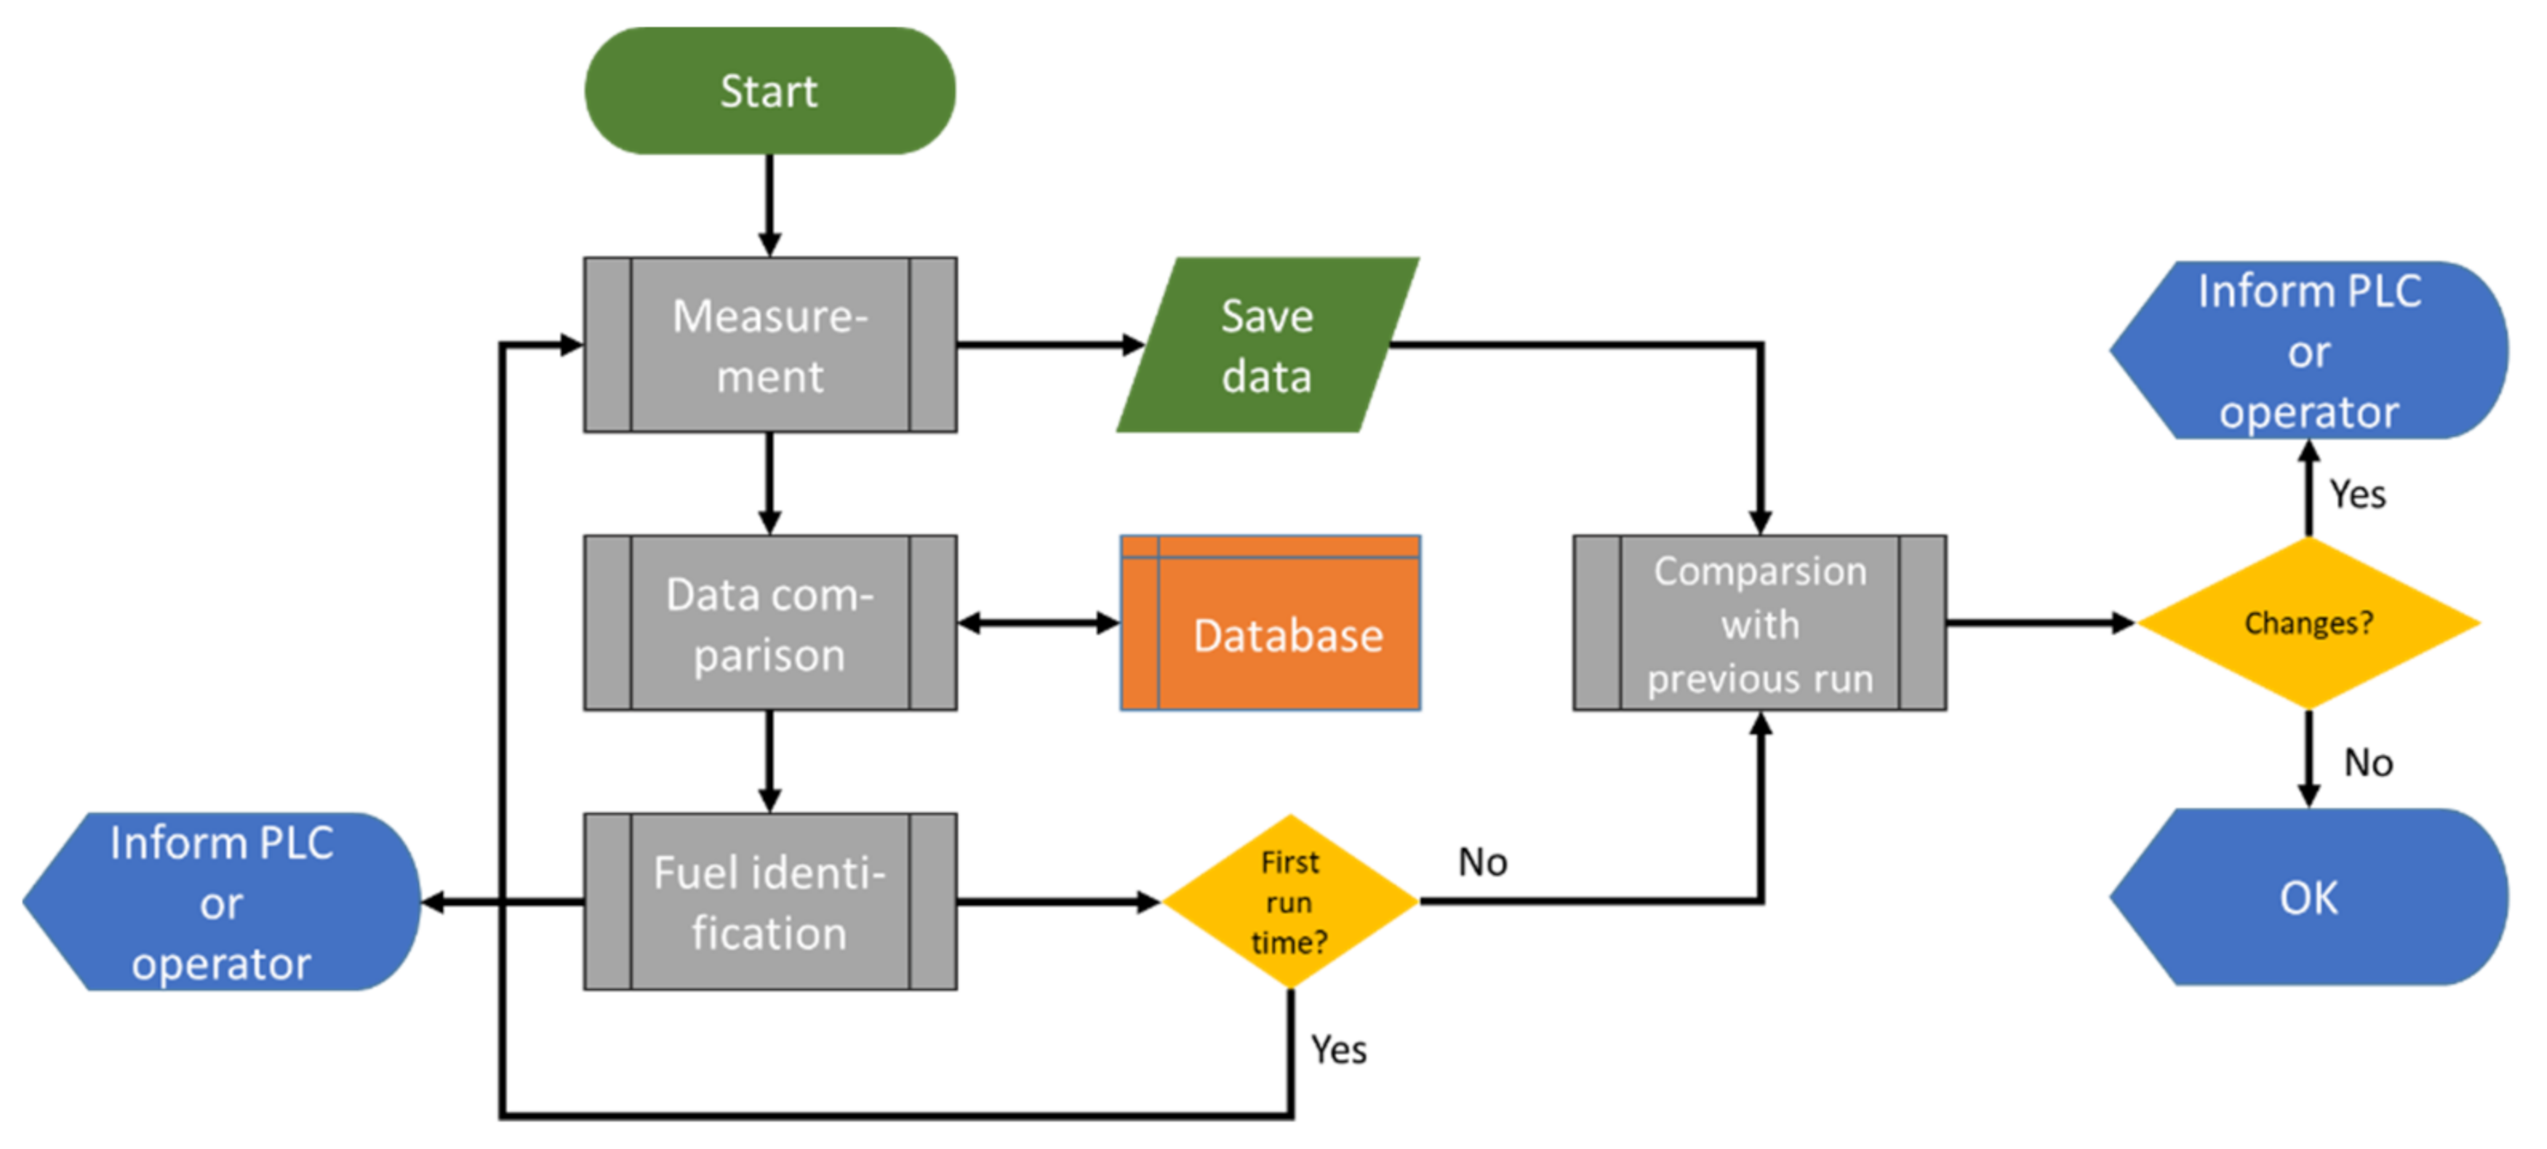
Based on these findings, concepts for the integration of the sensor module into the biomass furnace were developed. Figure 11 shows the schematic flow of a program that primarily relies on data-comparative methods. The data are collected via the sensor module and are compared with values from a database. The result is the assignment of the fuel to an existing dataset. This result is communicated to the control system. Furthermore, in another function, changes in quality over time are analyzed and communicated to the control system or the operator. The recorded data can also be transferred to the database with a further routine, and thus the database can be expanded and optimized step by step.
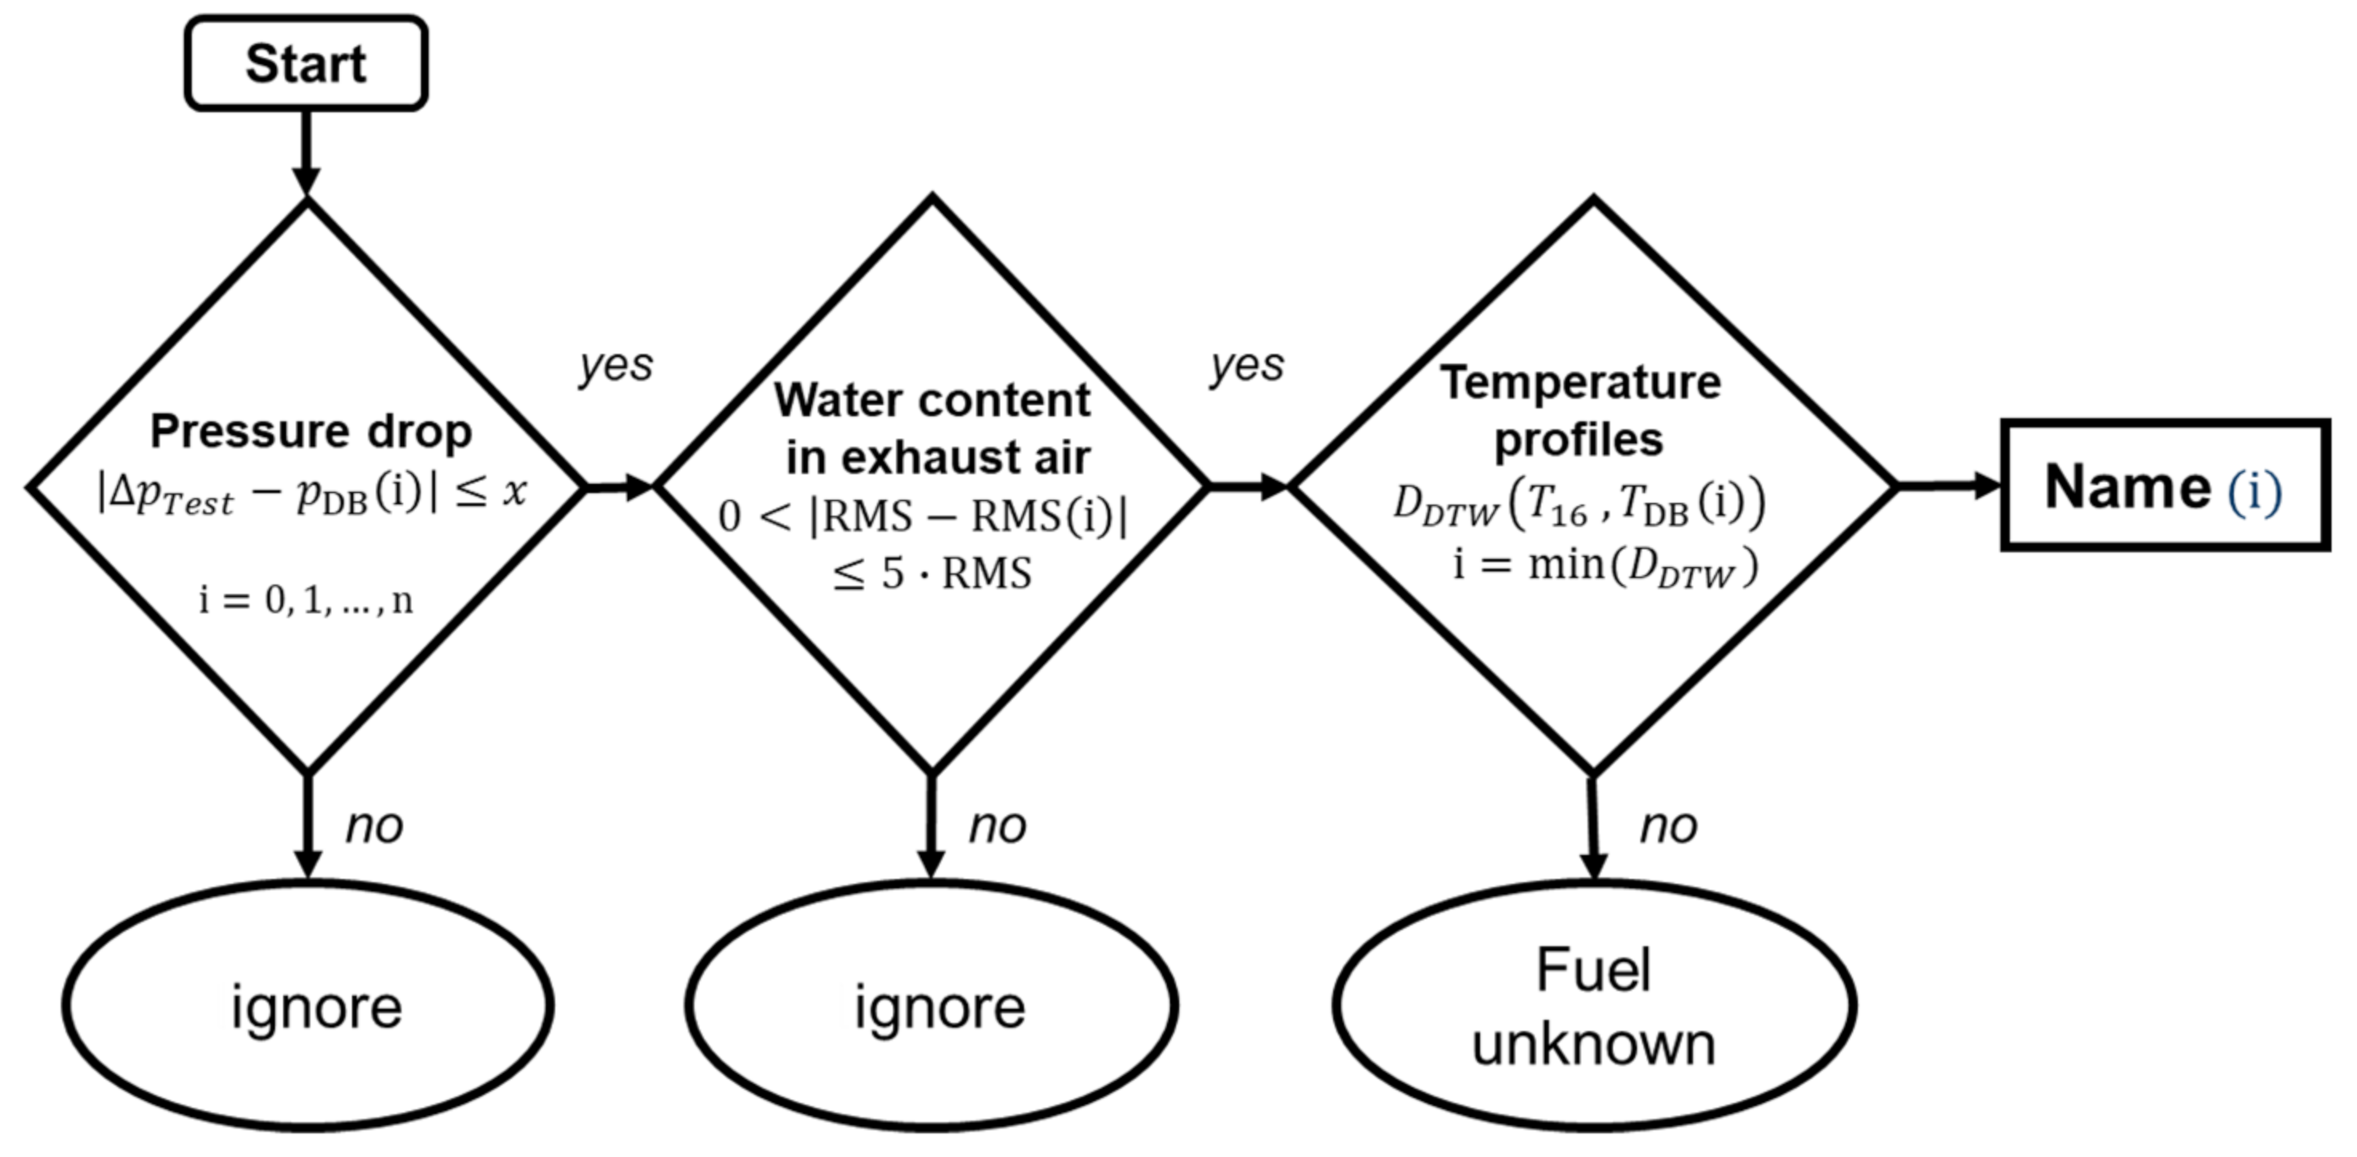
Based on the test results, reasonable methods were then sought to enable an evaluation from the test data. Figure 12 shows a possible approach in which the datasets in the database are compared with the measured values in a multi-step approach. In addition to just comparing individual parameters, methods for comparing time-based data functions such as the Root Mean Square (RMS) or Dynamic Time Warping (DTW) will be tested. This step-by-step matching would be a simple approach to enable the mapping of measurement data to an existing dataset. The next steps are the development of a software for automated evaluation, and the development and testing of a prototype and its integration to the firing system.
Of course, the new technology is also limited with regard to the boundary conditions. The duration of the drying process inhibits the speed of the measurement. The results obtained from the system must be available before the fuel is fed into the combustion zone. A sufficient time between measurement and entry of the fuel into the furnace is crucial. Thus, there is a trade-off with respect to the size of the sample. A larger sample allows for more accurate measurements of a polydisperse bulk, but drying takes even longer with larger samples. Against this background, approaches to optimize the measurement speed, for example, by increasing the temperatures, reducing the sample volume or limiting the measurement duration, are central aspects of future development.
5. Conclusions
The work presented in this paper demonstrates the basic feasibility of the idea of identifying fuel properties by means of convective drying. A test rig was set up on a laboratory scale and datasets of different feedstocks were recorded and evaluated. This new type of sensor system would allow biomass furnaces and power plants to proactively intervene in the process to avoid critical situations in the future. For example, it would enable plants to adjust the speed of fuel input, the amount of combustion air or the speed of grate motion in such a way that optimized operation is possible. This would enable a more fuel flexible operation in existing plants. This will contribute to the better utilization of the existing potentials in the field of biogenic solid fuels. The concept is also interesting for other processes, like gasification or pyrolysis, or could be part of the fuel quality management process. With regard to further advances, the next steps are the development and testing of an automated evaluation software. Furthermore, a prototype is currently being built and tested on a pilot plant.
6. Patents
Patent pending. German patent application: 10 2020 124 544.0.
Author Contributions
Idea, conceptualization, methodology and writing, M.M.; review and editing, R.D. and J.O.; project administration, J.O. and M.M.; software and data curation, M.M.; supervision, A.H. All authors have read and agreed to the published version of the manuscript.
Funding
Parts of this research was funded by the Federal Ministry of Food and Agriculture, grant number FKZ 22039618.
Institutional Review Board Statement
Not applicable.
Informed Consent Statement
Not applicable.
Data Availability Statement
All relevant data displayed in publication.
Acknowledgments
We would like to thank the Federal Ministry of Food and Agriculture for funding and all partners from project Digital Fire for the good cooperation. We also like to thank Vadim Schulz, Sylvester Zangl and Christian Kutter for their good work.
Conflicts of Interest
The authors declare no conflict of interest.
Nomenclature
| Abbreviations | |
| a | Ash content (%) |
| DTW | Dynamic Time Warping |
| LHV | Lower Heating Value (MJ·kg−1) |
| NIR | Near infrared (spectroscopy) |
| p | Pressure (Pa) |
| PIR | Pressure Indicator and Recorder |
| QIR | Quantity Indicator and Recorder |
| RDF | Refuse Derived Fuel |
| RMS | Root Mean Square |
| TIR | Temperature Indicator and Recorder |
| w | Water content (%) |
| Subscripts | |
| A | Air |
| d | dry |
| dA | dry Air |
| dm | dry matter |
| in | Input |
| out | Output |
| V | Vapour |
| w | Water |
References
- Jenkins, B.M.; Baxter, L.L.; Miles, T.R. Combustion properties of biomass. Fuel Process. Technol. 1998, 54, 17–46. [Google Scholar] [CrossRef]
- Kuptz, D.; Schreiber, K.; Schulmeyer, F.; Lesche, S.; Zeng, T.; Ahrens, F.; Zelinski, V.; Schön, C.; Pollex, A.; Borchert, H. Evaluation of combined screening and drying steps for the improvement of the fuel quality of forest residue wood chips—results from six case studies. Biomass Convers. Bioref. 2019, 9, 83–98. [Google Scholar] [CrossRef]
- TFZ Bayern. Handbuch zum Qualitätsmanagement von Holzhackschnitzeln. Available online: https://www.tfz.bayern.de/mam/cms08/festbrennstoffe/dateien/fo_projekt_brennstoff-qualifizierung_und_qualit%C3%A4tsmanagement_in_der_hackschnitzelproduktion.pdf (accessed on 11 March 2021).
- DIN EN ISO 17225-4 Solid Biofuels—Fuel Specifications and Classes—Part 4: Graded Wood Chips (ISO 17225-4:2014); German Version EN ISO 17225-4:2014 STANDARD by DIN-Adopted European-Adopted ISO Standard. Available online: https://www.iso.org/obp/ui/#iso:std:iso:17225:-4:ed-1:v1:en (accessed on 2 March 2021).
- Nurek, T.; Gendek, A.; Roman, K.; Dombrowska, M. The effect of temperature and moisture on the chosen parameters of briquettes made of shredded logging residues. Biomass Bioenergy 2019, 130. [Google Scholar] [CrossRef]
- Nurek, T.; Gendek, A.; Roman, K.; Dombrowska, M. The Impact of Fractional Composition on the Mechanical Properties of Agglomerated Logging Residues. Sustainability 2020, 12, 6120. [Google Scholar] [CrossRef]
- Gaderer, M.H. Thermische Nutzung von Biomasse und Reststoffen in Deutschland. Chem. Ing. Tech. 2011, 83, 1897–1911. [Google Scholar] [CrossRef] [Green Version]
- Di Sarli, V.; Cammarota, F.; Salzano, E. Explosion parameters of wood chip-derived syngas in air. J. Loss Prev. Process Ind. 2014, 32, 399–403. [Google Scholar] [CrossRef]
- Puttkamer, T. Charakterisierung Biogener Festbrennstoffe. Ph.D. Thesis, Universität Stuttgart, Stuttgart, Germany, 2015. [Google Scholar]
- Widder, T.; Beckmann, M. Identifizierung Problematischer Brennstoffkomponenten Mittels Feuerungsmodell mit Nichtlinearer Optimierung; Deutschen Flammentag: Bochum, Deutschland, 2019. [Google Scholar]
- Widder, T.; Pohl, M.; Wen, T.; Woite, M.; Vogeler, M.; Beckmann, M. Modellbasierte Betriebsdatenanalyse für das Anlagenmonitoring im Biomasse-HKW Ilmenau. Kraftwerkstechnik 2019-Power Plant Technology; SAXONIA Standortentwicklungs-und-verwaltungsgesellschaft mbH: Freiberg, Germany, 2019. [Google Scholar]
- Striūgas, N.; Vorotinskienė, L.; Paulauskas, R.; Navakas, R.; Džiugys, A.; Narbutas, L. Estimating the fuel moisture content to control the reciprocating grate furnace firing wet woody biomass. Energy Convers. Manag. 2017, 149, 937–949. [Google Scholar] [CrossRef]
- Lange, F. Online-Identifikation von Brennstoffen und Ihren Kalorischen Eigenschaften Beim Betrieb Einer Stationären Wirbelschichtfeuerungsanlage. Ph.D. Thesis, Universität Rostock, Rostock, Germany, 2007. [Google Scholar]
- Zwiellehner, M.; Warnecke, R.; Weghaus, M.; Müller, V. Kopplung Einer Modernen Feuerungsregelung Mit Einem Modellbasierten System. Available online: https://www.combustioncontrol.biz/publikationen/publi_VDI-WF-Korr-08-FLR%20und%20CombAte.pdf (accessed on 26 February 2021).
- Warnecke, R.; Weghaus, M.; Zwiellehner, M.; Dannerbeck, F. Einsatz eines Feuerungsmodells zum Klimaschutz durch Effizienzsteigerung und Emissionsminderung in Rostanlagen mit heterogenen Brennstoffen, EU 22776, Final Report. Available online: https://www.gks-sw.de/images/forschungsberichte/efre-schlussbericht/EFRE-Feuerungsregelung-Schlussbericht-130531-Final.pdf (accessed on 11 March 2021).
- Madlsperger, W. 2009, DE102007055168A1. Available online: https://depatisnet.dpma.de/DepatisNet/depatisnet?action=bibdat&docid=DE102007055168A1 (accessed on 2 March 2021).
- Fabinski, W. 1997, DE 19547258 A1. Available online: https://depatisnet.dpma.de/DepatisNet/depatisnet?action=bibdat&docid=DE000019547258A1 (accessed on 2 March 2021).
- Dübenhofer, P. 1999, DE 199 17 572 A1/EP000001046861A1. Available online: https://depatisnet.dpma.de/DepatisNet/depatisnet?action=bibdat&docid=DE000019917572A1 (accessed on 2 March 2021).
- Brem, G. 2000, WO002000075569A1/WO002002046661A1. Available online: https://depatisnet.dpma.de/DepatisNet/depatisnet?action=bibdat&docid=WO002000075569A1 (accessed on 2 March 2021).
- Baier, G.; Gasch, A.; Vogel, A. 1994, DE 4446022A1. Available online: https://depatisnet.dpma.de/DepatisNet/depatisnet?action=bibdat&docid=DE000004446022A1 (accessed on 2 March 2021).
- Maggale, A. 2017, AT000000015458U1. Available online: https://depatisnet.dpma.de/DepatisNet/depatisnet?action=bibdat&docid=AT000000015458U1 (accessed on 2 March 2021).
- Barker, R. 2007, WO002008079319A2. Available online: https://depatisnet.dpma.de/DepatisNet/depatisnet?action=bibdat&docid=WO002008079319A2 (accessed on 2 March 2021).
- Krämer, P.; Flamme, S.; Gehrmann, H.-J.; Glorius, T. Entwicklungen zur Echtzeitanalytik von Ersatzbrennstoffen. In Energie aus Abfall, Band 13; TK Verlag Karl Thomé-Kozmiensky: Neuruppin, Germany, 2016; Available online: https://www.vivis.de/wp-content/uploads/EaA13/2016_EaA_439-458_Kraemer (accessed on 9 March 2021).
- Lestander, A.; Rhen, C. Multivariate NIR spectroscopy models for moisture, ash and calorific content in biofuels using bi-orthogonal partial least squares. Analyst 2005. [Google Scholar] [CrossRef] [PubMed]
- Nyström, J.; Dahlquist, E. Methods for determination of moisture content in woodchips for power plants—A review. Fuel 2004, 83, 773–779. [Google Scholar] [CrossRef]
- Sensortech Systems Inc. Available online: http://sensortech.com/instruments/nir-6000/ (accessed on 23 July 2018).
- APOS GmbH. Available online: https://www.apos.biz/de/produkte/wood-reception/receivingopt-ba/ (accessed on 9 April 2021).
- APOS GmbH. Available online: https://www.apos.biz/de/produkte/process-application/apos-boilercontrol/ (accessed on 9 April 2021).
- Ropp, J.; Stäger, T.; Röthlisberger, R. XyloChips—Continuous Measurement of Woodchips Energy Content; Holzenergie-Symposium Netzintegration; Vorschriften und Feuerungstechnik: Zürich, Switzerland, 2018. [Google Scholar]
Figure 1.
Test rig (schematic setup (a), dimensions (b), picture (c)).

Figure 2.
Deployed feedstocks (a) alumina oxide spheres, (b) wood chips, (c) residues from forestry, (d) corn cobs, (e) wood pellets, (f) saw dust and (g) biochar.
Figure 2.
Deployed feedstocks (a) alumina oxide spheres, (b) wood chips, (c) residues from forestry, (d) corn cobs, (e) wood pellets, (f) saw dust and (g) biochar.

Figure 3.
Pressure drop over time for saw dust (a) and biochar (b).

Figure 4.
Pressure drop over time for alumina oxide spheres (a), wood pellets (b), wood chips (c), corn cobs (d) and residues from forestry (e).
Figure 4.
Pressure drop over time for alumina oxide spheres (a), wood pellets (b), wood chips (c), corn cobs (d) and residues from forestry (e).


Figure 5.
First evaluation of pressure drop and average particle size.

Figure 6.
Temperature difference between the top and the end of the bulk for alumina oxide (a), biochar (b), wood pellets (c), corn cobs (d), saw dust (e) and residues from forestry (f).
Figure 6.
Temperature difference between the top and the end of the bulk for alumina oxide (a), biochar (b), wood pellets (c), corn cobs (d), saw dust (e) and residues from forestry (f).


Figure 7.
Water content in the exhaust air over time for wood chips with different water contents varying from 10% to 60%.
Figure 7.
Water content in the exhaust air over time for wood chips with different water contents varying from 10% to 60%.

Figure 8.
Pressure drop for test runs with different fines contents.

Figure 9.
Scheme of mass and energy balance.

Figure 10.
Calculated drying velocity for different fuels.

Figure 11.
Conceptual schematic process flow chart diagram.

Figure 12.
Proposal for a method for data-based fuel detection.


Table 1.
Results of fuel characterization in the laboratory.
| Sample | w [%] 1 | a [%] 2 | LHV [MJ·kg−1] 3 | C [%] 4 | H [%] 4 | N [%] 4 | S [%] 4 | O [%] 4 |
|---|---|---|---|---|---|---|---|---|
| Wood pellets | 7.2 | 0.27 | 16.951 | 47.27 | 6.62 | 0.05 | 0.06 | 45.73 |
| Saw dust | 7.43 | 0.39 | 16.212 | 46.29 | 6.48 | 0.7 | 0.06 | 46.08 |
| Wood chips | 10.54 | 0.62 | 15.894 | 45.18 | 6.12 | 0.18 | 0.03 | 47.87 |
| Forestry residues | 44.4 | 2.08 | 10.989 | 42.01 | 5.69 | 0.35 | 0.06 | 49.81 |
| Corn cobs | 6.87 | 2.25 | 15.181 | 45.02 | 6.37 | 0.64 | 0.11 | 45.61 |
| Biochar | 0.93 | 41.44 | 17.542 | 48.46 | 1.86 | 1.78 | 0.29 | 6.17 |
1 DIN EN ISO 18134-2 2 DIN EN ISO 18122 3 DIN 51900-1; 4 DIN 51732.
Table 2.
Results of fuel characterization in the laboratory.
| Particle Size 1 and Bulk Density 2 | Ø [mm] | Particles <3.15 mm [%] | Particles >45 mm [%] | Bulk Density 2 [kg·m−3] |
|---|---|---|---|---|
| Wood pellets | 6.26 | 0.2 | 0 | 648.07 |
| Saw dust | 1.84 | 81.74 | 0 | 150.15 |
| Wood chips | 9.84 | 11.13 | 0 | 173.5 |
| Forestry residues | 17.94 | 10.98 | 10.58 | 210.96 |
| Corn cobs | 19.74 | 8.48 | 3.37 | 122.34 |
| Biochar | 4.67 | 17 | 0 | 631.48 |
| Alumina oxide spheres | 9.7 | 0 | 0 | 2032.26 |
1 DIN EN ISO 17827-1 2 DIN EN 15103.
Table 3.
Results of fuel characterization in the laboratory.
| Sample | Δpmax [Pa] |
|---|---|
| Wood pellets | 36.6 |
| Wood pellets 5% fines | 116.3 |
| Wood pellets 10% fines | 226.2 |
Publisher’s Note: MDPI stays neutral with regard to jurisdictional claims in published maps and institutional affiliations. |
© 2021 by the authors. Licensee MDPI, Basel, Switzerland. This article is an open access article distributed under the terms and conditions of the Creative Commons Attribution (CC BY) license (https://creativecommons.org/licenses/by/4.0/).
Share and Cite
MDPI and ACS Style
Meiller, M.; Oischinger, J.; Daschner, R.; Hornung, A. Development of a New Sensor Module for an Enhanced Fuel Flexible Operation of Biomass Boilers. Processes 2021, 9, 661. https://0-doi-org.brum.beds.ac.uk/10.3390/pr9040661
AMA Style
Meiller M, Oischinger J, Daschner R, Hornung A. Development of a New Sensor Module for an Enhanced Fuel Flexible Operation of Biomass Boilers. Processes. 2021; 9(4):661. https://0-doi-org.brum.beds.ac.uk/10.3390/pr9040661
Chicago/Turabian StyleMeiller, Martin, Jürgen Oischinger, Robert Daschner, and Andreas Hornung. 2021. "Development of a New Sensor Module for an Enhanced Fuel Flexible Operation of Biomass Boilers" Processes 9, no. 4: 661. https://0-doi-org.brum.beds.ac.uk/10.3390/pr9040661
Note that from the first issue of 2016, this journal uses article numbers instead of page numbers. See further details here.