
Effect of Heat Resource Effectiveness Change on Rice Potential Yield in Southern China


1
College of Forestry, Jiangxi Agricultural University, Nanchang 330045, China
2
College of Resources and Environmental Sciences, China Agricultural University, Beijing 100193, China
3
Hebei Meteorological Disaster Prevention Center, Shijiazhuang 050021, China
4
Jiangxi Agricultural Meteorological Center, Nanchang 330096, China
*
Author to whom correspondence should be addressed.
Processes 2021, 9(5), 896; https://0-doi-org.brum.beds.ac.uk/10.3390/pr9050896
Submission received: 4 March 2021
/
Revised: 12 May 2021
/
Accepted: 15 May 2021
/
Published: 19 May 2021
(This article belongs to the Special Issue Processing and Properties Analysis of Grain Foods)
Abstract
:During the rice growing season, farmers’ decisions about cropping systems and seed varieties directly affect the utilization of heat resource, and eventually affect the potential yield. In this study, we used the hourly accumulated temperature model to calculate the available heat resource as well as the effective heat resource in southern China. We conducted a spatiotemporal analysis of the heat resource effectiveness during rice growing season and an impact assessment of heat resource effectiveness on rice potential yield and cereal yield reduction. The results showed that, during the period of 1951–2015, heat resource effectiveness generally declined in the rice cropping area of southern China. And this decrease worsened during the most recent three decades compared with the period of 1951–1980. A strong correlation was detected between heat resource effectiveness and rice potential yield in the study area. When the effective heat resource during the growing season increased by 1 °C·d, rice potential yield would increase by 14 kg ha−1. For each percentage increase in heat resource effectiveness, the rice potential yield reduction rate would go down by 0.65%. This agro-climatological study aims to offer a scientific basis for rice production decisions in southern China, such as when to plant, which varieties to choose and so on.
1. Introduction
Rice is one of the three main food crops in China. China’s rice yield accounts for 30% of the total global rice yield. The fluctuations of rice yield in China affect the national or even global food security. Against the background of climate change, such impact could be amplified by the changes in effective heat resources during the rice growing period.
Heat resources (temperature, herein unless otherwise specified) plays a major role in the geological distribution of crops [1,2,3,4]. Given sufficient available water, the heat resource determines the crop mixture structure and seed variety allocation [5,6], crop growing season length [7,8], and eventually the potential yield [9]. Conversely, farming decisions of crop mixture, cropping system, and seed varieties could affect the utilization of heat resource during the crop growing season.
Previous scholars had discovered a clear relationship between crop development and thermal time [7,10,11,12,13]. The application of thermal time has been widely used to predict crop phenology [14,15,16,17,18,19,20] and crop yield [21,22,23] in crop models. Recently, the application of thermal time has been expanded to evaluate the effective heat resource during the crop growing season. The spatiotemporal analyses on the effective heat resources for different crops in different regions of China have been reported. Nevertheless, those studies did not consider the effect of temperatures greater than the upper threshold beyond which temperatures accelerate crop growth or crop development. Similar to the temperatures less than the lower threshold of crop growth requirement, temperatures greater than the upper threshold of crop growth requirement are useless or even detrimental to crop development [24]. Therefore, some researchers came up with three-point temperatures to measure the effective temperature for crop development, and further recognized that only temperatures greater than the lower threshold and less than the upper threshold of crop growth requirement are seen as effective [25,26]. The ratio of accumulated effective temperature to accumulated available temperature is defined as the accumulated temperature effectiveness and is used to quantify the effectiveness of the heat resource [27]. In addition, the ratio of heat resource effectiveness has been used to analyze the effect of temperature change on crop yield [28].
In China, three different methods are primarily used to calculate the accumulated effective temperature during the growing season: (a) the average temperature-based method [26,29,30,31,32], (b) the adjusted maximum and minimum temperatures method [33,34,35,36]; and (c) the hourly temperature-based method [37]. Jiang and Wen (2013) have pointed out that the hourly temperature-based method is more accurate than the others [38]. In this study, we used the hourly temperature-based method to calculate the available and effective heat resources during rice growing season in the rice cropping area of southern China. We investigated the spatiotemporal characteristics of heat resource effectiveness in the southern rice cropping area and further discussed the relationships between heat resource effectiveness and rice potential yield, as well as grain yield reduction rate. This study aims to offer scientific support for the optimal cropping system arrangement in the rice cropping area of southern China.
2. Materials and Methods
2.1. Study Region and Data
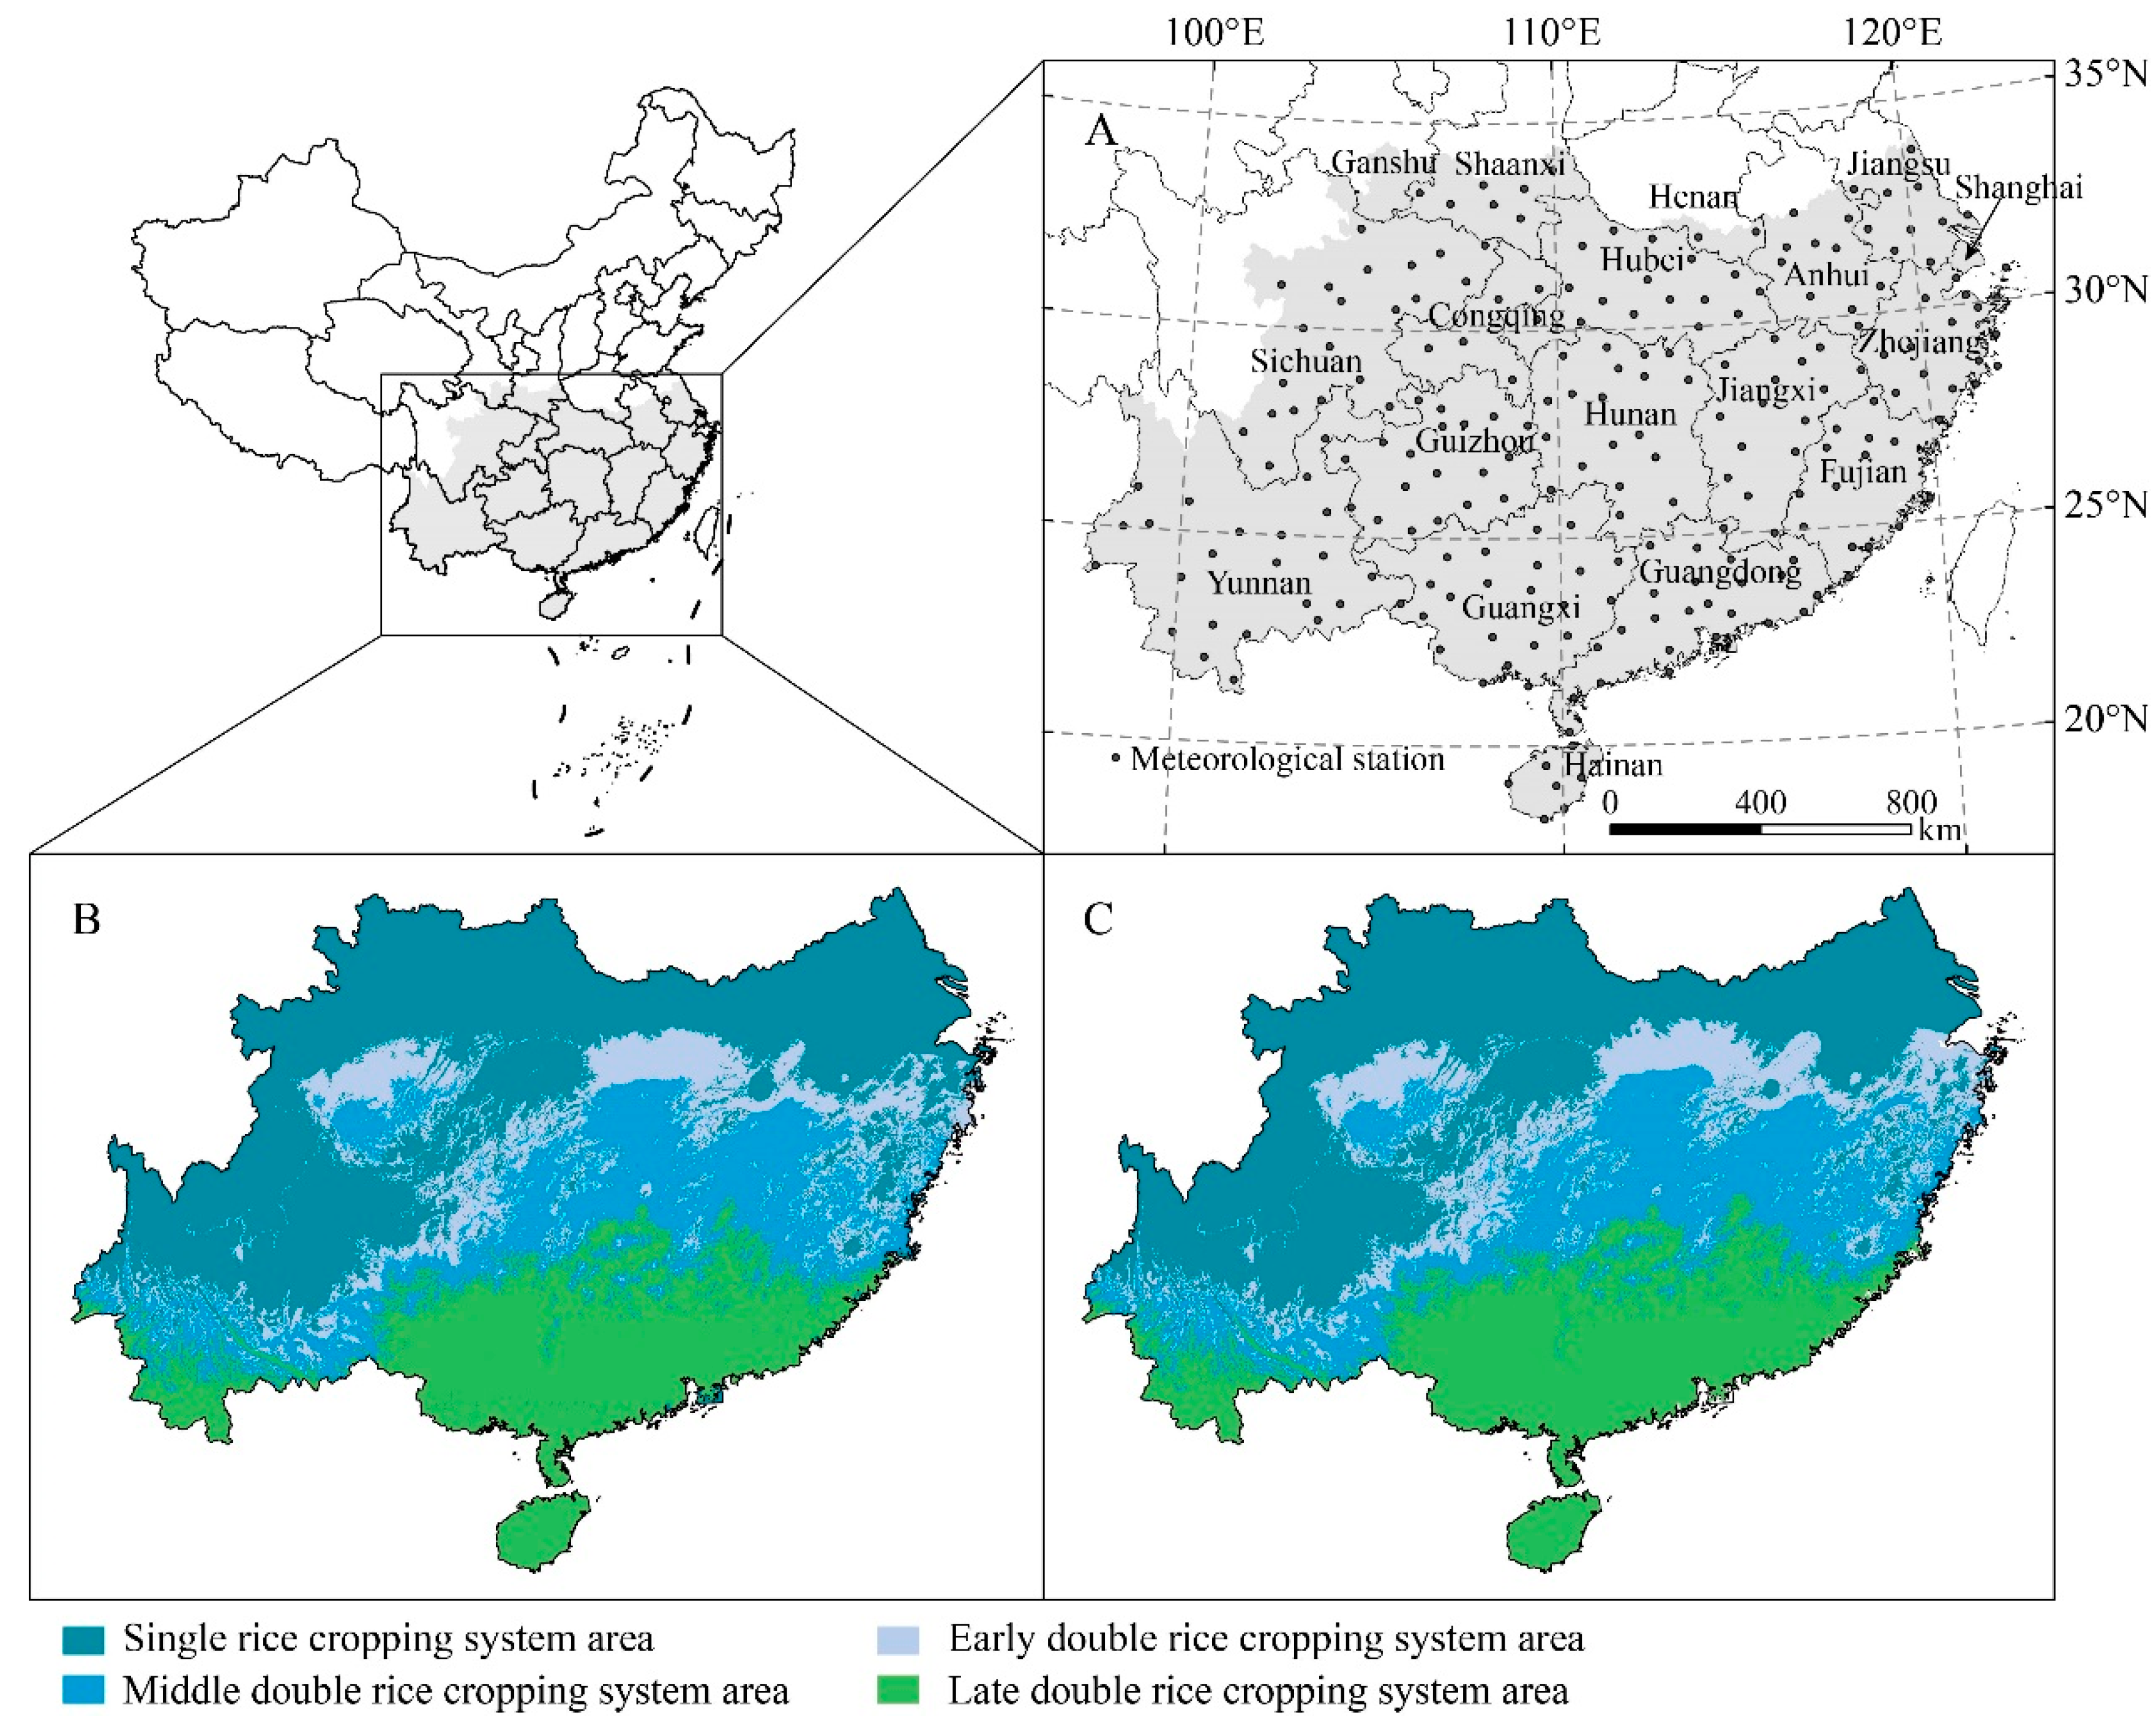
In this study, the research area is southern China (99°–123° E and 18°–34° N) where national rice production is concentrated. The boundaries of the research area followed the suggestions in Liu and Han [39], where natural resources (e.g., terrain factors, radiation and water resources), socio-economic conditions, agricultural background (e.g., crop varieties, crop mixtures, and maturity types), and the integrity of county-level administrative divisions were taken into consideration. In the research area, rice-based cropping systems include double-cropping systems rotated with middle rice and winter wheat and triple-cropping systems rotated with early or middle rice and winter wheat or rape. The regional paddy land area accounts for 83.52% of the national paddy land area [40]. Within the regional area, the double-cropping system accounts for 66% of the paddy land area, and produces 61.3% of the national rice grain yield [41]. Therefore, improved understanding of the effects of temperature change on rice grain yields and production for multiple rice-based cropping systems in southern China is critically important for the country’s food security.
According to [42], the study area can be further divided into four sub-regions: single rice-cropping system (SRCS), early double rice-cropping system (EDRCS), middle double rice-cropping system (MDRCS) and late double rice-cropping system (LDRCS) (Figure 1B,C), and rice varieties for the four main rice-based cropping systems are shown in Table 1. The division of these sub-regions is based on cropping suitability for different rice-based cropping systems from a climatological perspective [43].
The historical climate data from 1951 to 2015 for 254 meteorological stations (Figure 1) were obtained through the China Meteorological Science Data Sharing Service (http://cdc.cma.gov.cn, accessed on 8 March 2018), including atmospheric pressure, maximum, minimum, and average temperatures, relative humidity, precipitation, wind speed, and sunshine hours. The crop phenology data are acquired from China Meteorological Bureau agricultural meteorological observations (http://cdc.cma.gov.cn, accessed on 8 March 2018).
2.2. Determination of Rice Growing Season
According to [44,45], we divided the entire rice growing season into three stages: early stage (from sowing to booting), middle stage (from booting to flowering), and late stage (from flowering to maturity). The climatic-ecological model proposed by Gao, et al. [46] was adopted to calculate potential growing season length for different rice varieties during the two periods of 1951–1980 and 1981–2015 (Table 2). For early and middle maturity rice varieties, the sowing date was specified as the date when the possibility of average daily temperature equal to or greater than 10 °C reached 80%. For late maturity rice varieties, sowing date (the beginning date of seedling) was specified as 30 days earlier than the maturity date of early maturity rice varieties, and transplanting date was specified as 5 days (typical time needed for harvest activities) after the maturity of early maturity rice varieties. The maturity date was also calculated based on the climatic-ecological model. As suggested by FAO [44], we used the mean phenology stage length during the period of 1981–2015 to interpolate the booting and heading dates. The mean phenology dates for different rice cropping systems during the two study periods of 1951–1980 and 1981–2015 are presented in Table 3.
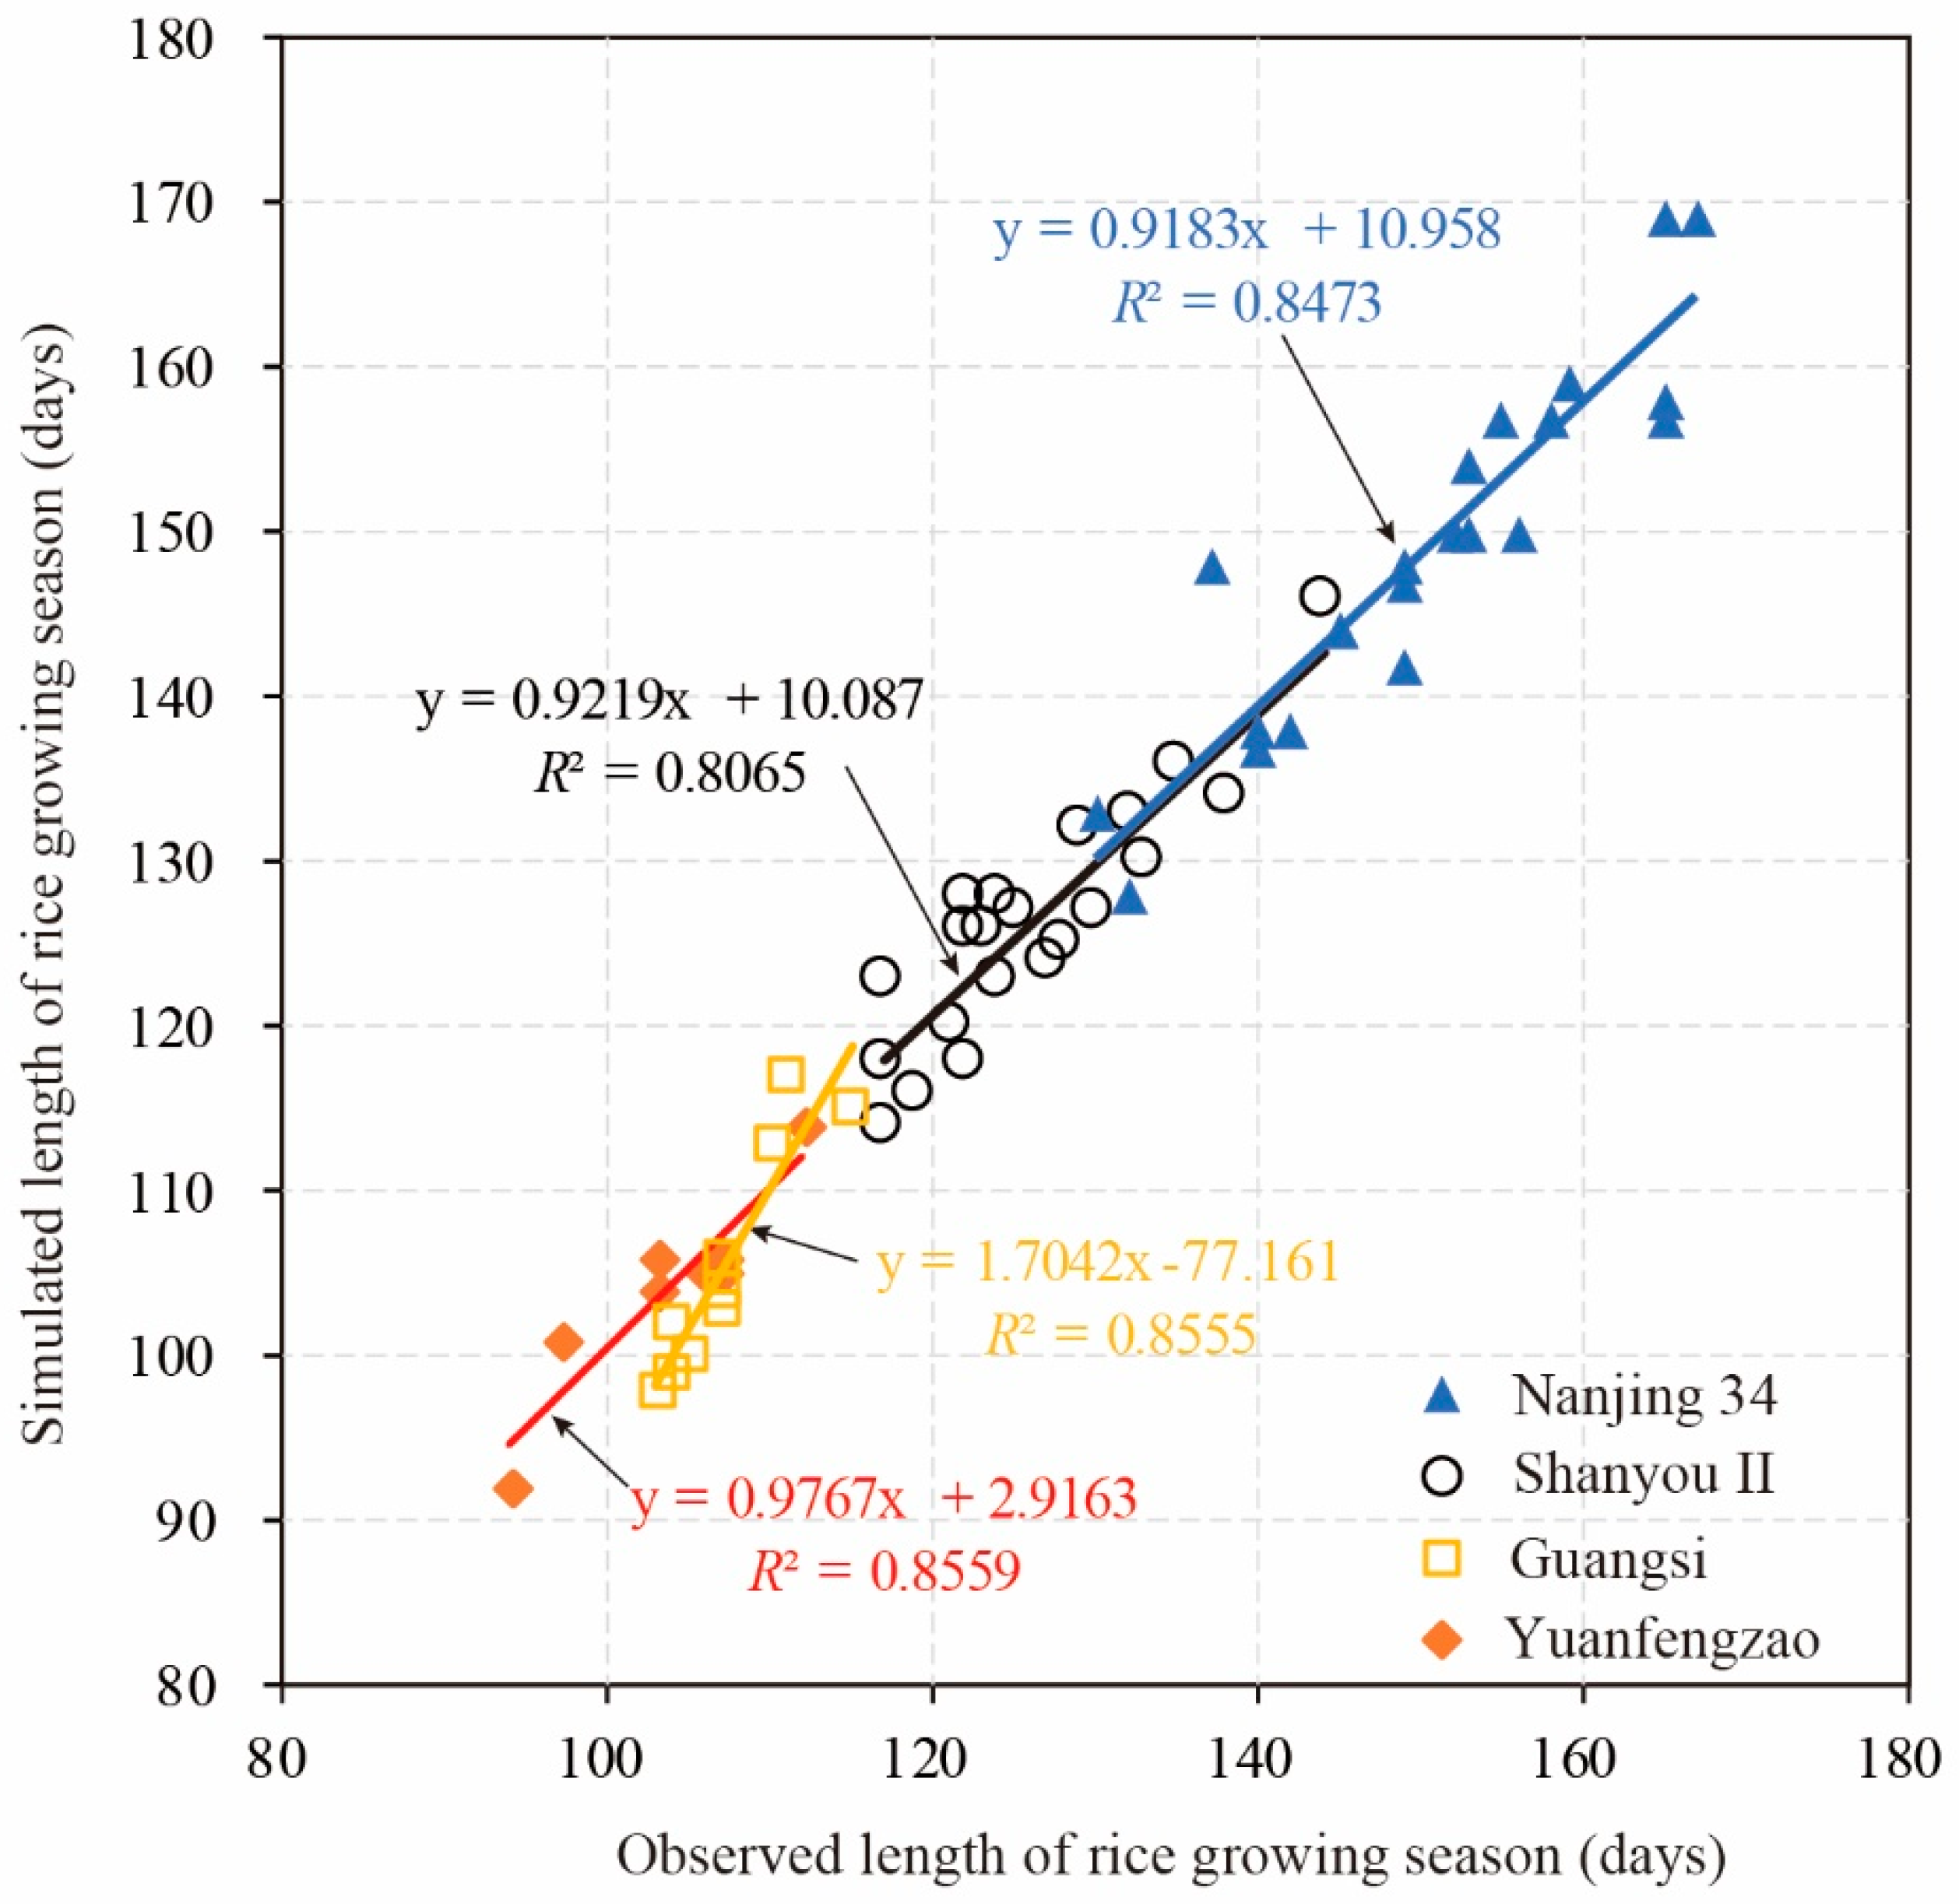
In the crop model, the potential growing season length for the four representative cultivars was calibrated based on the actual crop phenology data from China Meteorological Bureau agricultural meteorological observations. The validation results show that the correlation coefficient (R2) between the observed and simulated growing season length was greater than 0.80 for all four representative rice cultivars (Figure 2).
2.3. Available Heat Resources (AHR)
Temperatures below the lower threshold of crop growth requirement can be detrimental [47,48]; likewise temperatures above the upper threshold of crop growth requirement can be detrimental [23,49,50]. In this study, we used the lower threshold of 10 °C, and the upper threshold of 35 °C to evaluate the heat resources during the rice growing season [51,52,53]. The calculation equations are
where DHi is the available heat resource in the ith hour of a day (°C·h); Ti is the average temperature (°C); Tb is the lower threshold (°C); Tu is the upper threshold (°C); DD is the available heat resource in the day (°C·d); GDD is the available heat resource during the growing season (°C·d); and n is the number of days in the growing season (unitless).
2.4. Effective Heat Resource (EHR)
The effective heat resource is defined as the accumulated temperatures that are above the lower threshold of crop growth [32,54,55,56,57]. It has been pointed out that rice growth rate is exponentially related to the daily mean temperature [53,58]. The response of growth rate to hourly temperature can be described by the bilinear model [59]. Hodges [60] found that daily mean temperature between base and optimum temperature has a positive relationship with the crop growth rate, while temperature between optimum temperature and upper threshold has a negative relationship with the crop growth rate. This implies that the effectiveness of temperature to crop growth varies among different ranges. Based on the “cardinal” temperature theory, we modified the effective temperature model brought up by Bouman et al. (2001) [61] as below:
where EHRi is the EHR for the ith hour (°C·h); DEHR is the daily EHR (°C·d); Tob is the lower range of the optimum temperature (°C); Tou is the upper range of the optimum temperature (°C); Ti is the average temperature for the ith hour (°C); Tu is the upper threshold (°C); Tb is the lower threshold (°C); GEHR is the sum of total growing season EHR for different rice cropping systems (°C·d); EHRijk is the EHR at the ith hour on the jth day at the kth crop stage; and n is the number of days in the growing season (unitless).
In Table 4, we present the three “cardinal” temperatures for different crop development stages of rice [24,51,52,62].
We calculated the hourly temperatures based on the daily minimum and maximum temperatures by using the method from Bouman, Kropff, Tuong, Wopereis, ten Berge and van Laar [61].
where Ti is the hourly mean temperature (°C); Tmax is the daily maximum temperature (°C); Tmin is the daily minimum temperature (°C); hi is the ith hour; hr is the sunrise time in a day; and hs is the sunset time in a day. The calculations for sunrise time and sunset time are cited from Allen, et al. [63].
2.5. Heat Resource Effectiveness (HRE)
The term “resource effectiveness” was coined by Liu and Zhong (1996) to indicate the effectiveness of environmental resources on crop development [64]. Furthermore, heat resource effectiveness was defined as the percentage ratio of actually utilized heat resource (effective heat resource) to available heat resource during the crop growing stages or the entire crop growing season [65]. By investigating heat resource effectiveness during the entire crop growing season, we could quantify the utilization of heat resource by the plants. Based on the investigation results, we can make better decisions about seed varieties, crop mixture, and farming management to make better use of the heat resource.
Heat resource effectiveness is the percentage ratio of effective heat resource to available heat resource (%). The HRE during growing season for a crop type can be calculated as:
where HRE is the heat resource effectiveness during the growing season (%); GDD is the total available heat resource during the growing season (°C·d); and GEHR is the total effective heat resource during the growing season (°C·d).
Without considering the blank time between different crops, the gross EHR of a cropping system is the sum of the EHR for all crops. The gross HRE (GHRE, %) for a cropping system can be calculated as:
where GEHRi is the total EHR for the ith crop during the growing season (°C·d); and GDDi is the total AHR for the ith crop during the growing season (°C·d).
2.6. Calculation of Rice Potential Yield and Yield Reduction Rate
Crop potential yield is the maximum yield when crops grow under an ideal environment, without any limitations in soil fertility farming technology, and it is solely determined by climate elements of solar radiation, temperature, and precipitation. In the research area, irrigation is typically used for rice production. Therefore, we define the crop potential yield without any water limitation. This is similar to the so-called photo-thermal potential [66,67,68]. The crop potential yield (YT) can be calculated as
where YP is the daily photosynthetic potential, kg ha–1; YT is the daily photo-thermal potential, kg ha–1; f(T) is the temperature correction coefficient and can be calculated with Equation (12); and is the total solar radiation during the growing season, MJ·m–2. The rest of the parameters are listed in Table 5 together with values from earlier studies [66,67,69,70].
Since the critical temperatures are different among the rice growing stages, the effects of temperature on crop development vary. And we use the equations below to revise the temperature thresholds for different crop development stages:
where f(T) is the temperature correction coefficient (unitless); T is the daily average temperature (°C); Tb is the lowest temperature (°C); Tu is the upper temperature limit (°C); Tob is the lower range of optimal temperature (°C); Tou is the upper range of optimal temperature (°C). In this study, critical temperatures for different rice growing stages (Table 4) are drawn from some previous studies [24,51,52,62].
The reduction rate of rice potential yield is calculated as:
where RPY is the reduction rate of crop potential yield (%).
3. Results
3.1. Temporal Variations in Major Heat Resource Indices
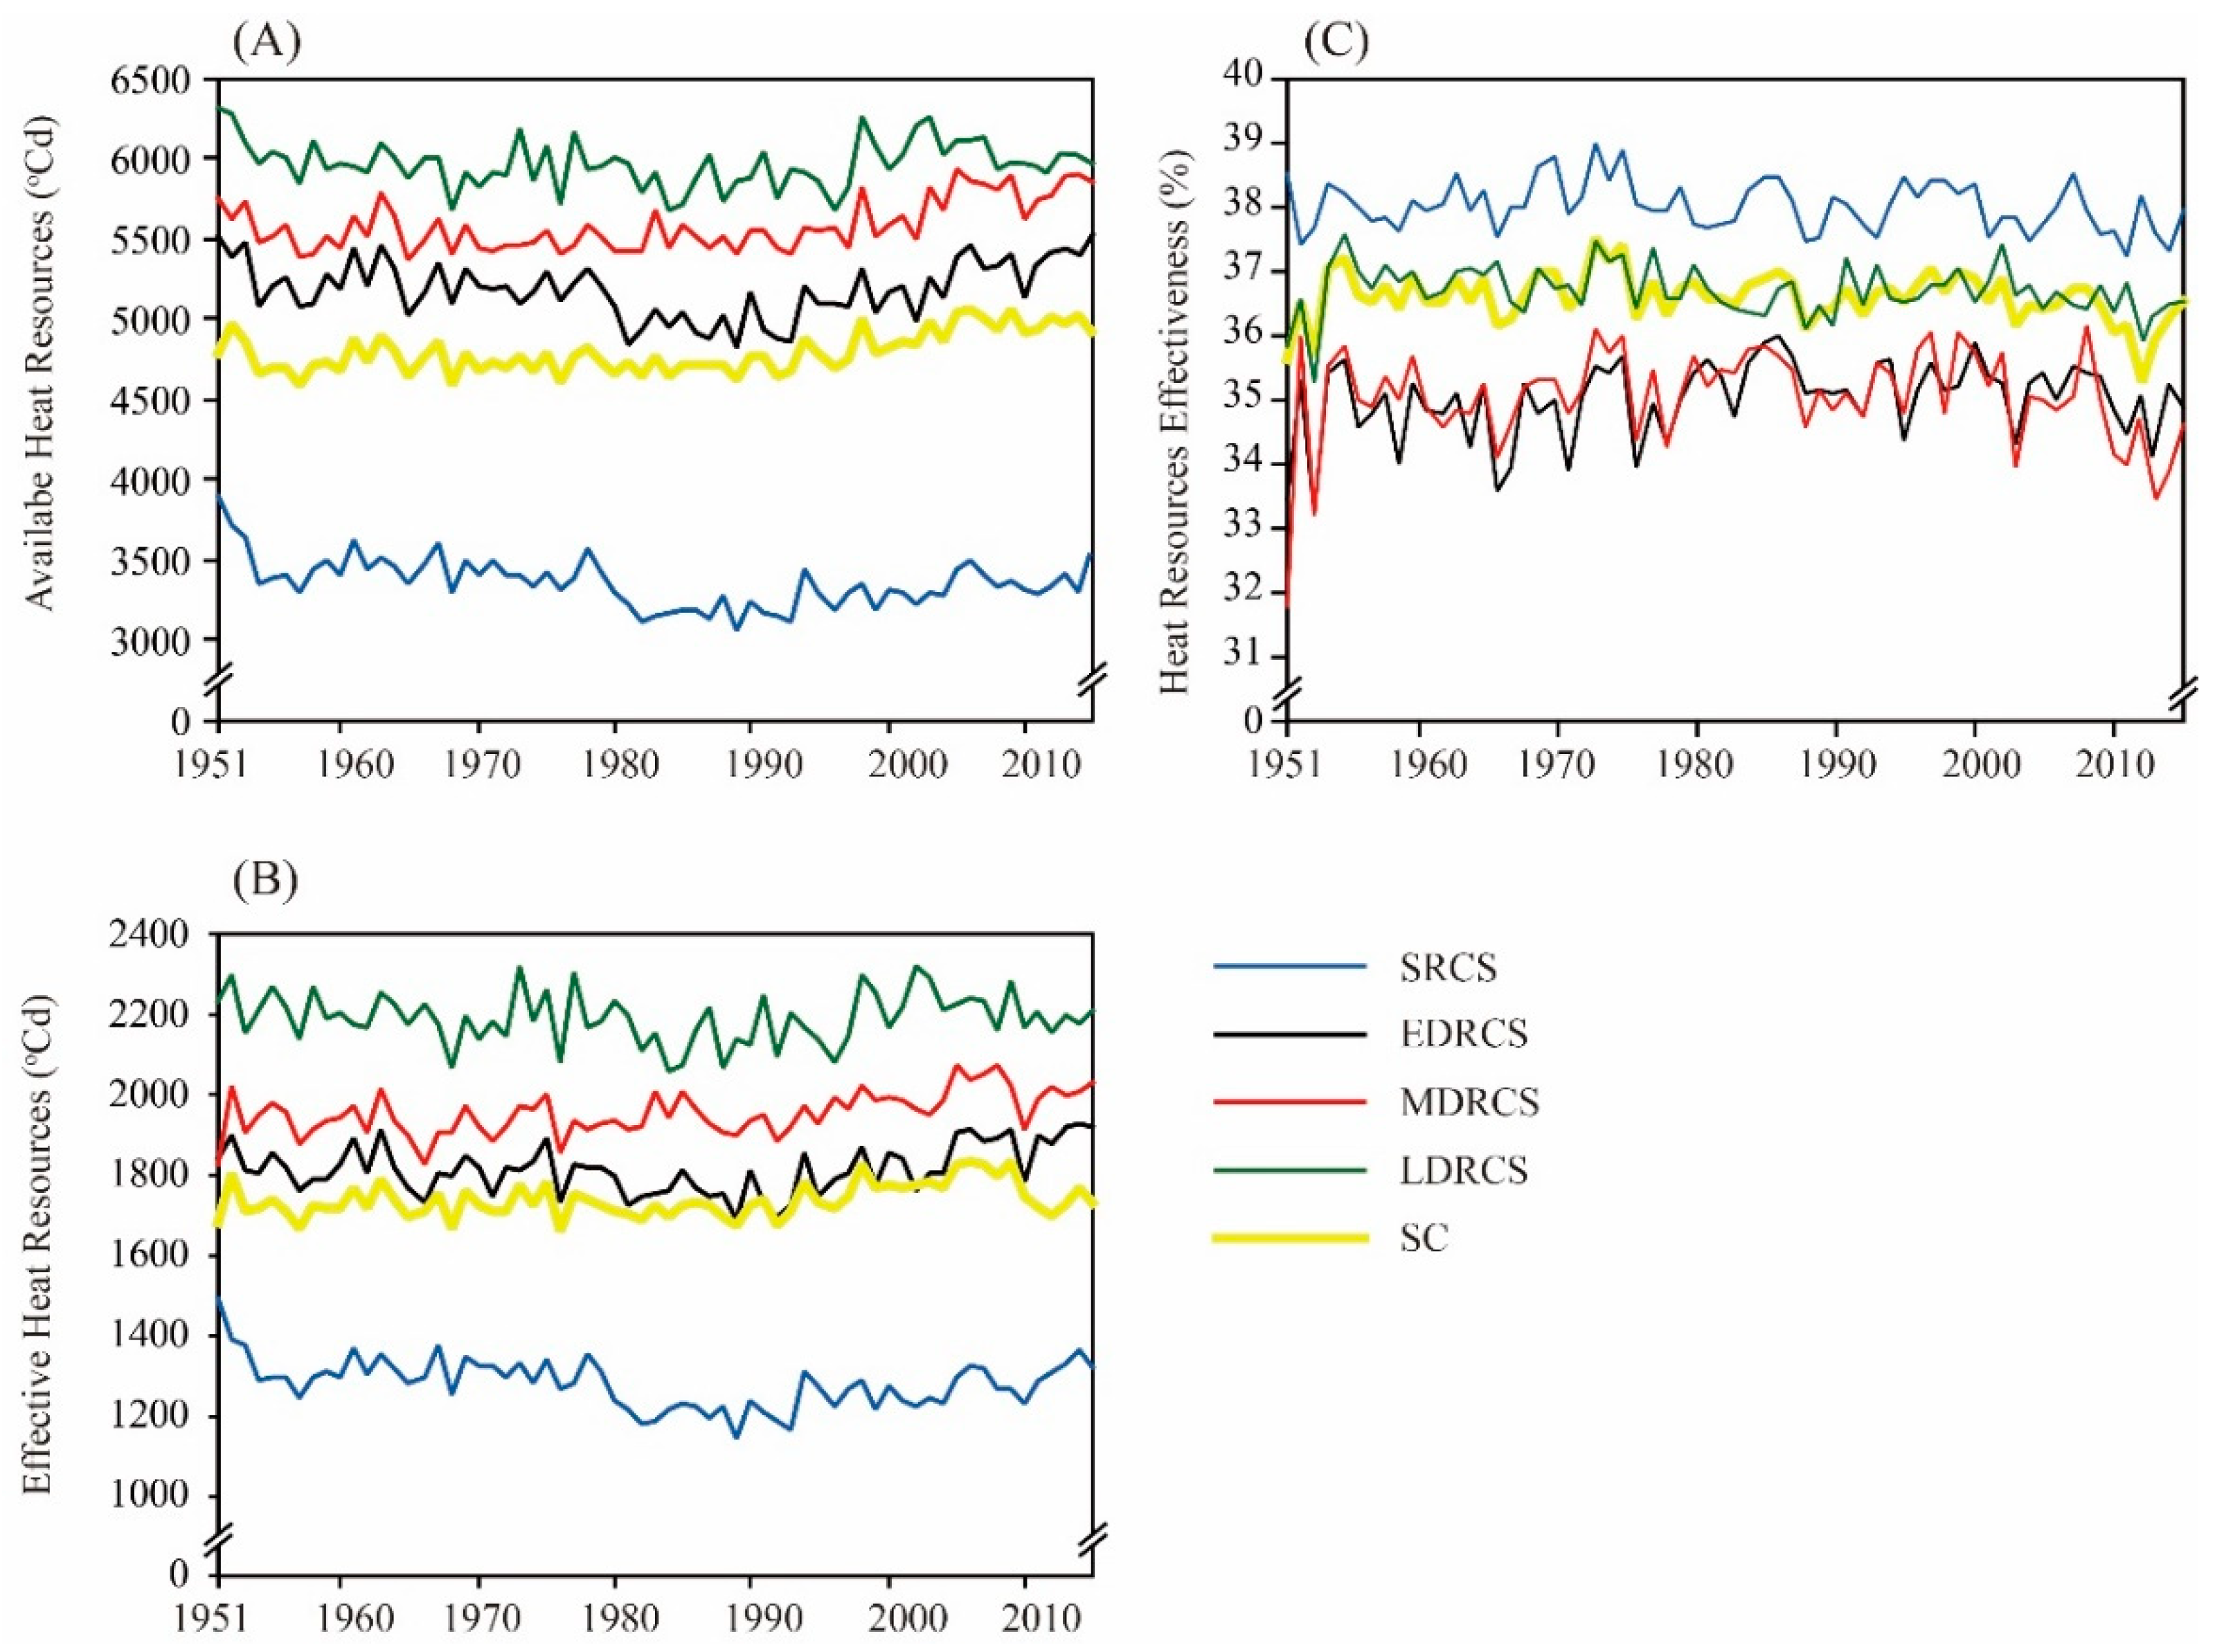
We analyzed the temporal trends in the three elements of AHR, EHR and HRE for five spatial scales: the entire study area, SRCS area, EDRCS area, MDRCS area and LDRCS area. We detected that in the areas of EDRCS, MDRCS, and LDRCS, both AHR and EHR showed a slightly decreasing trend during the period of 1951–1980, then a significantly increasing trend during the period of 1981–2015. In the entire study area, both AHR and EHR showed a slightly increasing trend during the study period of 1951–2015. Meanwhile, both AHR and HRE showed a slightly decreasing trend in SRCS area during the period of 1951–2015 (Figure 3A,B).
As seen in Figure 3C, HRE failed to show a clear trend for the entire study area or for the areas of four rice-based cropping systems during the period of 1951–2015. However, within the study period, there was a slightly increasing trend in HRE during the period of 1951–1980, but a slightly decreasing trend during the period of 1981–2015.
Overall, in the southern China rice cropping area, both AHR and EHR increased, while HRE decreased. The heat resource effectiveness decreased during the study period of 1951–2015.
3.2. Spatial Patterns of Major Heat Resources Indices
3.2.1. Available Heat Resource
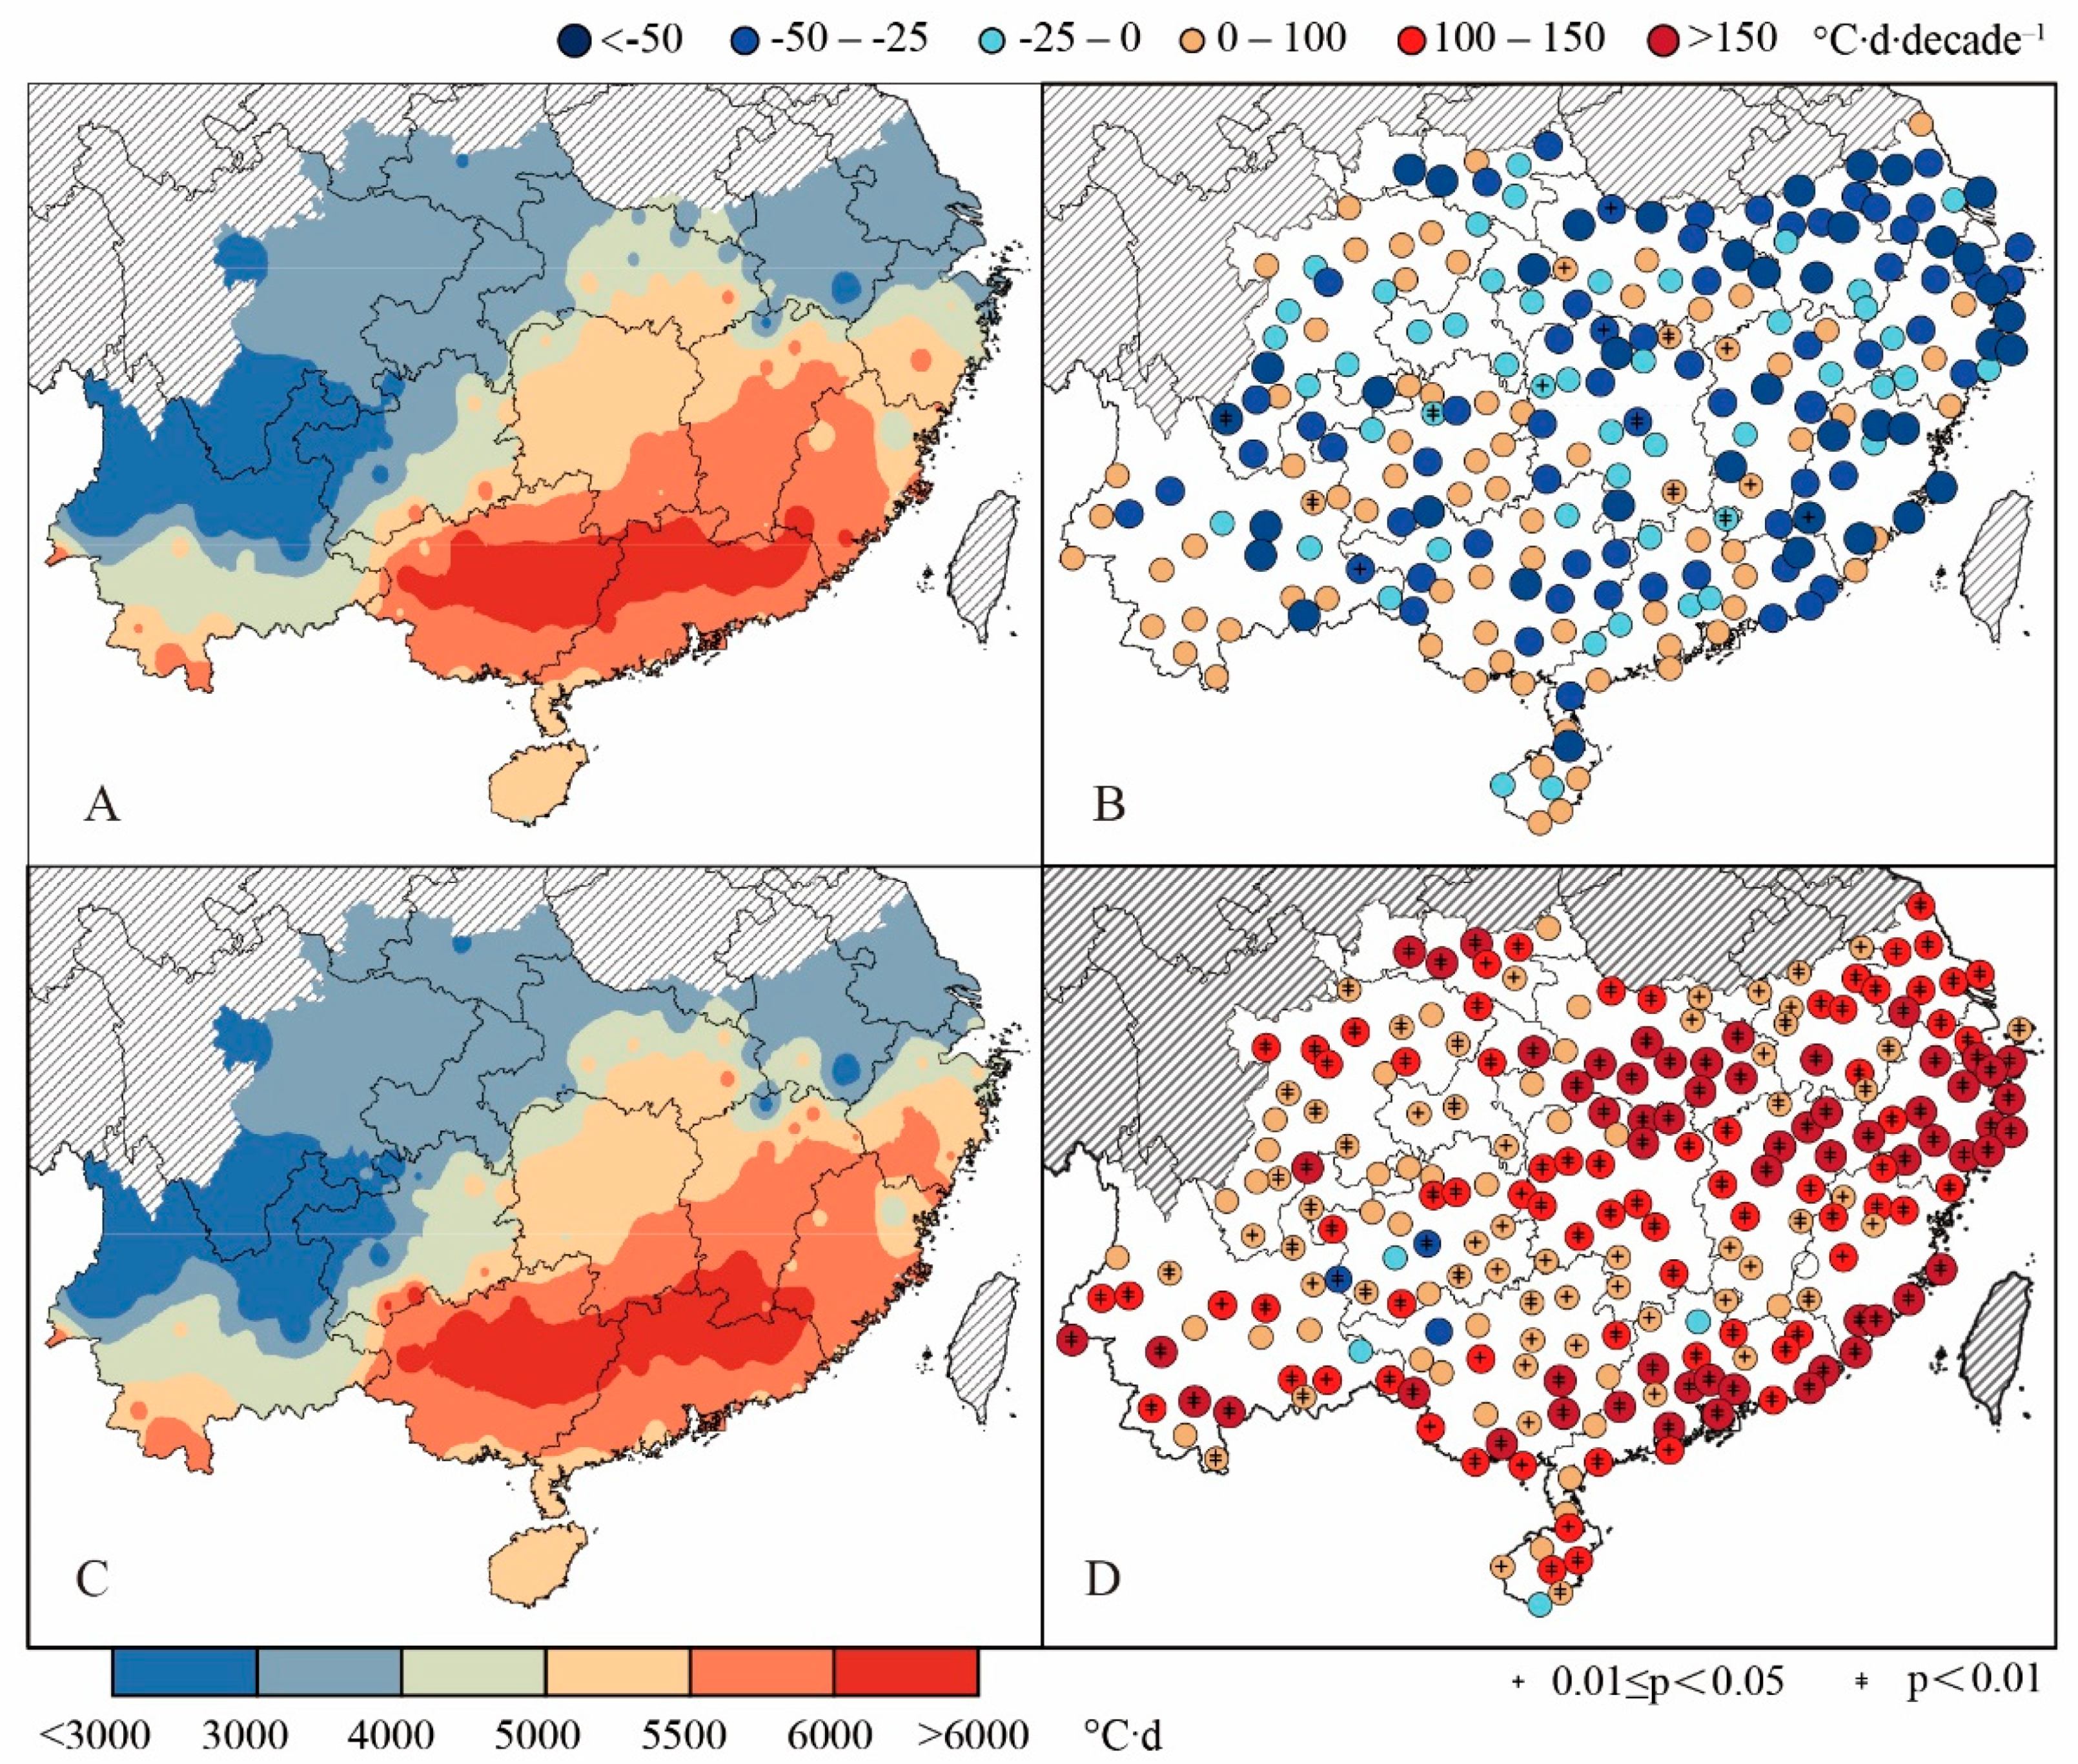
During the period of 1951–2015, AHR during the rice growing season decreased from southeast to northwest in the study area (Figure 4A,C). The areas with AHR lower than 3000 °C·d were located in the southwestern part of the study area (i.e., Yunnan province), while the areas with AHR greater than 5500 °C·d were located in the central (i.e., Poyang Lake Plain and Dongting Lake Plain) and southeastern (e.g., Fujian and Guangdong provinces) parts of the study area.
On average, the total growing season AHR for the entire study area was 4609 °C·d and 4628 °C·d during the periods of 1951–1980 and 1981–2015, respectively. During the period of 1951–1980, a total of 66% of the research locations showed a decreasing trend in AHR (6% were statistically significant (p < 0.05), and were concentrated in the southeastern part of the study area), and the composite trend was −16.9 °C·d·decade−1 (Figure 4B). However, during the period of 1981–2015, a total of 96.5% of the research locations showed an increasing trend in growing season AHR (86% were statistically significant (p < 0.05)), and the composite trend was 114.5 °C·d·decade−1.
For the same rice varieties, growing season AHR was greater during the period of 1951–1980 than 1981–2015 for different rice-based cropping systems. During the period of 1951–1980, total growing season AHR for SRCS, EDRCS, MDRCS and LDRCS was 3308 °C·d, 5072 °C·d, 5377 °C·d, and 5810 °C·d, respectively. And during the period of 1981–2015, total growing season AGR for SRCS, EDRCS, MDRCS and LDRCS was 3105 °C·d, 4884 °C·d, 5407 °C·d, and 5736 °C·d, respectively. This is because potential growing season was shortened for different rice cropping systems under the background of climate change (Table 6).
3.2.2. Effective Heat Resource
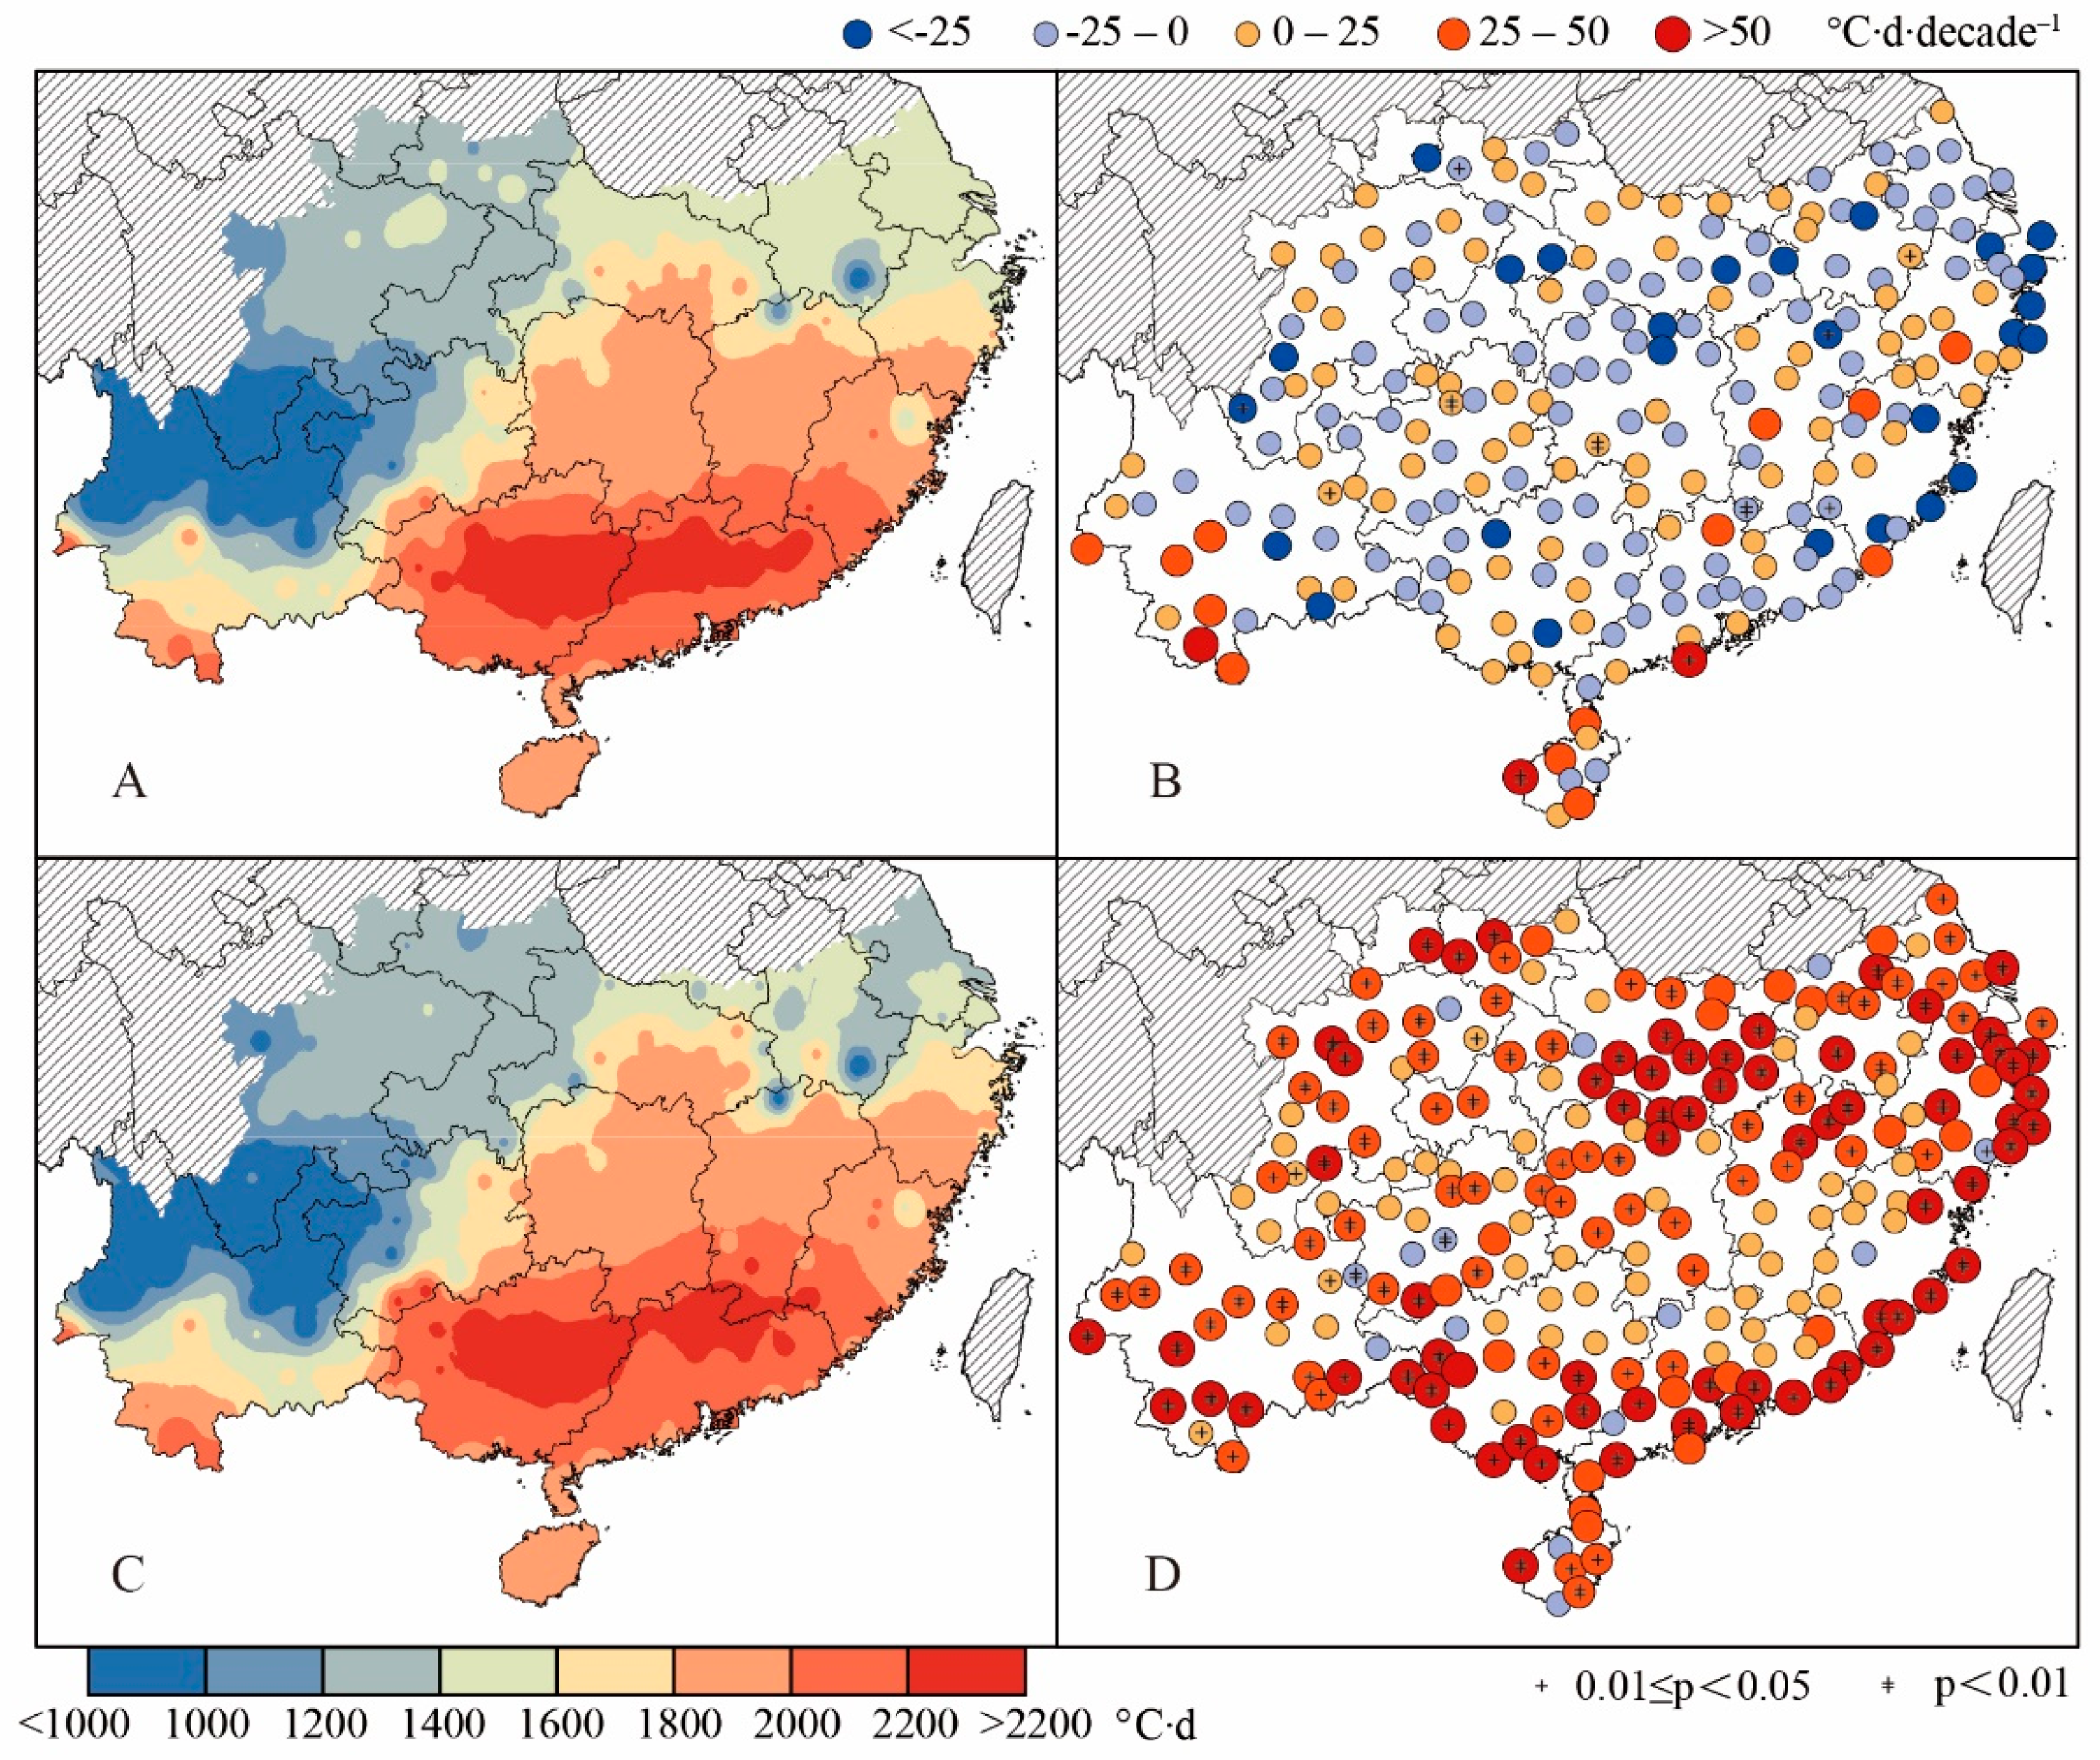
From 1951 to 2010, during the rice growing season, EHR also decreased from southeast to northwest in the study area (Figure 5A,C). During the period of 1951–1980, growing season EHR was 1668 °C·d on average in the study area, the areas with growing season EHR greater than 2000 °C·d were located in Guangdong, Guangxi, and southern Yunnan; the areas with growing season EHR lower than 1000 °C·d were located in northern Yunnan and southern Sichuan. During the period of 1981–2015, growing season EHR was 1676 °C·d on average in the study area; the spatial distribution characteristics were similar with the 1951–1980 period, but the areas with growing season EHR greater than 2000 °C·d expanded.
During the period of 1951–1980, the composite trend in growing season EHR was –4.2 °C·d·decade−1, with a total of 55% research locations showing decreasing trends (only 5% were statistically significant at p < 0.05) (Figure 5B). During the period of 1981–2015, the composite trend in growing season EHR was 37.6 °C·d·decade−1, with a total of 95% of the research locations showing increasing trends (63% were statistically significant at p < 0.05).
During the study period of 1951–2015, the rice growing season was shortened against the background of climate warming; therefore, growing season EHR had been decreasing. Compared with the period of 1951–1980, growing season EHR for the entire study area had decreased by 27 °C·d during the period of 1981–2015. During the period of 1981–2015, the order of growing season EHR for different rice-based cropping systems from high to low was: LTCRS, MTCRS, ETCRS, and SRCS (Table 7).
3.2.3. Heat Resource Effectiveness
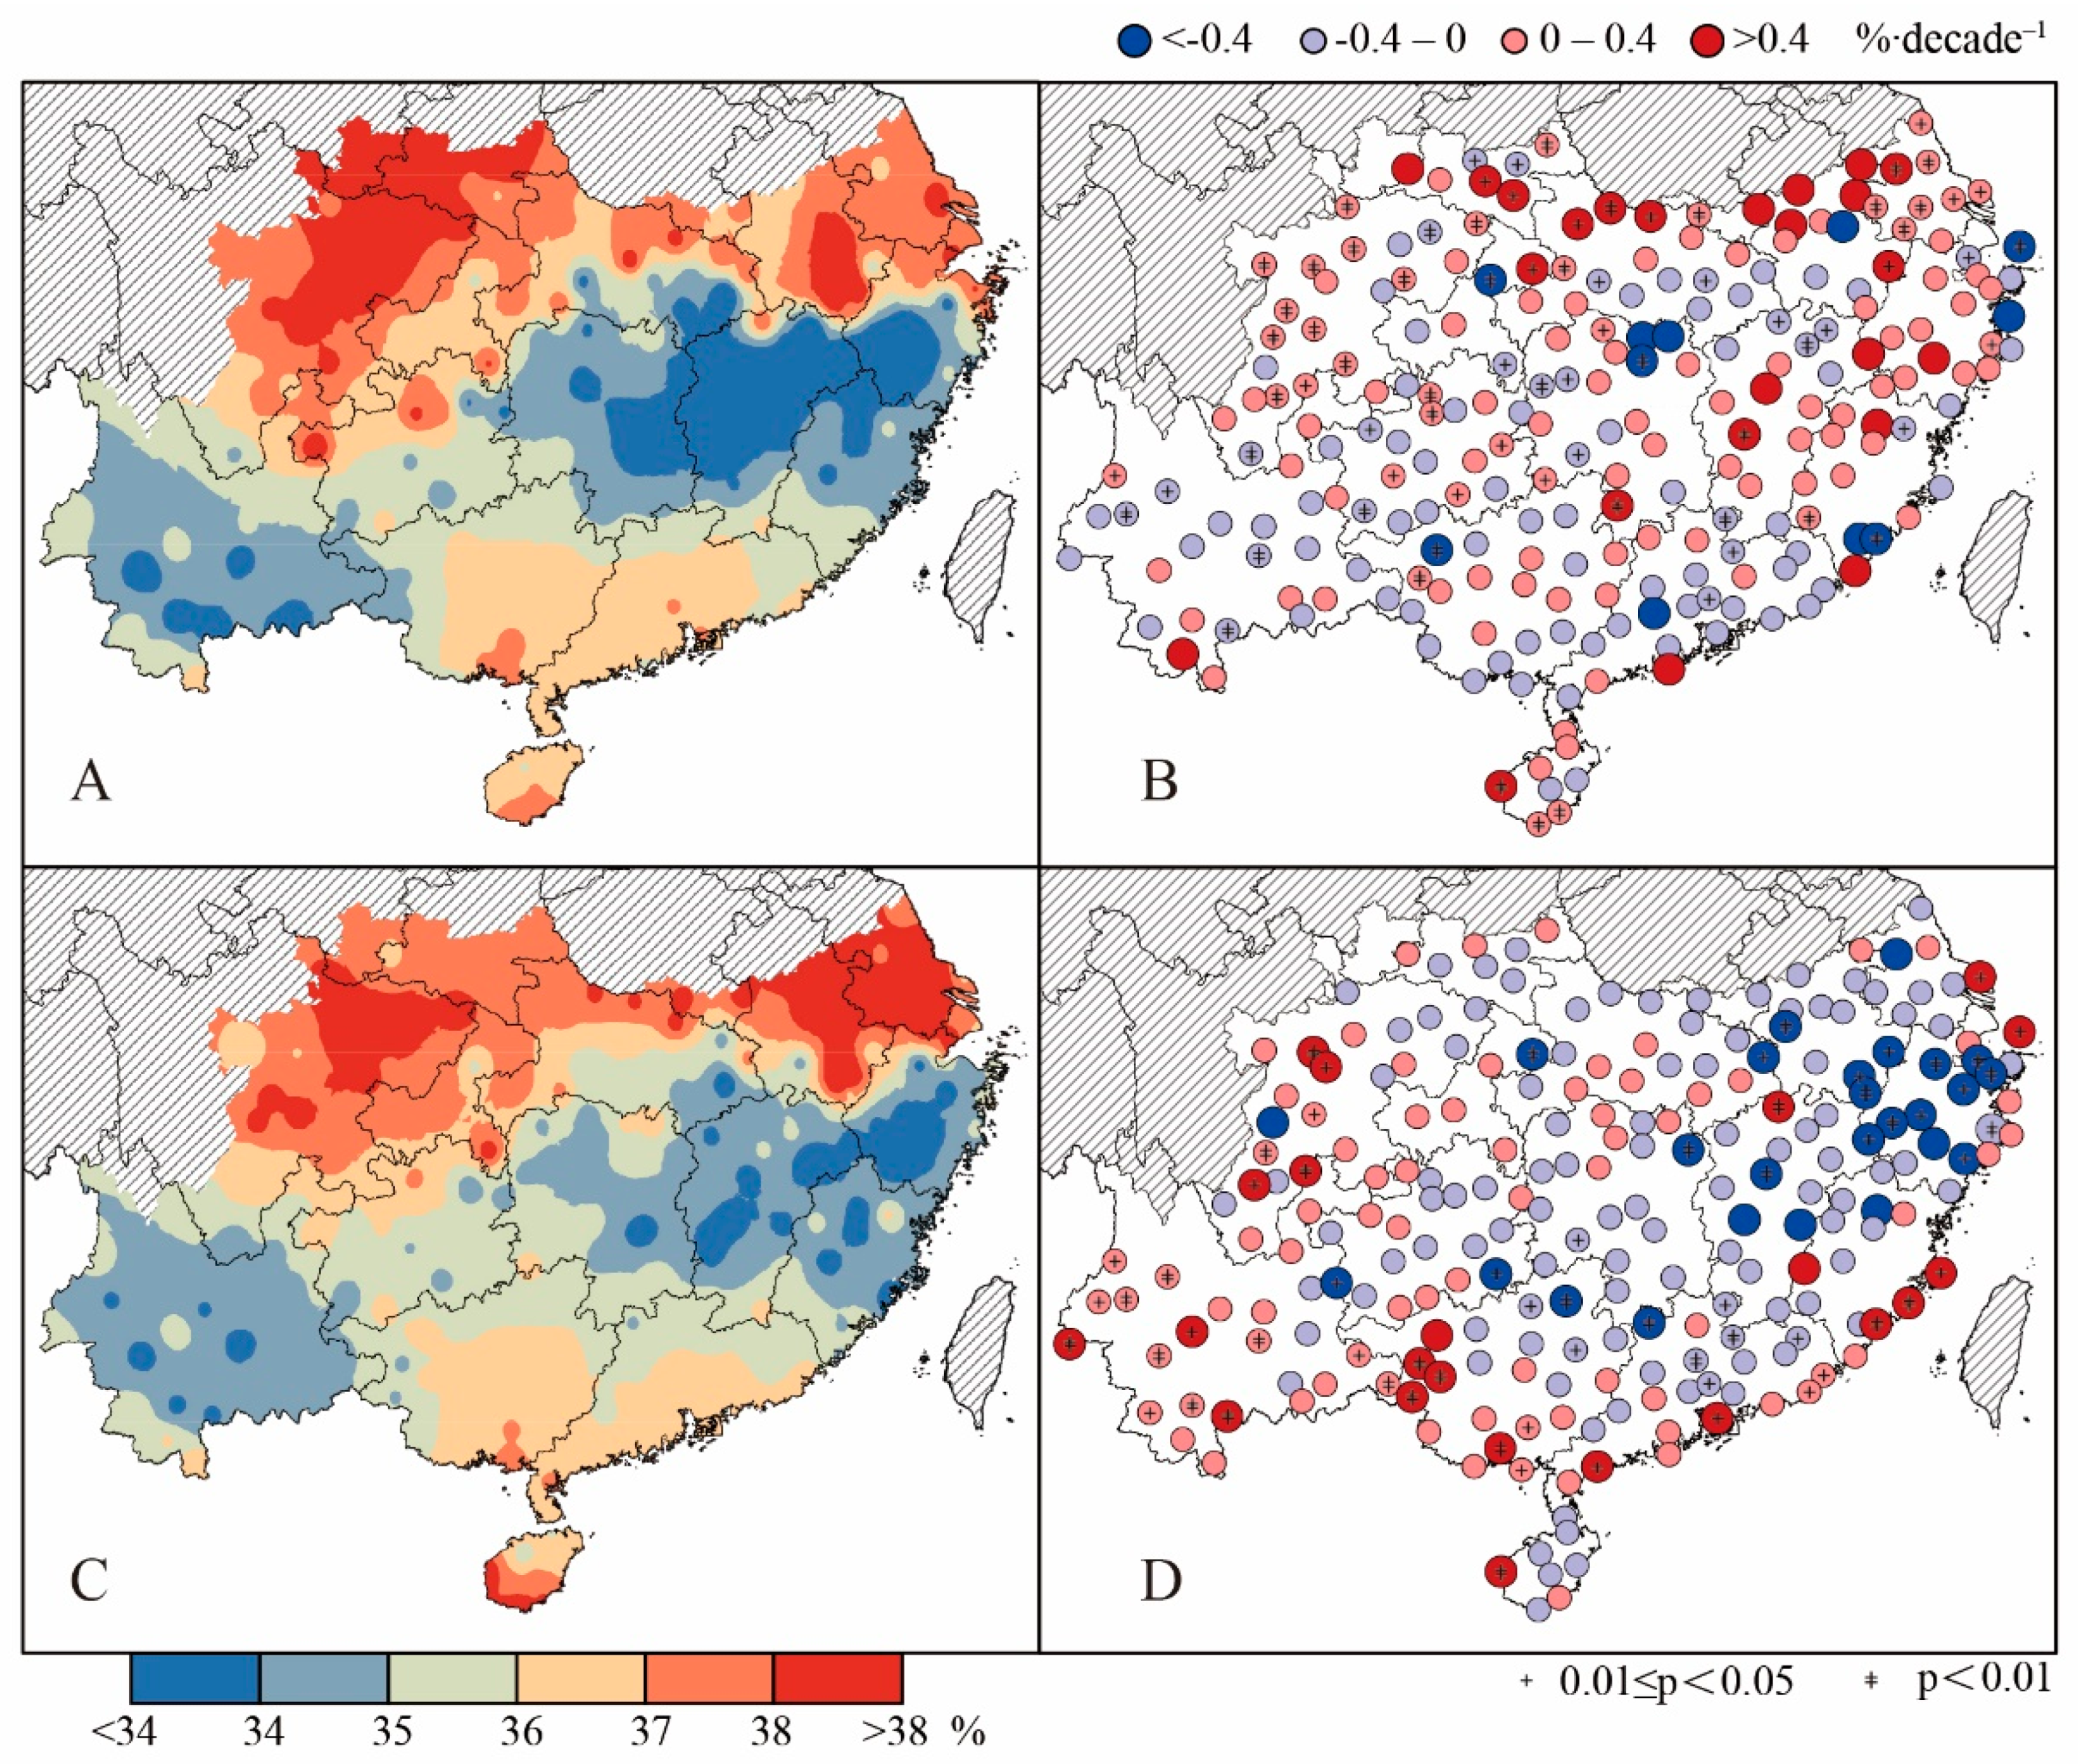
During the period of 1951–2015, growing season HRE increased from southeast to northwest in the study area (Figure 6). On average, growing season HRE for the entire study area was 36% and 35.8% during the period of 1951–1980 and 1981–2015, respectively. During the period of 1951–1980, the single rice planting area had relatively higher growing season HRE (>37%), e.g., Sichuan, Shaanxi, Anhui and Jiangsu area, while the main double rice planting area had relatively lower growing season HRE (<34%), e.g., Hu’nan and Jiangxi area. During the period of 1981–2015, the area with relatively higher growing season HRE had decreased, while the area with relatively lower growing season HRE had expanded.
During the period of 1951–1980, growing season HRE showed a slightly increasing trend at 58% of the research locations, with a composite trend of 0.01%·decade−1, but none of them were statistically significant. During the period of 1981–2015, a total of 57% of the research locations showed a decreasing trend in growing season HRE (22% are statistically significant at p < 0.01, and they were located in Zhejiang and Fujian, Figure 6D), with a composite trend of −0.03%·decade−1.
During the period of 1981–2015, growing season HRE has decreased by 0.1% on average compared with 1951–1980. In general, single rice cropping system has higher growing season HRE than double rice cropping systems. More specifically, the order of growing season HRE from high to low is: SRCS, LDRCS, MDRCS, and EDRCS (Table 8).
3.3. The Effect of EHR on Photo-Thermal Potential for Different Rice Cropping Systems
We detected a significant linear relationship (R2 > 0.90) between growing season GEHR and photo-thermal potential yield (Figure 7), which implies a strong correlation between growing season heat resource and rice potential yield. With a 1 °C·d increase in growing season GEHR, rice photo-thermal potential yield would increase by 14.3 kg·ha−1 and 13.7 kg·ha−1 during the period of 1951–1980 and 1981–2015, respectively.
3.4. The Effect of Growing Season HRE on Rice Potential Yield
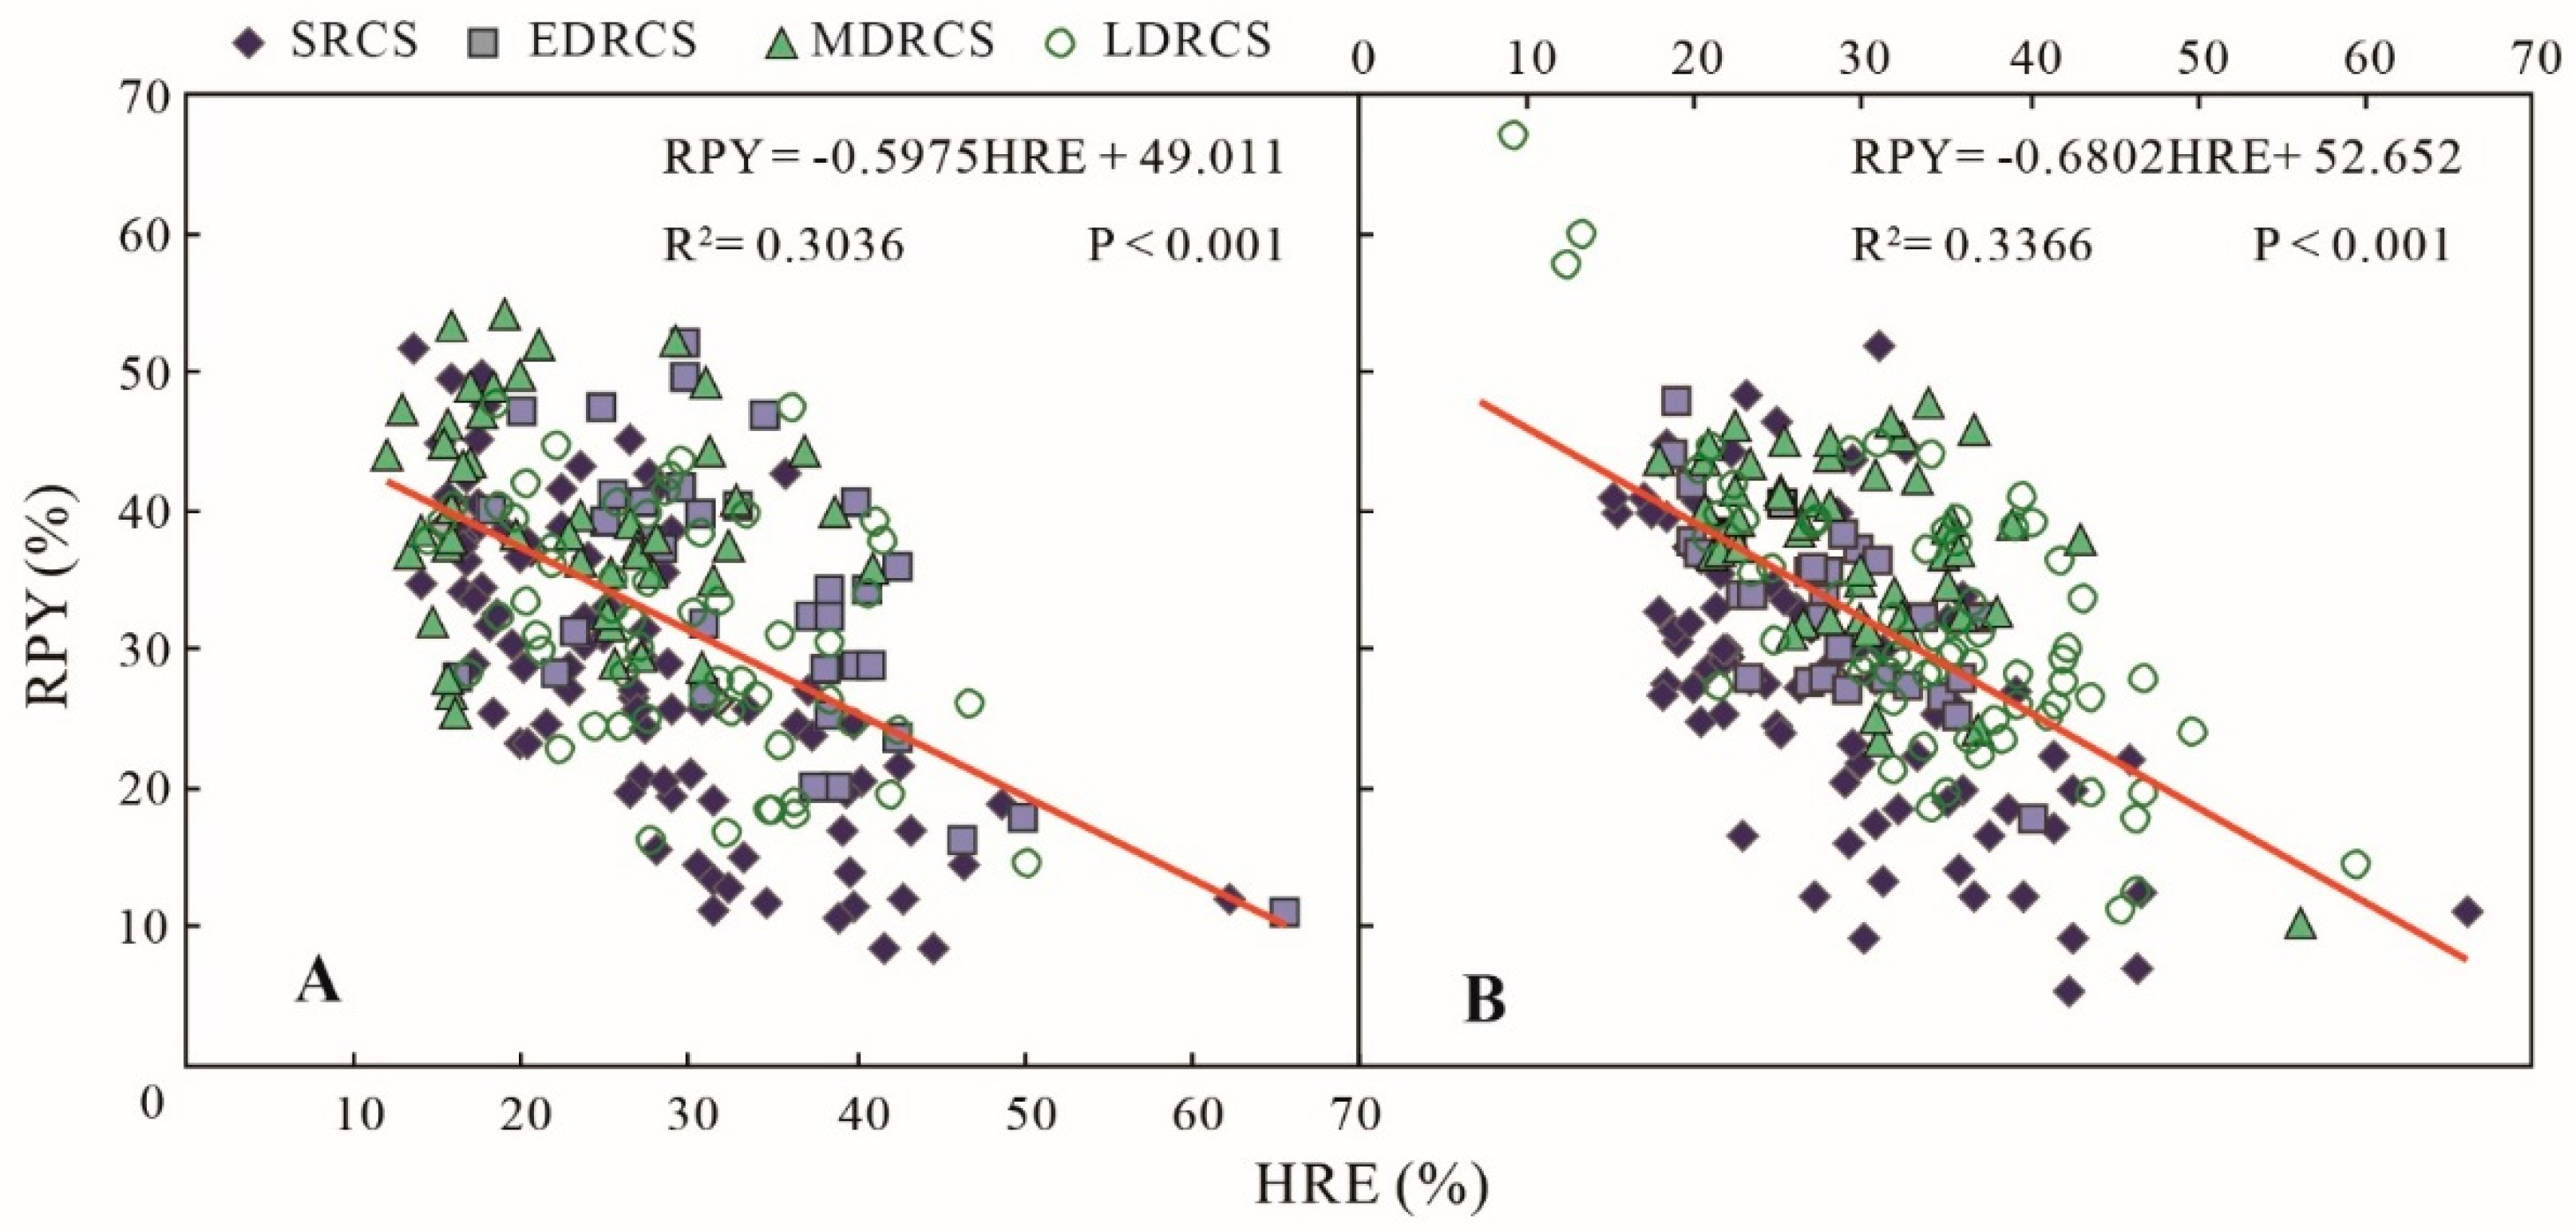
We detected a negative relationship between HRE and RPY (R2 > 0.30, p < 0.01) during the two periods of 1951–1980 and 1981–2015. For per unit of increase in growing season HRE, the temperature-induced potential yield reduction rate would be offset by 0.6% and 0.7% during the periods 1951–1980 and 1981–2015, respectively (Figure 8A,B).
4. Discussion
Agro-thermal resources are the main factors affecting the layout, structure, and yield of crops. Previous related studies have used agricultural limit temperature, accumulated temperature, and the growing season length [42,71,72,73] or the temperature suitability indices based on the development characteristics during various growth stages [74]. However, few studies have focused on quantifying the effectiveness of heat resource or heat resource use efficiency.
Traditional methods used to evaluate heat resource during the crop growing season (e.g., accumulated temperature) fail to consider the changing temperature demands of the crop within different growth stages. In this study, we adopted the three “cardinal” temperatures for rice in different developmental stages to calculate the growing season EHR. In addition, we used hourly temperature simulated from the daily maximum and minimum temperatures during the computing process [38]. Therefore, the growing season EHR can better represent the heat resource demands during different growth stages for rice crops.
Previous studies have shown that growing season thermal time has changed over the last six decades due to a warming climate [31,32,75,76]. However the changes in growing season HRE for rice production in southern China have rarely been documented. As pointed out by Bouman et al. (2001) effective temperature is what really matters for rice development; thus, we analyzed the changes in growing season HRE in this study. In general, growing season HRE for rice production had decreased during the research period in southern China. This decrease might have been related to the shortening rice growing season [77] and the increase in the number of days with daily maximum temperature ≥ 35 °C [78,79].
Statistical methods and crop models are commonly used to predict the potential growing season for rice. In this study, we selected the meteorological–biological model for the rice growing season that was brought up by Gao (1983) [46] because it has relatively fewer parameters and is simple to run. This model is superior to the trending rice models that require many parameters to simulate the growing season and which are also complicated and difficult to use.
This study was based on the assumption that no changes had been made to the rice varieties for the four main cropping systems in southern China during the study period [62]. In practice, the choices of seed varieties could be influenced by breeding technology, governmental policy, cereal grain market, weather extremes (e.g., low temperatures and waterlogging), etc. By using the historical rice cultivars to analyze the effects of climate change on rice potential yield, we omitted the factor that farmers would switch to newer hybrids to combat climate change. Hence, our results might exaggerate the effects of climate change on rice potential yield.
5. Conclusions
During the period of 1951–1980, both growing season AHR and EHR showed a slightly decreasing trend in southern China. By contrast, during the period of 1981–2015, the trends in growing season AHR and EHR significantly increased.
In the past six decades, growing season AHR and EHR decreased from southeast to northwest in the southern rice cropping area. The areas with relatively shorter growing season AHR and EHR are in the southwestern part of the study area (e.g., Yunnan), where the single rice-cropping system is typical. The areas with relatively longer growing season AHR and EHR are in the central (e.g., Poyang Lake plain and Dongting Lake plain) and southeastern (e.g., Fujian province, Guangdong province) parts of the study area, where the double rice-cropping systems are typical. Nevertheless, the growing season HRE for the single rice-cropping system is longer than that for the double rice-cropping systems.
With a 1 °C·d increase in growing season GEHR in the southern rice cropping area, the photo-thermal potential yield for rice would increase by 14.3 kg·ha−1 and 13.7 kg·ha−1 during the period of 1951–1980 and 1981–2015, respectively. For each percentage of increase in growing season HRE, the temperature-induced rice potential yield reduction rate would decrease by 0.6% and 0.7% during the period of 1951–1980 and 1981–2015, respectively.
Author Contributions
Conceptualization, Q.Y. and X.Y.; methodology, Q.Y. and W.X.; software, Q.Y. and J.Y.; validation, W.X., J.Y. and Z.C.; formal analysis, Q.Y. and W.X.; resources, Q.Y., X.Y. and Z.C.; data curation, Q.Y. and J.Y.; writing—original draft preparation, Q.Y.; writing—review and editing, X.Y. and Z.C.; supervision, X.Y.; project administration, Q.Y. and X.Y.; funding acquisition, Q.Y., X.Y. and Z.C. All authors have read and agreed to the published version of the manuscript.
Funding
This research was funded by the Ministry of Science and Technology of China, grant number 2016YFD0300101; the National Natural Science Foundation of China, grant number 31560337 and China Meteorological Administration, grant number CMA-CLYBZX(2019JX07).
Conflicts of Interest
The authors have no conflict of interest to declare.
References
- Chen, T.B.; Zhang, B.C.; Huang, Z.C.; Ru, L.Y.; Zheng, Y.M.; Lei, M.; Liao, X.Y.; Piao, S.J. Geographical distribution and characteristics Of habitat of As-hyperaccumulator Pteris vittata L. in China. Geogr. Res. 2005, 24, 825–833. [Google Scholar]
- Parmesan, C. Influences of species, latitudes and methodologies on estimates of phenological response to global warming. Glob. Chang. Biol. 2007, 13, 1860–1872. [Google Scholar] [CrossRef]
- Song, Y.; Liu, B.; Zhong, H. Impact of Global Warming on the Rice Cultivable Area in Southern China in 1961-2009. Adv. Clim. Chang. Res. 2011, 7, 259–264. [Google Scholar]
- Martin, Y.; Van Dyck, H.; Dendoncker, N.; Titeux, N. Testing instead of assuming the importance of land use change scenarios to model species distributions under climate change. Glob. Ecol. Biogeogr. 2013, 22, 1204–1216. [Google Scholar] [CrossRef]
- Yang, X.G.; Liu, Z.J.; Chen, F. The Possible Effect of Climate Warming on Northern Limits of Cropping System and Crop Yield in China. Agric. Sci. China 2011, 10, 585–594. [Google Scholar] [CrossRef]
- Dong, J.; Liu, J.; Tao, F.; Xu, X.; Wang, J. Spatio-temporal changes in annual accumulated temperature in China and the effects on cropping systems, 1980s to 2000. Clim. Res. 2009, 40, 37–48. [Google Scholar] [CrossRef]
- Bonhomme, R. Bases and limits to using ‘degree. day’units. Eur. J. Agron. 2000, 13, 1–10. [Google Scholar] [CrossRef]
- Song, Y.; Linderholm, H.W.; Chen, D.; Walther, A. Trends of the thermal growing season in China, 1951–2007. Int. J. Climatol. 2010, 30, 33–43. [Google Scholar] [CrossRef]
- Ma, S.; An, G.; Wang, Q.; Xi, Z.; Liu, Y. Study on the variation laws of the thermal resources in maize-growing belt of northeast China. Resour. Sci. 2000, 22, 41–45. [Google Scholar]
- Hartz, T.; Moore, F. Prediction of potato yield using temperature and insolation data. Am. Potato J. 1978, 55, 431–436. [Google Scholar] [CrossRef]
- Huang, Y.; Gao, L.; Jin, Z.; Chen, H. Simulating the optimal growing season of rice in the Yangtze River Valley and its adjacent area, China. Agric. For. Meteorol. 1998, 91, 251–262. [Google Scholar] [CrossRef]
- Caton, B.; Foin, T.; Gibson, K.; Hill, J. A temperature-based model of direct-, water-seeded rice (Oryza sativa) stand establishment in California. Agric. For. Meteorol. 1998, 90, 91–102. [Google Scholar] [CrossRef]
- Liu, D.; Kingston, G.; Bull, T. A new technique for determining the thermal parameters of phenological development in sugarcane, including suboptimum and supra-optimum temperature regimes. Agric. For. Meteorol. 1998, 90, 119–139. [Google Scholar] [CrossRef]
- Leong, S.; Ong, C. The influence of temperature and soil water deficit on the development and morphology of groundnut (Arachis hypogaea L.). J. Exp. Bot. 1983, 34, 1551–1561. [Google Scholar] [CrossRef]
- Dufault, R.J. Determining heat unit requirements for broccoli harvest in coastal South Carolina. J. Am. Soc. Hortic. Sci. 1997, 122, 169–174. [Google Scholar] [CrossRef]
- McMaster, G.S.; Wilhelm, W. Growing degree-days: One equation, two interpretations. Agric. For. Meteorol. 1997, 87, 291–300. [Google Scholar] [CrossRef] [Green Version]
- Black, C.; Ong, C. Utilisation of light and water in tropical agriculture. Agric. For. Meteorol. 2000, 104, 25–47. [Google Scholar] [CrossRef]
- Butler, T.J.; Evers, G.W.; Hussey, M.A.; Ringer, L.J. Flowering in crimson clover as affected by planting date. Crop Sci. 2002, 42, 242–247. [Google Scholar] [CrossRef]
- Caliskan, S.; Caliskan, M.; Arslan, M.; Arioglu, H. Effects of sowing date and growth duration on growth and yield of groundnut in a Mediterranean-type environment in Turkey. Field Crops Res. 2008, 105, 131–140. [Google Scholar] [CrossRef]
- Caliskan, S.; Caliskan, M.; Erturk, E.; Arslan, M.; Arioglu, H. Growth and development of Virginia type groundnut cultivars under Mediterranean conditions. Acta Agric. Scand. Sect. B Soil Plant Sci. 2008, 58, 105–113. [Google Scholar] [CrossRef]
- Idso, S.; Hatfield, J.; Jackson, R.; Reginato, R. Grain yield prediction: Extending the stress-degree-day approach to accommodate climatic variability. Remote Sens. Environ. 1979, 8, 267–272. [Google Scholar] [CrossRef]
- Teal, R.; Tubana, B.; Girma, K.; Freeman, K.; Arnall, D.; Walsh, O.; Raun, W. In-season prediction of corn grain yield potential using normalized difference vegetation index. Agron. J. 2006, 98, 1488–1494. [Google Scholar] [CrossRef] [Green Version]
- Challinor, A.; Wheeler, T.; Craufurd, P.; Slingo, J. Simulation of the impact of high temperature stress on annual crop yields. Agric. For. Meteorol. 2005, 135, 180–189. [Google Scholar] [CrossRef] [Green Version]
- Han, X.L.; Qu, M.L. Crop Ecology; China Meteorological Press: Beijing, China, 1991. [Google Scholar]
- Challinor, A.; Wheeler, T.; Craufurd, P.; Slingo, J.; Grimes, D. Design and optimisation of a large-area process-based model for annual crops. Agric. For. Meteorol. 2004, 124, 99–120. [Google Scholar] [CrossRef]
- Tao, F.; Yokozawa, M.; Zhang, Z. Modelling the impacts of weather and climate variability on crop productivity over a large area: A new process-based model development, optimization, and uncertainties analysis. Agric. For. Meteorol. 2009, 149, 831–850. [Google Scholar] [CrossRef]
- Yu, Y.; Ge, B.; Ren, S. Study on the effectiveness of accumulated tempreature in the sub-tropical western moutain areas in China. Meteorol. Mon. 1991, 17, 21–25. [Google Scholar]
- Ravindra, G.M.; Sridhara, S.; Girijesh, G.K.; Nanjappa, H.V. Weed biology and growth analysis of Celosia argentea L., a weed associated with groundnut and finger millet crops in southern India. Commun. Biom. Crop Sci. 2008, 3, 80–87. [Google Scholar]
- Zhang, L.; Lou, W. Impact of climate warming on the distribution of thermal resources in the lower-middle reaches of the Changjiang River. J. Nat. Resour. 2013, 28, 1361–1372. [Google Scholar]
- Yue, W.; Cao, W.; Yang, T.; Wu, W.; Chen, G. Variable characteristics heat resources of single-season rice growing seasons in Anhui province and its impacts on rice yield. Chin. Agric. Sci. Bull. 2014, 30, 222–228. [Google Scholar]
- Hu, Q.; Pan, X.; Shao, C.; Zhang, D.; Wang, X.; Wei, X. Distribution and variation of China agricultural heat resources in 1961–2010. Chin. J. Agrometeorol. 2014, 35, 119–127. [Google Scholar]
- Miao, Q.; Ding, Y.; Wang, Y.; Duan, C. Impact of climate warming on the distribution of China’s thermal resources. J. Nat. Resour. 2009, 24, 934–944. [Google Scholar]
- Baskerville, G.; Emin, P. Rapid estimation of heat accumulation from maximum and minimum temperatures. Ecology 1969, 50, 514–517. [Google Scholar] [CrossRef]
- DeGaetano, A.T.; Knapp, W.W. Standardization of weekly growing degree day accumulations based on differences in temperature observation time and method. Agric. For. Meteorol. 1993, 66, 1–19. [Google Scholar] [CrossRef]
- Sacks, W.J.; Kucharik, C.J. Crop management and phenology trends in the US Corn Belt: Impacts on yields, evapotranspiration and energy balance. Agric. For. Meteorol. 2011, 151, 882–894. [Google Scholar] [CrossRef]
- Lobell, D.B.; Bänziger, M.; Magorokosho, C.; Vivek, B. Nonlinear heat effects on African maize as evidenced by historical yield trials. Nat. Clim. Chang. 2011, 1, 42–45. [Google Scholar] [CrossRef]
- Rodríguez-Rajo, F.J.; Frenguelli, G.; Jato, M. Effect of air temperature on forecasting the start of the Betula pollen season at two contrasting sites in the south of Europe (1995–2001). Int. J. Biometeorol. 2003, 47, 117–125. [Google Scholar] [CrossRef]
- Jiang, H.; Wen, D. Methods of calculating growing degree-day based on LR assumption and daily extreme temperatures. J. China Agric. Univ. 2013, 18, 82–87. [Google Scholar]
- Liu, X.; Han, X. Regionalization of Cropping System in China; Beijing Agricultural University Press: Beijing, China, 1987. [Google Scholar]
- Hu, Z.X. Analysis of the situation of rice production in China. Hybrid Rice 2009, 24, 1–7. [Google Scholar]
- Xin, L.; Li, X. Changes of Multiple Cropping in Double Cropping Rice Area of Southern China and Its Policy Implications. J. Nat. Resour. 2009, 24, 58–65. [Google Scholar]
- Ye, Q.; Yang, X.G.; Liu, Z.J.; Dai, S.W.; Li, Y.; Xie, W.J.; Chen, F. The Effects of Climate Change on the Planting Boundary and Potential Yield for Different Rice Cropping Systems in Southern China. J. Integr. Agric. 2014, 13, 1546–1554. [Google Scholar] [CrossRef]
- Ye, Q.; Yang, X.; Dai, S.; Chen, G.; Li, Y.; Zhang, C. Effects of climate change on suitable rice cropping areas, cropping systems and crop water requirements in southern China. Agric. Water Manag. 2015, 159, 35–44. [Google Scholar] [CrossRef]
- Allen, R.G.; Pereira, L.S.; Raes, D.; Smith, M. Crop Evapotranspiration Guidelines for Computing Crop Water Requirements-Irrigation and Drainage Paper 56; Food and Agriculture Organization of the United Station: Rome, Italy, 1998. [Google Scholar]
- Li, Y.; Yang, X.G.; Dai, S.W.; Wang, W.F. Spatiotemporal change characteristics of agricultural climate resources in middle and lower reaches of Yangtze River. Chin. J. Appl. Ecol. 2010, 21, 2912–2921. [Google Scholar]
- Gao, L.; Li, L.; Guo, P. The length of growing season and climatic and ecologic regionalization for rice in China. Chin. J. Agrometeorol. 1983, 4, 50–55. [Google Scholar]
- Thakur, P.; Kumar, S.; Malik, J.A.; Berger, J.D.; Nayyar, H. Cold stress effects on reproductive development in grain crops: An overview. Environ. Exp. Bot. 2010, 67, 429–443. [Google Scholar] [CrossRef]
- Shimono, H.; Okada, M.; Kanda, E.; Arakawa, I. Low temperature-induced sterility in rice: Evidence for the effects of temperature before panicle initiation. Field Crops Res. 2007, 101, 221–231. [Google Scholar] [CrossRef]
- Gooding, M.; Ellis, R.; Shewry, P.; Schofield, J. Effects of restricted water availability and increased temperature on the grain filling, drying and quality of winter wheat. J. Cereal Sci. 2003, 37, 295–309. [Google Scholar] [CrossRef]
- Jagadish, S.; Craufurd, P.; Wheeler, T. High temperature stress and spikelet fertility in rice (Oryza sativa L.). J. Exp. Bot. 2007, 58, 1627–1635. [Google Scholar] [CrossRef] [Green Version]
- De Datta, S.K. Principles and Practices of Rice Production; International Rice Research Institute: Los BanÄos, PI, USA, 1981. [Google Scholar]
- Yoshida, S. Fundamentals of Rice Crop Science; International Rice Research Institute: Los BanÄos, PI, USA, 1981. [Google Scholar]
- Gao, L.; Jin, Z.; Huang, Y.; Zhang, L. Rice clock model—A computer model to simulate rice development. Agric. For. Meteorol. 1992, 60, 1–16. [Google Scholar] [CrossRef]
- Liu, Y. The impact of the contemporary climatic change on China’s heat resource. J. Nat. Resour. 1993, 8, 166–175. [Google Scholar]
- Wang, F. On the variation of accumulated temperature during the last 100 years and crop yield in China. Acta Geogr. Sin. 1982, 37, 272–280. [Google Scholar]
- Zhang, H.; Zhang, Y. Perliminary discussion on the response of active accumulated temperature of China to climate warming. Acta Geogr. Sin. 1994, 49, 27–36. [Google Scholar]
- Dong, H.; Deng, Z. The Utilization of Agoclimatic Resources in Multiple Cropping Area; China Meteorological Press: Beijing, China, 1988. [Google Scholar]
- Yin, X.; Kropff, M.J.; McLaren, G.; Visperas, R.M. A nonlinear model for crop development as a function of temperature. Agric. For. Meteorol. 1995, 77, 1–16. [Google Scholar] [CrossRef] [Green Version]
- Matthews, R.B.; Hunt, L.A. GUMCAS: A model describing the growth of cassava (Manihot esculenta L. Crantz). Field Crops Res. 1994, 36, 69–84. [Google Scholar] [CrossRef]
- Hodges, T. Predicting Crop Phenology; CRC Press: Boca Raton, FL, USA, 1990. [Google Scholar]
- Bouman, B.A.M.; Kropff, M.J.; Tuong, T.P.; Wopereis, M.C.S.; ten Berge, H.F.M.; van Laar, H.H. ORYZA2000: Modeling Lowland Rice; International Rice Research Institute: Los BanÄos, PI, USA; Wageningen University and Reserarch Centre: Wageningen, The Netherlands, 2001; Volume 1. [Google Scholar]
- Gao, L.; Li, L. Meteorological Ecology for Rice; China Agricultural Press: Beijing, China, 1992. [Google Scholar]
- Allen, R.G.; Pereira, L.S.; Raes, D.; Smith, M. Crop Evapotranspiration: Guidelines for Computing Crop Water Requirements; FAO Irrigation and Drainage Papers; FAO: Rome, Italy, 1998; Volume 56, p. 300. [Google Scholar]
- Liu, Q.; Zhong, Z. The effects of water resources supply on clonal growth in Pleioblastus Maculata population. Acta Phytoecol. Sin. 1996, 20, 245–254. [Google Scholar]
- Ye, Q.; Yang, X.G.; Dai, S.W.; Li, Y.; Guo, J.P. Variation Characteristics of Hydrothermal Resources Effectiveness Under the Background of Climate Change in Southern Rice Production Area of China. J. Integr. Agric. 2013, 12, 2260–2279. [Google Scholar] [CrossRef]
- Hou, G.L.; Liu, Y.F. Climate potential productivity and regionalization in China. J. Nat. Resour. 1985, 5, 60–65. [Google Scholar]
- Huang, B.W. Chinese agricultural potential productivity-photosynthetic potential productivity. Ann. Geogr. 1985, 17, 15–22. [Google Scholar]
- Jiang, X.J.; Tang, L.; Liu, X.J.; Cao, W.X.; Zhu, Y. Spatial and Temporal Characteristics of Rice Potential Productivity and Potential Yield Increment in Main Production Regions of China. J. Integr. Agric. 2013, 12, 45–56. [Google Scholar] [CrossRef]
- Yu, H.N.; Zhao, F.S. On the light and thermal resources and the crop potential productivity-taking Luancheng county of Hebei province as an example. Acta Meteorol. Sin. 1982, 40, 327–334. [Google Scholar]
- Guo, J.P.; Gao, S.H.; Pan, Y.R. Agroclimatic Potentiality Development Application and Countermeasures in Northeast China. Meteorol. Mon. 1995, 21, 3–9. [Google Scholar]
- Zhang, L.; Li, S.; Tan, F.; Guo, A.; Huo, Z. Potential agro-thermal resources dynamic for double-season rice cultivation across China under greenhouse gas emission scenarios. Theor. Appl. Climatol. 2021, 144, 67–75. [Google Scholar] [CrossRef]
- Liu, M.; Liu, A.; Deng, A.; Wang, S.; Liu, Z. Changing characteristics of heat resources of rice growing seasons in Hubei Province and its impacts on rice production. J. HuaZhong Agric. Univ. 2011, 30, 746–752. [Google Scholar]
- Ye, Q.; Yang, X.G.; Xie, W.j.; Li, Y.; Liu, Z.Q.; Dong, C.Y.; Sun, S. Tendency of use efficiency of rice growth season in southern China under the background of global warming. Sci. Agric. Sin. 2013, 46, 4399–4415. [Google Scholar]
- Lai, C.; Qian, H.; Duan, H.; Song, Q.; Yu, F.; Zhang, Y.; Zhang, J. Climate suitability of wheat-rice double cropping system in Huaihe watershed. Sci. Agric. Sin. 2011, 44, 2868–2875. [Google Scholar]
- Jiang, X.; Zhang, J.; Gao, J.; Chen, P.; Zang, Q.; Jiang, M. Characteristics of heat resources during crop growth season in Shenyang region, Liaoning province. J. Meteorol. Environ. 2011, 27, 19–24. [Google Scholar]
- Ye, Q.; Yang, X.; Li, Y.; Dai, S.; Xiao, J. Changes of China agricultural climate resources under the background of climate change. VIII. Change characteristics of heat resources during the growth period of double cropping rice in Jiangxi Province. Chin. J. Appl. Ecol. 2011, 22, 2021–2030. [Google Scholar]
- Cui, D.C. The scenario analyses of possible effect of warming climate on rice growing period. Q. J. Appl. Meteorol. 1995, 6, 361–365. [Google Scholar]
- Jiang, M.; Jin, Z.Q.; Shi, C.L.; Ge, D.K.; Zhuo, D.W. Occurrence patterns of high temperature at booting and flowering stages of rice in the middle and lower reaches of Yangtze River and their impacts on rice yield. Chin. J. Ecol. 2010, 29, 649–656. [Google Scholar]
- Gao, R.; Wang, L.; Gao, G. The trend of variation in high temperature days during 1956–2006 in China. Adv. Clim. Chang. Res. 2008, 4, 177–181. [Google Scholar]
Figure 1.
Overview of the study area. (A) Distribution of the 254 meteorological stations in southern China; (B) suitable planting area for the four rice-based cropping systems during the period of 1951–1980; (C) suitable planting area for the four rice-based cropping systems during the period of 1981–2015.

Figure 2.
Simulated vs. observed growing season length for the four study rice cultivars.

Figure 3.
Temporal variations in AHR (A), EHR (B), HRE (C) for different rice cropping system areas in southern China during 1951–2015.
Figure 3.
Temporal variations in AHR (A), EHR (B), HRE (C) for different rice cropping system areas in southern China during 1951–2015.

Figure 4.
The amount of growing season AHR during the two periods of 1951–1980 (A) and 1981–2015 (C), and the trend in growing season AHR during the two periods of 1951–1980 (B) and 1981–2015 (D) in southern China.
Figure 4.
The amount of growing season AHR during the two periods of 1951–1980 (A) and 1981–2015 (C), and the trend in growing season AHR during the two periods of 1951–1980 (B) and 1981–2015 (D) in southern China.

Figure 5.
The amount of growing season EHR during the two periods of 1951–1980 (A) and 1981–2015 (C) and the trend in growing season AHR during the two periods of 1951–1980 (B) and 1981–2015 (D) in southern China.
Figure 5.
The amount of growing season EHR during the two periods of 1951–1980 (A) and 1981–2015 (C) and the trend in growing season AHR during the two periods of 1951–1980 (B) and 1981–2015 (D) in southern China.

Figure 6.
The amount of growing season HRE during the two periods of 1951–1980 (A) and 1981–2015 (C) and the trend in growing season AHR during the two periods of 1951–1980 (B) and 1981–2015 (D) in southern China.
Figure 6.
The amount of growing season HRE during the two periods of 1951–1980 (A) and 1981–2015 (C) and the trend in growing season AHR during the two periods of 1951–1980 (B) and 1981–2015 (D) in southern China.

Figure 7.
Correlation between growing season GEHR and rice photo-thermal potential yield in southern China during the two periods of 1951–1980 (A) and 1981–2015 (B).
Figure 7.
Correlation between growing season GEHR and rice photo-thermal potential yield in southern China during the two periods of 1951–1980 (A) and 1981–2015 (B).

Figure 8.
Correlation between growing season HRE and temperature-induced potential yield reduction rate in southern China during the two periods of 1951–1980 (A) and 1981–2015 (B).
Figure 8.
Correlation between growing season HRE and temperature-induced potential yield reduction rate in southern China during the two periods of 1951–1980 (A) and 1981–2015 (B).


Table 1.
Rice varieties for the four main rice-based cropping systems.
| Rice-Based Cropping System | Rice Variety |
|---|---|
| Single rice | Hybrid rice |
| Early double rice | Medium maturity early indica + medium maturity japonica |
| Middle double rice | Late maturity early indica + hybrid rice |
| Late double rice | Hybrid rice + hybrid rice |
Table 2.
The potential growing season length for different rice varieties.
| Rice Variety | Rice Type | Potential Growing Season Length (day) |
|---|---|---|
| Hybrid rice | Shanyou II | |
| Medium maturity early indica | Yuanfengzao | |
| Late maturity early indica | Guangsi | |
| Medium maturity japonica | Nanjing 34 |
Note: N means the potential growing season length (day); ΔT means the difference between 25 °C and the mean temperature from the safe sowing date to the safe fully heading date (°C); ΔD means the number of days between April 1 and the sowing date; and ΔΦ means the difference between station latitude and 30° N.
Table 3.
Simulated rice phenology (day of the year) of different varieties for the four main rice-based cropping systems in southern China.
Table 3.
Simulated rice phenology (day of the year) of different varieties for the four main rice-based cropping systems in southern China.
| Period | Cropping System | Rice Variety | Sowing Date | Transplant Date | Booting Date | Flowering Date | Mature Date | Length of Growing Season (days) |
|---|---|---|---|---|---|---|---|---|
| 1951–1980 | SRCS | MM | 84 | 115 | 196 | 206 | 247 | 163 |
| EDRCS | EM | 78 | 108 | 151 | 160 | 187 | 109 | |
| LM | 162 | 192 | 251 | 245 | 304 | 142 | ||
| MDRCS | EM | 68 | 98 | 144 | 153 | 182 | 114 | |
| LM | 157 | 187 | 215 | 244 | 275 | 118 | ||
| LDRCS | EM | 2 | 50 | 106 | 116 | 149 | 147 | |
| LM | 124 | 154 | 205 | 216 | 244 | 120 | ||
| 1981–2015 | SRCS | MM | 84 | 114 | 190 | 199 | 238 | 154 |
| EDRCS | EM | 83 | 113 | 156 | 165 | 193 | 110 | |
| LM | 168 | 198 | 256 | 268 | 309 | 141 | ||
| MDRCS | EM | 72 | 102 | 149 | 159 | 187 | 115 | |
| LM | 162 | 192 | 248 | 260 | 300 | 138 | ||
| LDRCS | EM | 2 | 50 | 106 | 116 | 149 | 147 | |
| LM | 124 | 154 | 205 | 216 | 252 | 128 |
Note: MM: middle maturity; EM: early maturity, and LM: late maturity.
Table 4.
The cardinal (i.e., the base, maximum and optimum) temperatures for different crop development stages of rice.
Table 4.
The cardinal (i.e., the base, maximum and optimum) temperatures for different crop development stages of rice.
| Development Stages | Three Cardinal Temperature (°C) | |||
|---|---|---|---|---|
| Lower Threshold (Tb) | Upper Threshold (Tu) | Lower Optimum Range (Tob) | Upper Optimum Range (Tou) | |
| Sowing to booting | 10 | 35 | 25 | 30 |
| Booting to flowering | 22 | 35 | 30 | 33 |
| Flowering to maturity | 15 | 35 | 20 | 29 |
Table 5.
Parameters and values for rice potential yield calculation.
| Parameter | Value | Description |
|---|---|---|
| s | 0.45 | The harvest index of rice |
| Ω | 0.9 | The capacity of crop photosynthetic CO2 fixation |
| ε | 0.49 | The ratio of photosynthetic active radiation to total solar radiation on the ground |
| φ | 0.224 | The conversion efficiency from light to energy |
| α | 0.06 | The reflectance of crop canopy |
| β | 0.08 | The transmittance of crop canopy |
| ρ | 0.1 | The ineffective absorption rate (absorption rate of non-photosynthetic organs) |
| γ | 0.05 | The rate of solar above photosynthetic saturation point |
| ω | 0.3 | The respiration rate of rice |
| q | 17.8 | The energy requirement for one-kilogram dry matter formation (MJ/kg) |
| η | 0.14 | The standard water content of rice grain |
| δ | 0.08 | The mineral content of rice plant |
| f(L) | 0.56 | The correction index of daily leaf area index (LAI) |
Table 6.
Growing season AHR for different rice-based cropping systems in southern China during the two periods of 1951–1980 and 1981–2015 (unit: °C·d).
Table 6.
Growing season AHR for different rice-based cropping systems in southern China during the two periods of 1951–1980 and 1981–2015 (unit: °C·d).
| Rice Cropping System | 1951–1980 | 1981–2015 |
|---|---|---|
| SRCS | 3308 | 3105 |
| EDRCS | 5072 | 4884 |
| MDRCS | 5377 | 5407 |
| LDRCS | 5810 | 5763 |
Table 7.
The amount of growing season EHR for different rice-based cropping systems in southern China during the two periods of 1951–1980 and 1981–2015 (unit: °C·d).
Table 7.
The amount of growing season EHR for different rice-based cropping systems in southern China during the two periods of 1951–1980 and 1981–2015 (unit: °C·d).
| Rice Cropping System | 1951–1980 | 1981–2015 |
|---|---|---|
| SRCS | 1260 | 1177 |
| EDRCS | 1747 | 1719 |
| MDRCS | 1873 | 1898 |
| LDRCS | 2115 | 2093 |
Table 8.
Growing season HRE in southern China during the two periods of 1951–1980 and 1981–2015 (unit: %).
Table 8.
Growing season HRE in southern China during the two periods of 1951–1980 and 1981–2015 (unit: %).
| Rice Cropping System | 1951–1980 | 1981–2015 |
|---|---|---|
| SRCS | 37.3 | 37.2 |
| EDRCS | 33.9 | 34.7 |
| MDRCS | 34.3 | 34.5 |
| LDRCS | 36.2 | 36.1 |
Publisher’s Note: MDPI stays neutral with regard to jurisdictional claims in published maps and institutional affiliations. |
© 2021 by the authors. Licensee MDPI, Basel, Switzerland. This article is an open access article distributed under the terms and conditions of the Creative Commons Attribution (CC BY) license (https://creativecommons.org/licenses/by/4.0/).
Share and Cite
MDPI and ACS Style
Ye, Q.; Yang, X.; Xie, W.; Yao, J.; Cai, Z. Effect of Heat Resource Effectiveness Change on Rice Potential Yield in Southern China. Processes 2021, 9, 896. https://0-doi-org.brum.beds.ac.uk/10.3390/pr9050896
AMA Style
Ye Q, Yang X, Xie W, Yao J, Cai Z. Effect of Heat Resource Effectiveness Change on Rice Potential Yield in Southern China. Processes. 2021; 9(5):896. https://0-doi-org.brum.beds.ac.uk/10.3390/pr9050896
Chicago/Turabian StyleYe, Qing, Xiaoguang Yang, Wenjuan Xie, Junmeng Yao, and Zhe Cai. 2021. "Effect of Heat Resource Effectiveness Change on Rice Potential Yield in Southern China" Processes 9, no. 5: 896. https://0-doi-org.brum.beds.ac.uk/10.3390/pr9050896
Note that from the first issue of 2016, this journal uses article numbers instead of page numbers. See further details here.