Article

Dark Fermentation of Sweet Sorghum Stalks, Cheese Whey and Cow Manure Mixture: Effect of pH, Pretreatment and Organic Load

by
Margarita Andreas Dareioti
1,
Aikaterini Ioannis Vavouraki
2,
Konstantina Tsigkou
1,
Constantina Zafiri
3 and
Michael Kornaros
1,*
1
Laboratory of Biochemical Engineering & Environmental Technology (LBEET), Department of Chemical Engineering, University of Patras, 1 Karatheodori Str., University Campus, 26504 Patras, Greece
2
School of Mineral Resources Engineering, Technical University of Crete, 73100 Chania, Greece
3
Green Technologies Ltd., 5 Ellinos Stratiotou Str., 26223 Patras, Greece
*
Author to whom correspondence should be addressed.
Submission received: 5 May 2021 / Revised: 28 May 2021 / Accepted: 7 June 2021 / Published: 9 June 2021

Abstract

:
The aim of this study was to determine the optimal conditions for dark fermentation using agro-industrial liquid wastewaters mixed with sweet sorghum stalks (i.e., 55% sorghum, 40% cheese whey, and 5% liquid cow manure). Batch experiments were performed to investigate the effect of controlled pH (5.0, 5.5, 6.0, 6.5) on the production of bio-hydrogen and volatile fatty acids. According to the obtained results, the maximum hydrogen yield of 0.52 mol H2/mol eq. glucose was measured at pH 5.5 accompanied by the highest volatile fatty acids production, whereas similar hydrogen productivity was also observed at pH 6.0 and 6.5. The use of heat-treated anaerobic sludge as inoculum had a positive impact on bio-hydrogen production, exhibiting an increased yield of 1.09 mol H2/mol eq. glucose. On the other hand, the pretreated (ensiled) sorghum, instead of a fresh one, led to a lower hydrogen production, while the organic load decrease did not affect the process performance. In all experiments, the main fermentation end-products were volatile fatty acids (i.e., acetic, propionic, butyric), ethanol and lactic acid.

Graphical Abstract

1. Introduction

Renewable energy production has attracted great interest from the international community during the last decades, with biomass being one of the oldest and most promising energy sources. To that end, organic wastes and by-products such as animal manures, wastewaters, energy crops, agricultural and agro-industrial residues have been extensively investigated as potential feedstocks for efficient production of biofuels. Towards a circular economy, the valorization of agro-industrial wastes, livestock wastes and by-products, and the generation of renewable energy from wastes among others, are in line with sustainable development. Anaerobic digestion (AD) is considered as an alternative waste management process that complies with the European circular economy concept [1].
Cheese whey (CW), for example, is the main by-product of cheese manufacturing containing significant amounts of carbohydrates (4–5%), mainly lactose, soluble proteins (0.6–0.8%), lipids (0.4–0.5%), lactic acid less than 1% and salts that may range from 1% up to 3% [2]. Due to its high organic content (up to 70 g Chemical Oxygen Demand (COD)/L), CW disposal contributes to environmental pollution with lactose being mainly responsible for its high COD. The small size and the seasonal production, along with the geographic dispersion of the producers, make difficult and effective management for added-value applications. Among hydrogen- and biogas-producing agro-industrial wastes, CW appears to be one of the most promising feedstocks [3]. Additionally, cow manure is one of the most polluting agro-industrial by-products. Large amounts of liquid cow manure (LCM) are usually poorly managed, while decomposing livestock manure is considered to be a targeted environmental pollutant due to its high organic matter, nutrients (i.e., nitrogen and phosphorous concentrations), methane and ammonia emissions, and also pathogens.
Sweet sorghum was mainly used as food and animal feed, while it is considered as feedstock for bioenergy production due to high concentrations of fermentable free sugars [4,5]. Sweet sorghum stalks have been examined for biogas (methane) production [6,7] as it is one of several plant species that has been identified as a potential “energy crop” for the production of liquid biofuels and biogas, due to its high crop yields and biodegradability [8,9]. Sweet sorghum’s biomass is composed mainly of cellulose, hemicellulose, and lignin, while its fraction of soluble sugars is rich in glucose and sucrose [10]. Fermentable soluble sugars are the primary source for the production of bioethanol and biogas, whereas second-generation biofuels (biogas included) may be produced through the exploitation of their content.
Ensiling is an efficient approach for sweet sorghum fermentation due to residual nutrients, sugars, and low cost. During the ensiling process, the lactic acid bacteria and water-soluble carbohydrates prevail, achieving good quality silage fermentation [11]. A lignocellulosic feedstock is characterized by complex structural composition, while usually pretreatment is required in order to remove the rigid lignin, exposing cellulose and hemicellulose. Alkali pretreatment, among others, enhances dissolution of hemicellulose and, thus, delignification of the biomass is achieved, maximizing carbohydrates solubilization [12,13].
Among conversion technologies for energy exploitation of biomass, biological processing focusing particularly on biogas production [14]. The latter has economic and environmental advantages compared to chemical (thermal) technologies. With the aim to increase both process and equipment performance, in terms of produced biogas, multiple waste streams of organic substrates can be mixed to generate a rather homogeneous feedstock for anaerobic digesters. To this end, co-digestion of different types of organic substrates, such as agro-industrial wastewaters [15] combined with energy crops [16], have been increasingly applied in order to enhance biogas production. At the same time, co-digestion of multiple feedstocks may contribute to overcoming a number of problems either of managerial types, such as seasonal availability of wastes, or, most importantly, of the microbial process itself, such as nutrient imbalance and presence of inhibiting compounds, among other factors.
In particular, the two-stage AD of organic substrates aiming at simultaneous hydrogen and methane production has been reported to provide higher process efficiency and energy recoveries as compared to the conventional one-stage AD [17]. Anaerobic acidogenesis or dark fermentation is known as the first step in the AD of soluble organic materials to hydrogen and CO2. Carbohydrates are one of the main energy booster nutrients and sources of hydrogen that fermentation processes require. Therefore wastes, energy crops, and/or carbohydrate-rich agricultural residues can be considered as potential substrates for hydrogen production [18].
Under fermentative conditions, carbohydrates degradation is accompanied by the production of hydrogen and metabolic products, mainly volatile fatty acids (VFAs) (i.e., acetic, propionic, butyric acid), lactic acid, and ethanol. The biochemical pathway(s) followed, and consequently, the production of hydrogen and fermentation end-products are highly dependent on the conditions of the process, such as pH [19,20,21], among others. A number of studies point to a pH value of 5.0 to 6.0 for maximum hydrogen yields [19,22,23].
According to observations and theoretical considerations reported in the literature, homoacetogenesis and propionic acid production would occur predominantly at pH 5.0 or higher. Homoacetogenesis is unlikely to occur at pH 5.0 or lower due to the fact that the production of acetic acid acts as an uncoupler under such conditions [24]. The production of methane is strongly related to hydrogen-consumption, under acidic conditions [25]. According to Lay [22], heat-treated inoculum may also change the microbial community during acidogenesis by developing hydrogen-producing bacteria. Thermal treatment is considered as a pretreatment process for biogas production enhancement during the AD process since organic matter degradation and methane production are significantly increased [26,27]. Several studies have been conducted for the inoculum thermal pretreatment efficiency using a variety of substrates [28].
Referring to published studies, waste streams of animal origin such as liquid swine or buffalo manure have been tested for hydrogen production via dark fermentation, combined mainly with a carbon source such as glucose, potato and pumpkin waste. More specifically, for the case of liquid swine manure and glucose at pH 5.0, a yield of 1.63 mol H2/mol glucose was achieved [29], while a mixture of potato waste, pumpkin waste and buffalo manure at pH 7.5 led to 135.6 cm3 H2/VS [30]. The dark fermentation of cheese whey could result in various yields, strongly depended on the pH value and the physicochemical characteristics of the substrate, presenting a range of 0–1.5 mol H2/mol lactose [31]. Concerning the dark fermentation of sweet sorghum and the expected hydrogen yields, a maximum of 2.6 mol H2/mol C6 sugar was achieved after alkaline pretreatment, while sweet sorghum leaves reached 213.14 L H2/kg of fermentable sugars [18]. To our knowledge, there are no studies involving such an agro-industrial waste mixture as the substrate for the process of dark fermentation.
The aim of this study was to investigate the effect of pH during dark fermentation of an agro-waste mixture consisting of CW and LCM with sweet sorghum stalks on hydrogen production and end-products (i.e., VFAs, lactic acid, ethanol) distribution. The pH values tested ranged from 5.0 to 6.5 with a 0.5 increment and were maintained constant throughout the fermentation process. This study also assessed experimentally the influence of heat-treated sludge as inoculum, the organic loading of the initial substrate, and the role of ensiled sorghum (ES) on the obtained hydrogen yield.

2. Materials and Methods

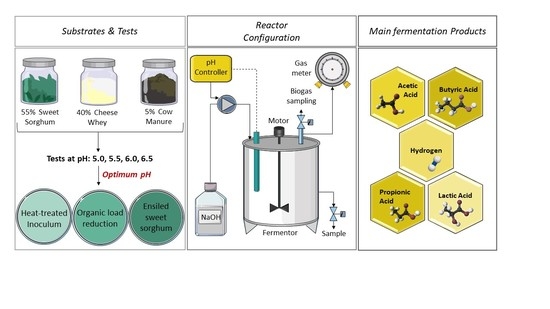
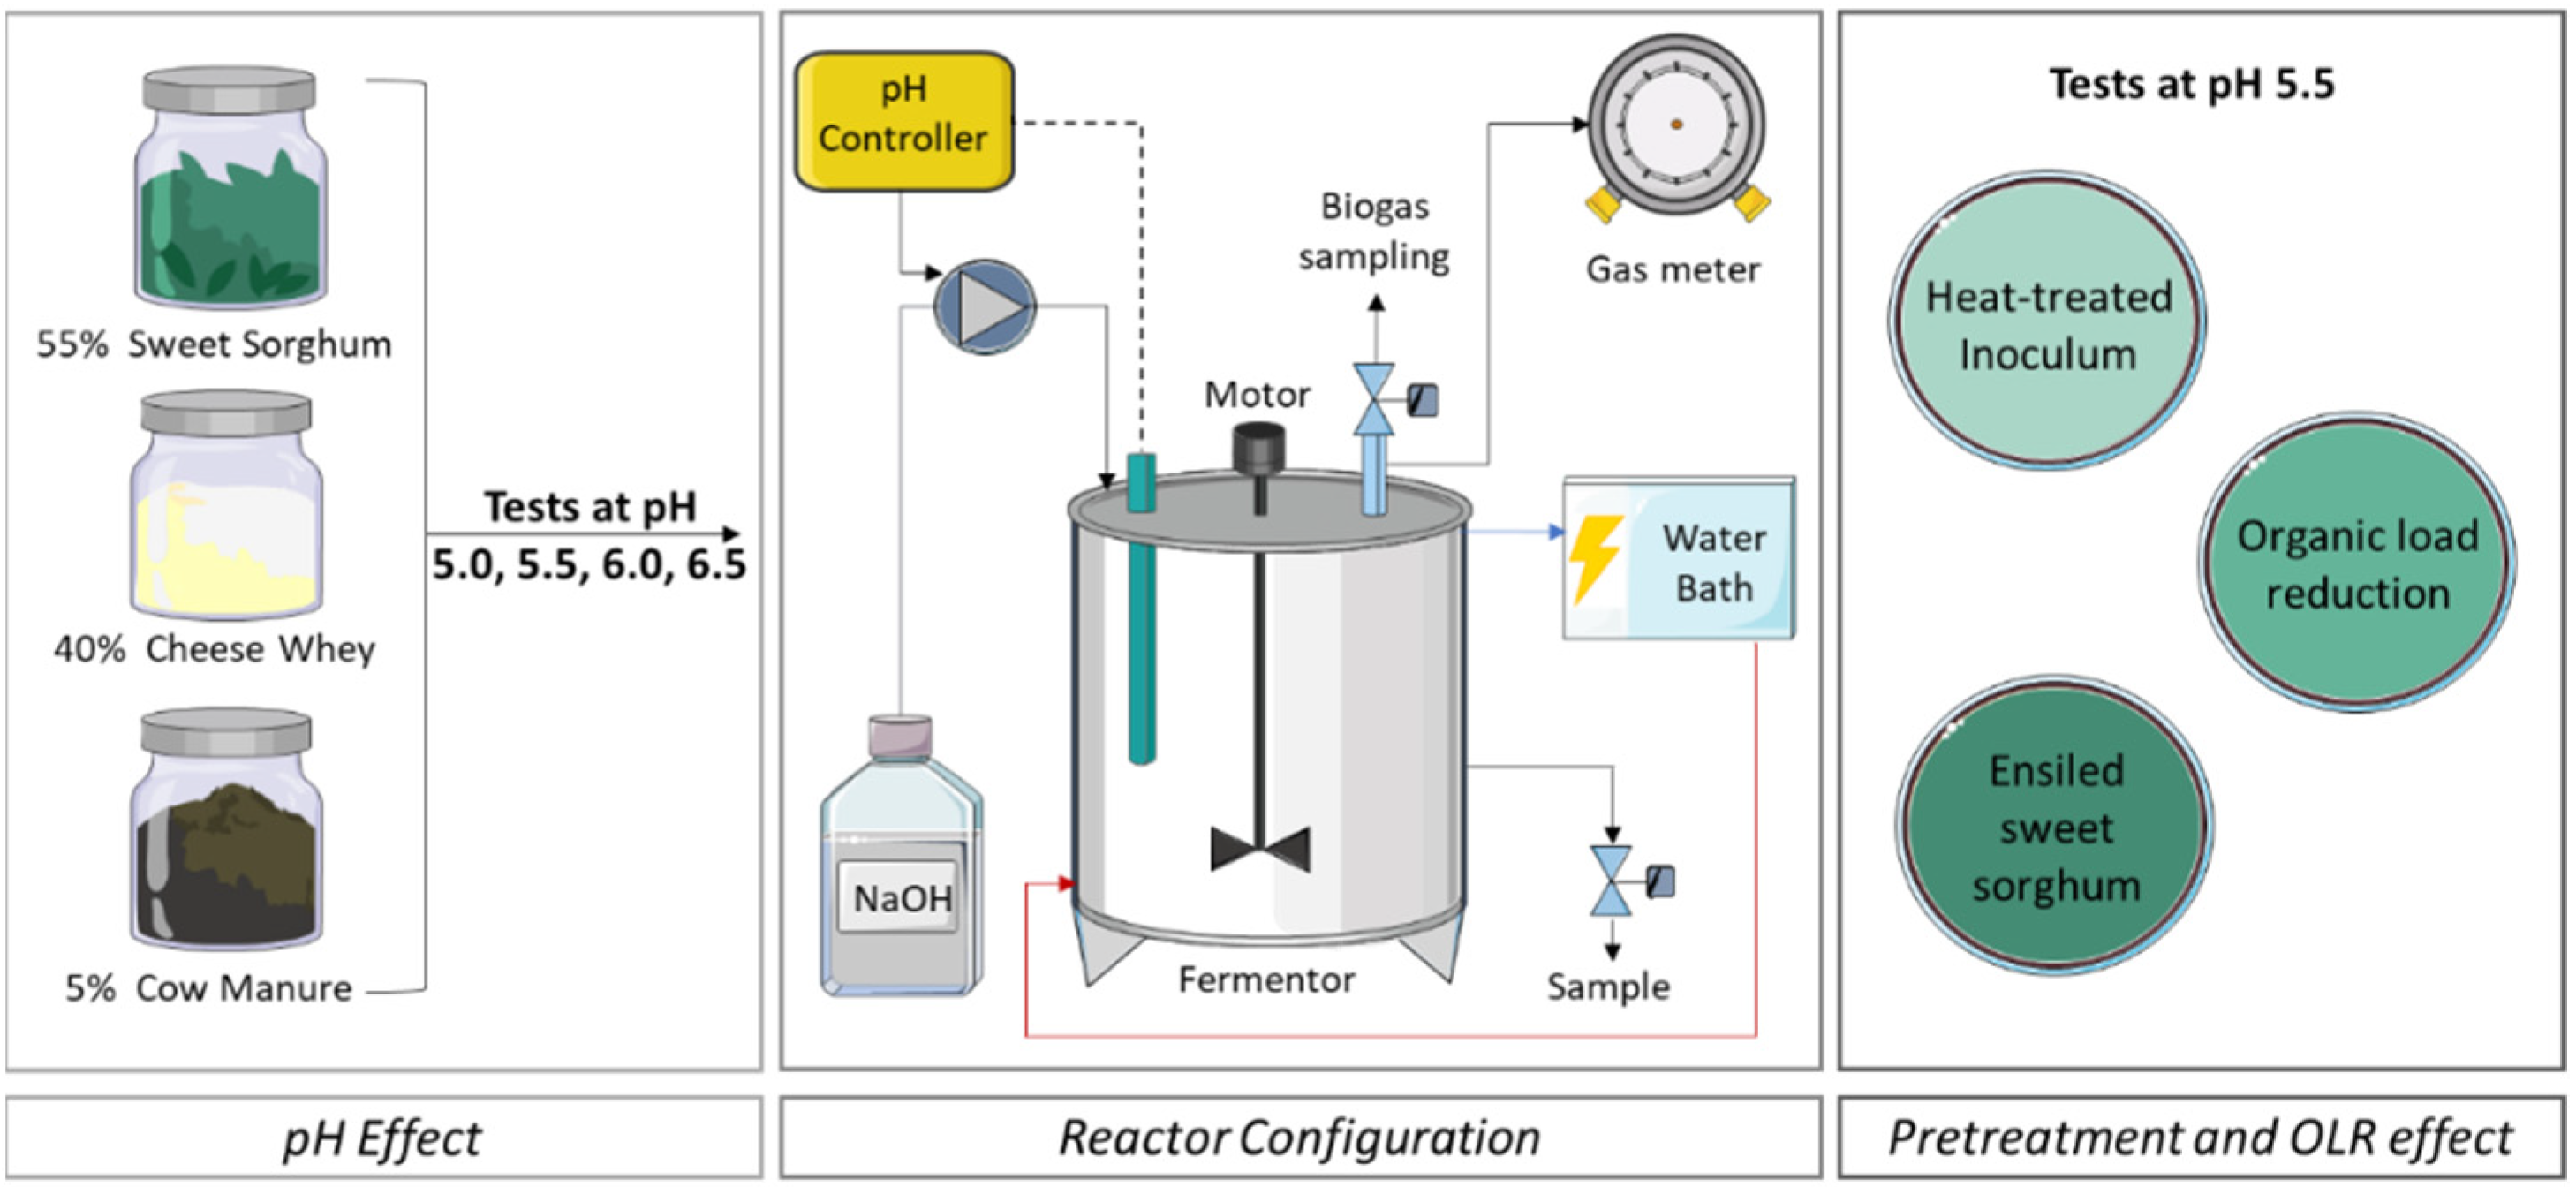
2.1. Substrates and Inoculum

The tested waste mixture in this study consisted of 55% fresh sweet sorghum stalks (FS) (suspension of 8% w/w FS dry matter in water), 40% CW, and 5% LCM (v/v/v). This study, in fact, is a sequel to a previous study in which equal organic loading was used, consisting of 55% olive mill wastewater (OMW), 40% CW, and 5% LCM [21]. The reason for using sweet sorghum in this study was to replace OMW, which exhibits seasonal availability (October to February) during a year-round operation of a biogas plant [15], and compare the two system performances as OMW consists not only of carbohydrates but also of fats/oils, which could lead to lower hydrogen production (per g VS) [32]. Additionally, anaerobic co-digestion of ES sorghum, LCM and CW [12] has already exhibited many advantages such as process stability, methane yield improvement and process feasibility due to the seasonal production of these kinds of wastewaters, as well as nutrients addition minimization.
The raw agro-wastes, i.e., CW and LCM, used in this study were collected from small local plants in the area of Patras (Western Greece). In particular, CW was provided from a cheese factory producing mainly white “feta” cheese with daily production of approximately 30 m3 of CW, while LCM was collected from a dairy farm breeding 230 cows. Following collection, both wastes were immediately stored in the freezer at −18 °C until subsequent use throughout the experimentation period. Sweet sorghum (Sorghum bicolor L. Moench var. Keller) was cultivated at the University of Patras facilities according to European regulation (EC 2092/91) and was harvested in early October. Geo-coordinates of the fields were 38°17′51.14 ″ N, 21°48′2.28 ″ E. After harvesting, the sweet sorghum was chopped into pieces (of particle size 1–3 cm), dried at 55 °C, and then ground into 1 mm particle size with a kitchen blender and sieved to powder of <315 μm diameter. A mechanical shredding step is essential to reduce particle size and increase the surface area of the sweet sorghum prior to fermentation. Acclimatized anaerobic culture seed sludge, which was obtained from a lab-scale anaerobic acidogenic continuous stirred tank reactor (CSTR) that was being fed with a mixture of 55% OMW, 40% CW, and 5% LCM (v/v/v) was used as inoculum. Prior to batch experiments, centrifugation (4500 rpm) of the inoculum was performed in order to remove the soluble part.

2.2. Experimental Conditions

All experiments were conducted in a double-walled, cylindrical stainless steel (INOX 316) fermentor under controlled temperature and stirring rate conditions. The temperature was kept constant at 37 °C (mesophilic conditions) via a thermocouple controller and the stirring rate was set at 70 rpm by a geared motor drive unit installed on the top of the fermentor, ensuring thus homogeneous mixing and facilitating rapid diffusion of the produced hydrogen. The working volume of the fermentor was adjusted to 900 mL. The amount of anaerobic sludge used as inoculum was 20% (v/v) of the working volume, while the remaining consisted of the tested waste mixture. The pH of the mixed liquor was kept constant during the experiments via automatic control (using a HACH PID-controller) by adding NaOH or HCl solution (6 N) drop-wise as constant regulated pH values during dark fermentation have exhibited higher hydrogen productivity comparing to unregulated experiments [33]. Anaerobic conditions were imposed on the culture by sparging with nitrogen gas at the beginning of each experiment.
Anaerobic batch experiments were performed in duplicate to study the acidogenesis of an agro-waste mixture of FS, CW, and LCM (in a ratio of 55:40:5, v/v/v) at different constant pH values, namely pH 5.0, 5.5, 6.0 and 6.5. When the optimum pH value was selected, based on the obtained results, additional anaerobic batch experiments were carried out to assess and compare their performance in terms of bio-hydrogen yield and acidified end-products. The following experiments were thus carried out using: (a) heat-treated enriched anaerobic sludge (100 °C for 20 min) [28] instead of the acclimatized anaerobic culture seed sludge (to assess the effect of inoculum), (b) half initial mixed substrate concentration, i.e., 17.15 g total carbohydrates/L (to assess the effect of initial organic loading) and (c) pretreated sorghum (ensiled), instead of a fresh one. The ES pretreatment was performed at a constant temperature of 80 °C for 120 min with the addition of alkaline solution 1.0% NaOH and 1.0% KOH (w/w) (optimum conditions for the pretreatment of ensiled sorghum, ES) [12]. The reactor configuration and the sets of experiments are described in detail in Figure 1.

2.3. Analytical Methods

Detailed physicochemical characterization was performed in all raw agro-waste streams (in triplicate) and fermented effluents (fermentation end-products, in duplicate). The off-line pH measurements were carried out using an electrode (Thermo Scientific Orion 3-star benchtop pH meter. Total Suspended Solids (TSS), Volatile Suspended Solids (VSS), Total Solids (TS), Volatile Solids (VS), total and soluble COD, Biochemical Oxygen Demand (BOD5), Total Kjeldahl Nitrogen (TKN), ammonium nitrogen, total and ortho—phosphates and alkalinity were determined according to Standard Methods for the examination of Water and Wastewater [34]. Concerning the TSS/VSS measurement and the soluble characteristics (soluble organic carbon (SOC), lactic acid, VFAs, etc.), the insoluble residue was separated from the supernatant by filtration (Whatman® glass microfiber filters Grade GF/F (GE Healthcare Life sciences, Chicago, Illinois, USA)). Carbohydrates determination was accomplished after colorimetric measurement of a colored sugar derivative, which was produced through the addition of L-tryptophan, sulfuric and boric acid [35]. Total organic carbon (TOC) and SOC were analyzed with a Carbon TOC-V analyzer (Shimadzu, Kyoto, Japan). Composition analysis of VFAs, ethanol, biogas and lactic acid were measured by Gas (Agilent, CA, USA) and Ion (Dionex, CA, USA) Chromatography as described in detail by Dareioti et al. [21]. Briefly, for the VFAs and ethanol determination, a capillary column (DB-FFAP, 30 m in length, 0.25 mm I.D. and 0.25 mm film) and a flame ionization detector were used, while for the biogas composition a capillary column (HP-PLOT/Q, 30 m in length, 0.53 mm I.D. and 40 mm packing film) and a thermal conductivity detector were used. Lactic acid was measured using an analytical column (AS19 length 4 × 250 mm and 7.5 mm I.D.), a guard column (4 × 50 mm length and 12 mm I.D.) and an electron conductivity detector.
Cellulose, hemicellulose and lignin content of dried sweet sorghum were measured according to the NREL method [36] and high-performance liquid chromatography (HPLC) analysis [37]. Structural carbohydrates (i.e., glucose, xylose, arabinose) were determined, and the cellulose and hemicellulose contents estimation followed (Equations (1) and (2)):
Cellulose (% VS) = Glucose (% VS)/1.11
Hemicellulose (% VS) = [Xylose (% VS) + Arabinose (% VS)]/1.13
where: 1.11 represents the ratio of the molecular weights of glucose to glucan (180/162), whereas 1.13 represents the ratio of the molecular weights of xylose and arabinose to xylan (150/132).
Total biogas and hydrogen volume, produced during each experiment, was converted at standard temperature and pressure conditions (STP) (0 °C and 1 atm).

3. Results and Discussion

3.1. Chemical Composition of Each Substrate
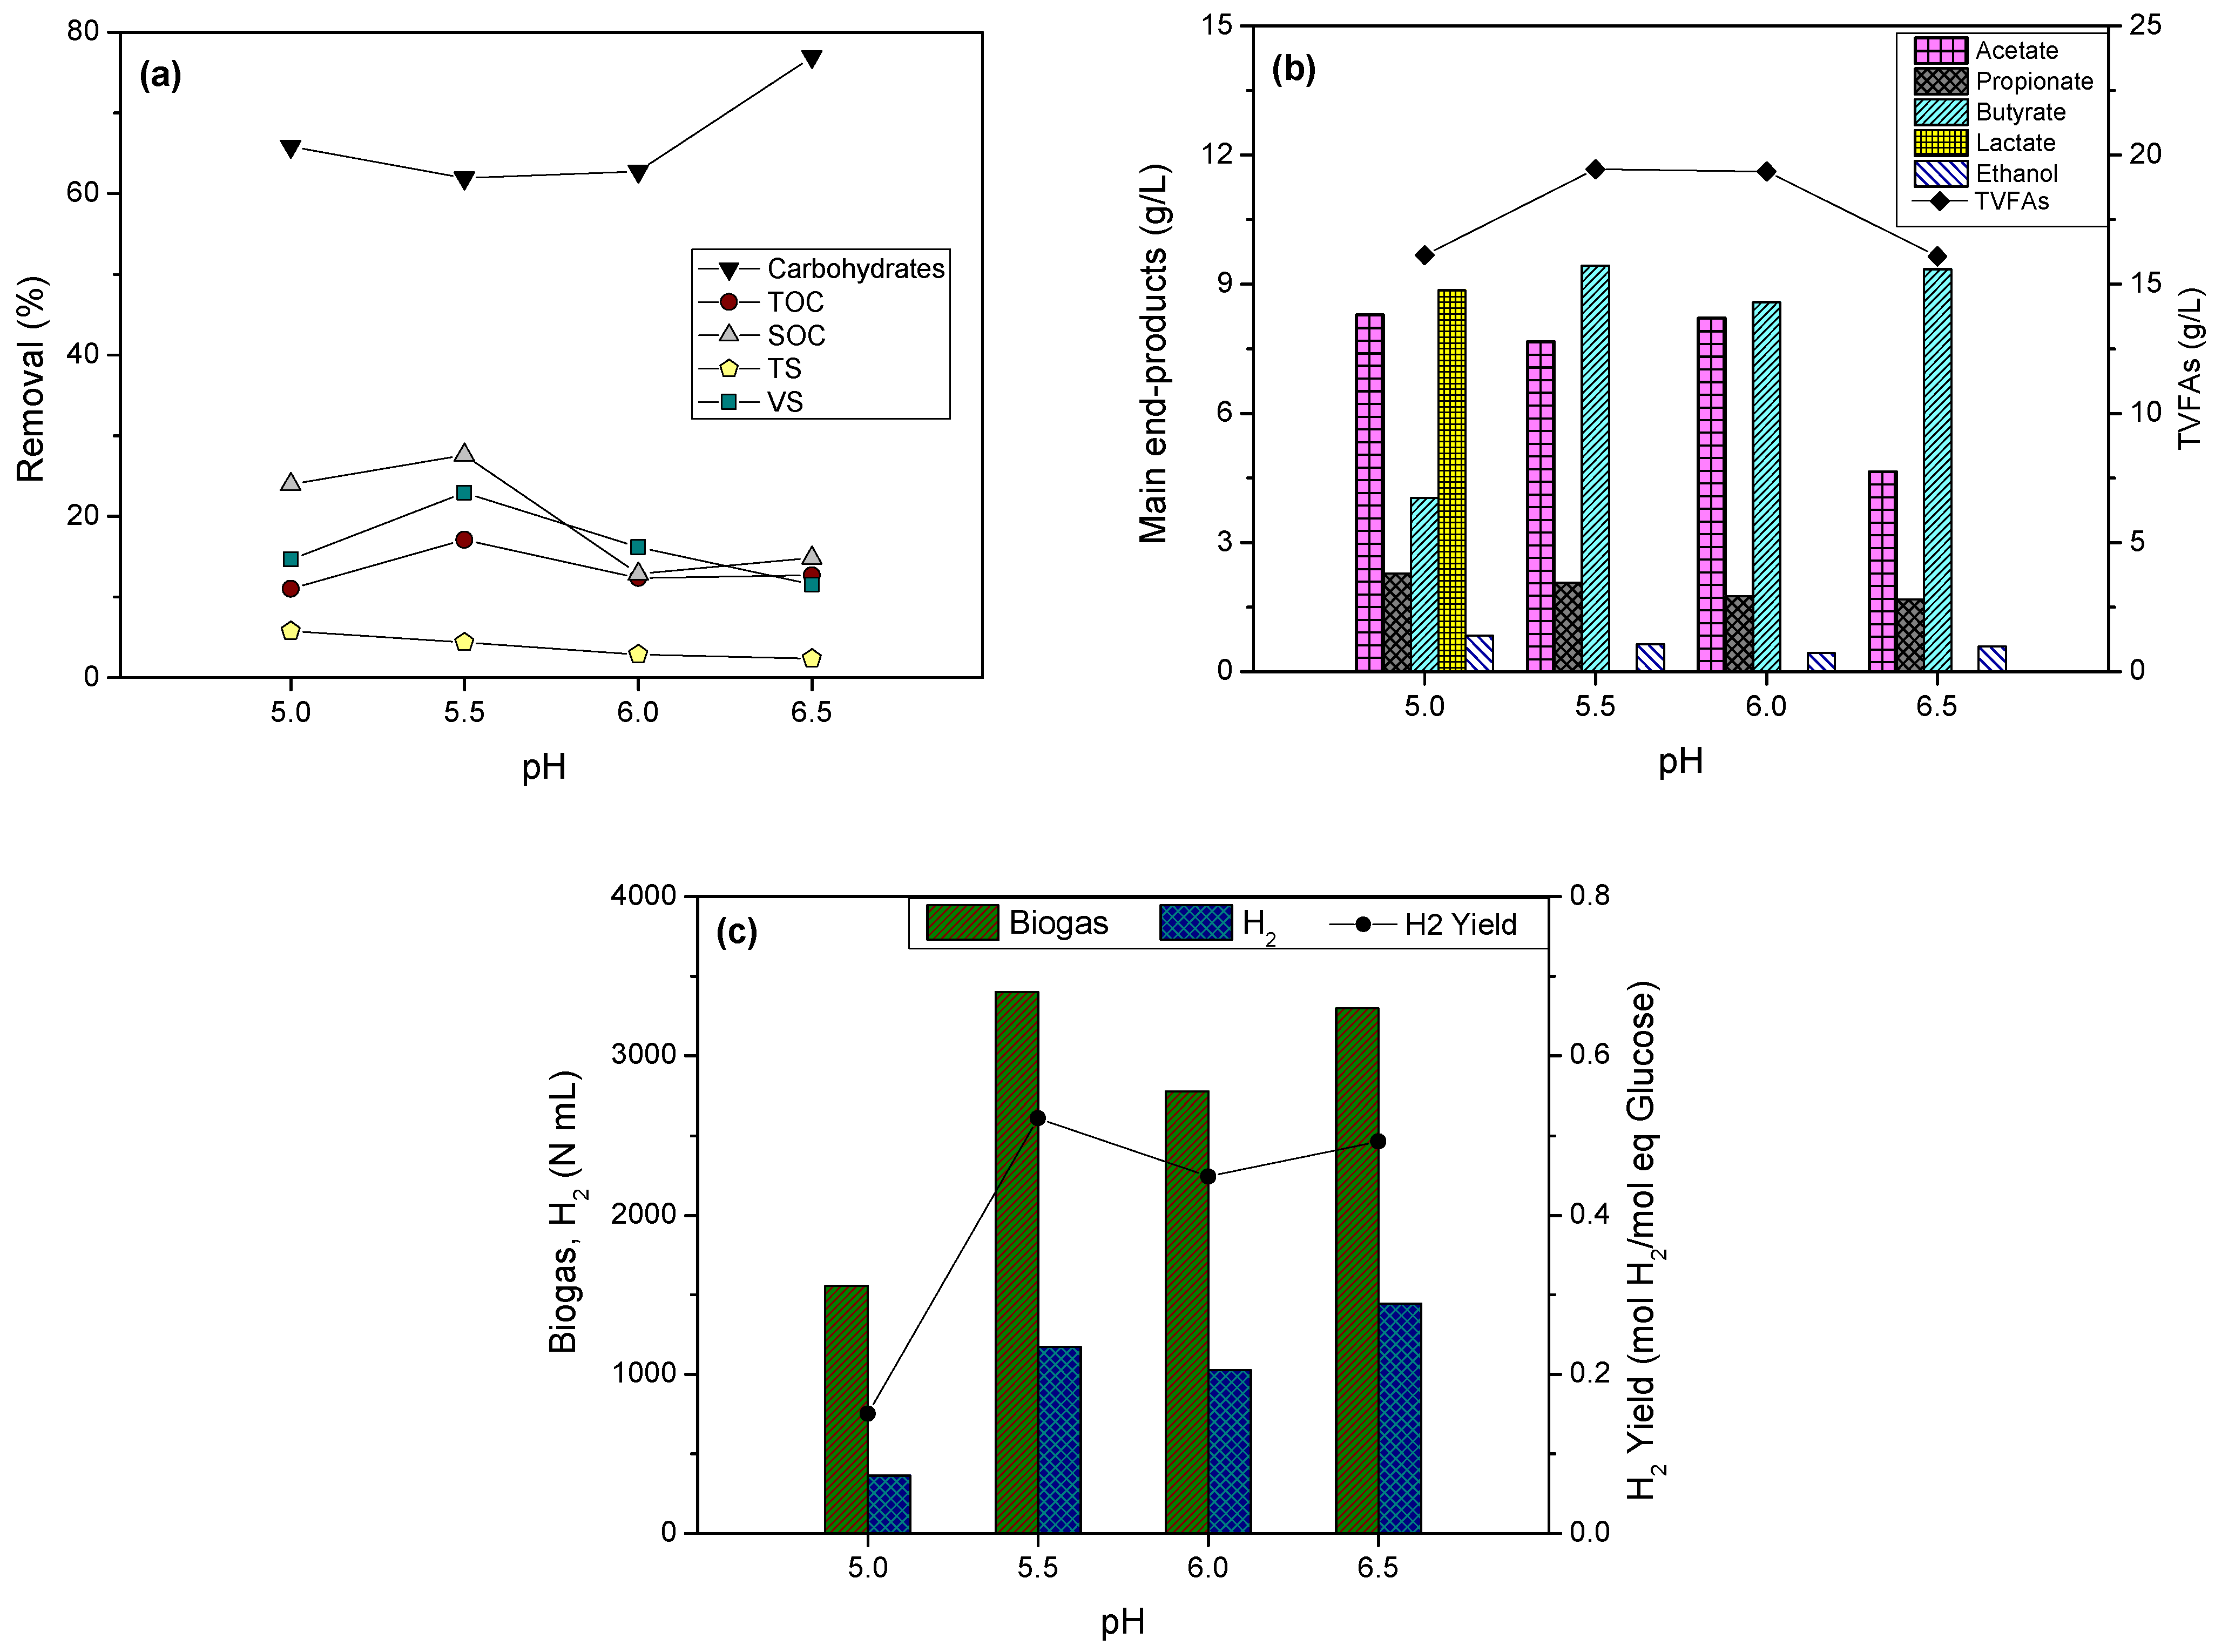
Prior to experiments, chemical composition characterization of each substrate was performed. Table 1 presents the average values obtained during the CW and LCM characterization, whereas the chemical composition of FS and ES, after drying and milling, is given in Table 2. In particular, CW can be described as a high organic load waste stream, mainly due to its carbohydrates (lactose) content, whereas LCM was characterized by a high concentration of VFAs and nitrogen. The physicochemical characteristics of both substrates are similar to other studies [12,38]. Sweet sorghum mainly consisted of soluble and insoluble polysaccharides (cellulose and hemicellulose) and high lignin content. During the ensiling procedure, soluble carbohydrates are converted mainly to lactic acid and ethanol by fermentative bacteria [39]. Thus, the amount of soluble carbohydrates in the ES was low, whereas lactic acid and ethanol were present.

3.2. Effect of pH

Batch experiments were carried out using a mixture of agro-wastes at a ratio of 55% FS, 40% CW and 5% LCM (v/v/v) in order to assess the effect of pH on bio-hydrogen production and the composition of dark fermentation end-products. The pH of the agro-industrial waste mixture was controlled at 5.0, 5.5, 6.0 and 6.5. At regular intervals (4 ± 2 h), samples were withdrawn for composition analysis, i.e., determination of carbohydrates, lactic acid, VFAs, ethanol, etc. Qualitative and quantitative composition analysis of produced biogas was performed throughout the course of each experiment. The consumption of total carbohydrates was high in all pH values tested (Figure 2a), with a maximum carbohydrates’ degradation of 77% at pH 6.5. However, the soluble carbohydrates consumption was similar (~95–96%) at all pH values (data not shown), suggesting that the microorganisms’ ability to consume carbohydrates was not altered within this pH range. The dominant soluble end-products were VFAs (i.e., acetic, propionic, butyric), ethanol and lactic acid in all pH values tested (Figure 2b). Both acetic and butyric acid are well-known metabolites in the anaerobic hydrogen fermentation of carbohydrates, whereas propionic acid is considered an undesirable product of hydrogen fermentation [40]. Acetic and butyric acid were the most abundant end-products at each pH (except pH 5.0), whereas the concentrations of propionic acid and ethanol were substantially lower (<2.3 g/L and 0.9 g/L, respectively). Limited amounts (<0.25 g/L) of i-butyric, valeric, i-valeric and caproic were detected in all tests. Accumulation of lactic acid, as an intermediate product, was observed at pH 5.0 (8.86 g lactic acid/L), whereas at higher pH it was metabolized during the process and thus not detected at the end of each batch test (Figure 2b). Lactate accumulation at pH 5.0 accompanied by low or no H2 production has been also observed during the dark fermentation of municipal solid wastes using mixed culture as inoculum [41,42]. As depicted in Figure 2b, the distribution of main soluble end-products was similar at all pH values, apart from pH 5.0. Hence, at these pH values, biogas and hydrogen productivity was also approximately at the same level (Figure 2c). Figure 2a presents additional results at each pH tested, including organic carbon and solids’ degradation.
As shown, the highest degradation of TOC was obtained at pH 5.5 (17.1%), as well as VS degradation (22.9%). Taken together, these data show that the pH value of 5.5 is the most suitable in terms of hydrolysis. Hydrogen yield (calculated as mol H2/ mol carbohydrate consumed) is a good indicator for the effectiveness of hydrogen production and represents the capability of microorganisms to convert carbohydrates into hydrogen gas. Figure 2c presents the net hydrogen yield (mol H2/mol eq. glucose of total consumed carbohydrates) at each pH tested. The maximum hydrogen yield of 0.52 mol H2/mol eq. glucose was observed at pH 5.5, which is considered satisfactory since similar tests with untreated seed sludge generally exhibit low H2 productivity (<1 mol H2/mol glucose) [31]. The results indicate that pH had indeed an effect on hydrogen yield and, thus, pH adjustment during dark fermentation of the studied agro-industrial mixture may determine the type of anaerobic fermentation pathway followed during the anaerobic bio-hydrogen process.
In literature, many studies have been presented about the effect of initial and controlled pH on hydrogen production using many different substrates, including the substrates used in this article, as mono substrates. Many of them are in line with the results of the present study, where the optimum pH concerning the H2 yield appeared to be 5.5, with similar behavior up to pH 6.5. For instance, in the study of Van Ginkel et al. [23], the highest rate of hydrogen production (74.7 mL H2/LR·h) using sucrose and a heat-treated inoculum was observed at pH 5.5. Similarly, the maximum hydrogen content of 26.9% and production rate of 31.8 mL H2/h were observed at pH 5.5 by Hernández and Rodríguez [43] who studied pig manure fermentation in an anaerobic batch reactor. Fang and Liu [19] studied the conversion of glucose to hydrogen at different pH values (4.0 to 7.0) and suggested that pH 5.5 was the optimum with the highest hydrogen content (64.2%) and yield of 2.1 ± 0.1 mol H2/mol glucose. However, Davila-Vazquez et al. [3] studied the effect of initial pH (3.88–8.12) on hydrogen production using three different substrates, namely lactose, CW powder and glucose. pH 7.5 was found as the optimum for lactose and glucose, whereas pH 6.0 was suggested for the CW powder. According to Elbeshbishy et al. [20], one of the most critical factors of dark fermentation is pH due to the end-products determination, the microbial community structure, and the catalysis of intracellular metabolism. In order to enhance H2 production and avoid inhibition, pH maintenance with an optimum range is of great importance. On the other hand, as various inhibitors of dark fermentation have been identified, co-fermentation of several feedstocks could control or even minimize inhibition by factors such as nutrients, organic load [42] or toxic compounds [44].
Figure 3 displays the batch experimental results at the optimum pH 5.5. Figure 3a presents the concentration of total and soluble carbohydrates over the fermentation process, indicating that the achieved degradation was 62.8% and 96.1%, respectively. 90% of total carbohydrates’ degradation was accounted for by the degradation of soluble ones, whereas the rest (10%) was due to hydrolysis and degradation of particulate carbohydrates. The carbohydrate fermentation contributed to the increase of VFAs, lactic acid, and ethanol concentrations (Figure 3b). The most abundant metabolic products were lactic and acetic acid during the first 10 h of the batch experiment. Significant accumulation of butyric acid (~9.5 g/L) was observed after a period of 10 h, as a result of lactic acid bioconversion, which was also accompanied by simultaneous production of hydrogen (Figure 3c). The produced biogas consisted exclusively of hydrogen and carbon dioxide. No methane was observed in any of the batch experiments that were conducted although LCM was used in the mixture. The complete absence of methane could be attributed to a number of reasons with the most valid ones being the use at a very low percentage (5% v/v) of a rather recalcitrant to biomethanization substrate (LCM), fermented under acidic conditions. Herein, it can be mentioned that pH can exert remarkable effects on end-products distribution. For instance, at the lowest pH tested in this study (5.0) accumulation of lactic acid, without further bioconversion, was observed due to kinetic limitations in the reactions converting lactic acid to butyric acid and subsequently to hydrogen production.
Taking into account the results obtained in this work and the concept of biorefinery, in which the best compromise between hydrogen and VFAs production has to be considered in an integrated way aiming to maximize energy production in the overall system comprising of an acidogenic and methanogenic reactor, the pH 5.5 was considered as optimum for further work. Moreover, the use of pH 5.5 implies the use of a lower amount of alkaline solution for pH control, leading to lower cost and minimum potential inhibition to the subsequent step of methanogenesis due to sodium cations’ presence compared to operation at higher pH values [45].

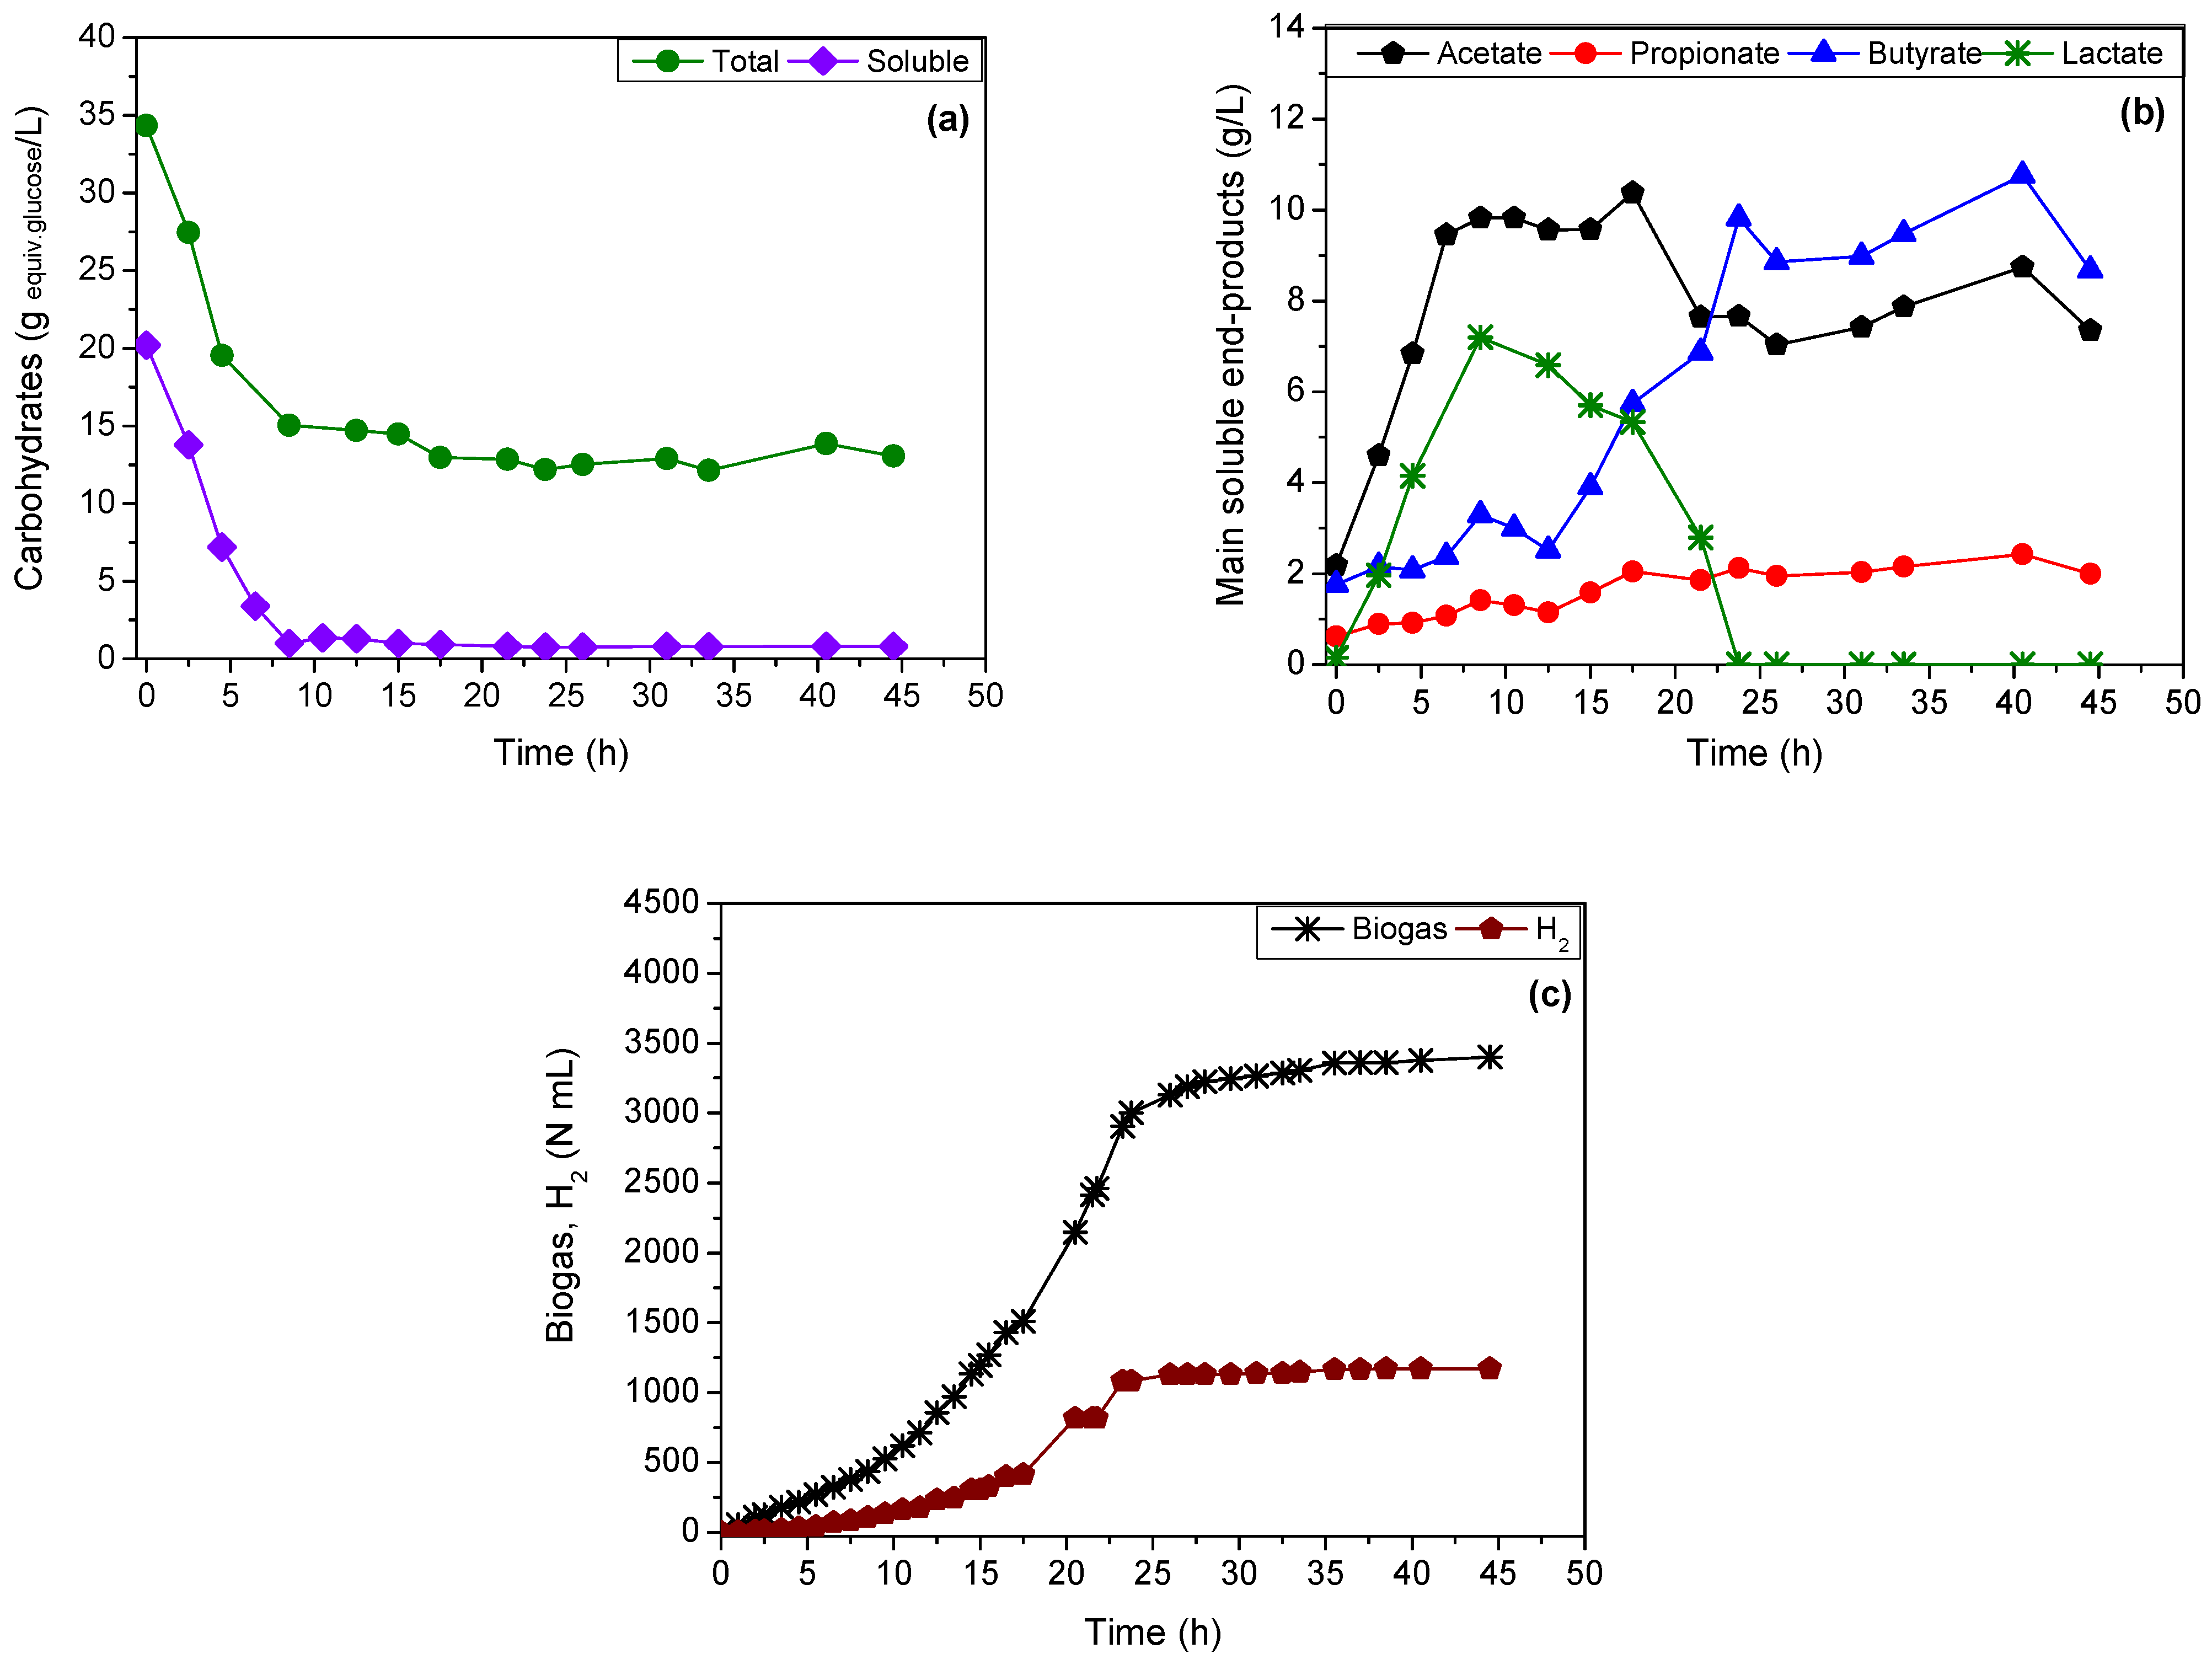
3.3. Kinetic Analysis

It is well known that lactic acid is produced from glucose via three metabolic pathways, i.e., the homofermentative (Equation (3)), the heterofermentative (Equation (4)) and the bifidum pathway (Equation (5)). In all three pathways, the hydrogen balance is zero, i.e., no hydrogen is consumed nor produced.
Lactic acid, as a major intermediate soluble product, may also decompose to acetic and propionic acid (Equation (6)) [46] or to butyric acid accompanied by simultaneous production of hydrogen via the following metabolic pathway (Equation (7)) [21,47].
In the batch experiments conducted in this study, lactic acid depletion was accompanied by a simultaneous consumption of acetic acid and hydrogen. According to Bhat and Barker [48], in the C. kluyveri fermentation, butyric acid may be formed by condensation of two moles of acetic acid with two moles of hydrogen (Equation (8)). Dareioti et al. [21] reported briefly, using mass balance calculations, the bioconversion of acetic acid and hydrogen to butyric acid.
C6H12O6→2CH3CH(OH)COOH
C6H12O6→CH3CH(OH)COOH + CH3CH2OH + CO2
2C6H12O6→3CH3COOH + 2CH3CH(OH)COOH
3CH3CH(OH)COOH→2CH3CH2COOH + CH3COOH + CO2 + H2O
2CH3CH(OH)COOH→CH3CH2CH2COOH + 2CO2 + 2H2
2CH3COOH + 2H2→CH3CH2CH2COOH + 2H2O
Taking into account the transformation pathways (Equations (3)–(8)), the experimental data obtained at the optimum pH (5.5) of this study were used to calculate mass balances in order to estimate the pathways that result in hydrogen production under these conditions (Table 3). In order to facilitate calculations, they were carried out before and after the peak detection of lactic acid (8.5th h). Firstly, the contribution of each pathway (Equations (3)–(5)) to the production of intermediates was investigated (0–8.5 h). Ethanol formation was attributed to glucose degradation via the heterofermentative pathway (Equation (4)) with simultaneous lactic acid production (Table 3, Reaction (2)). On the other hand, the produced acetic acid was attributed to the bifidum pathway (Equation (5)), whereas the rest glucose was decomposed to lactic acid via the homofermentative pathway (Equation (3)). Moreover, in the first period of the experiment (0–8.5 h), a slight lactic acid depletion was observed. The propionic acid formation was attributed to lactic acid bioconversion with simultaneous acetic acid production, according to Equation (6) (Table 3, Reaction (4)). Butyric acid production was correlated with lactic acid degradation with simultaneous hydrogen production (Table 3, Reaction (5)) and also, with acetic acid and hydrogen depletion (Table 3, Reaction (6)). An error of 6.48% was calculated in the mass balances of lactic acid accumulation, which is attributed to the complexity of microbial populations present in the mixed culture used in our experiments.
A calculation was then carried out at the second phase of the experiment (8.5–44.5 h), where lactic acid bioconversion with simultaneous hydrogen production mainly took place. The continued degradation of carbohydrates after the 8.5th h till the end of the experiment was calculated in the same way as described in the first period, in order to estimate the further lactic and acetic acid production (Table 3, Reactions (7)–(9)).
Equation (6) was used in order to correlate the propionic acid production via lactic acid consumption (Table 3, Reaction (10)), whereas the rest of lactic acid was decomposed to butyric acid and hydrogen, according to Equation (7) (Table 3, Reaction (11)). Finally, an additional calculation was carried out regarding acetic acid depletion with the corresponding hydrogen towards the rest of butyric acid production (Table 3, Reaction (12)). According to Table 3, marginal errors of 3.89% and 0.57% were estimated in the mass balances of acetic acid and hydrogen, respectively, which however, can be partially attributed to experimental errors and also to biomass production, which was not encountered in all calculations.

3.4. Heat-Treated Inoculum

In an attempt to estimate the effect of inoculum pretreatment on hydrogen productivity, a batch experiment was performed at the optimum pH 5.5, using heat-treated enriched anaerobic sludge (Figure 4a–c), which could potentially enhance the sludge’s Clostridia characteristics [22]. The total and soluble carbohydrates consumption during the course of this experiment is presented in Figure 5a, reaching up to 58.9% and 94.9%, respectively, which is almost similar to the ones obtained with untreated inoculum. The main metabolic end-product observed was butyric acid (Figure 4b), which was produced from the bioconversion of lactic acid, while the concentration of acetic acid was substantially lower than in the previous batch experiments. The pretreatment of inoculum prior to fermentation led to different metabolic pathways via killing or inactivating one or more bacterial types presented in a typical anaerobic mixed culture. Such types usually refer to non-spore-forming bacteria, while Clostridium, Bacillus (spore-forming bacteria) and acetic/propionic/lactic acid bacteria are able to survive. Hydrogenotrophic methanogens as well as Enterobacter or Citrobacter, which are hydrogen-producers are also eliminated [49]. In particular, a significant accumulation of lactic acid (13.7 g lactic acid/L) was realized during the first 30 h of the experiment, whereas acetic acid production of 1.6 g/L was also observed. This indicates a change in the main metabolic pathway followed towards homofermentation. The lactic acid concentration was almost two-fold the one measured in the previous experiments which resulted in higher production of butyric acid with simultaneous hydrogen production (Figure 4c). The experimental results are in accordance with the aforementioned information about the microbial changes.
In Table 4 the mass balance calculations, obtained in the same way as described in the previous batch, are reported using the experimental data of batch with heat-treated inoculum. The calculations were also carried out before and after the peak detection of lactic acid (30.5th h). As previously mentioned, the main metabolic pathway of glucose degradation was homofermentation (Table 4, Reaction (1)). Consequently, a higher concentration of lactic acid was observed compared to the previous batch experiments with untreated inoculum. Moreover, in the first period (0–30.5 h) no lactic acid bioconversion was observed, which occurred only in the second phase (30.5–139.5 h). Using mass balance calculations, a negligible error of 1.74% was obtained from the bioconversion of lactic acid. In the second period of the experiment (30.5–139.5 h) similar calculations were conducted, revealing higher hydrogen production, due to the higher lactic acid amount, compared to the experiment with untreated sludge that was carried out at pH 5.5. The heat-treated inoculum resulted in equal carbohydrate consumption compared to the test at pH 5.5 with untreated inoculum. However, even if the produced main end-products were decreased, the H2 yield increase because of the different metabolic pathways (Figure 5).
Clostridium species are considered to be the dominant microorganisms responsible for butyric acid fermentation [50]. It has been widely reported that heat-treatment is one of the most promising established methods able to eradicate bacteria in inoculums, that have an adverse effect on hydrogen fermentation and to accelerate thus an enrichment of microbial population with hydrogen-producing bacteria, such as Clostridium species, which are highly tolerant to extreme environments due to their spore-forming ability [49,51]. Indeed, the overall hydrogen yield estimated in this test was increased (1.09 mol H2/mol eq. glucose) compared to the previous experiments where untreated inoculum was used (0.52 mol H2/mol eq. glucose).
This is in agreement with previous studies mentioned by Wong et al. [28], where untreated and heat-treated inocula of the same origin were compared regarding their efficiency in hydrogen production. More specifically, for most of the reported tests, the H2 yield of the heat-treated inoculum was usually two to four times higher compared to the untreated inoculum tests. On the contrary, only a few studies mention lower H2 yields after the heat-pretreatment of the inoculum (compared to the corresponding yield of untreated inoculum). Indicatively, according to Dessi et al. [51], the H2 efficiency decreased almost four times after the heat shock of the inoculum, for the thermophilic batch dark fermentation of xylose. In a recent study by Słupek et al. [52], it was shown that higher concentrations of hydrogen and methane were obtained during the dark fermentation process under mesophilic conditions than in the process under thermophilic conditions.

3.5. Initial Organic Load

A batch experiment with half the initial organic load (17.15 g total carbohydrates/L) was conducted at the optimum pH 5.5 in order to assess substrate inhibition phenomena to hydrogen and VFAs production. The evolution of carbohydrates consumption, soluble main end-products, and biogas production are presented in Figure S1 (Supplementary Material). Based on our results, no effect of the initial organic load was identified, as the hydrogen yield (0.53 mol H2/mol eq. glucose) was almost the same, compared to the previously conducted batch experiment at pH 5.5 (0.52 mol H2/mol eq. glucose) (Figure 5a). The hydrogen yield was calculated in this work for initial soluble carbohydrates concentration (20.2 g carbohydrates/L, as shown in Figure 5a). Such behavior usually indicates that, under conditions, a higher organic load may become inhibitory due to acid production or increased hydrogen partial pressure. However, the aforementioned results do not lead to a clear conclusion as the system performance also depends on other factors such as the inoculum origin, the type, and the composition of the substrate [20]. Hence, avoidance of such inhibitory conditions is considered mandatory for the achievement of maximum hydrogen conversion efficiency and production rate at high substrate concentrations. Few studies have suggested that higher hydrogen molar yield was found at low organic load [3], whereas high initial substrate concentration caused high initial hydrogen production, increased hydrogen partial pressure and acid toxicity or pH inhibition. Slezak et al. [53] found the highest hydrogen yield (76.1 mL/g VS) using kitchen wastes at an organic load of 14.3 g VS/L, after several tests ranging from 4.1 to 48.2 g initial VS/L, while Rangel et al. [54] attained the maximum hydrogen yield treating residual biomass at an initial organic load of 10 g VS/L and an inoculum to substrate ratio of 1. Based on the results of the current study, it is considered that the inhibitory/toxic thresholds are specific to each system, depending on the type of substrate and inoculum used, while it seems that for the current tested organic load the inhibitory threshold was not reached.

3.6. Effect of Ensiled Sorghum

The effect of using sweet sorghum obtained following an ensiling procedure, instead of a fresh one, on hydrogen production was also assessed in this study. The experiment was conducted at constant controlled pH of 5.5. Figure S2a illustrates the total and soluble carbohydrates bioconversion to soluble (Figure S2b) and gaseous (Figure S2c) end-products during the fermentation (Supplementary Material). 52.2% removal of total carbohydrates and 88.2% of soluble ones were observed during this experiment as can be seen in Figure 5a. The distribution of end-products was quite similar to the experiment with FS. The most abundant metabolic end-products were acetic and butyric acid, whereas lactic acid was initially accumulated (reaching 4.9 g/L) and then metabolized to butyric acid. However, hydrogen production in this experiment (Figure 5b) was lower (694.5 mL) than the H2 production obtained in the previous similar experiment conducted with FS, most probably due to the significantly lower content of carbohydrates (Table 2). As a result, the calculated hydrogen yield was thus also lower (0.37 mol H2/mol eq. glucose) compared to the one obtained with FS (Figure 5b).

4. Conclusions

Batch experiments were carried out in order to investigate the effect of pH on hydrogen production and the distribution of end-products. The maximum hydrogen yield (0.52 mol H2/mol eq. glucose) was observed at pH 5.5 accompanied by the highest VFAs production, although similar hydrogen productivities were also realized in pH 6.0 and 6.5. No substrate inhibition was identified, as the half organic load test exhibited the same yield. Heat-treated inoculum resulted in twofold hydrogen yield (1.09 mol H2/mol eq. glucose) compared to the use of typical inoculum most probably due to partial inactivation or death of hydrogen-consuming microbial populations. On the other hand, utilization of ES instead of fresh one led to limited hydrogen yield, leading to the conclusion that the inoculum heat-treatment and fresh sorghum use are of great importance for the maximization of hydrogen yields.

Supplementary Materials

The following are available online at https://0-www-mdpi-com.brum.beds.ac.uk/article/10.3390/pr9061017/s1, Figure S1: (a) Consumption of carbohydrates; (b) evolution of main volatile fatty acids and lactic acid; (c) gaseous products (biogas and hydrogen) using half initial organic load, at pH 5.5, Figure S2: (a) Consumption of carbohydrates; (b) evolution of main volatile fatty acids and lactic acid (c) gaseous products (biogas and hydrogen) using pre-treated ensiled sorghum, at pH 5.5.

Author Contributions

Conceptualization, M.A.D.; methodology, M.A.D. and A.I.V.; validation, M.A.D., A.I.V. and K.T.; formal analysis, M.A.D.; investigation, M.A.D., A.I.V. and K.T.; resources, C.Z. and M.K.; data curation, M.A.D. and K.T.; writing—original draft preparation, M.A.D. and A.I.V.; writing—review and editing, A.I.V., K.T. and M.K.; visualization, K.T.; supervision, C.Z. and M.K.; project administration, M.K.; funding acquisition, M.K. All authors have read and agreed to the published version of the manuscript.

Funding

This research was co-funded by the European Union (European Social Fund—ESF) and Greek national funds through the Operational Program “Education and Lifelong Learning” of the National Strategic Reference Framework (NSRF)—Research Funding Program: Heracleitus II. Investing in knowledge society through the European Social Fund.

Institutional Review Board Statement

Not applicable.

Informed Consent Statement

Not applicable.

Data Availability Statement

Data is contained within the article, in Section 3.

Conflicts of Interest

The authors declare no conflict of interest.

References

  1. Pires, A.; Martinho, G. Waste hierarchy index for circular economy in waste management. Waste Manag. 2019, 95, 298–305. [Google Scholar] [CrossRef]
  2. Gelegenis, J.; Georgakakis, D.; Angelidaki, I.; Mavris, V. Optimization of biogas production by co-digesting whey with diluted poultry manure. Renew. Energy 2007, 32, 2147–2160. [Google Scholar] [CrossRef]
  3. Davila-Vazquez, G.; Alatriste-Mondragón, F.; de León-Rodríguez, A.; Razo-Flores, E. Fermentative hydrogen production in batch experiments using lactose, cheese whey and glucose: Influence of initial substrate concentration and pH. Int. J. Hydrogen Energy 2008, 33, 4989–4997. [Google Scholar] [CrossRef]
  4. Hu, S.; Wu, L.; Persson, S.; Peng, L.; Feng, S. Sweet sorghum and Miscanthus: Two potential dedicated bioenergy crops in China. J. Integr. Agric. 2017, 16, 1236–1243. [Google Scholar] [CrossRef]
  5. Appiah-Nkansah, N.B.; Li, J.; Rooney, W.; Wang, D. A review of sweet sorghum as a viable renewable bioenergy crop and its techno-economic analysis. Renew. Energy 2019, 143, 1121–1132. [Google Scholar] [CrossRef]
  6. Matsakas, L.; Rova, U.; Christakopoulos, P. Evaluation of dried sweet sorghum stalks as raw material for methane production. Biomed Res. Int. 2014, 2014. [Google Scholar] [CrossRef] [PubMed] [Green Version]
  7. Głąb, L.; Sowiński, J.; Chmielewska, J.; Prask, H.; Fugol, M.; Szlachta, J. Comparison of the energy efficiency of methane and ethanol production from sweet sorghum (Sorghum bicolor (L.) Moench) with a variety of feedstock management technologies. Biomass Bioenergy 2019, 129, 105332. [Google Scholar] [CrossRef]
  8. Claassen, P.A.M.; de Vrije, T.; Budde, M.A.W.; Koukios, E.G.; Gylnos, A.; Reczey, K. Biological hydrogen production from sweet sorghum by thermophilic bacteria. In Proceedings of the 2nd World Conference on Biomass for Energy, Industry and Climate Protection, Rome, Italy, 10–14 May 2004; pp. 1522–1525. [Google Scholar]
  9. Ntaikou, I.; Gavala, H.N.; Kornaros, M.; Lyberatos, G. Hydrogen production from sugars and sweet sorghum biomass using Ruminococcus albus. Int. J. Hydrogen Energy 2008, 33, 1153–1163. [Google Scholar] [CrossRef]
  10. Panagiotopoulos, I.A.; Bakker, R.R.; De Vrije, T.; Koukios, E.G.; Claassen, P.A.M. Pretreatment of sweet sorghum bagasse for hydrogen production by Caldicellulosiruptor saccharolyticus. Int. J. Hydrogen Energy 2010, 35, 7738–7747. [Google Scholar] [CrossRef]
  11. Miaoyin, D.; Qiaoqiao, L.; Xu, F.; Wang, S.; Chen, J.; Li, W. Effects of microbial inoculants on the fermentation characteristics and microbial communities of sweet sorghum bagasse silage. Sci. Rep. 2020, 10, 837. [Google Scholar]
  12. Dareioti, M.A.; Kornaros, M. Anaerobic mesophilic co-digestion of ensiled sorghum, cheese whey and liquid cow manure in a two-stage CSTR system: Effect of hydraulic retention time. Bioresour. Technol. 2015, 175, 553–562. [Google Scholar] [CrossRef]
  13. Yu, N.; Tan, L.; Sun, Z.-Y.; Nishimura, H.; Takei, S.; Tang, Y.-Q.; Kida, K. Bioethanol from sugarcane bagasse: Focused on optimum of lignin content and reduction of enzyme addition. Waste Manag. 2018, 76, 404–413. [Google Scholar] [CrossRef]
  14. Kumar, A.; Samadder, S.R. A review on technological options of waste to energy for effective management of municipal solid waste. Waste Manag. 2017, 69, 407–422. [Google Scholar] [CrossRef]
  15. Dareioti, M.A.; Dokianakis, S.N.; Stamatelatou, K.; Zafiri, C.; Kornaros, M. Biogas production from anaerobic co-digestion of agroindustrial wastewaters under mesophilic conditions in a two-stage process. Desalination 2009, 248, 891–906. [Google Scholar] [CrossRef]
  16. Giuliano, A.; Bolzonella, D.; Pavan, P.; Cavinato, C.; Cecchi, F. Co-digestion of livestock effluents, energy crops and agro-waste: Feeding and process optimization in mesophilic and thermophilic conditions. Bioresour. Technol. 2013, 128, 612–618. [Google Scholar] [CrossRef]
  17. Tsigkou, K.; Tsafrakidou, P.; Kopsahelis, A.; Zagklis, D.; Zafiri, C.; Kornaros, M. Used disposable nappies and expired food products valorisation through one- & two-stage anaerobic co-digestion. Renew. Energy 2020, 147. [Google Scholar] [CrossRef]
  18. Bundhoo, Z.M.A. Potential of bio-hydrogen production from dark fermentation of crop residues: A review. Int. J. Hydrogen Energy 2019, 44, 17346–17362. [Google Scholar] [CrossRef]
  19. Fang, H.H.P.; Liu, H. Effect of pH on hydrogen production from glucose by a mixed culture. Bioresour. Technol. 2002, 82, 87–93. [Google Scholar] [CrossRef]
  20. Elbeshbishy, E.; Dhar, B.R.; Nakhla, G.; Lee, H.S. A critical review on inhibition of dark biohydrogen fermentation. Renew. Sustain. Energy Rev. 2017, 79, 656–668. [Google Scholar] [CrossRef]
  21. Dareioti, M.A.; Vavouraki, A.I.; Kornaros, M. Effect of pH on the anaerobic acidogenesis of agroindustrial wastewaters for maximization of bio-hydrogen production: A lab-scale evaluation using batch tests. Bioresour. Technol. 2014, 162, 218–227. [Google Scholar] [CrossRef] [PubMed]
  22. Lay, J.J. Modeling and optimization of anaerobic digested sludge converting starch to hydrogen. Biotechnol. Bioeng. 2000, 68, 269–278. [Google Scholar] [CrossRef]
  23. Ginkel, S.; Van Sung, S.; Lay, J.-J. Biohydrogen Production as a Function of pH and Substrate Concentration. Environ. Sci. Technol. 2001, 35, 4726–4730. [Google Scholar] [CrossRef] [PubMed]
  24. Rogers, P.; Gottschalk, G. Biochemistry and regulation of acid and solvent production in clostridia. In The Clostridia and Biotechnology; Woods, D.R., Ed.; Butterworth-Heinemann: Stoneham, MA, USA, 1993; pp. 25–50. [Google Scholar]
  25. Wainaina, S.; Lukitawesa; Kumar Awasthi, M.; Taherzadeh, M.J. Bioengineering of anaerobic digestion for volatile fatty acids, hydrogen or methane production: A critical review. Bioengineered 2019, 10, 437–458. [Google Scholar] [CrossRef] [PubMed] [Green Version]
  26. Liu, X.; Wang, W.; Gao, X.; Zhou, Y.; Shen, R. Effect of thermal pretreatment on the physical and chemical properties of municipal biomass waste. Waste Manag. 2012, 32, 249–255. [Google Scholar] [CrossRef] [PubMed]
  27. Pilli, S.; Yan, S.; Tyagi, R.D.; Surampalli, R.Y. Thermal pretreatment of sewage sludge to enhance anaerobic digestion: A review. Crit. Rev. Environ. Sci. Technol. 2015, 45, 669–702. [Google Scholar] [CrossRef]
  28. Wong, Y.M.; Wu, T.Y.; Juan, J.C. A review of sustainable hydrogen production using seed sludge via dark fermentation. Renew. Sustain. Energy Rev. 2014, 34, 471–482. [Google Scholar] [CrossRef]
  29. Wu, X.; Zhu, J.; Dong, C.; Miller, C.; Li, Y.; Wang, L.; Yao, W. Continuous biohydrogen production from liquid swine manure supplemented with glucose using an anaerobic sequencing batch reactor. Int. J. Hydrogen Energy 2009, 34, 6636–6645. [Google Scholar] [CrossRef]
  30. Ghimire, A.; Frunzo, L.; Pontoni, L.; d’Antonio, G.; Lens, P.N.L.; Esposito, G.; Pirozzi, F. Dark fermentation of complex waste biomass for biohydrogen production by pretreated thermophilic anaerobic digestate. J. Environ. Manag. 2015, 152, 43–48. [Google Scholar] [CrossRef]
  31. De Gioannis, G.; Friargiu, M.; Massi, E.; Muntoni, A.; Polettini, A.; Pomi, R.; Spiga, D. Biohydrogen production from dark fermentation of cheese whey: Influence of pH. Int. J. Hydrogen Energy 2014, 39, 20930–20941. [Google Scholar] [CrossRef]
  32. Alibardi, L.; Cossu, R. Effects of carbohydrate, protein and lipid content of organic waste on hydrogen production and fermentation products. Waste Manag. 2016, 47, 69–77. [Google Scholar] [CrossRef]
  33. Penniston, J.; Gueguim Kana, E.B. Impact of medium pH regulation on biohydrogen production in dark fermentation process using suspended and immobilized microbial cells. Biotechnol. Biotechnol. Equip. 2018, 32, 204–212. [Google Scholar] [CrossRef] [Green Version]
  34. APHA. Standard Methods for the Examination of Water and Wastewater. In Standard Methods, 22nd ed.; Byrd Prepess: Springfield, WA, USA, 2012; ISBN 9780875532356. [Google Scholar]
  35. Joseffson, B. Rapid spectrophotometric determination of total carbohydrates. In Methods of Seawater Analysis; Grasshoff, K., Ehrhardt, M., Kremling, K., Eds.; Verlag Chemie International: Weinheim, Germany; Deerfield Beach, FL, USA; Basel, Switzerland, 1983; pp. 340–342. ISBN 3527259988. [Google Scholar]
  36. Sluiter, A.; Hames, B.; Ruiz, R.; Scarlata, C.; Sluiter, J.; Templeton, D.; Crocker, D. NREL/TP-510-42618 analytical procedure—Determination of structural carbohydrates and lignin in Biomass. Lab. Anal. Proced. 2008, 1, 1–16. [Google Scholar]
  37. Vavouraki, A.I.; Volioti, V.; Kornaros, M.E. Optimization of thermo-chemical pretreatment and enzymatic hydrolysis of kitchen wastes. Waste Manag. 2014, 34, 167–173. [Google Scholar] [CrossRef] [PubMed]
  38. Flores-Mendoza, A.P.; Hernández-García, H.; Cocotle-Ronzón, Y.; Hernandez-Martinez, E. Methanogenesis of raw cheese whey: pH and substrate–inoculum ratio evaluation at mesophyll temperature range. J. Chem. Technol. Biotechnol. 2020, 95, 1946–1952. [Google Scholar] [CrossRef]
  39. Gallagher, D.; Parker, D.; Allen, D.J.; Tsesmetzis, N. Dynamic bacterial and fungal microbiomes during sweet sorghum ensiling impact bioethanol production. Bioresour. Technol. 2018, 264, 163–173. [Google Scholar] [CrossRef]
  40. Castelló, E.; Ferraz-Junior, A.D.N.; Andreani, C.; del Pilar Anzola-Rojas, M.; Borzacconi, L.; Buitrón, G.; Carrillo-Reyes, J.; Gomes, S.D.; Maintinguer, S.I.; Moreno-Andrade, I. Stability problems in the hydrogen production by dark fermentation: Possible causes and solutions. Renew. Sustain. Energy Rev. 2020, 119, 109602. [Google Scholar] [CrossRef]
  41. Ghimire, A.; Sposito, F.; Frunzo, L.; Trably, E.; Escudié, R.; Pirozzi, F.; Lens, P.N.L.; Esposito, G. Effects of operational parameters on dark fermentative hydrogen production from biodegradable complex waste biomass. Waste Manag. 2016, 50, 55–64. [Google Scholar] [CrossRef]
  42. Tsigkou, K.; Tsafrakidou, P.; Athanasopoulou, S.; Zafiri, C.; Kornaros, M. Effect of pH on the Anaerobic Fermentation of Fruit/Vegetables and Disposable Nappies Hydrolysate for Bio-hydrogen Production. Waste Biomass Valorization 2019, 11, 539–551. [Google Scholar] [CrossRef]
  43. Hernández, M.; Rodríguez, M. Hydrogen production by anaerobic digestion of pig manure: Effect of operating conditions. Renew. Energy 2013, 53, 187–192. [Google Scholar] [CrossRef]
  44. Vavouraki, A.I.; Zakoura, M.V.; Dareioti, M.A.; Kornaros, M. Biodegradation of Polyphenolic Compounds from Olive Mill Wastewaters (OMW) during Two-stage anaerobic Co-digestion of Agro-industrial mixtures. Waste Biomass Valorization 2019, 11, 5783–5791. [Google Scholar] [CrossRef]
  45. Zagklis, D.; Papadionysiou, M.; Tsigkou, K.; Tsafrakidou, P.; Zafiri, C.; Kornaros, M. Effect of pH on the Economic Potential of Dark Fermentation Products from Used Disposable Nappies and Expired Food Products. Appl. Sci. 2021, 11, 4099. [Google Scholar] [CrossRef]
  46. Antonopoulou, G.; Gavala, H.N.; Skiadas, I.V.; Angelopoulos, K.; Lyberatos, G. Biofuels generation from sweet sorghum: Fermentative hydrogen production and anaerobic digestion of the remaining biomass. Bioresour. Technol. 2008, 99, 110–119. [Google Scholar] [CrossRef]
  47. De Gioannis, G.; Friargiu, M.; Massi, E.; Muntoni, A.; Polettini, A.; Pomi, R. Effect of pH value on biohydrogen production from cheese whey. In Proceedings of the 4th International Symposium on Energy from Biomass and Waste, Venice, Italy, 12–15 November 2012; pp. 1–12. [Google Scholar]
  48. Bhat, J.V.; Barker, H.A. Clostridium lacto-acetophilum Nov. Spec. and the Role of Acetic Acid in the Butyric Acid Fermentation of Lactate. J. Bacteriol. 1947, 54, 381–391. [Google Scholar] [CrossRef] [Green Version]
  49. Łukajtis, R.; Hołowacz, I.; Kucharska, K.; Glinka, M.; Rybarczyk, P.; Przyjazny, A.; Kamiński, M. Hydrogen production from biomass using dark fermentation. Renew. Sustain. Energy Rev. 2018, 91, 665–694. [Google Scholar] [CrossRef]
  50. Kumar, A.; Jianzheng, J.; Li, Y.; Baral, Y.N.; Ai, B. A review on bio-butyric acid production and its optimization. Int. J. Agric. Biol. 2014, 16, 1019–1024. [Google Scholar]
  51. Dessì, P.; Porca, E.; Frunzo, L.; Lakaniemi, A.; Collins, G.; Esposito, G.; Lens, P.N.L. Inoculum pretreatment differentially affects the active microbial community performing mesophilic and thermophilic dark fermentation of xylose. Int. J. Hydrogen Energy 2018, 43, 9233–9245. [Google Scholar] [CrossRef]
  52. Słupek, E.; Makoś, P.; Kucharska, K.; Gębicki, J. Mesophilic and thermophilic dark fermentation course analysis using sensor matrices and chromatographic techniques. Chem. Pap. 2020, 74, 1573–1582. [Google Scholar] [CrossRef]
  53. Slezak, R.; Grzelak, J.; Krzystek, L.; Ledakowicz, S. The effect of initial organic load of the kitchen waste on the production of VFA and H2 in dark fermentation. Waste Manag. 2017, 68, 610–617. [Google Scholar] [CrossRef] [PubMed]
  54. Rangela, C.; Sastoqueb, J.; Calderonb, J.; Mosquerab, J.; Velasquezd, P.; Cabezabc, I.; Acevedobd, P. Hydrogen Production by Dark Fermentation Process: Effect of Initial Organic Load. Chem. Eng. 2020, 79. [Google Scholar] [CrossRef]
Figure 1. Reactor configuration and sets of experiments.
Processes 09 01017 g001
Figure 2. Effect of pH on (a) carbohydrates, TOC, SOC, TS, VS removal; (b) main soluble end-products; (c) biogas and hydrogen production and hydrogen yield.
Processes 09 01017 g002
Figure 3. (a) Consumption of carbohydrates; (b) evolution of main VFAs and lactic acid and (c) gaseous products (biogas and hydrogen) during batch acidogenesis of agro-waste mixture (in ratio of 55:40:5), at pH 5.5.
Processes 09 01017 g003
Figure 4. (a) Consumption of carbohydrates; (b) evolution of main VFAs and lactic acid and (c) gaseous products (biogas and hydrogen) using heat pre-treated enriched anaerobic sludge, at pH 5.5.
Processes 09 01017 g004aProcesses 09 01017 g004b
Figure 5. (a) Carbohydrates consumption and H2 yield; (b) biogas, H2 and soluble main end-products accumulation at pH 5.5 for all tested factors.
Processes 09 01017 g005
Table 1. Chemical composition of CW and LCM.
ParameterUnitsCWLCM
pH-6.17 ± 0.037.26 ± 0.18
TSSg/L38.00 ± 0.1148.60 ± 0.24
VSSg/L34.60 ± 0.1435.80 ± 0.53
TSg/L69.40 ± 0.3452.40 ± 0.93
VSg/L60.17 ± 0.2535.83 ± 0.64
Total CODg/L75.00 ± 0.2962.50 ± 2.12
Soluble CODg/L66.73 ± 0.1723.02 ± 0.26
TOCg/L31.45 ± 0.6424.19 ± 0.16
Total carbohydrates 1g/L64.40 ± 0.908.12 ± 0.31
Soluble carbohydrates 1g/L62.80 ± 1.041.20 ± 0.01
TKNg/L0.84 ± 0.083.36 ± 0.00
Ammonium-Ng/L0.10 ± 0.022.39 ± 0.02
Alkalinityg CaCO3/L0.50 ± 0.0012.38 ± 0.32
TVFAg/L0.07 ± 0.007.24 ± 0.02
1 in equivalent glucose (eq. glucose).
Table 2. Chemical composition of FS and ES.
ParameterFSES
pH5.6 ± 0.14.6 ± 0.2
Moisture (% wet weight)76.7 ± 0.177.7 ± 0.3
TS (% wet weight)23.3 ± 1.022.3 ± 0.2
VS (%DM)94.5 ± 0.294.4 ± 0.1
Ash (%DM)5.5 ± 0.35.6 ± 0.8
TOC (%DM)59.8 ± 0.151.0 ± 1.3
Total carbohydrates 1 (%DM)81.0 ± 3.136.9 ± 1.0
Soluble carbohydrates 1 (%DM)49.0 ± 0.32.9 ± 0.1
Cellulose (%DM)23.0 ± 0.427.9 ± 2.1
Hemicellulose (%DM)11.0 ± 0.712.5 ± 1.2
Lignin (%DM)8.0 ± 0.411.9 ± 3.1
Total Nitrogen, TKN (%DM)0.1 ± 0.00.2 ± 0.0
Proteins (%DM)0.7 ± 0.11.1 ± 0.1
Lactic Acid (%DM)N.D.1.2 ± 0.1
Ethanol (%DM)N.D.8.9 ± 0.1
1 in equivalent glucose (eq. glucose); DM: Dry Matter; N.D.: Not Detected.
Table 3. Mass balances for hydrogen production at the optimum pH 5.5.
Reactions for Period: 0–8.5 hEquationCalculated Values (mmoles)
GlucoseLacticEthanolButyricAceticPropionicH2
1. C6H12O6→2CH3CH(OH)COOH(3)−6.76+13.52
2. C6H12O6→CH3CH(OH)COOH + CH3CH2OH + CO2(4)−9.04+9.04+9.04
3. 2C6H12O6→3CH3COOH + 2CH3CH(OH)COOH(5)−75.25+75.25 +112.87
4. 3CH3CH(OH)COOH→2CH3CH2COOH + CH3COOH + CO2 + H2O(6) −13.08 +4.36+8.72
5. 2CH3CH(OH)COOH→CH3CH2CH2COOH + 2CO2 + 2H2(7) −16.40 +8.20 +16.40
6. 2CH3COOH + 2H2→CH3CH2CH2COOH + 2H2O(8) +5.80−11.60 −11.60
Net calculated values −91.05+68.33+9.04+14.08+105.63+8.72+4.80
Experimental values −91.05+64.17+9.04+14.08+105.63+8.72+4.78
Error (%) 0.006.480.000.000.000.000.42
Reactions for period: 8.5–44.5 h
7. C6H12O6→2CH3CH(OH)COOH(3)−10.67+21.34
8 C6H12O6→CH3CH(OH)COOH + CH3CH2OH + CO2(4)−0.70+0.70+0.70
9. 2C6H12O6→3CH3COOH + 2CH3CH(OH)COOH(5)−0.00+0.00 +0.00
10. 3CH3CH(OH)COOH→2CH3CH2COOH + CH3COOH + CO2 + H2O(6) −8.60 +2.87+5.74
11. 2CH3CH(OH)COOH→CH3CH2CH2COOH + 2CO2 + 2H2(7) −69.18 +34.59 +69.18
12. 2CH3COOH + 2H2→CH3CH2CH2COOH + 2H2O(8) +10.95−21.90 −21.90
Net calculated values −11.37−55.74+0.70+45.54−19.03+5.74+47.28
Experimental values −11.37−55.74+0.70+45.54−19.80+5.74+47.55
Error (%) 0.000.000.000.003.890.000.57
+: production; −: consumption.
Table 4. Mass balances for hydrogen production using heat-treated inoculum at pH 5.5.
Reactions for Period: 0–8.5 hEquationCalculated Values (mmoles)
GlucoseLacticEthanolButyricAceticPropionicH2
1. C6H12O6→2CH3CH(OH)COOH(3)−42.02+84.04
2. C6H12O6→CH3CH(OH)COOH + CH3CH2OH + CO2(4)−0.96+0.96+0.96
3. 2C6H12O6→3CH3COOH + 2CH3CH(OH)COOH(5)−8.96+8.96 +13.44
4. 3CH3CH(OH)COOH→2CH3CH2COOH + CH3COOH + CO2 + H2O(6) −0.00 +0.00+0.00
5. 2CH3CH(OH)COOH→CH3CH2CH2COOH + 2CO2 + 2H2(7) −0.00 +0.00 +0.00
6. 2CH3COOH+2H2→CH3CH2CH2COOH + 2H2O(8) +0.00−0.00 −0.00
Net calculated values −51.94+93.96+0.96+0.00+13.44+0.00+0.00
Experimental values −51.94+92.35+0.96+0.00+13.44+0.00+0.00
Error (%) 0.001.740.000.000.000.000.00
Reactions for period: 8.5–44.5 h
7. C6H12O6→2CH3CH(OH)COOH(3)−9.31+18.62
8 C6H12O6→CH3CH(OH)COOH + CH3CH2OH + CO2(4)−0.00+0.00+0.00
9. 2C6H12O6→3CH3COOH + 2CH3CH(OH)COOH(5)−1.94+1.94 +2.91
10. 3CH3CH(OH)COOH→2CH3CH2COOH + CH3COOH + CO2 + H2O(6) −13.46 +4.49+8.97
11. 2CH3CH(OH)COOH→CH3CH2CH2COOH + 2CO2 + 2H2(7) −85.46 +42.73 +85.46
12. 2CH3COOH+2H2→CH3CH2CH2COOH + 2H2O(8) +10.21−20.42 −20.42
Net calculated values −11.25−78.36+0.00+52.94−13.02+8.97+65.04
Experimental values −11.25−78.36+0.00+52.94−13.76+8.97+60.12
Error (%) 0.000.000.000.005.380.008.18
+: production; −: consumption.
Publisher’s Note: MDPI stays neutral with regard to jurisdictional claims in published maps and institutional affiliations.

