Article

Improving the Treatment Efficiency and Lowering the Operating Costs of Electrochemical Advanced Oxidation Processes

1
Institute of Chemical and Electrochemical Process Engineering, Clausthal University of Technology, 38678 Clausthal-Zellerfeld, Germany
2
CONDIAS GmbH, 25524 Itzehoe, Germany
3
CUTEC Research Center for Environmental Technologies, Clausthal University of Technology, 38678 Clausthal-Zellerfeld, Germany
4
Institute of Engineering Thermodynamics, German Aerospace Center, 70569 Stuttgart, Germany
*
Authors to whom correspondence should be addressed.
These authors contributed equally to this work.
Submission received: 30 July 2021 / Revised: 17 August 2021 / Accepted: 19 August 2021 / Published: 24 August 2021

Abstract

:
Electrochemical advanced oxidation processes (EAOP®) are promising technologies for the decentralized treatment of water and will be important elements in achieving a circular economy. To overcome the drawback of the high operational expenses of EAOP® systems, two novel reactors based on a next-generation boron-doped diamond (BDD) anode and a stainless steel cathode or a hydrogen-peroxide-generating gas diffusion electrode (GDE) are presented. This reactor design ensures the long-term stability of BDD anodes. The application potential of the novel reactors is evaluated with artificial wastewater containing phenol (COD of 2000 mg L−1); the reactors are compared to each other and to ozone and peroxone systems. The investigations show that the BDD anode can be optimized for a service life of up to 18 years, reducing the costs for EAOP® significantly. The process comparison shows a degradation efficiency for the BDD–GDE system of up to 135% in comparison to the BDD–stainless steel electrode combination, showing only 75%, 14%, and 8% of the energy consumption of the BDD–stainless steel, ozonation, and peroxonation systems, respectively. Treatment efficiencies of nearly 100% are achieved with both novel electrolysis reactors. Due to the current density adaptation and the GDE integration, which result in energy savings as well as the improvements that significantly extend the lifetime of the BDD electrode, less resources and raw materials are consumed for the power generation and electrode manufacturing processes.

1. Introduction

Electrochemical advanced oxidation processes (EAOP®) are promising key elements for achieving a circular economy. EAOP® provide versatile, efficient, and clean methods for wastewater treatment through the use of electrons and their ability to oxidize wastewater pollutants either directly or indirectly [1]. The electron transfer between the organic compound and the electrode occurs at the electrode surface with the direct electrochemical oxidation. In contrast, indirect electrochemical oxidation involves intermediates that perform the electron exchange between the organics and the electrode in the bulk of the electrolyte [1]. “Active” and “non-active” anodes are used for oxidation, whereby “active” anodes with low oxygen overpotentials (OVP), e.g., dimensionally stable anodes or Pt, favor the selective oxidation of organic species and are preferred for the generation of reactive chlorine species [2,3]. In contrast, anodes with high OVP show “non-active” behavior and enable complete organic oxidation. The ideal anodes for this purpose are made of SnO2, PbO2, Ti4O7, or boron-doped diamond (BDD) [4]. BDD anodes have high corrosion and electrochemical stability and a wide potential window for water discharge, resulting in high yields of hydroxyl radicals (∙OH, Equation (1) [5]); therefore, reactors with BDD electrodes producing ∙OH are capable of mineralizing nearly every organic compound [2,6,7] and were, therefore, chosen for this study.
In addition, electrochemical oxidation processes, especially those involving diamond electrodes, are easy to control and can be supplied with energy from both fossil and renewable energy sources [8].
Although BDD-based EAOP® systems are highly efficient, the high cost of the BDD electrode material [1,9,10], the operating costs, and the formation of toxic byproducts [11,12] hinder their integration in many applications. Usually, BDDs are used in combination with a H2 evolution reaction (HER) at a stainless steel cathode (Equation (2)):
H 2 O + BDD BDD ( · OH ) ads + H + + e
2 H 2 O + 2 e H 2 + 2 OH
This combination has the disadvantage of the H2 evolution, which does not contribute to the water treatment performance, and might lead to the formation of foam during treatment [13]. This results in higher energy consumption owing to the gas isolation characteristics [12], a more complex process handling, and hinders the upscaling of the cells [3]. These disadvantages can be overcome by using a gas diffusion electrode (GDE). These electrodes produce hydrogen-peroxide (H2O2), using the oxygen reduction reaction for the generation of the oxidizing agents H2O2 and HO2 (Equations (3) and (4)). H2O2 is one of the most versatile chemical compounds due to its specific reactivity over a wide pH range [14]. It has the advantage of being able to decompose into environmentally friendly and non-toxic products [15,16,17].
O 2 + 2 H + + 2 e H 2 O 2
O 2 + H 2 O + 2 e HO 2 + OH
GDEs are 3D electrode systems that form a three-phase boundary layer, whereby the reaction takes place between the solid catalyst material, the gaseous oxygen, and the liquid phase of the electrolyte (Figure 1b) [18]. GDEs overcome the gaseous mass transfer limitations of 2D cathodes [19]. The usage of a GDE results in lower cell voltages owing to the lower cathodic potential of the oxygen reduction compared to the water reduction, whereby the gas evolution is avoided. Furthermore, such GDEs are inexpensive (approx. 1000 € m−2).
BDD anodes are also multi-layer systems, as shown in Figure 1a. The BDD coating is built on top of a suitable carrier, exhibiting a high overpotential for the oxidation of water, which enables the direct oxidation of contaminants due to the weakly adsorbed ∙OH [9]. The price range for such anodes in the literature is 12,000–18,000 € m−2 [9,10].
The first aim of this study is to reduce the anodic diamond wear off, enabling a long BDD service life and lower operational costs, in particular. The second aim is to combine the direct oxidation behavior of a BDD anode with the indirect oxidation behavior of cathodic-generated H2O2 to enable both higher degradation efficiency and lower energy consumption.
This is also crucial for the future-oriented efficient coupling of EAOP® with regenerative energy (RE) [8] for sustainable, autonomous, and low carbon emission applications [8]. Whether coupled with a wind turbine, photovoltaic element, or low-energy renewable sources, e.g., a microbial fuel cell, the aim must be to make better use of the collected energy by using an optimized reactor in combination with an optimized operation [20].
The basis of this study is an artificial wastewater (WW) containing phenol, which is a well-known model pollutant that is used to simulate the WW caused by pharma production in this study. In the literature, the electrochemical treatment of phenolic WW has been investigated by many authors [17] and the electrochemical treatment systems have been summarized. Luo et al. used a H2O2-producing GDE (10 cm2; Vulcan XC-72-based) and its electroactivation of ∙OH to treat 50 mg L−1 phenol in 0.2 mol L−1 Na2SO4. With the best operation point, they reached a TOC mineralization efficiency of 85% [21]. In-cell and ex-cell Fenton experiments were performed by Agladze et al. for the treatment of 282 ppm phenol in Na2SO4 and NaCl electrolytes with 90–98% treatment efficiency. The lifetime of the GDEs was the main problem in the investigations, as the GDEs destructed during the experiments (up to 2 h) [22]. Huang et al. also used in situ generation and activation of H2O2 with a metal–carbon catalyst for the treatment of 40 mg L−1 phenol. They achieved a similar removal efficiency rate of 87%, but the metal–carbon catalyst released iron during operation [23]. A similar investigation with a MnO2–graphite electrode was performed by Abbas et al. [24], with activation using electro-Fenton. After 6 h, it was found that 88% of the phenol was removed by applying 0.08 kA m−2 at 60 °C with a current efficiency (CE) of approximately 4%. Higher efficiencies were shown by Ma et al. with ferric sulfate and potassium permanganate adsorbed onto active bentonite in a slurry-bed electrolytic reactor with graphite electrodes. They presented a 99% removal rate for 0.52 g L−1 phenol with the H2O2-producing and -activating process [25].
Other authors investigated the anode side of the electrolysis cell to treat phenolic WW. Shi et al. investigated a nanostructured, boron-doped diamond (NBDD) anode for the degradation of 0.04 M phenol in an acid milieu. They showed that the NBDD had a larger effective surface area of 31% in comparison to their standard BDD, which revealed a TOC removal of approx. 50% in comparison to 40% (both at 1 kA m−2) [26]. PbO2-based anodes are also known for ∙OH generation. Gui et al. showed an average degradation efficiency for 100 mg L−1 phenol of 91.1% with this type of electrode [27]. Unfortunately, PbO2 anodes are known to release toxic Pb2+ ions and have lower activity rates in comparison to BDD anodes [2]. Li et al. stated that the anodic property affects the pathway of phenol electrolysis and that ∙OH-generating anodes are superior to other anode systems. They showed that ∙OH-generating Ti/SnO2-Sb degraded the TOC of an 80 mL phenolic solution to 99%, whereby non-radical-generating anodes such as Ti/RuO2 and a Pt anode showed much lower efficiencies [28].
The presented studies described in the literature focused only on one electrode for the treatment of phenolic WW. In the present study, we prepare and use an improved BDD in combination with a GDE for the treatment of WW. Furthermore, the system does not depend on the pH value, as with the Fenton process. The aim is to degrade up to 99% or more of phenol to avoid toxic byproducts [29] and the comparison with a state-of-the-art electrolysis system with a H2-generating cathode in an also novel reactor design and with ozonation and peroxone processes [30].
The oxidation of phenol involves several steps and intermediates before the degradation results in CO2 and water as the final products [31]. The intermediates are precursors of methyl radicals, which lead to the etching of the diamond layer [32]. For this reason, the system studied here is also suitable for investigating how long a diamond electrode can be used in WW treatment before this consumable material has to be replaced at the end of its lifetime.

2. Materials and Methods

2.1. Artificial Wastewater

In this study, an artificial WW containing phenol was used to simulate the WW from a pharmaceutical manufacturer to ensure reproducibility. The same composition of 9 g L−1 Na2SO4 (≥99%, p.a., article number: 8560.1) and 0.85 g L−1 phenol (≥99.5%, p.a; article number: 0040.1) in demineralized water (Behropur B10 from behr Labor-Technik, Germany) was subjected to the electrolysis setups and the ozonation and peroxone processes. H2O2 at a concentration of 30 wt.% (article number: 9681.1) was used for the peroxone experiments. The chemicals were purchased from Carl Roth GmbH & Co., KG (Karlsruhe, Germany).
Na2SO4 was selected as the conductive salt for the artificial WW. The addition of conductive salts is necessary to operate the cell within an acceptable and realistic voltage, temperature, and energy regime. Na2SO4 was used to enable a better comparison with the results found in the literature. Halogen salts or acids were not used to prevent the generation of other hazardous substances, e.g., adsorbable organic halides by Cl oxidation [3]. It is noted that the oxidation of sulfate (SO42−) to persulfate (S2O82−) is possible with BDD electrodes, due to ∙OH formation and the high overpotential.
This side reaction was of minor relevance, as SO4∙ readily reacts with organic compounds. At low current densities, the probability for a recombination of sulfate radical to persulfate is decreased. Independently in the absence of a transition metal, UV radiation, and temperatures >60 °C, the activation of persulfate to perform oxidation reactions of organic compounds is neglectable and was not an influencing factor for the performed degradation experiments [4,33,34,35].

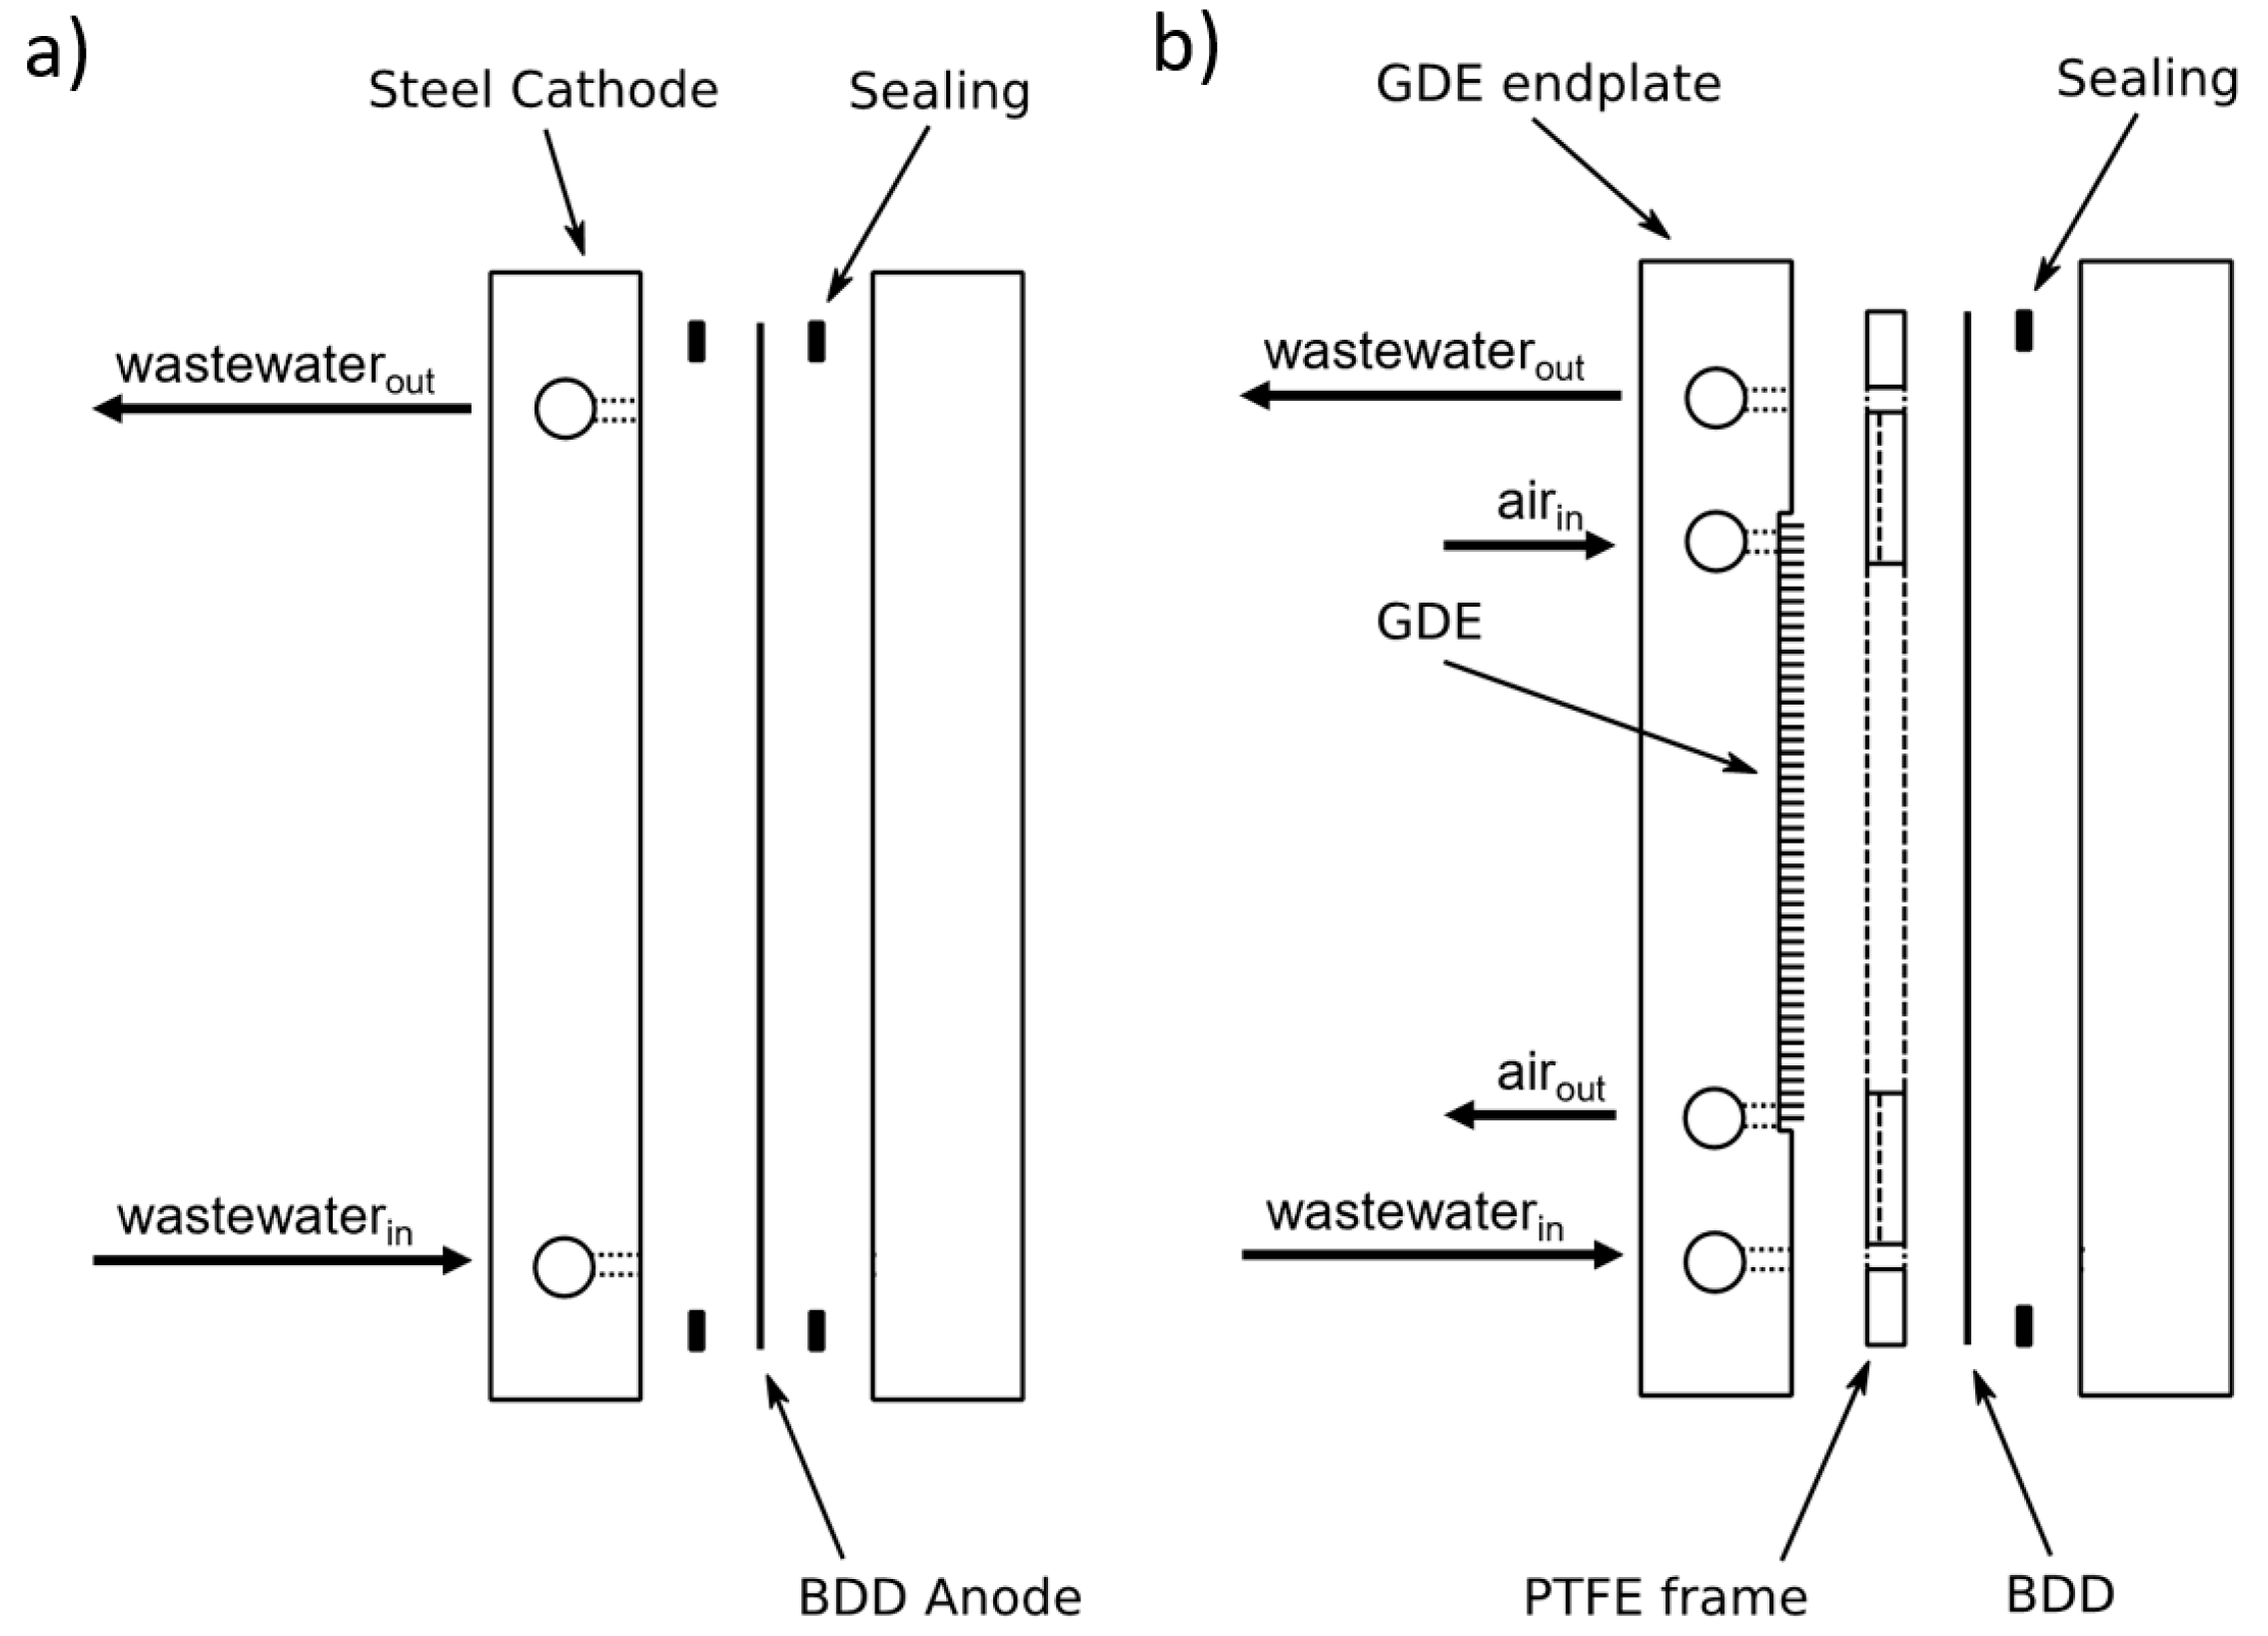
2.2. Electrolysis Setups

Both electrolysis cells were built from stainless steel using a filter press design (SSZ100/ES and SSZ100/GDE by CONDIAS GmbH, Itzehoe, Germany; Figure 2). A BDD anode (DIACHEM® by CONDIAS) was coupled with a stainless steel cathode and a carbon-based GDE (Printex L6 on Ag-plated Ni mesh; Covestro AG, Leverkusen, Germany; details about the manufacturing process are given in the Supplementary Information Figure S1) using cell designs a and b, respectively. The Printex catalyst was chosen for the GDE due to its high yield of H2O2 in acid and alkaline environments in comparison to other pure carbon catalysts [36,37]. The DIACHEM® electrode was coated with 15 µm as a multi-layer on tantalum substrate (thickness of 2 mm). The production using the hot-filament-activated chemical vapor deposition (HF-CVD) process [38] and the related pre-treatment was performed in several steps especially adapted to the material characteristics in order to manufacture the DIACHEM® coating. The main improvement was the triple multi-layer coating.
In design a, one end plate was used as the active cathode, whereby the electrolyte flows from the bottom to the top to ensure homogeneous working electrodes. In design b, the GDE was integrated into the endplate to ensure the electrolyte, air, and power inputs pass through one cell element [39]. These requirements were achieved using a structured flow field milled to the steel body; therefore, in design b, two feed streams must pass the steel body. The PTFE frame has two functions—one is to seal the GDE and the other is to route the electrolyte to the electrochemical reaction zone. Regardless of the cathodic half-shell, the cell design includes important features for effective and efficient operation of the DIACHEM® electrodes for an EAOP® treatment. The special features are the homogeneous electrolyte flow through the flow channels of the inlet and outlet and the bifunctionality of the stainless steel part that combines the cathode with the electrolyte distribution, while we followed the concept of “the fewer the cell parts, the better the cell design, the lower the risk of malfunction”. In addition, the anode edges are protected from the influence of the electrolytes, the electric field, and their influence on electrode wear by the flat gasket design. The cells were fed upwards with WW from a tank (18 L and 9 L WW volume for cell designs a and b, respectively) with a constant velocity of 0.298 ± 0.019 m s−1 through a centrifugal pump (WPDC-06.7L-10M-24-VP, Rotek Handels GmbH, Hagenbrunn, Austria). The flow areas for cell designs a and b were 180 and 140 mm2, respectively. Synthetic air (Linde, Germany) was used for the GDE with a 3 × stoichiometric excess of O2 in the air (127, 76, and 26 mL min−1 for 0.5, 0.3, and 0.1 kA m−2, respectively) and the pressure in the air compartment of the cell was adjusted to approx. 40 mbar. The power was applied with a TDK Lambda power supply (type Genesys, Tokyo, Japan). The voltage, current, temperature, and pH were monitored using multimeters (NI 9239 by NI, Austin, TX, USA), a PT100 thermometer (type HSRTD by Omega Engineering, Inc., Norwalk, CT, USA), and a pH probe (tecLine 201020 by JUMO GmbH & Co. KG, Fulda, Germany), respectively.

2.3. Ozone and Peroxone Process

An O3 generator and a concentration measurement device from Anseros Klaus Nonnenmacher GmbH (Tübingen, Germany, type Generator COM and Ozomat GM) were used. A reactor and a O3 destructor used to destroy unreacted O3 completed the ozone process. A schematical drawing of this setup is given in [30]. It was also used for the peroxone process in this work, whereby a dosing pump (KNF Neuberger GmbH, SIMDOS 02, Freiburg, Germany) was added to enable a continuous dosing of the H2O2 solution into the reactor, forming superoxide radicals from O3 and H2O2. Experiments were conducted using various power inputs of the O3 generator (25% = 0.51 mgO3 s−1, 50% = 0.63 mgO3 s−1, 75% = 0.74 mgO3 s−1, 100% = 0.88 mgO3 s−1) and in combination with H2O2 dosing, with an O3 power input of 25% + 0.03 mL min−1 or + 0.07 mL min−1 H2O2 solution.

2.4. Analytical Methods and Performance Data

Photometrical cuvette tests (Macherey-Nagel GmbH & Co. KG CSB 40, 300, 600, and 1500, Düren, Germany) were used to determine the chemical oxygen demand (COD). It is known that H2O2 negatively affects COD tests, resulting in overdetermination; therefore, two methods were applied to ensure correct values. The method according proposed by Lee et al. was used to correct the measured values with correlation lines [40] for the GDE electrolysis experiments. The correlation lines for the investigated WW are given in the Supplementary Information (Figure S4). The method according proposed by Issa et al. [41] was used for the peroxone experiments. H2O2 concentrations were determined using iodometry [42]. To calculate the specific energy consumption per mass O3 ( E s c , O 3 ), the power consumption ( P O 3 g e n ) and the gaseous volume flow rate ( V ˙ g a s ) of the O3 generator were used, as well as the concentration of O3 ( c O 3 ) according to Equation (5). The specific O3 demands per mass COD were calculated (Equation (6)), whereby the following additional parameters were used, namely the time (t), differential between the initial and the final COD concentration ( Δ c C O D ), and treated wastewater volume (VWW). Finally, the specific energy consumption per mass COD was calculated using Equation (7):
E s c , O 3 [ kWh kg O 3 ] = P O 3 g e n [ kW ] V ˙ g a s [ L h ]   ·   c O 3 [ kg L ]  
m O 3 m C O D [ kg O 3 kg C O D ] = V ˙ g a s [ L h ] ·   c O 3 [ kg L ] ·   t [ h ] Δ c C O D [ kg L ] ·   V W W [ L ]  
E s c , O 3 , C O D = P O 3 g e n [ kW ] ·   t [ h ] Δ c C O D [ kg L ] ·   V W W [ L ]
During the electrolysis tests, the current densities (j) used were adjusted to the prevailing COD concentration. The j for mineralization without mass transfer limitation and the ideal treatment curve were calculated with the model proposed by Panizza et al. [43].
The specific energy consumption per volume ( E s c , e l . , V o l . ) and per kgCOD ( E s c , e l . , C O D ) of the electrolysis setups were calculated according to Equations (8) and (9) with the cell voltage U, the current density j, the active electrode area A, the volume of the wastewater VWW and the Δ c C O D :
E s c , e l . , V o l . = t = 0 t ( U   [ V ] · j [ kA m 2 ] · A [ m 2 ] )   d t V W W   [ m 3 ]  
E s c , e l . , C O D = t = 0 t ( U   [ V ] · j [ kA m 2 ] · A [ m 2 ] )   d t Δ c C O D   [ kg L ] ·   V W W [ L ]  
For determination of the diamond coating thickness, the beta backscattering methodology was used (FISCHERSCOPE® MMS® PC2 in combination with 147Pm beta radiation source; Helmut Fischer GmbH, Sindelfingen, Germany). The measurements were performed on 225 points (9 lines across the sample’s longitudinal axis, each with 25 measurement points). The high number of measurements, hence the high resolution of the data, were possible due to the custom-made, self-implemented automatic measurement.
The detection of surface changes of the diamond coating was performed with a color 3D laser scanning microscope (LSM; VK-9700K, Keyence Corporation, Osaka, Japan). For the image analysis, VK Analyzer Version 2.5.0.1 was used.
The operational expenses (OPEX) for different electrode lifetimes were calculated according to Equation (10) with the price M, the estimated electrode lifetime (LTestimated), and the annual WW volume flow rate ( V ˙ W W ):
O P E X N b   o r   T a [ m 3 ] = M s u b s t r a t e   [ ] + M B D D   c o a t i n g   [ ] L T e s t i m a t e d   [ a ] ·   V ˙ W W   [ m 3 a ]  
For a better comparison, the OPEXratio (Equation (11)) was considered.
O P E X r a t i o = O P E X N b O P E X T a
The OPEX for the energy demand was calculated based on the results shown in Section 3.2 and Equation (12) with the electric energy (P) and the energy costs (C). Here, the OPEX ratio (OPEXratio,energy) was also considered for a better comparison (Equation (13)):
O P E X e n e r g y ,       s t e e l   o r   G D E [ m 3 ] = P   [ kWh m 3 ] ·   C [ kWh ]
O P E X r a t i o ,   e n e r g y = O P E X e n e r g y ,   s t e e l O P E X e n e r g y ,   G D E

3. Results

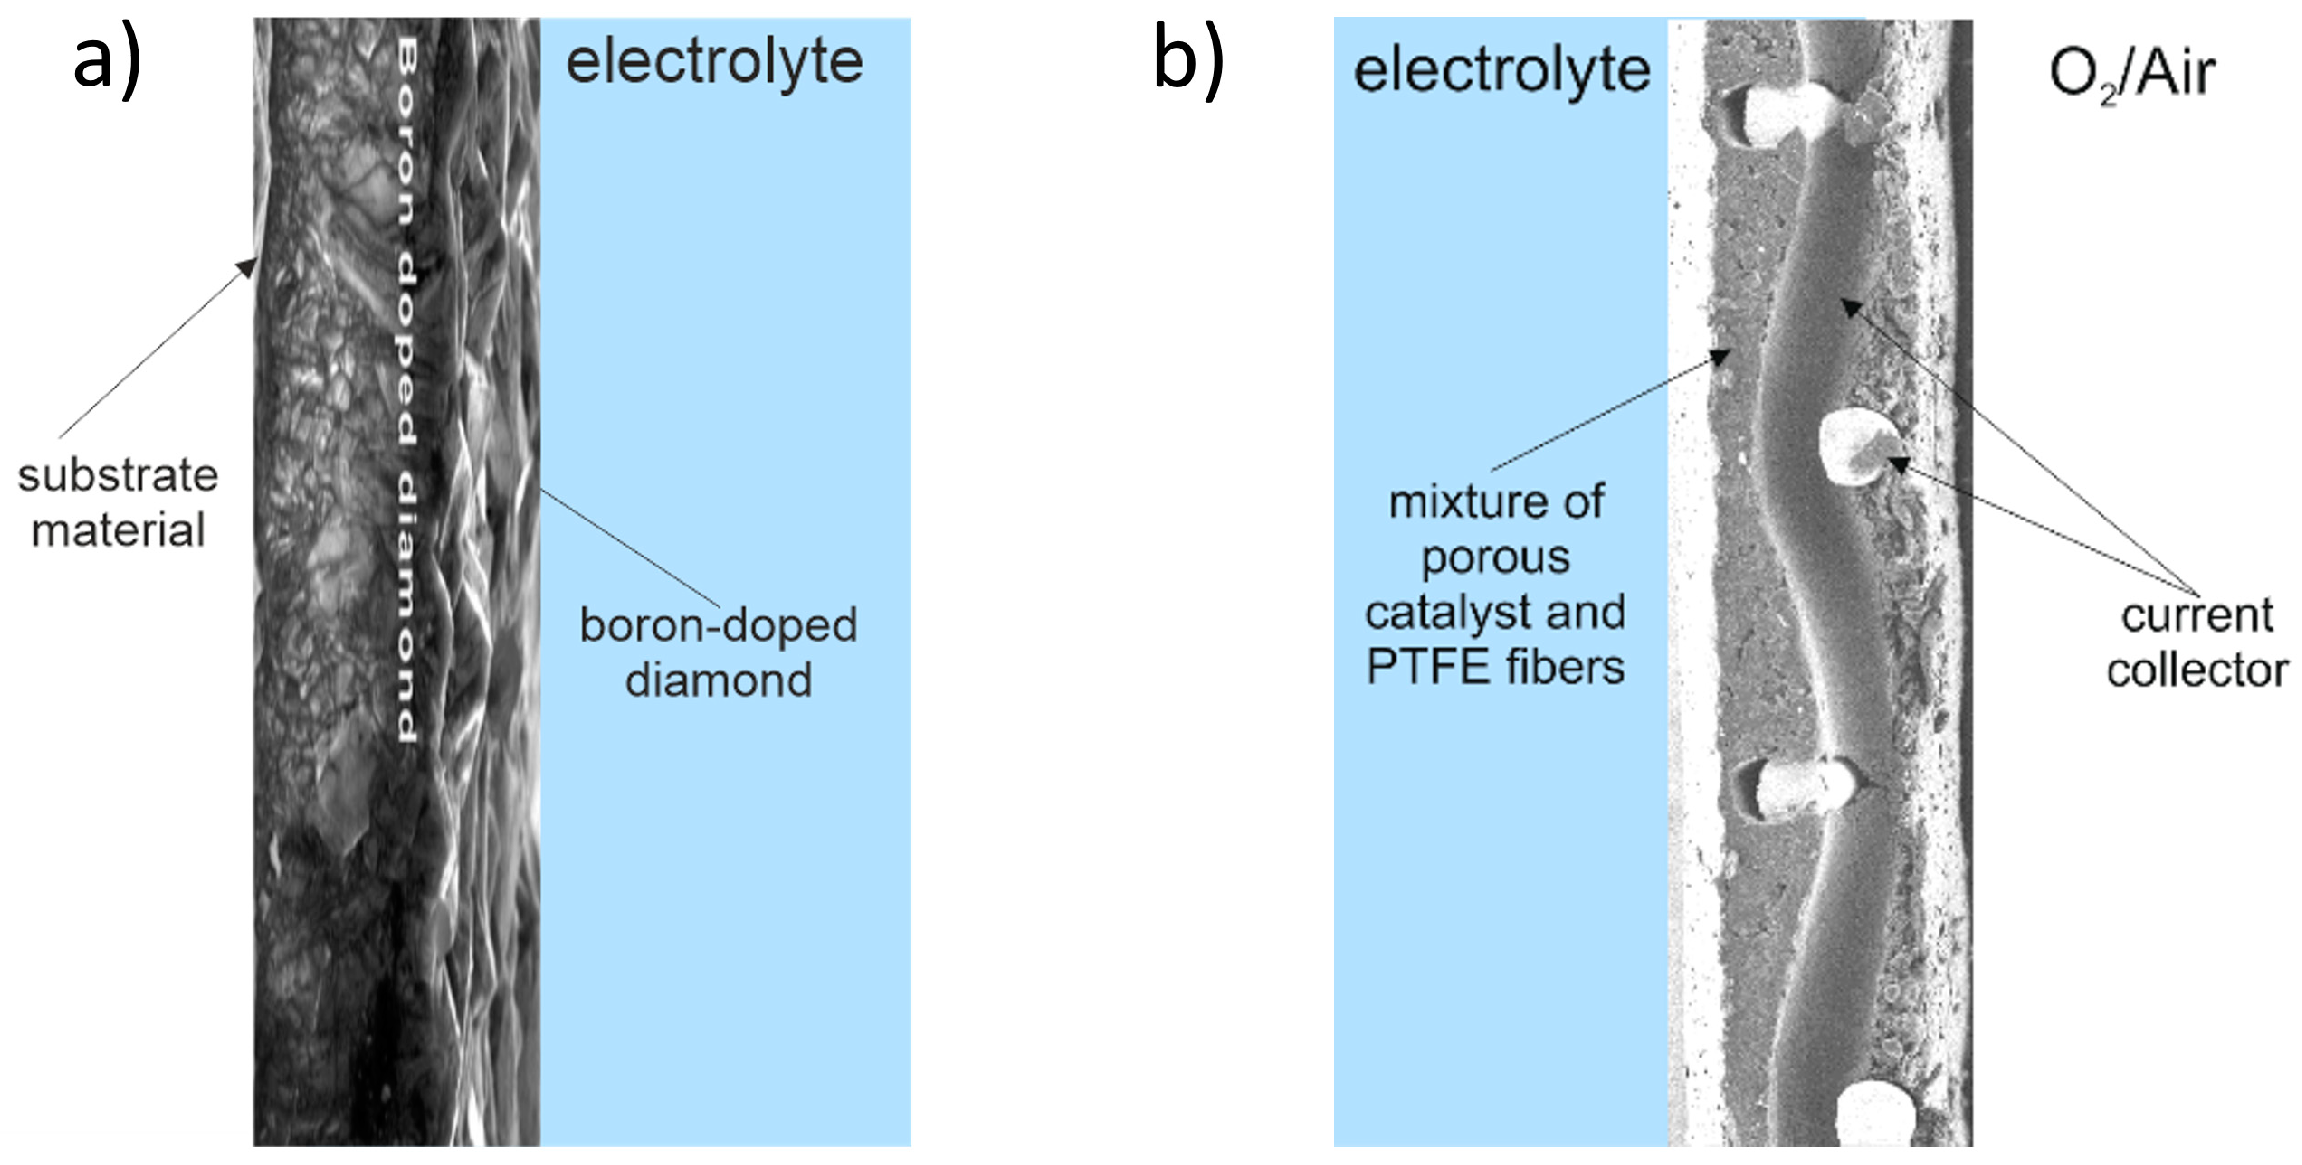
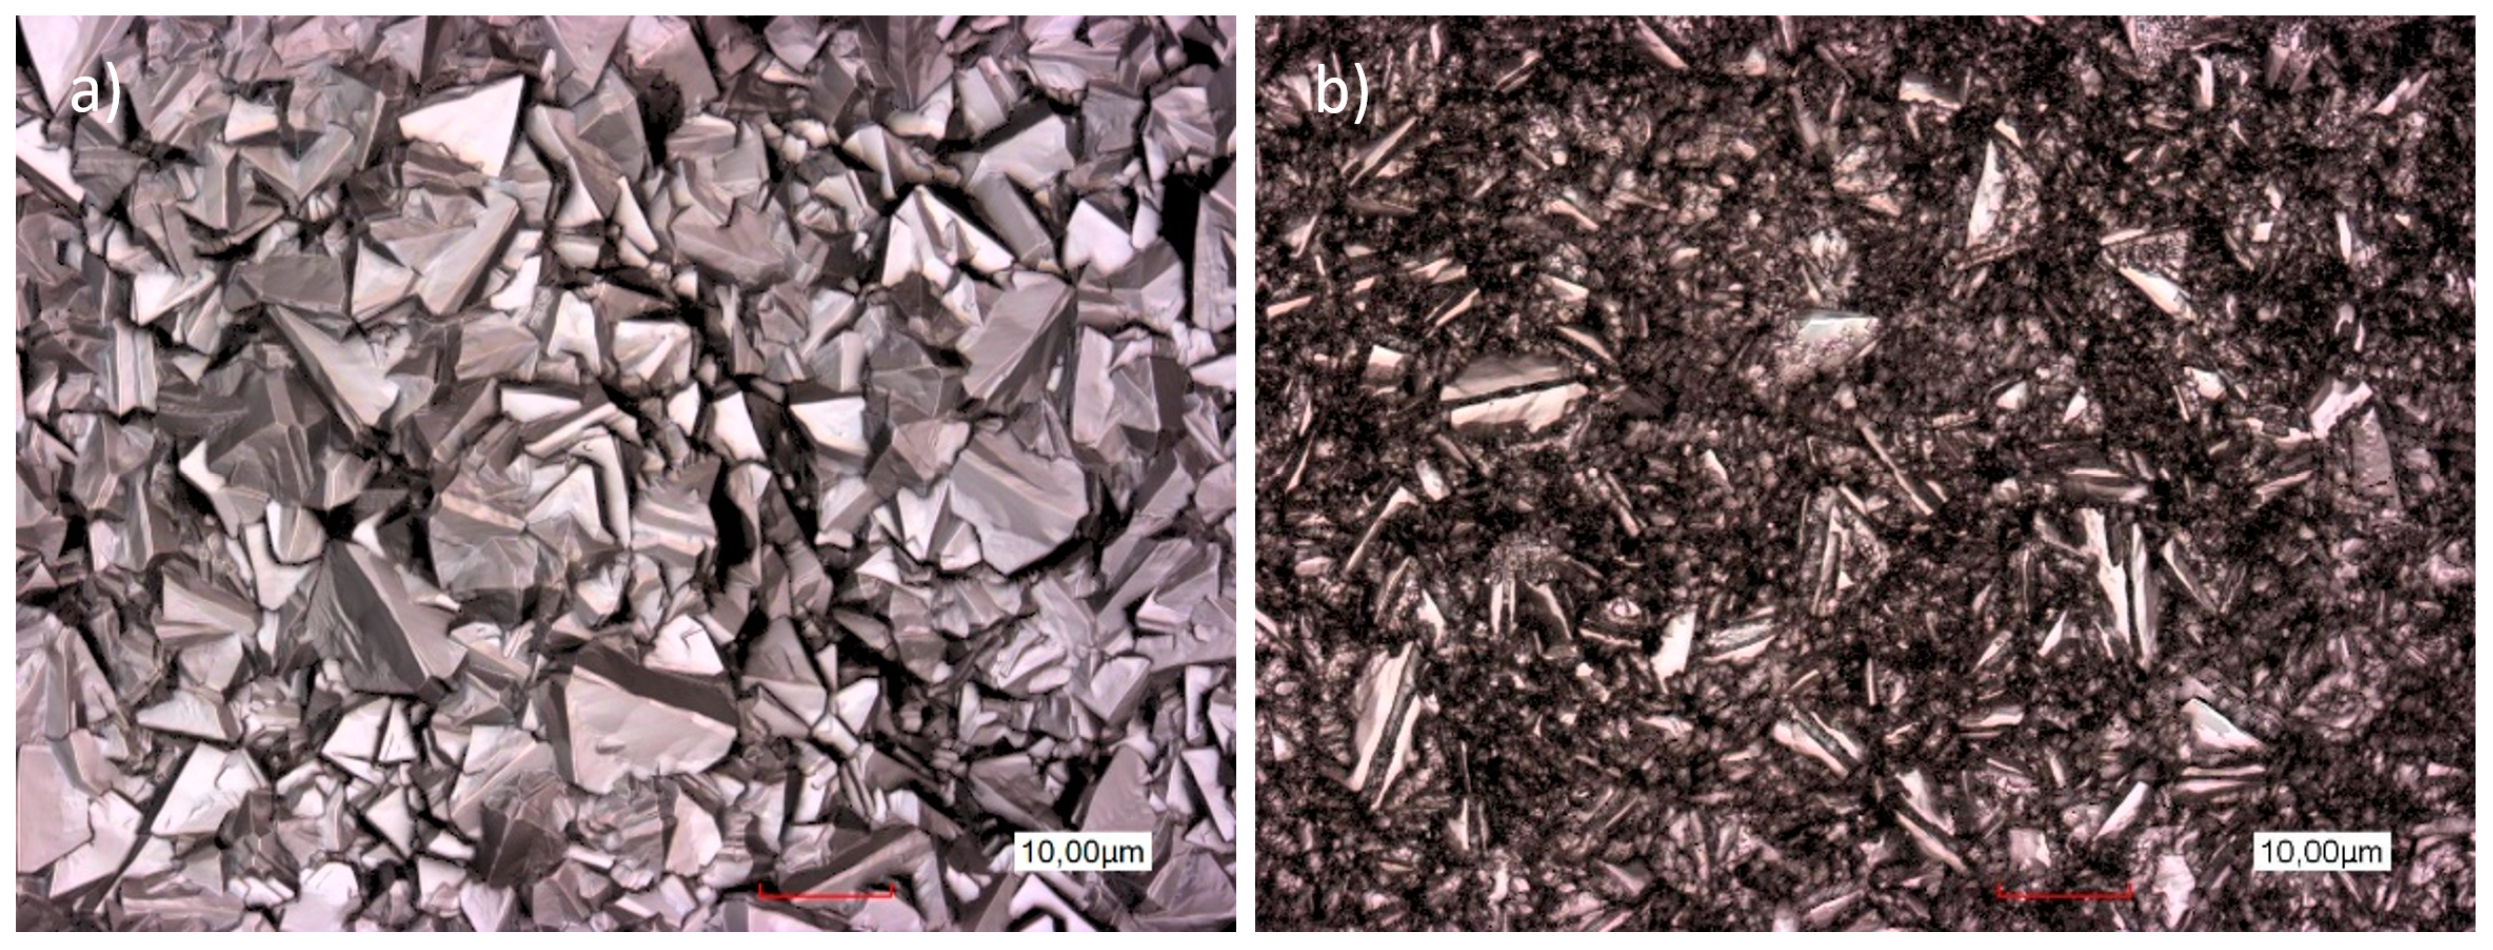
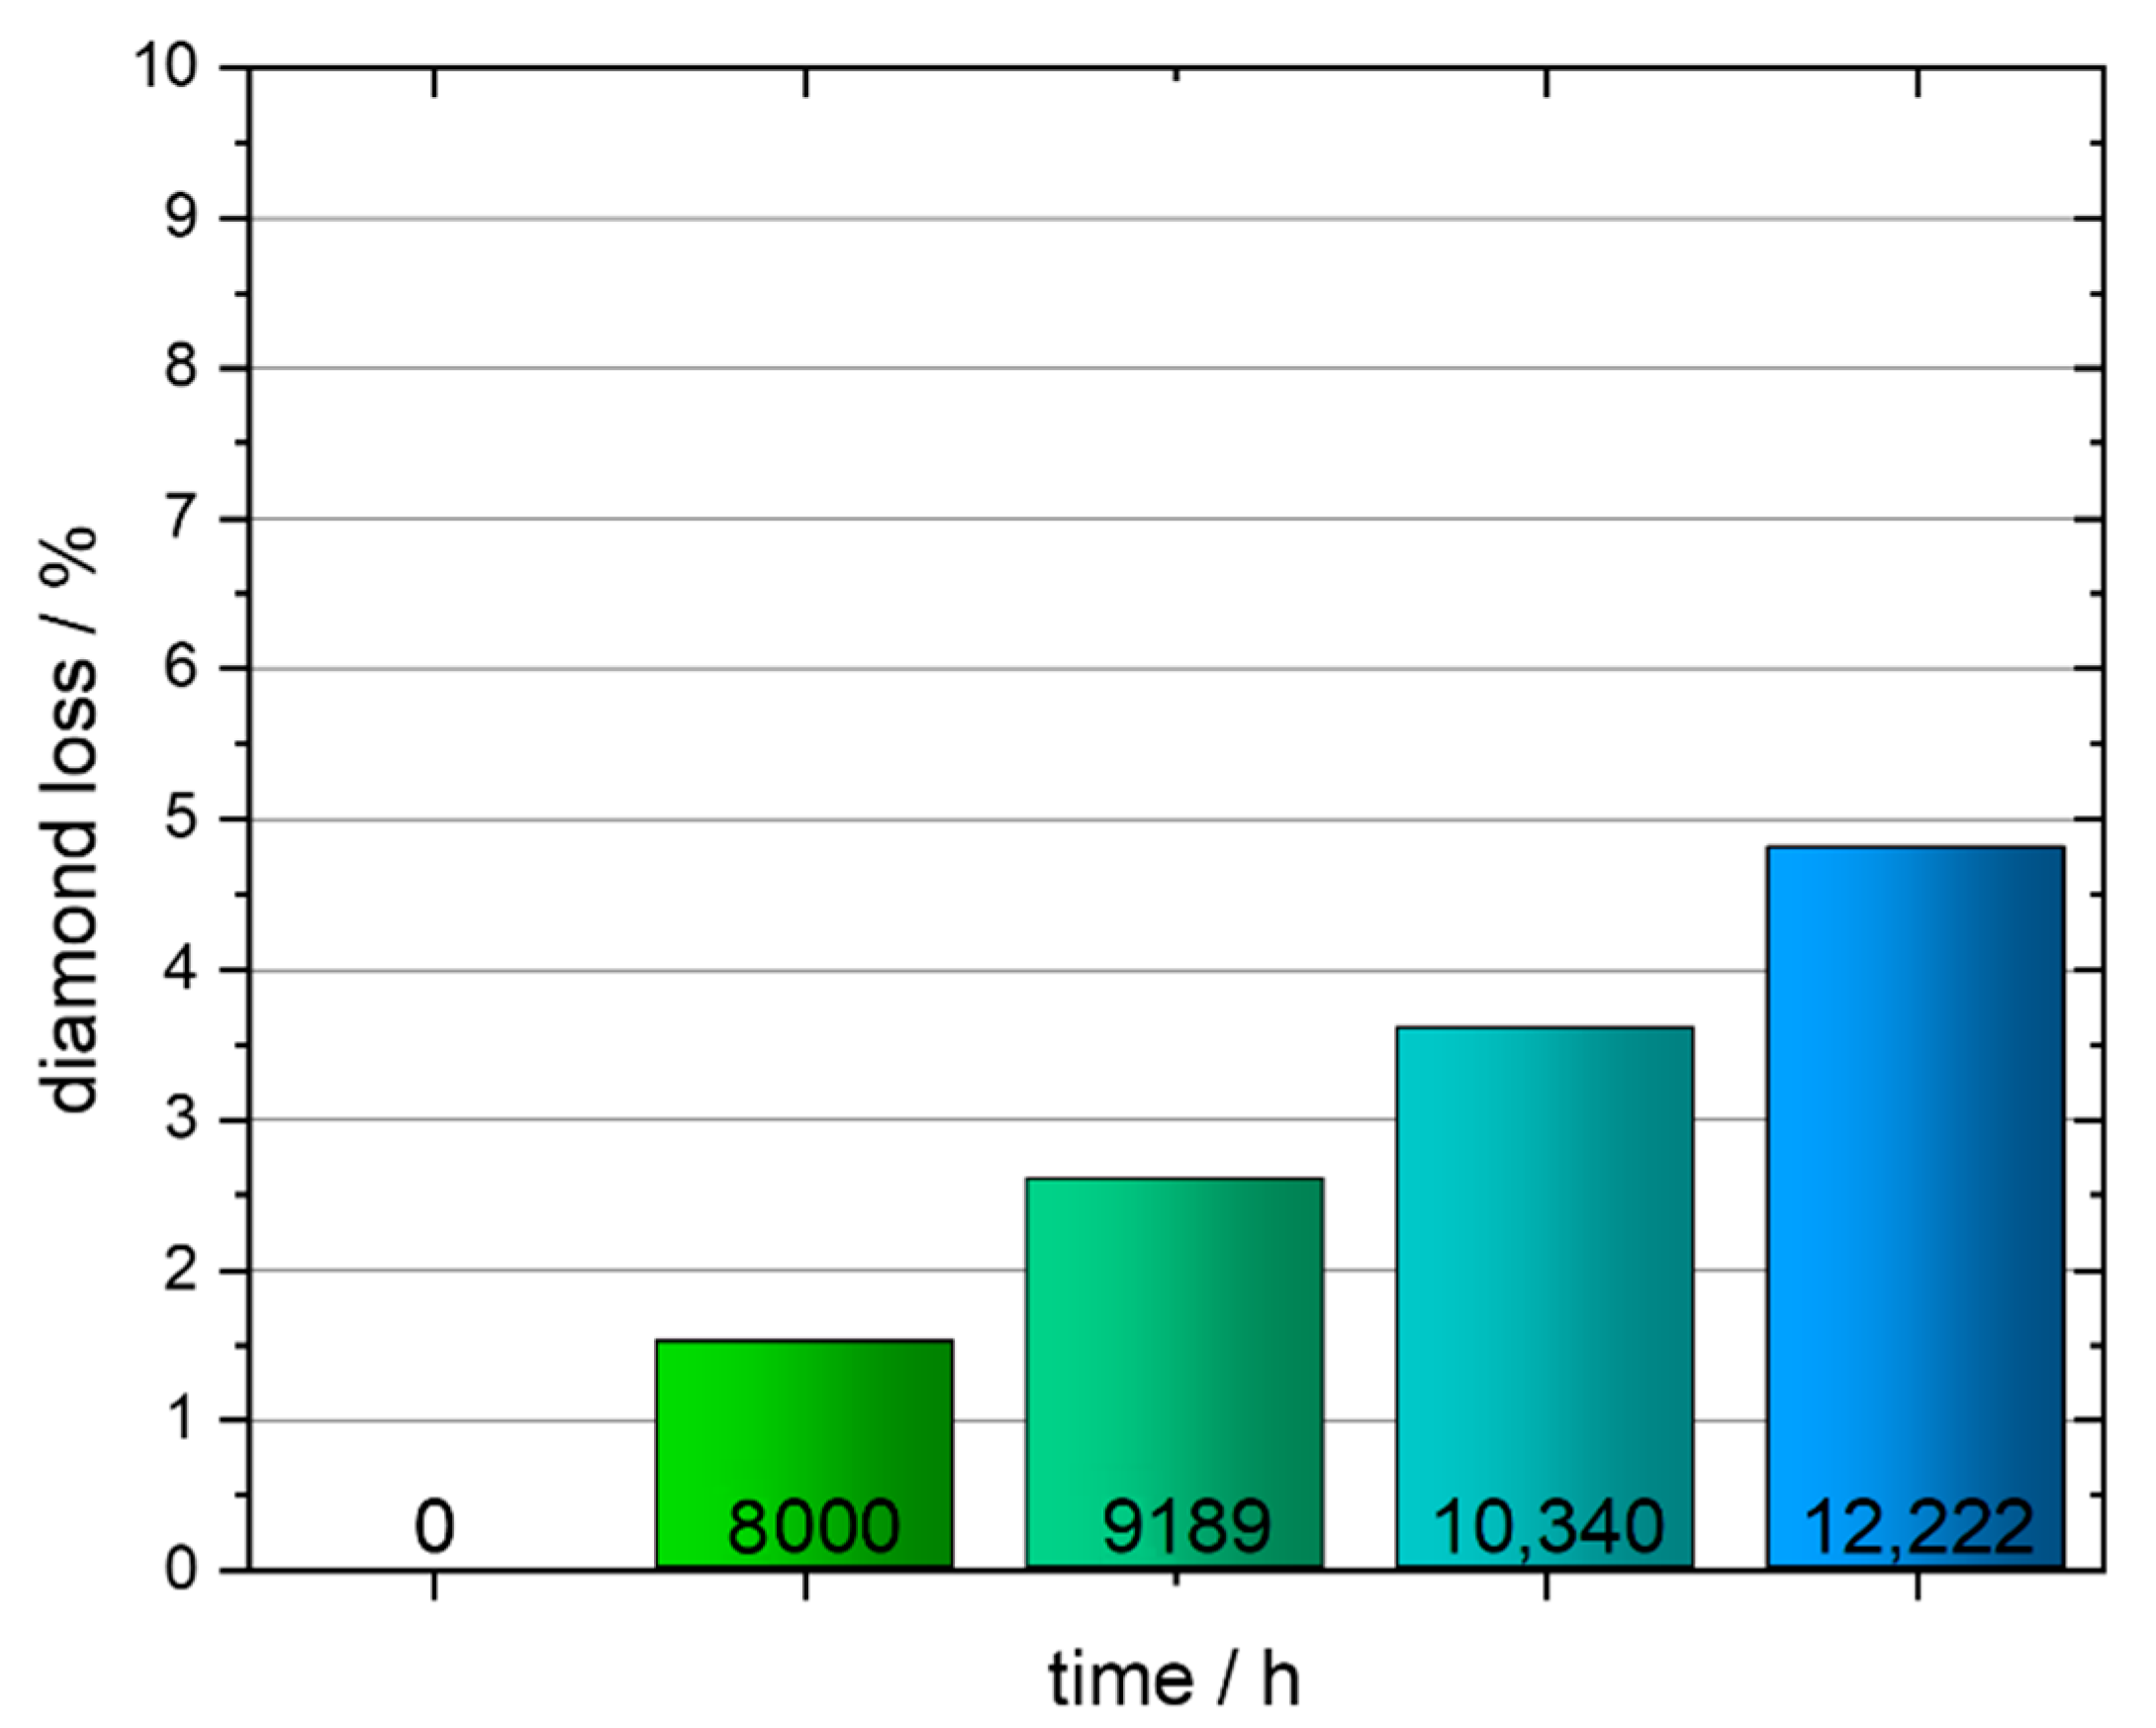
3.1. BDD Coating Thickness

To investigate the degradation of the BDD coating in order to estimate the lifetime of the novel Ta-based BDD (BDD-Ta), the WW treatment with cell type a was carried out 77 times to achieve a total runtime of 12,222 h (Figure S5 shows the COD degradation in dependence of time). Figure 3 shows LSM micrographs before and after the test cycle. The j was set to 0.5 kA m−2 in the first 24 h, to 0.3 kA m−2 between 24 and 96 h, and to 0.1 kA m−2 for the remaining time of each batch. For more experimental details, please refer to Section 3.2.
The test conditions during treatment lead to corrosive reactions to the BDD surface due to intermediates of the phenol degradation [31]. This leads to a change of the morphology appearance, the crystal edges becoming rougher, and the diamond wearing off [32]. During the test period, the diamond coating thickness was measured, with the results given in Figure 4. It is obvious that the treatment conditions reduced the coating thickness by 4.8% during the test.
Linear prediction was performed based on the known results of an additional long-term test, which was also aimed at diamond loss due to the described reactions (see Figure S6 in the Supplementary Information). Here, the diamond loss exhibits a linear progression over sufficient data points over a coating thickness range of 10 to 6 µm. Additional information about the calculations is given in the Supplementary Information. Other prediction options that are theoretically possible due to the low data density in Figure 4 (e.g., exponential progression) were, therefore, discarded. Consequently, the prediction of the lifetime of DIACHEM® was performed using linear extrapolation from 15 to 6 µm based on the described durability test, resulting in a lifetime of approx. 18 years. The estimated and also the measured service life clearly exceeds the values in the literature, e.g., 100–200 h for Ti-based BDD anodes [44].

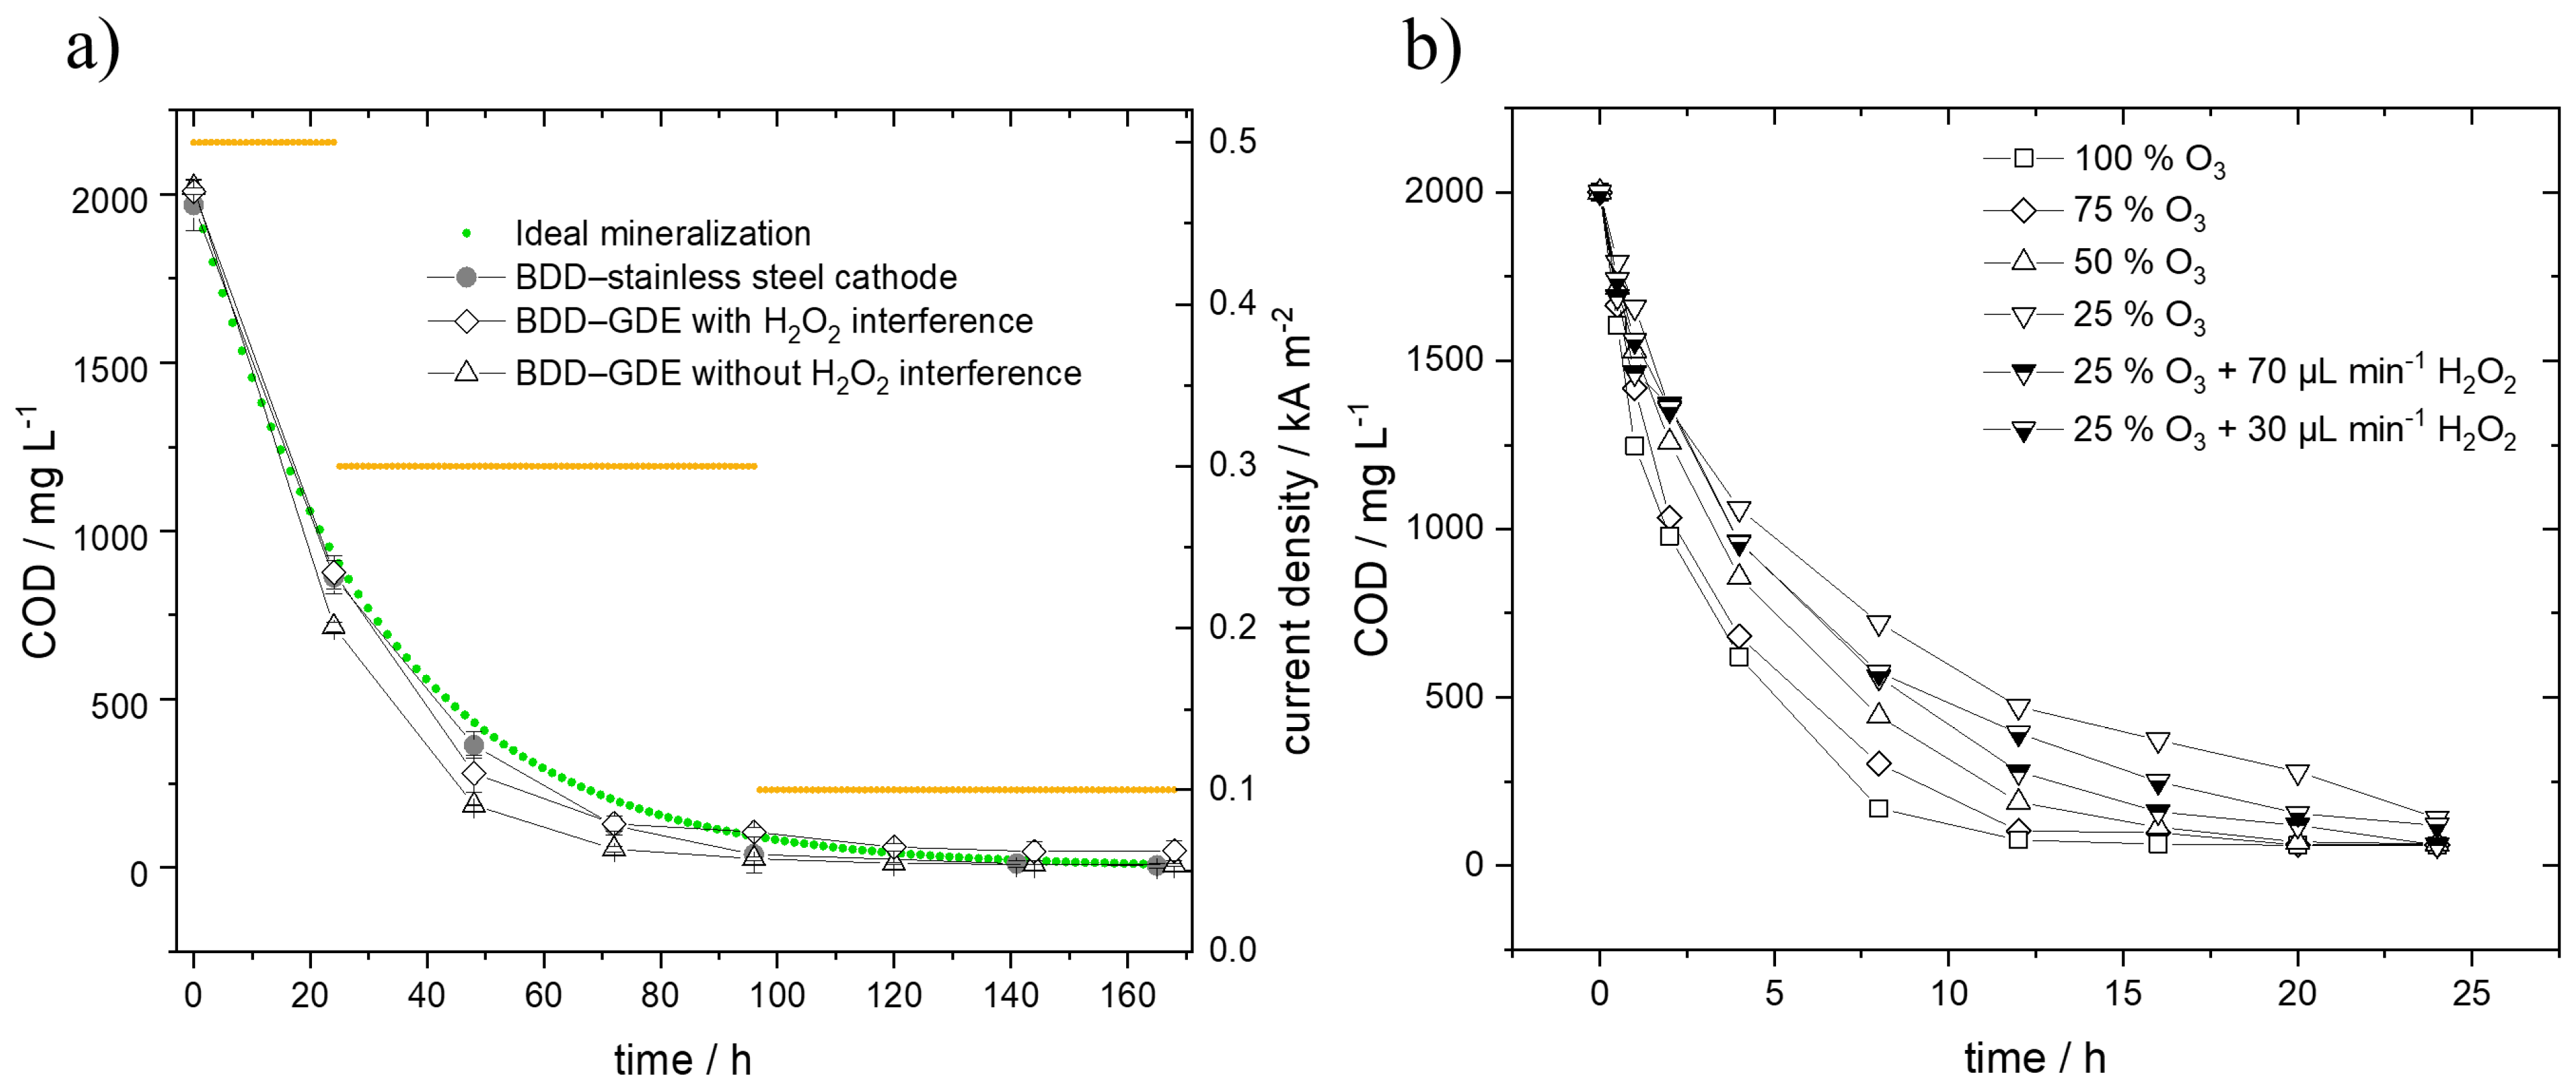
3.2. Treatment Performance of the Electrolysis and the Ozone and Peroxone Processes

Figure 5a shows the results of the electrolyzer processes treating WW in cell type a with a stainless steel cathode and in cell type b with a H2O2-producing GDE in combination with a BDD anode. These results are compared to the ideal mineralization.
All electrolysis-based experiments were conducted over 7 days and at least three times to elucidate statistical errors. To avoid mass transfer limitations due to insufficient amounts of organics, j was set between 0.5 and 0.1 kA m−2 according to Figure 5a. With cell design a, degradation of the organics was achieved, which was congruent with the ideal model progression according to Panizza et al. This was achieved via a homogeneous flow of electrolyte over the anode, sufficiently high turbulence inside the cell, as well as optimized j. The electrolysis in combination with a GDE cathode showed accelerated degradation. While the COD values with H2O2 interference were similar to those with the stainless steel cathode, the corrected values showed accelerated degradation of up to 35% within the first 48 h. In the COD range below about 30 mg L−1, both processes performed similarly due to the low residual concentration. Both processes reached a concentration of approx. 10 mg L−1 on the 6th day, which remained almost constant during day 7. A mineralization rate of >99.5% after 6 days was achieved with both processes. During purification, H2O2 concentrations of 20.34 ± 1.09 mmol L−1 at 0.5 kA m−2 after 24 h, of 7.54 ± 0.92 mmol L−1 at 0.3 kA m−2 on day 4, and of 5.40 ± 0.76 mmol L−1 at 0.1 kA m−2 on day 7 were measured. This is an advantage of the implemented operation with an adjustment of the j, since the residual H2O2 concentration after the purification process is low, e.g., in comparison to Agladze et al., who achieved 113–340 mmol L−1 [22].
The measured concentrations represent an equilibrium between the formation reaction (Equation (4)), H2O2 oxidation at the anode (Equation (14)), the reaction with the hydroxyl radicals formed on the anode side (Equation (15)), self-decomposition (Equation (16)), and the reaction with the organics [45].
H 2 O 2 H 2 O + O 2 + 2 e
H 2 O 2 + ·   OH H 2 O + ·   O 2 H
2 H 2 O 2 2 H 2 O + O 2
Table 1 shows the specific energy demands after 6 days and after reaching a COD concentration of 99 mg L−1 [46], which is the permitted discharge concentration for WW from pharmaceutical productions according to German law (if a circular economy is not yet being pursued).
Taking the same treatment time into account, the usage of the H2O2-generating GDE instead of the stainless steel cathode with HER results in energy savings of approx. 9%. This can be attributed to the higher reduction potential at the cathode (reduction of oxygen to hydrogen peroxide compared to water reduction to hydrogen) on the one hand and to a significant reduction of the cathodic overpotential caused by the application of highly specific catalysts on the other hand. This is also the case when considering the full 7 day cleanup cycle (92.24 ± 4.00 kWh m−3 or 46.12 ± 2.00 kWh kgCOD−1 versus 83.75 ± 0.72 kWh m−3 or 41.88 ± 0.36 kWh kgCOD−1). If the accelerated degradation of the organics due to the BDD–GDE combination is considered, the differences in energy consumption are more significant. Here, cell design b showed an accelerated degradation of up to 35% compared to cell design a. This is explained by the higher concentration of oxidizing agents and the combination of ∙OH and H2O2 enabling the formation of additional oxidation species by consecutive reactions, resulting in more efficient decomposition of organic pollutants [47].
For the ozone process, the WW was treated with different O3 inputs and H2O2 was additionally dosed for the peroxone process (Figure 5b). As expected, a higher O3 input leads to a faster decrease in the COD, although only partially to a lower final value. At power input rates of 100%, 75%, and 50%, final COD values of about 60 mg L−1 were achieved; however, this value is reached after different test times. At power input rates of 100%, 75%, and 50% the minimum COD value were reached after about 12, 20, and 24 h, respectively. The final value of the lowest power input was about 150 mg L−1. Column 5 in Table 2 shows the specific O3 demand per COD during the 24 h treatment.
It shows that a lower power input to the O3 generator and thus a lower O3 concentration in the reactor lead to a lower specific energy demand for the removal of phenol. The mass transport of the O3 limits the phenol degradation rate significantly. The minimum COD value is reached after about 24 h with a power input of 25% and a H2O2 dosing of 70 μL min−1, similar to the ozone process with a power input of 50%. Consequently, a small amount of H2O2 significantly accelerates the degradation of phenol due to the formation of superoxide radicals (Equations (17) and (18)):
H 2 O 2 HO 2 + H +
HO 2 + O 3   Δ O 2 H + O 3
With a power input of 25% and a H2O2 dosing of 30 μL min−1, the final value is higher (120 mg L−1). It can be observed that the addition of H2O2 increases the specific energy demand compared to the ozone process with a power input of 25%, but again decreases in terms of the degradation rate compared to the ozone process with a power input of 50%. Furthermore, the solubility of O3 in water is considerably lower than that of H2O2 [48]. Consequently, O3 tends to outgas in comparison to H2O2 and thus leaves the reactor without colliding with phenol. In contrast, the ozone process with a power input of 75%, exhibits both a lower specific energy demand as well as a greater decrease in the COD value than the peroxonation process with a power input of 25% and H2O2 addition of 70 μL min−1.
The results of the experiments show that up to 97% mineralization can be achieved using ozonation or peroxonation, requiring 4.9 to 13.4 times more energy than the electrolysis process with BDD–GDE and 4.5 to 12.3 more than the BDD–stainless steel process.

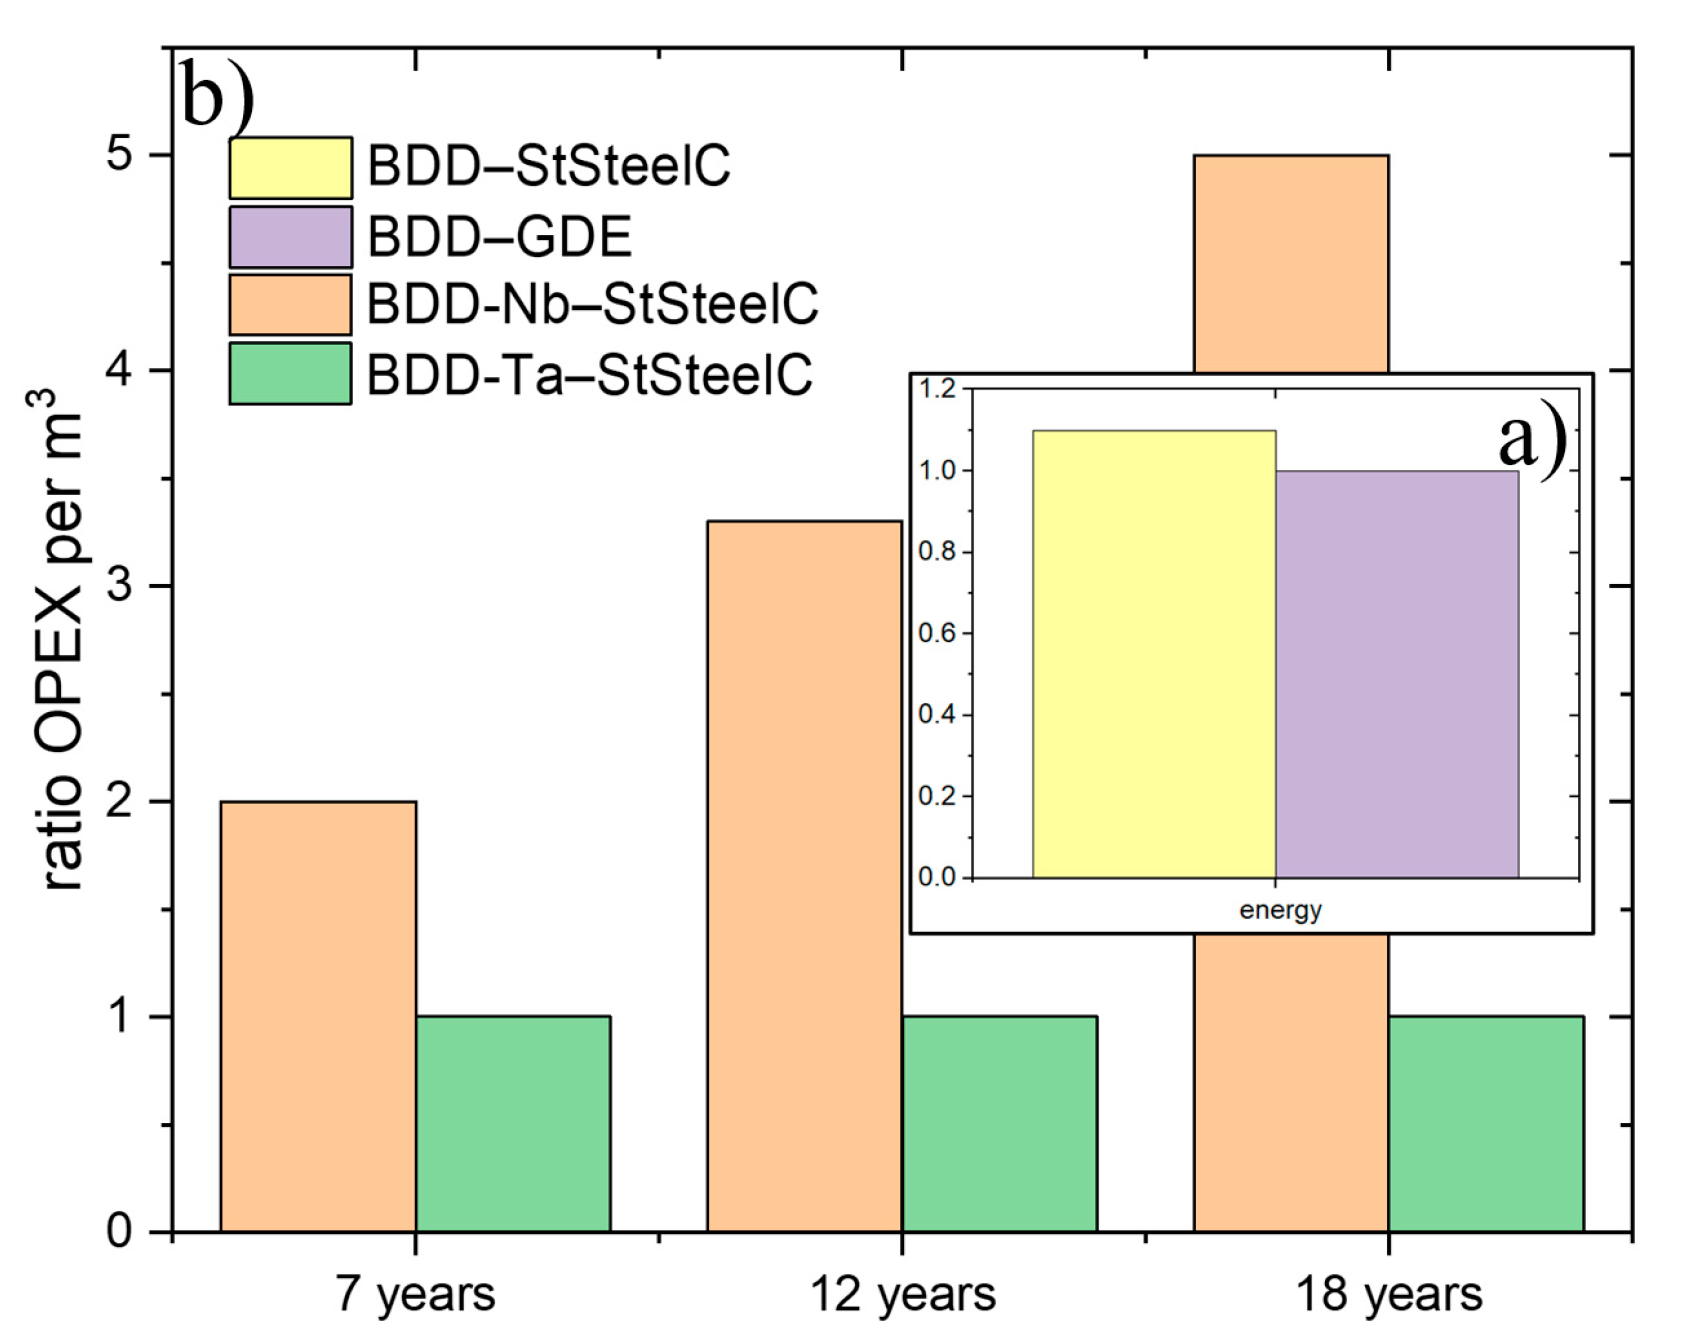
3.3. Operational Expense of Ta-BDD-Based EAOP®

With the objective of determining the effects of the innovative materials in a real application, a case study was designed based on the reported test conditions. This approach was taken to determine the advantages of the material improvements and to investigate the industrial applications using the EAOP®, as it is a known fact that the material costs for tantalum substrates are factor 4–5 higher than for niobium. The assumptions for the case study were:
  • 2.5 m3 h−1 WW from pharmaceutical production;
  • COD degradation from 2 g L−1 to 0.02 g L−1;
  • 7, 12, or 18 year lifetime for tantalum-based DIACHEM® electrodes, based on the BDD coating thickness investigation carried out in this study;
  • 2 year lifetime for niobium-based DIACHEM® electrodes as the reference material, which is the previous standard material for BDD electrodes, based on our industrial experience, which is consistent with Comninellis et al. [49];
  • 0.1 € kWh−1 energy costs;
  • Specific charge of degradation with cell BDD–stainless steel process is equal to specific charge of degradation with cell BDD–GDE process;
  • Adapted current density from 0.5 kA m−2 to 0.1 kA m−2 as performed during the investigations.
DIACHEM® electrodes are consumable due to the described wear mechanism, meaning they have to be replaced at the end of their lifetime. In addition to energy costs, the costs for replacement electrodes are part of the OPEX of an industrial wastewater treatment plant. Different cell configurations were considered in the case study. In order to evaluate the influence of electrode replacement on OPEX, the cell equipped with the BDD of niobium and stainless steel cathodes was compared with the cell equipped with BDD made of tantalum and stainless steel cathodes. In order to evaluate the influence of the cathode type, a cell equipped with BDD anodes with stainless steel cathodes was compared with a cell equipped with BDD anodes and GDE cathodes.
The OPEX values of the different scenarios were determined mainly for OPEX of electrode replacement related to the increased lifetime of the BDD electrodes due to the investigated material improvements (Figure 6).
The improvements were mainly due to the novel electrode based on the tantalum substrate and the specific coating instead of the niobium-based BDD electrode, in addition to the adapted process parameter and the specific edge-protecting cell design. The purchase costs for the substrate material and the costs for the electrode production were based on real offers from suppliers and effort calculations of a real BDD production with HF-CVD processes.
The OPEX comparison for energy costs shows that the values for the cell with the GDE cathode instead of the stainless steel cathode were 10% better. This advantage is independent of the lifetime of the DIACHEM® anode; therefore, the impact of electrode lifetime was not considered at this point.
The results of the case study show the economic benefits for an industrial application due to the DIACHEM® material innovations. By changing the substrate material, implementing the adapted coating, and using this material in a cell like type a, which was designed to give the longest lifetime for DIACHEM® through the protection of electrode edges, operating cost advantages can be achieved, despite the higher purchase costs for the substrate. The OPEX values for replacement electrodes can be reduced by up to a factor of 5 compared to niobium-based BDD electrodes, depending on the electrode lifetime.

4. Conclusions and Outlook

Two electrochemical reactors based on a BDD anode in combination with a stainless steel cathode (type a) or a GDE (type b) were designed and compared with each other for the treatment of artificial pharmaceutical wastewater and against the ozonation and peroxonation processes. The usage of a BDD–GDE system achieves a degradation efficiency of up to 135% in comparison with the BDD–stainless steel system. In addition, the BDD–GDE system does only require 75%, 14%, and 8% of the energy demands of the BDD–stainless steel, ozonation, and peroxonation systems, respectively.
The treatment efficiency rates of nearly 100% for both investigated electrolysis systems allow lower specific energy consumption rates compared to most of the investigated electrochemical processes in the literature (Table 3).
High levels of mineralization probably make the issue of transformation products obsolete and should be investigated in further studies to allow the water to be reused or ecologically discharged. Since traditional BDD anodes are considered a cost driver for EAOP® applications in the literature, the long-term stability of the newly developed tantalum-based BDD was determined. The diamond wear-off of this next-generation anode allows the assumption that the BDD has a long-term stability of up to 18 years when process parameters and cell design are adapted to this specific anode material. Based on this finding, a case study was conducted to demonstrate that the significantly increased long-term stability of the tantalum-based BDD lowers the operational costs as compared to the previous standard material niobium for industrial applications, as the OPEX for replacement electrode is reduced by up to 80%.
Due to the significantly higher electrode costs for BDDs compared to GDEs and the “lack of well-functioning and stable” [44] anodes described in literature, the long-term stability of the anode was assessed in this study. In future investigations, the long-term performance of the GDE should also be evaluated in cell type b for use periods >1 year. Regarding the operational parameters, the differential pressure in the air compartment and the air flow rate should be optimized for further energy savings [42]. To further reduce the carbon emissions and costs of EAOPs and to ensure they operate in more eco-sustainable manners, BDD-based treatment processes were coupled with RE in previous studies, with these results compared to the current study in Table 4. It is obvious that the Esc competes with the literature by using the investigated electrode combination and the current adaption operation. Future studies should investigate how cell types a and b can be powered by RE. While the mentioned studies show that BDD anodes can be operated in a battery-buffered manner or directly coupled with a photovoltaic or wind turbine, the effects of load fluctuations on the lifetime of a GDE are unknown. As such, it may be important to consider the cost/benefit ratio for interconnected buffer storage.
While the ozone and peroxone processes operate volumetrically, the electrolysis processes require larger electrode areas for upscaling to ensure proper mass transfer at the anode surface; therefore, a cell with a greater electrode area needs to be developed to enable easy upscaling in addition to numbering up.
The novel electrolysis with Tantalum-based BDD and GDE is highly suitable for wastewater treatment fulfilling the requirements of a sustainable system for a circular economy.

Supplementary Materials

The following are available online at https://0-www-mdpi-com.brum.beds.ac.uk/article/10.3390/pr9091482/s1: Figure S1: Schematic sequence of GDE production by calandering. The calandered GDEs were coated on one side of the substrate mesh. Figure S2: Exploded view of cell design a with a stainless steel cathode and a boron-doped diamond anode. Figure S3: The structured steel plate (a) and the PTFE frame (b) in cell design b. Figure S4: Correlation between the measured COD values, including an overdetermination due to H2O2 interference, and the real COD values for phenol in 9 g L−1 Na2SO4 solution. Different H2O2 concentrations were investigated, which are given in the figure legend above. Table S1: Equations of the linear fits from Figure S4. The coefficient of determination (R2) was 0.9985for the given equations. Figure S5: COD degradation in dependence of time during 77 batch treatments, with a total runtime of 12,222 h with cell type a. Figure S6: Durability test of a BDD anode. The diamond loss was between 6 and 10 µm. The coefficient of determination (R2) of the linear regression was 0.994. The conditions for the accelerated corrosion test were in accordance with those published in [31,32] for diamond etching due to high current densities (j >> 1 kA m−2) and the degradation of an electrolyte of short-chain CH3-containing molecules.

Author Contributions

T.M. (Thorben Muddemann) and R.N., conceptualization, methodology, investigation, validation, data curation, visualization, writing—original draft preparation, writing—review and editing. D.H., investigation, writing—review and editing. T.G., writing—review and editing. M.I., investigation. F.B., investigation. M.E., investigation. J.M., investigation. T.M. (Thorsten Matthée), conceptualization, writing—review and editing. M.S. and U.K., supervision, project administration, funding acquisition, writing—review and editing. All authors have read and agreed to the published version of the manuscript.

Funding

This research was funded by Federal Ministry of Education and Research (Bundesministerium für Bildung und Forschung), BMBF, contract numbers 03XP0107G and 03XP0107B.

Institutional Review Board Statement

Not applicable.

Informed Consent Statement

Not applicable.

Data Availability Statement

Not applicable.

Acknowledgments

The authors thank the Federal Ministry of Education and Research (Bundesministerium für Bildung und Forschung), BMBF, Germany, for funding this study.

Conflicts of Interest

The authors declare no conflict of interest. The funders had no role in the design of the study; in the collection, analyses, or interpretation of data; in the writing of the manuscript, or in the decision to publish the results.

References

  1. Martínez-Huitle, C.A.; Panizza, M. Electrochemical oxidation of organic pollutants for wastewater treatment. Curr. Opin. Electrochem. 2018, 11, 62–71. [Google Scholar] [CrossRef]
  2. Särkkä, H.; Bhatnagar, A.; Sillanpää, M. Recent developments of electro-oxidation in water treatment—A review. J. Electroanal. Chem. 2015, 754, 46–56. [Google Scholar] [CrossRef]
  3. Ganiyu, S.O.; Martínez-Huitle, C.A.; Rodrigo, M.A. Renewable energies driven electrochemical wastewater/soil decontamination technologies: A critical review of fundamental concepts and applications. Appl. Catal. Environ. 2020, 270, 118857. [Google Scholar] [CrossRef]
  4. Ganiyu, S.O.; Martínez-Huitle, C.A.; Oturan, M.A. Electrochemical advanced oxidation processes for wastewater treatment: Advances in formation and detection of reactive species and mechanisms. Curr. Opin. Electrochem. 2020, 27, 100678. [Google Scholar] [CrossRef]
  5. Jiang, H.; Dang, C.; Liu, W.; Wang, T. Radical attack and mineralization mechanisms on electrochemical oxidation of p-substituted phenols at boron-doped diamond anodes. Chemosphere 2020, 248, 126033. [Google Scholar] [CrossRef] [PubMed]
  6. Muddemann, T.; Haupt, D.; Sievers, M.; Kunz, U. Elektrochemische Reaktoren für die Wasserbehandlung. Chem. Ing. Tech. 2019, 91, 769–785. [Google Scholar] [CrossRef] [Green Version]
  7. Simon, R.G.; Stöckl, M.; Becker, D.; Steinkamp, A.-D.; Abt, C.; Jungfer, C.; Weidlich, C.; Track, T.; Mangold, K.-M. Current to clean water—Electrochemical solutions for groundwater, water, and wastewater treatment. Chem. Ing. Tech. 2018, 90, 1832–1854. [Google Scholar] [CrossRef]
  8. Ganiyu, S.O.; Martínez-Huitle, C.A. The use of renewable energies driving electrochemical technologies for environmental applications. Curr. Opin. Electrochem. 2020, 22, 211–220. [Google Scholar] [CrossRef]
  9. Radjenovic, J.; Sedlak, D.L. Challenges and opportunities for electrochemical processes as next-generation technologies for the treatment of contaminated water. Environ. Sci. Technol. 2015, 49, 11292–11302. [Google Scholar] [CrossRef] [PubMed]
  10. Barndõk, H.; Hermosilla, D.; Negro, C.; Blanco, A.M. Comparison and predesign cost assessment of different advanced oxidation processes for the treatment of 1,4-dioxane-containing wastewater from the chemical industry. ACS Sustain. Chem. Eng. 2018, 6, 5888–5894. [Google Scholar] [CrossRef]
  11. He, Y.; Lin, H.; Guo, Z.; Zhang, W.; Li, H.; Huang, W. Recent developments and advances in boron-doped diamond electrodes for electrochemical oxidation of organic pollutants. Sep. Purif. Technol. 2018, 212, 802–821. [Google Scholar] [CrossRef]
  12. Muddemann, T.; Bulan, A.; Sievers, M.; Kunz, U. Avoidance of chlorine formation during electrolysis at boron-doped diamond anodes in highly sodium chloride containing and organic-polluted wastewater. J. Electrochem. Soc. 2018, 165, J3281–J3287. [Google Scholar] [CrossRef]
  13. Muddemann, T.; Haupt, D.; Sievers, M.; Kunz, U. Electrochemical reactors for wastewater treatment. Chem. Biol. Eng. Rev. 2019, 6, 142–156. [Google Scholar] [CrossRef]
  14. Campos-Martin, J.M.; Blanco-Brieva, G.; Fierro, J.L.G. Hydrogen peroxide synthesis: An outlook beyond the anthraquinone process. Angew. Chem. Int. Ed. 2006, 45, 6962–6984. [Google Scholar] [CrossRef]
  15. Giomo, M.; Buso, A.; Fier, P.; Sandona, G.; Boye, B.; Farnia, G. A small-scale pilot plant using an oxygen-reducing gas-diffusion electrode for hydrogen peroxide electrosynthesis. Electrochim. Acta 2008, 54, 808–815. [Google Scholar] [CrossRef]
  16. Elvers, B. Ullmann’s Encyclopedia of Industrial Chemistry; Chemie: Berlin/Heidelberg, Germany, 1991. [Google Scholar]
  17. Busca, G.; Berardinelli, S.; Resini, C.; Arrighi, L. Technologies for the removal of phenol from fluid streams: A short review of recent developments. J. Hazard. Mater. 2008, 160, 265–288. [Google Scholar] [CrossRef]
  18. Moussallem, I.; Jörissen, J.; Kunz, U.; Pinnow, S.; Turek, T. Chlor-alkali electrolysis with oxygen depolarized cathodes: History, present status and future prospects. J. Appl. Electrochem. 2008, 38, 1177–1194. [Google Scholar] [CrossRef]
  19. Cornejo, O.M.; Murrieta, M.F.; Castañeda, L.F.; Nava, J.L. Characterization of the reaction environment in flow reactors fitted with BDD electrodes for use in electrochemical advanced oxidation processes: A critical review. Electrochim. Acta 2019, 331, 135373. [Google Scholar] [CrossRef]
  20. Dominguez-Ramos, A.; Aldaco, R.; Irabien, A. Photovoltaic solar electrochemical oxidation (PSEO) for treatment of lignosulfonate wastewater. J. Chem. Technol. Biotechnol. 2010, 85, 821–830. [Google Scholar] [CrossRef]
  21. Luo, H.; Li, C.; Wu, C.; Zheng, W.; Dong, X. Electrochemical degradation of phenol by in situ electro-generated and electro-activated hydrogen peroxide using an improved gas diffusion cathode. Electrochim. Acta 2015, 186, 486–493. [Google Scholar] [CrossRef]
  22. Agladze, G.R.; Tsurtsumia, G.S.; Jung, B.-I.; Kim, J.-S.; Gorelishvili, G. The “In-cell” and “Ex-cell” Fenton treatment of phenol, 4-chlorophenol and aniline. J. Appl. Electrochem. 2007, 37, 385–393. [Google Scholar] [CrossRef]
  23. Huang, B.-C.; Jiang, J.; Wang, W.-K.; Li, W.-W.; Zhang, F.; Jiang, H.; Yu, H.-Q. Electrochemically catalytic degradation of phenol with hydrogen peroxide in situ generated and activated by a municipal sludge-derived catalyst. ACS Sustain. Chem. Eng. 2018, 6, 5540–5546. [Google Scholar] [CrossRef]
  24. Abbas, Z.I.; Abbas, A. Oxidative degradation of phenolic wastewater by electro-fenton process using MnO2-graphite electrode. J. Environ. Chem. Eng. 2019, 7, 103108. [Google Scholar] [CrossRef]
  25. Ma, H.; Zhang, X.; Ma, Q.; Wang, B. Electrochemical catalytic treatment of phenol wastewater. J. Hazard. Mater. 2009, 165, 475–480. [Google Scholar] [CrossRef] [PubMed]
  26. Shi, L.; Xu, F.; Gao, J.; Yuen, M.; Sun, S.; Xu, J.; Jia, K.; Zuo, D. Nanostructured boron-doped diamond electrode for degradation of the simulation wastewater of phenol. Diam. Relat. Mater. 2020, 109, 108098. [Google Scholar] [CrossRef]
  27. Gui, L.; Chen, Z.; Chen, B.; Song, Y.; Yu, Q.; Zhu, W.; Hu, Q.; Liu, Y.; Zheng, Z.; Ze, L.; et al. Preparation and characterization of ZnO/PEG-Co(II)-PbO2 nanocomposite electrode and an investigation of the electrocatalytic degradation of phenol. J. Hazard. Mater. 2020, 399, 123018. [Google Scholar] [CrossRef]
  28. Li, X.-Y.; Cui, Y.-H.; Feng, Y.; Xie, Z.-M.; Gu, J.-D. Reaction pathways and mechanisms of the electrochemical degradation of phenol on different electrodes. Water Res. 2005, 39, 1972–1981. [Google Scholar] [CrossRef] [Green Version]
  29. Wu, Z.; Zhou, M. Partial degradation of phenol by advanced electrochemical oxidation process. Environ. Sci. Technol. 2001, 35, 2698–2703. [Google Scholar] [CrossRef] [PubMed]
  30. Haupt, D.; Muddemann, T.; Kunz, U.; Sievers, M. Evaluation of a new electrochemical concept for vacuum toilet wastewater treatment—Comparison with ozonation and peroxone processes. Electrochem. Commun. 2019, 101, 115–119. [Google Scholar] [CrossRef]
  31. Suzuki, H.; Araki, S.; Yamamoto, H. Evaluation of advanced oxidation processes (AOP) using O3, UV, and TiO2 for the degradation of phenol in water. J. Water Process. Eng. 2015, 7, 54–60. [Google Scholar] [CrossRef]
  32. Panizza, M.; Sineé, G.; Duo, I.; Ouattara, L.; Comninellis, C. Electrochemical polishing of boron-doped diamond in organic media. Electrochem. Solid State Lett. 2003, 6, D17. [Google Scholar] [CrossRef]
  33. de Araújo, D.M.; Sáez, C.; Cañizares, P.; Rodrigo, M.A.; Martínez-Huitle, C.A. Improving the catalytic effect of peroxodisulfate and peroxodiphosphate electrochemically generated at diamond electrode by activation with light irradiation. Chemosphere 2018, 207, 774–780. [Google Scholar] [CrossRef] [Green Version]
  34. Serrano, K.G. A critical review on the electrochemical production and use of peroxo-compounds. Curr. Opin. Electrochem. 2020, 27, 100679. [Google Scholar] [CrossRef]
  35. Liu, H.; Bruton, T.A.; Doyle, F.M.; Sedlak, D.L. In situ chemical oxidation of contaminated groundwater by persulfate: Decomposition by Fe(III) and Mn(IV) containing oxides and aquifer materials. Environ. Sci. Technol. 2014, 48, 10330–10336. [Google Scholar] [CrossRef] [PubMed] [Green Version]
  36. Assumpção, M.; De Souza, R.; Rascio, D.; Silva, J.C.; Calegaro, M.; Gaubeur, I.; Paixao, T.; Hammer, P.; Lanza, M.; Santos, M. A comparative study of the electrogeneration of hydrogen peroxide using Vulcan and Printex carbon supports. Carbon 2011, 49, 2842–2851. [Google Scholar] [CrossRef]
  37. Barros, W.; Wei, Q.; Zhang, G.; Sun, S.; Lanza, M.; Tavares, A.C. Oxygen reduction to hydrogen peroxide on Fe3O4 nanoparticles supported on Printex carbon and Graphene. Electrochim. Acta 2015, 162, 263–270. [Google Scholar] [CrossRef]
  38. Fryda, M.; Matthée, T.; Mulcahy, S.; Hampel, A.; Schäfer, L.; Tröster, I. Fabrication and application of Diachem electrodes. Diam. Relat. Mater. 2003, 12, 1950–1956. [Google Scholar] [CrossRef]
  39. Neuber, R.; Grassl, T.; Matthée, T. Elektrochemische Zelle. EP3816322, 29 October 2020. [Google Scholar]
  40. Lee, E.; Lee, H.; Kim, Y.K.; Sohn, K.; Lee, K. Hydrogen peroxide interference in chemical oxygen demand during ozone based advanced oxidation of anaerobically digested livestock wastewater. Int. J. Environ. Sci. Technol. 2011, 8, 381–388. [Google Scholar] [CrossRef] [Green Version]
  41. Issa, M.; Muddemann, T.; Haupt, D.; Kunz, U.; Sievers, M. Simple catalytical approach for removal of analytical interferences caused by hydrogen peroxide in a standard chemical oxygen demand test. J. Environ. Eng. 2021. [Google Scholar] [CrossRef]
  42. Muddemann, T.; Haupt, D.R.; Sievers, M.; Kunz, U. Improved operating parameters for hydrogen peroxide-generating gas diffusion electrodes. Chem. Ing. Tech. 2020, 92, 505–512. [Google Scholar] [CrossRef] [Green Version]
  43. Panizza, M.; Brillas, E.; Comninellis, C. Application of boron-doped diamond electrodes for wastewater treatment. J. Environ. Eng. Manag. 2008, 18, 139–153. [Google Scholar]
  44. Moradi, M.; Vasseghian, Y.; Khataee, A.; Kobya, M.; Arabzade, H.; Dragoi, E.-N. Service life and stability of electrodes applied in electrochemical advanced oxidation processes: A comprehensive review. J. Ind. Eng. Chem. 2020, 87, 18–39. [Google Scholar] [CrossRef]
  45. Ginovska, B.; Dupuis, M.; Camaioni, D.M. The H2O2+OH→HO2+H2O reaction in aqueous solution from a charge-dependent continuum model of solvation. J. Chem. Phys. 2008, 129, 014506. [Google Scholar] [CrossRef]
  46. Verordnung über Anforderungen an das Einleiten von Abwasser in Gewässer (Abwasserverordnung-AbwV). Available online: https://www.gesetze-im-internet.de/abwv/AbwV.pdf (accessed on 29 July 2021).
  47. Sievers, M. Advanced Oxidation Processes. In Treatise of Water Science; Wilderer, P., Ed.; Elsevier: Oxford, UK, 2011. [Google Scholar]
  48. Haynes, W.M. CRC Handbook of Chemistry and Physics: A Ready-Reference Book of Chemical and Physical Data, 97th ed.; CRC Press: London, UK, 2017. [Google Scholar]
  49. Kraft, A. Doped diamond: A compact review on a new, versatile electrode material. Int. J. Electrochem. Sci. 2007, 2, 355–385. [Google Scholar]
  50. Duan, X.; Ma, F.; Yuan, Z.; Chang, L.; Jin, X. Electrochemical degradation of phenol in aqueous solution using PbO2 anode. J. Taiwan Inst. Chem. Eng. 2012, 44, 95–102. [Google Scholar] [CrossRef]
  51. Jin, P.; Chang, R.; Liu, D.; Zhao, K.; Zhang, L.; Ouyang, Y. Phenol degradation in an electrochemical system with TiO2/activated carbon fiber as electrode. J. Environ. Chem. Eng. 2014, 2, 1040–1047. [Google Scholar] [CrossRef]
  52. García-García, A.; Martínez-Miranda, V.; Martínez-Cienfuegos, I.G.; Almazán-Sánchez, P.T.; Castañeda-Juárez, M.; Linares-Hernández, I. Industrial wastewater treatment by electrocoagulation-electrooxidation processes powered by solar cells. Fuel 2015, 149, 46–54. [Google Scholar] [CrossRef]
  53. Henrique, J.; De Andrade, D.C.; Neto, E.L.B.; Da Silva, D.R.; Dos Santos, E.V. Solar-powered BDD-electrolysis remediation of soil washing fluid spiked with diesel. J. Chem. Technol. Biotechnol. 2019, 94, 2999–3006. [Google Scholar] [CrossRef]
  54. Souza, F.; Lanza, M.; Llanos, J.; Sáez, C.; Rodrigo, M.A.; Cañizares, P. A wind-powered BDD electrochemical oxidation process for the removal of herbicides. J. Environ. Manag. 2015, 158, 36–39. [Google Scholar] [CrossRef] [PubMed]
Figure 1. Scanning electron microscope images of a (a) boron-doped diamond anode and (b) a carbon-based H2O2-producing gas diffusion electrode on a Ni carrier.
Processes 09 01482 g001
Figure 2. The investigated boron-doped diamond-based electrolysis cells with (a) a steel cathode and an active electrode area of 82.6 cm2. (b) A gas diffusion electrode integrated into a steel body with an active electrode area of 41.3 cm2. A sealing with a PTFE frame was used to ensure similar electrode distances of 2 mm. The process streams are sketched. For more details see the Figures S3 and S4 in the Supplementary Information.
Processes 09 01482 g002
Figure 3. Laser scanning microscope photographs of the Ta-based boron-doped diamond anode (a) before initial operation and (b) after 12,222 h of operation.
Processes 09 01482 g003
Figure 4. Evolution of the diamond loss during phenolic wastewater treatment over 12,222 h.
Processes 09 01482 g004
Figure 5. (a) COD concentrations of 18 L (cell type a) and 9 L (cell type b) during the 160 h experiments with two different electrode combinations. BDD, boron-doped diamond anode; GDE, gas diffusion electrode. The selected and adjusted current density values are shown on the 2nd y-axis. (b) COD degradation with O3 and O3 + H2O2 of 2 L wastewater during 24 h experiments. The varied power settings of the O3 generator and the H2O2 dosing flow rate for the peroxone process are given in the legend above. It is noted that different treatment times were chosen due to the different system designs.
Processes 09 01482 g005
Figure 6. Operational expenses for the case study related to (a) energy and (b) electrode replacement costs for EAOP® cell configurations. StSeelC, BDD-Nb and BDD-Ta denotes stainless steel cathode, boron–doped diamond on niobium substrate and boron–doped diamond on tantalum substrate, respectively.
Processes 09 01482 g006
Table 1. Energy demands of the investigated electrolysis setups for COD removal at room temperature.
Electrode ConfigurationEnergy Demand Over 6 DaysEnergy Demand Reaching Concentration of Discharge
E s c , e l . , v o l .
/kWh m−3
E s c , e l . , C O D
/kWh kgCOD−1
E s c , e l . , v o l .
/kWh m−3
E s c , e l . , C O D
/kWh kgCOD−1
BDD–stainless steel cathode87.57 ± 3.9143.79 ± 1.9578.89 ± 3.8439.45 ± 1.92
BDD–GDE80.46 ± 0.7340.23 ± 0.3758.84 ± 1.1829.42 ± 0.59
Table 2. Influence of ozone and peroxone inputs on wastewater treatment after 24 h experiments at room temperature. PO3-gen denotes the power consumption for the selected power settings of the O3 generator. E s c , O 3 , E s c , H 2 O 2 , and E s c , O 3 , C O D denote the specific energy per mass O3, per mass H2O2, and per mass COD, respectively. The mass O3 demand in dependence to the mass COD is given by m O 3 m C O D . The energy demand for the production of the used H2O2 is estimated as 15 kWh kgH2O2−1 according to [30].
Power Setting (O3 Generator) and Optional H2O2 Dosing (Peroxone)
/%
P O 3 g e n .
/W
E s c , O 3
/kWh kgO3−1
E s c , H 2 O 2
/kWh kgH2O2−1
m O 3 m C O D
/mgO3 mgCOD−1
E s c , O 3 , C O D
/kWh kgCOD−1
Idle17.60---
25%30.416.5- 11.9196.3
50%4720.6- 14.1291.5
75%61.522.9- 16.6380.8
100%7624.1- 19.5470.0
25% + 0.03 mL min−1-16.515 11.74 *349.0
25% + 0.07 mL min−1-16.515 11.39 *539.0
* The impact of H2O2 is considered.
Table 3. Comparison of electrochemical phenolic degradation and specific energy consumption results from our study with those from the literature. The main working electrodes cited in the literature are denoted as “C” for cathode and “A” for anode, while details about the investigated electrolysis process are specified in the “special feature” column. Furthermore, cPhenol, CE, and TOC denote the concentration of phenols, current efficiency, and total organic carbon, respectively.
Main ElectrodeSpecial FeaturecPhenol
[mg L−1]
Na2SO4
[g L−1]
Mineralization
Rate
[%]
CE
[%]
Specific Energy per Mass COD or TOC
[kWh kgCOD/TOC−1]
Ref.
CGenerated and activated H2O25028.485 (TOC)--[21]
CIn-cell and ex-cell Fenton282190 (COD)-56.3[22]
CGenerated and activated H2O2407.187 (TOC)--[23]
CElectrochemical catalytic treatment520499 (COD)--[25]
ANanostructured BDD915349 g L−1 H2SO450 (TOC) [26]
AModified PbO2-based anode10014.291.1 (phenol)--[27]
APbO2 anode507.194 (TOC)1.83759[50]
ATiO2 with activated carbon fiber10010.783.3 (phenol)--[51]
ABDD anode8509>99 (COD)≈10043.79This study
A+CBDD anode + H2O2 GDE8509>99 (COD)≈10040.23This study
Table 4. Comparison of the specific energy values per volume and COD of the electrolysis systems with those of the BDD-based electrochemical oxidation systems from literature, which were driven by regenerative energy. Here, ww, CE, PV, and WT denote the concentration wastewater, current efficiency, photovoltaic energy, and wind turbine, respectively.
Main ElectrodeRegenerative EnergyType of wwMineralization
[%]
E s c , e l . , C O D .
[kWh kgCOD−1]
E s c , e l . , v o l .
[kWh m−3]
Ref.
BDDPVIndustrial99 (TOC)-896[52]
BDDPVlignosulfonate90 (TOC)-100[20]
BDDPVSoil washing fluid spiked with diesel57–76 (TOC)2300-[53]
BDDWTherbicides>99 (TOC)-18.75 kAh m−3[54]
BDD-Phenolic>99 (COD)43.7987.57This study
BDD + H2O2-GDE-Phenolic>99 (COD)40.2380.46This study
Publisher’s Note: MDPI stays neutral with regard to jurisdictional claims in published maps and institutional affiliations.

