Article

Techno-Economic and Carbon Footprint Analyses of a Coke Oven Gas Reuse Process for Methanol Production

by
Jean-François Portha
1,*,
Wilmar Uribe-Soto
1,
Jean-Marc Commenge
1,
Solène Valentin
2 and
Laurent Falk
1
1
Laboratoire Réactions et Génie des Procédés, Université de Lorraine, CNRS, LRGP, F-54000 Nancy, France
2
Air Liquide, Centre de Recherche Paris-Saclay, 1 Chemin de la Porte des Loges, Les Loges-en-Josas, BP 126, 78354 Jouy-en-Josas, France
*
Author to whom correspondence should be addressed.
Submission received: 15 May 2021 / Revised: 10 June 2021 / Accepted: 11 June 2021 / Published: 15 June 2021
(This article belongs to the Special Issue Recent Advances in Carbon Dioxide Capture and Utilization)

Abstract

:
This paper focuses on the best way to produce methanol by Coke Oven Gas (COG) conversion and by carbon dioxide capture. The COG, produced in steelworks and coking plants, is an interesting source of hydrogen that can be used to hydrogenate carbon dioxide, recovered from flue gases, into methanol. The architecture of the reuse process is developed and the different process units are compared by considering a hierarchical decomposition. Two case studies are selected, process units are modelled, and flowsheets are simulated using computer-aided design software. A factorial techno-economic analysis is performed together with a preliminary carbon balance to evaluate the economic reliability and the environmental sustainability of the proposed solutions. The production costs of methanol are equal to 228 and 268 €/ton for process configurations involving, respectively, a combined methane reforming of COG and a direct COG separation to recover hydrogen. This cost is slightly higher than the current price of methanol on the market (about 204 €/ton for a process located in the USA in 2013). Besides, the second case study shows an interesting reduction of the carbon footprint with respect to reference scenarios. The carbon dioxide capture from flue gases together with COG utilization can lead to a competitive and sustainable methanol production process depending partly on a carbon tax.

1. Introduction

The iron and steel industry is one of the main energy-intensive industrial sectors together with the cement manufacturing in the world. The associated CO2 emissions are then very large, representing 30% and 26% of the 7.2 Gt of direct CO2 industrial emissions for the steel and cement industry in 2006, respectively [1]. Overall, the CO2 emissions associated with iron and steelmaking account for 5 to 7% of the total anthropogenic emissions [2]. Steel production is a complex process comprising various interconnected units whose configuration depends mainly on the targeted products, the available raw materials, and the energy sources. Almost 70% of steel is produced worldwide by integrated steel mills using the Blast Furnace-Basic Oxygen Furnace (BF-BOF) process. The blast furnace, involving the reaction of iron ore with coking coal as a reducing agent, emits between 65 and 80% of the CO2 emissions of the steelmaking process [3]. Conventional blast furnaces require around 770 kg of coking coal to produce 1 ton of steel. On average, around 2 tons of CO2 are emitted for each ton of steel manufactured, using the blast furnace route [4]. This route also produces by-product gases offering interesting perspectives in terms of a potential recycling. Three main off-gases are generated: The Blast Furnace Gas (BFG), the Basic Oxygen Furnace Gas (BOFG), and the Coke Oven Gas (COG). These gases, produced transiently and containing CO, CO2, and CH4 among other gases, are classically used for energy integration in the steel mills or even burnt in flares without any profit. To mitigate these greenhouse gases emissions, Carbon Capture and Utilization (CCU) could offer some potential interesting solutions. The utilization of CO2 in the chemical industry (200 Mt/y) currently represents a minor fraction of the total anthropogenic emissions (32,000 Mt/y) but can still be improved [5].
The COG, a by-product of the coking plant, can either be obtained in an integrated steel mill (together with both other gases) or alone if the coking plant is isolated. The COG is a valuable gas due to a large content of hydrogen (>60%) and methane (>20%), thus presenting potential applications close to those of a synthesis gas. The volumetric flow rate and the molar fractions of the COG, on a dry basis, are given in Table 1 and correspond to a gas produced by a typical isolated coking plant.
Currently, the COG is sold to a nearby factory, burnt in flares, or used to recover heat due to a reasonable lower heating value (between 17 and 18 MJ/Nm3). Nevertheless, other ways of COG reuse could be considered such as hydrogen recovery, syngas production, or the use of more specific technologies (chemical looping, combination of several technologies) [2]. These solutions are proposed in general to perform the synthesis of an Added-Value Product (AVP). Various studies [6,7] have shown that methanol is a serious candidate as an AVP because methanol is an interesting intermediate in the chemical industry and implies the possibility to store a large quantity of carbon. The methanol synthesis process from syngas is available at a commercial stage. Methanol can be produced either by CO or by CO2 hydrogenation under a pressure between 50 and 80 bars and at a temperature range of 200 to 350 °C. The requirement of a hydrogen-to-carbon molar ratio between 2 and 3 is a key point of the process that should be adjusted depending on the CO or CO2 content in the feed. An inexpensive source of H2 is needed to use a maximal quantity of carbon, making the COG a valuable source. Besides, a large quantity of CO2, which can be recovered from combustion fumes, is available in order to reach the desired hydrogen-to-carbon ratio for the methanol synthesis.
This paper focuses on the best way to produce methanol by COG utilisation and by CO2 recycling considering a thermochemical route. Since the methanol synthesis is a rather well-known process, the proper selection and association of the separation units in order to recover H2 and CO2 is not straightforward. The economic profitability of the process and the amount of carbon used are crucial issues. Numerous papers have dealt with techno-economic studies of methanol synthesis, but none of them have considered COG (as a source of H2) and flue gases (as a source of CO2) as raw materials in order to produce methanol. For instance, in the work of Pellegrini et al. [8], methanol is produced from natural gas. In the article of Lundgren et al. [9], several steelwork off-gases are used together with biomass in an Auto-Thermal Reforming (ATR) process to synthesize H2 under a pressure of 100 bar for the methanol synthesis, which are conditions rather different from those considered in the current work (see later).
A screening of the available unit operations useful for COG separation and conversion into methanol is realized. The materials and methods are then presented. The selected process flowsheets and the main modelling results are for the considered case studies. A techno-economic analysis and a carbon footprint assessment are performed to evaluate the viability of the selected solutions. The results are finally discussed. The objective of the paper is to determine which process configuration is beneficial from an economical viewpoint.

2. Screening of Available Unit Operations

In this section, the required process units to convert CO2 and COG into methanol are studied. A screening of the available technologies potentially involved for each unit operation is presented; advantages and drawbacks are given. After this discussion, the most interesting technologies are selected. The methanol synthesis is studied in a first step, since it will have consequences on operating conditions in upstream processes.

2.1. Methanol Synthesis and Purification

The conventional process to produce methanol uses synthesis gas obtained from the reforming of coal, biomass, or mostly natural gas. Methanol synthesis can be performed by CO or CO2 hydrogenation, together with the Reverse Water Gas Shift (RWGS) reaction, according to the equilibrium chemical reactions presented in Table 2. From a thermodynamic point of view, methanol formation is exothermic, presents a volume reduction, and is therefore favored by decreasing temperature and increasing pressure. The catalysts used to convert H2/CO mixtures mostly consist of copper, zinc oxide, and alumina. Although a small quantity of CO2 added to the feed accelerates reaction rates (3% mol CO2 at maximum), the use of pure CO2 results in lower reactions rates due to the formation of water leading to catalyst deactivation. Research focuses on the development of catalysts having longer lifetime. Various kinetic studies of methanol synthesis are reported in the literature [10,11].
To perform the methanol synthesis, a catalytic multi-tubular fixed bed reactor is used working under a pressure between 50 and 80 bars, at a temperature comprised between 200 and 350 °C, and cooled by water vaporization. A separation between raw methanol (water and methanol mainly) and unreacted gases is performed in a first flash separator. The unreacted gases are recycled, as the conversion per pass is limited by the thermodynamic equilibrium. A purge ratio has to be set to avoid the accumulation of inert compounds in the recycle loop (N2 and CH4 are considered as inert gases under the reactor operating conditions). This purge ratio is a sensitive process parameter that has to be optimized to prevent an oversized unit on one hand, and too large of a loss of reactants on the other hand [12]. Generally, an optimized purge ratio leads to an inert content in the recycle loop lower than 5% [13]. Another key parameter of the process is the modified hydrogen-to-carbon ratio, M which characterizes the synthesis gas at the inlet of the methanol synthesis process. This stoichiometric number denoted M is defined from the partial molar flow rates of the feed and calculated as:
M = F H 2 F C O 2     F C O + F C O 2
where F j denotes the molar flow rate of component j. Assuming no CO in the feed, the optimal hydrogen-to-carbon ratio F H 2 / F C O 2 is 3 at the reactor inlet that corresponds to a modified ratio M of 2. The purification of methanol is then performed in a second flash separator and in a distillation column in order to remove water. The available commercial technologies of CO2 hydrogenation to produce methanol are listed below:
  • The Lurgi Methanol Process (Air Liquide; Germany; capacity up to 10,000 tMeOH/day) in which two reactors are used: An adiabatic fixed-bed pre-reactor (with 20% catalyst) to perform preferentially the CO2 hydrogenation and the RWGS reaction, and the classical water-cooled multitubular fixed-bed reactor (with 80% catalyst) in the recycle loop [14];
  • The CAMERE Process (Korean Institute of Science and Technology; South Korea; capacity: 900 tMeOH/day) at pilot scale in which two reactors are used: A RWGS reactor and a methanol synthesis reactor; both of them are placed in a recycle loop to remove water and are serially connected [15];
  • The Mitsui’s Process (Mitsui Chemicals Incorporation; Japan; capacity of the pilot unit: 100 tMeOH/year) at pilot scale in which an oxidized copper, zinc, aluminum, zirconium, and silicon catalyst is used [16];
  • CRI Iceland Demonstration Plant (Carbon Recycling International, Iceland, 5.106 LMeOH/year).
Given the amount of information and the fact that the technology is well tested, the Lurgi process is selected in this work (with some adjustments in the process configuration depending on the considered case study).

2.2. Synthesis Gas Generation Processes from COG

The objective of this subsection is to carry out a screening of the available routes that have been used in the generation of syngas from natural gas and to discuss the possibilities of applying them to the COG conversion. The reforming of COG is not identical to that of methane due to the presence of hydrogen in the feed, which does not promote conversion at equilibrium. Generally, methane reforming is a catalytic process taking place under a high temperature. Depending on the operating conditions, the Water Gas Shift (WGS) reaction can promote hydrogen production. The chemical reactions involved in the syngas production are given in Table 3, together with their reaction enthalpies.
With the exception of partial oxidation, the previously cited chemical reactions are thermodynamically reversible. The choice of temperature and pressure is therefore a key point to shift the equilibrium to the reaction products. The methane reforming process has been studied for a long time, so that many of the existing technologies already exhibit a significant Technology Readiness Level (TRL). In the following, six chemical routes based on reactions (d), (e), (f), and (g) are presented in Appendix A.
In summary, the technologies requiring an additional supply of oxygen were excluded since they involve an increase in the pre-treatment separation costs and supplementary safety constraints. Processes involving a non-negligible carbon deposit on the catalyst are not taken into account. Moreover, given that a significant amount of heat is available in the coking plant, chemical routes presenting endothermic reactions can be retained. According to the considered criteria, two methane reforming technologies offer an interesting compromise for the industrial case studied: The SMR and the CMR (see Table 4). The CMR process is chosen in this study for the following reasons:
  • The injection of CO2 directly into the reforming reactor improves the energy performance of the process compared to the SMR (5 to 10% energy saving);
  • The value of the modified ratio M can be perfectly adjusted by controlling the flow rate of CO2, which is particularly suitable for the methanol synthesis.
Table 4. Comparison of the most suitable syngas generation technologies for the COG utilization.
Steam Methane Reforming (SMR)Combined Methane Reforming (CMR)
ReactionsCH4 + H2O ⇌ CO + 3H2CH4 + H2O ⇌ CO + 3H2
CH4 + CO2 ⇌ 2CO + 2H2
Thermodynamic considerationsLow pressure, high temperatureLow pressure, high temperature
Temperature 700   ° C < T < 1100   ° C T > 850   ° C
Pressure 3   bar < P < 25   bar 1   bar < P < 20   bar
CatalystNi, Cu or Rh, PtNi-MgO-CeO2-ZrO2
Inlet molar ratios H 2 O / C H 4 = 3 C O 2 + H 2 O / C H 4 1.2   H 2 O / C O 2 = 2
AdvantagesMost extensive industrial applicationPossibility to adjust the outlet H2/CO ratio and CO2 recycling

2.3. Hydrogen Recovery from COG

The previous section was dedicated to the production of syngas by COG reforming. The other solution is to directly recover hydrogen contained in the COG by separation. Hydrogen is an important component in the chemical industry where it mainly plays a role as feedstock such as in the production of added value fuels in refineries or in the manufacture of ammonia and methanol. There are three main commercially available technologies for H2 recovery: Pressure Swing Adsorption (PSA), gas permeation, and cryogenic distillation [17]. Each technology has advantages and disadvantages as well as specific areas of application.
Concerning hydrogen recovery from COG specifically, very few works exist outside of the study of Shen and Wang [18], who reported that a hydrogen-rich stream (purity up to 95 mol.%) and a methane-rich stream (purity up to 70 mol.%) could both be obtained using a commercial PRISM membrane. Considering the composition of the COG, the use of cryogenic separation requires a pre-treatment step. Indeed, to avoid clogging problems caused by the solidification of CO2, its separation or conversion into CH4 is required. If recovery rate (90–98%) and purities (95–99%) are significant, cryogenic distillation is often not recommended for this application on the basis of its capital cost and energy intensity [19].
The PSA is the leading technology for H2 recovery from COG and is the most common process applied in the chemical and petrochemical industries due to its ability to produce very high H2 purity up to 99.99% [20]. Two or more adsorption beds operate in consecutive steps of adsorption (pressurization) and desorption (depressurization) to produce a continuous H2 stream. Adsorbent materials used include zeolites, activated carbon, and alumina oxides [21]. The cyclic-transient nature of the process adds some operational complexity. The PSA process makes it possible to have a pressurized stream of almost pure H2 (molar fraction greater than 99.9%) with a significant recovery rate (greater than 85%). The fact that H2 is recovered at a pressure almost equal to that of the feed stream is a real advantage of the PSA since methanol synthesis operates at high pressure. This is not the case of the gas permeation, where H2 is recovered on permeate side at a lower pressure. Nevertheless, gas permeation should not be completely excluded since purity and recovery rates similar to those of PSA can be obtained using process schemes with several membrane modules [22].

2.4. Carbon Dioxide Separation

The CO2 recovered from the flues gases of the coking plant is used to synthesize methanol in this study. It has to be as pure as possible in order to avoid the accumulation of inert in the recycle loop of the methanol synthesis. There are four commercially available technologies for this separation: Cryogenic distillation, PSA, gas permeation, and chemical absorption. Hybrid solutions consisting of the combination of several and different modules of separation are not considered.
In the current context of fumes treatment, it appears that the cryogenic separation is not feasible since it is recommended when the CO2 content is greater than 90 mol.%. Regarding PSA, the major disadvantage is the production of CO2 with a quite limited purity (less than 90 mol.%), which is not suitable for a downstream thermochemical upgrading. Cryogenic separation and PSA are then not considered for CO2 separation from flue gases.
The gas permeation of CO2 contained in a blast furnace gas was studied in the literature using a commercial elastomeric type membrane [23]. It was found that the membrane separation process can offer a lower cost than the chemical absorption if the required purity of the CO2 produced is not very high (less than 90 mol.%). Membrane Technology and Research has tested a Polaris membrane for CO2 capture under real flue gas conditions at pilot scale with a recovery rate of about 90% [24]. Gas permeation by membrane is an economically interesting option if a high purity of produced CO2 is not required.
Chemical absorption is the most mature technology for CO2 capture because it has been commercially available for 60 years [1]. The chemical absorption process makes it possible to obtain a nearly pure CO2 stream (99.9 mol.%) with a high recovery rate; it can be applied to streams with low CO2 content [25]. As mentioned before, a high purity of CO2 is required for methanol synthesis. The main drawbacks are the high equipment corrosion rate, the environmental impact of amines and the high energy consumption for solvent regeneration. The use of residual heat sources on site to generate steam is possible and can lower the energy cost of the regeneration step. The chemical absorption is therefore considered as the most interesting technology for CO2 capture.

3. Materials and Methods

This part summarizes the methodology and tools used to evaluate the relevance of the methanol synthesis process with CO2 and H2 as raw materials coming from the flue gas and the COG, respectively. The used software, the hypotheses, the modelling strategy, the techno-economic analysis, and the carbon footprint assessment are described.

3.1. Simulation Tool and Main Hypotheses

A conceptual design of the methanol synthesis process is implemented in the ASPEN HYSYS v8.8 Computer-Aided Design (CAD) software [26]. Simulations are performed in order to determine energy requirements, the design of the main equipment, and the operating conditions in the processes. The obtained data (heat duties, sizes, etc.) are used to calculate the equipment costs through correlations. For example, the capital cost of compressors is a function of the supplied mechanical power calculated by the CAD software. The following hypotheses and conditions are considered in the simulations for the calculation of the mass and energy balances:
  • The boundaries of the case studies include CO2 capture and H2 production or recovery processes (depending on the case study);
  • The scale of the methanol plant corresponds to the use of 500 MWth of COG (with the constraint of supplying the heat equivalent of 250 MWth to fulfil the energy need of the coking plant); this leads to the production of different amounts of methanol in each case study;
  • The ambient temperature and pressure are, respectively, equal to 20 °C and 1.013 bar;
  • The thermodynamic models used are:
    For the methanol synthesis process: Non Random Two Liquids (NRTL) model for the calculation of activity coefficients and Peng Robinson (PR) equation of state for the calculation of the fugacity coefficients;
    For the chemical absorption of carbon dioxide: NRTL-electrolyte model;
    For the rest of the process: Soave Redlich Kwong (SRK) equation of state.

3.2. Techno-Economic Analysis

The techno-economic evaluation of these two case studies has been performed with the factorial Pre-Estime method developed to roughly evaluate the cost of basic engineering projects [27]. Factorial estimates are based on the idea that all categories of capital expenditures in a plant are related to the cost of the purchased equipment. The equipment cost is thus evaluated through a correlation function of its main sizing parameters and is multiplied by correction factors taking into account installation and surrounding costs as well as the material type. The uncertainty of this method is approximately 30%, especially concerning the investment costs due to the use of averaged correlations. Equipment purchase costs have been considered from the literature data, and then factors have been applied to predict the capital investment. The installation factor takes into account foundations, structures, buildings, electrical installation, instrumentation, insulation, painting, etc. This factor is a function of the considered equipment. The surrounding factor takes into account storage units, administrative services, engineering costs, contingency charges, financial costs, etc. The following economic assumptions are considered for calculations:
  • The surrounding factor (fe) considered for the entire plant is equal to 1.8 in this study because the plant is assumed to be implanted on an existing site, which reduces its value; a sensitivity analysis is performed in the next section to quantify the influence of this parameter.
  • The installation factors (fk) are given in Table 5 for each equipment.
  • The currency used is €. The Chemical Engineering Plant Cost Index (CEPCI) is used to account for the evolution of the prices as a function of time to estimate the purchase cost of each unit.
  • The considered discount rate is 7.4% (classical value for industrial projects).
  • Production time of 8000 h per year (capacity factor of 91.3%) is considered.
  • The lifetime of the plant is 20 years (one year for technical study and two years for building are not included in this time span).
The main economical criterion considered is the Levelized Cost of methanol (denoted LCMeOH and expressed in €/ton) whose expression is given in Equation (2) as a function of the capital expenditures (CAPEX in €), the operational expenditures (OPEX in €/year), the mass flow rate of produced methanol ( m ˙ M e O H in ton/year), and the Levelized Life Time (LLT in year) of the process [27,28]:
L C M e O H = C A P E X L L T + O P E X   m ˙ M e O H
The Levelized Life Time of the process ( L L T in year) is equal to 11.03 years using the following formula (3):
L L T = 1 + a n 1 a 1 + a n 1
where n is the actual life time of the process (n = 20 years) and a is the discount rate (a = 7.4%).
The capital expenditures (CAPEX) are calculated with Equation (4) by multiplying the purchase cost Ck of each equipment k by its corresponding installation factor fk and, after summing up on all equipment, by the surrounding factor fe:
C A P E X = f e k f k . C k
The operational expenditures (OPEX) comprise two contributions (see Equation (5)):
  • The variable OPEX including the purchased cost of raw materials, catalyst, and utilities;
  • The fixed OPEX including salaries, maintenance, and management costs is equal to 3% of the CAPEX.
O P E X = O P E X f i x e d + O P E X v a r
The variable OPEX is calculated thanks to Equation (6).
O P E X v a r = 8760 . f c . i F i . U C i
where f c is the capacity factor ( f c   = 0.913), F i the consumption of utilities, catalyst, or raw materials (quantity/year), and U C i the corresponding unitary cost of each utility, catalyst, or raw materials (€/quantity).

3.3. Carbon Footprint Analysis

The following analysis takes into account direct CO2 emissions (taking place in the process itself) and indirect CO2 emissions (occurring outside due to electricity or utility production). In order to quantify the potential benefit of the reuse case studies in comparison to conventional scenarios, two criteria are calculated as done in the literature [29]. The first metric is the not-produced carbon dioxide E ˙ C O 2 ,   n o t p r o d u c e d , which corresponds to the CO2 not produced because of the no-use of fossil fuels as raw materials to synthesize methanol:
E ˙ C O 2 ,   n o t p r o d u c e d = E ˙ C O 2 ,   r e f E ˙ C O 2 ,   r e u s e
where E ˙ C O 2 ,   r e f denotes the emissions of CO2 in the reference system (conventional scenario) and E ˙ C O 2 ,   r e u s e the emissions of CO2 in the reuse system. The second metric is the avoided carbon dioxide E ˙ C O 2 ,   a v o i d e d , which corresponds to the CO2 that is not emitted in the atmosphere (the consumption of methanol is not considered) and takes into account the quantity of carbon dioxide entering the reuse process and the carbon dioxide savings by comparison to the reference system:
E ˙ C O 2 ,   a v o i d e d = E ˙ C O 2 ,   n o t p r o d u c e d + E ˙ C O 2 ,   i n
where E ˙ C O 2 ,   i n is the quantity of CO2 as raw material entering the plant of the reuse system.

4. Results

4.1. Selected Process Flowsheets

Given the screening of the different possible unit operations realized in Section 2, an overall process structure to produce methanol has been constructed and is presented in 
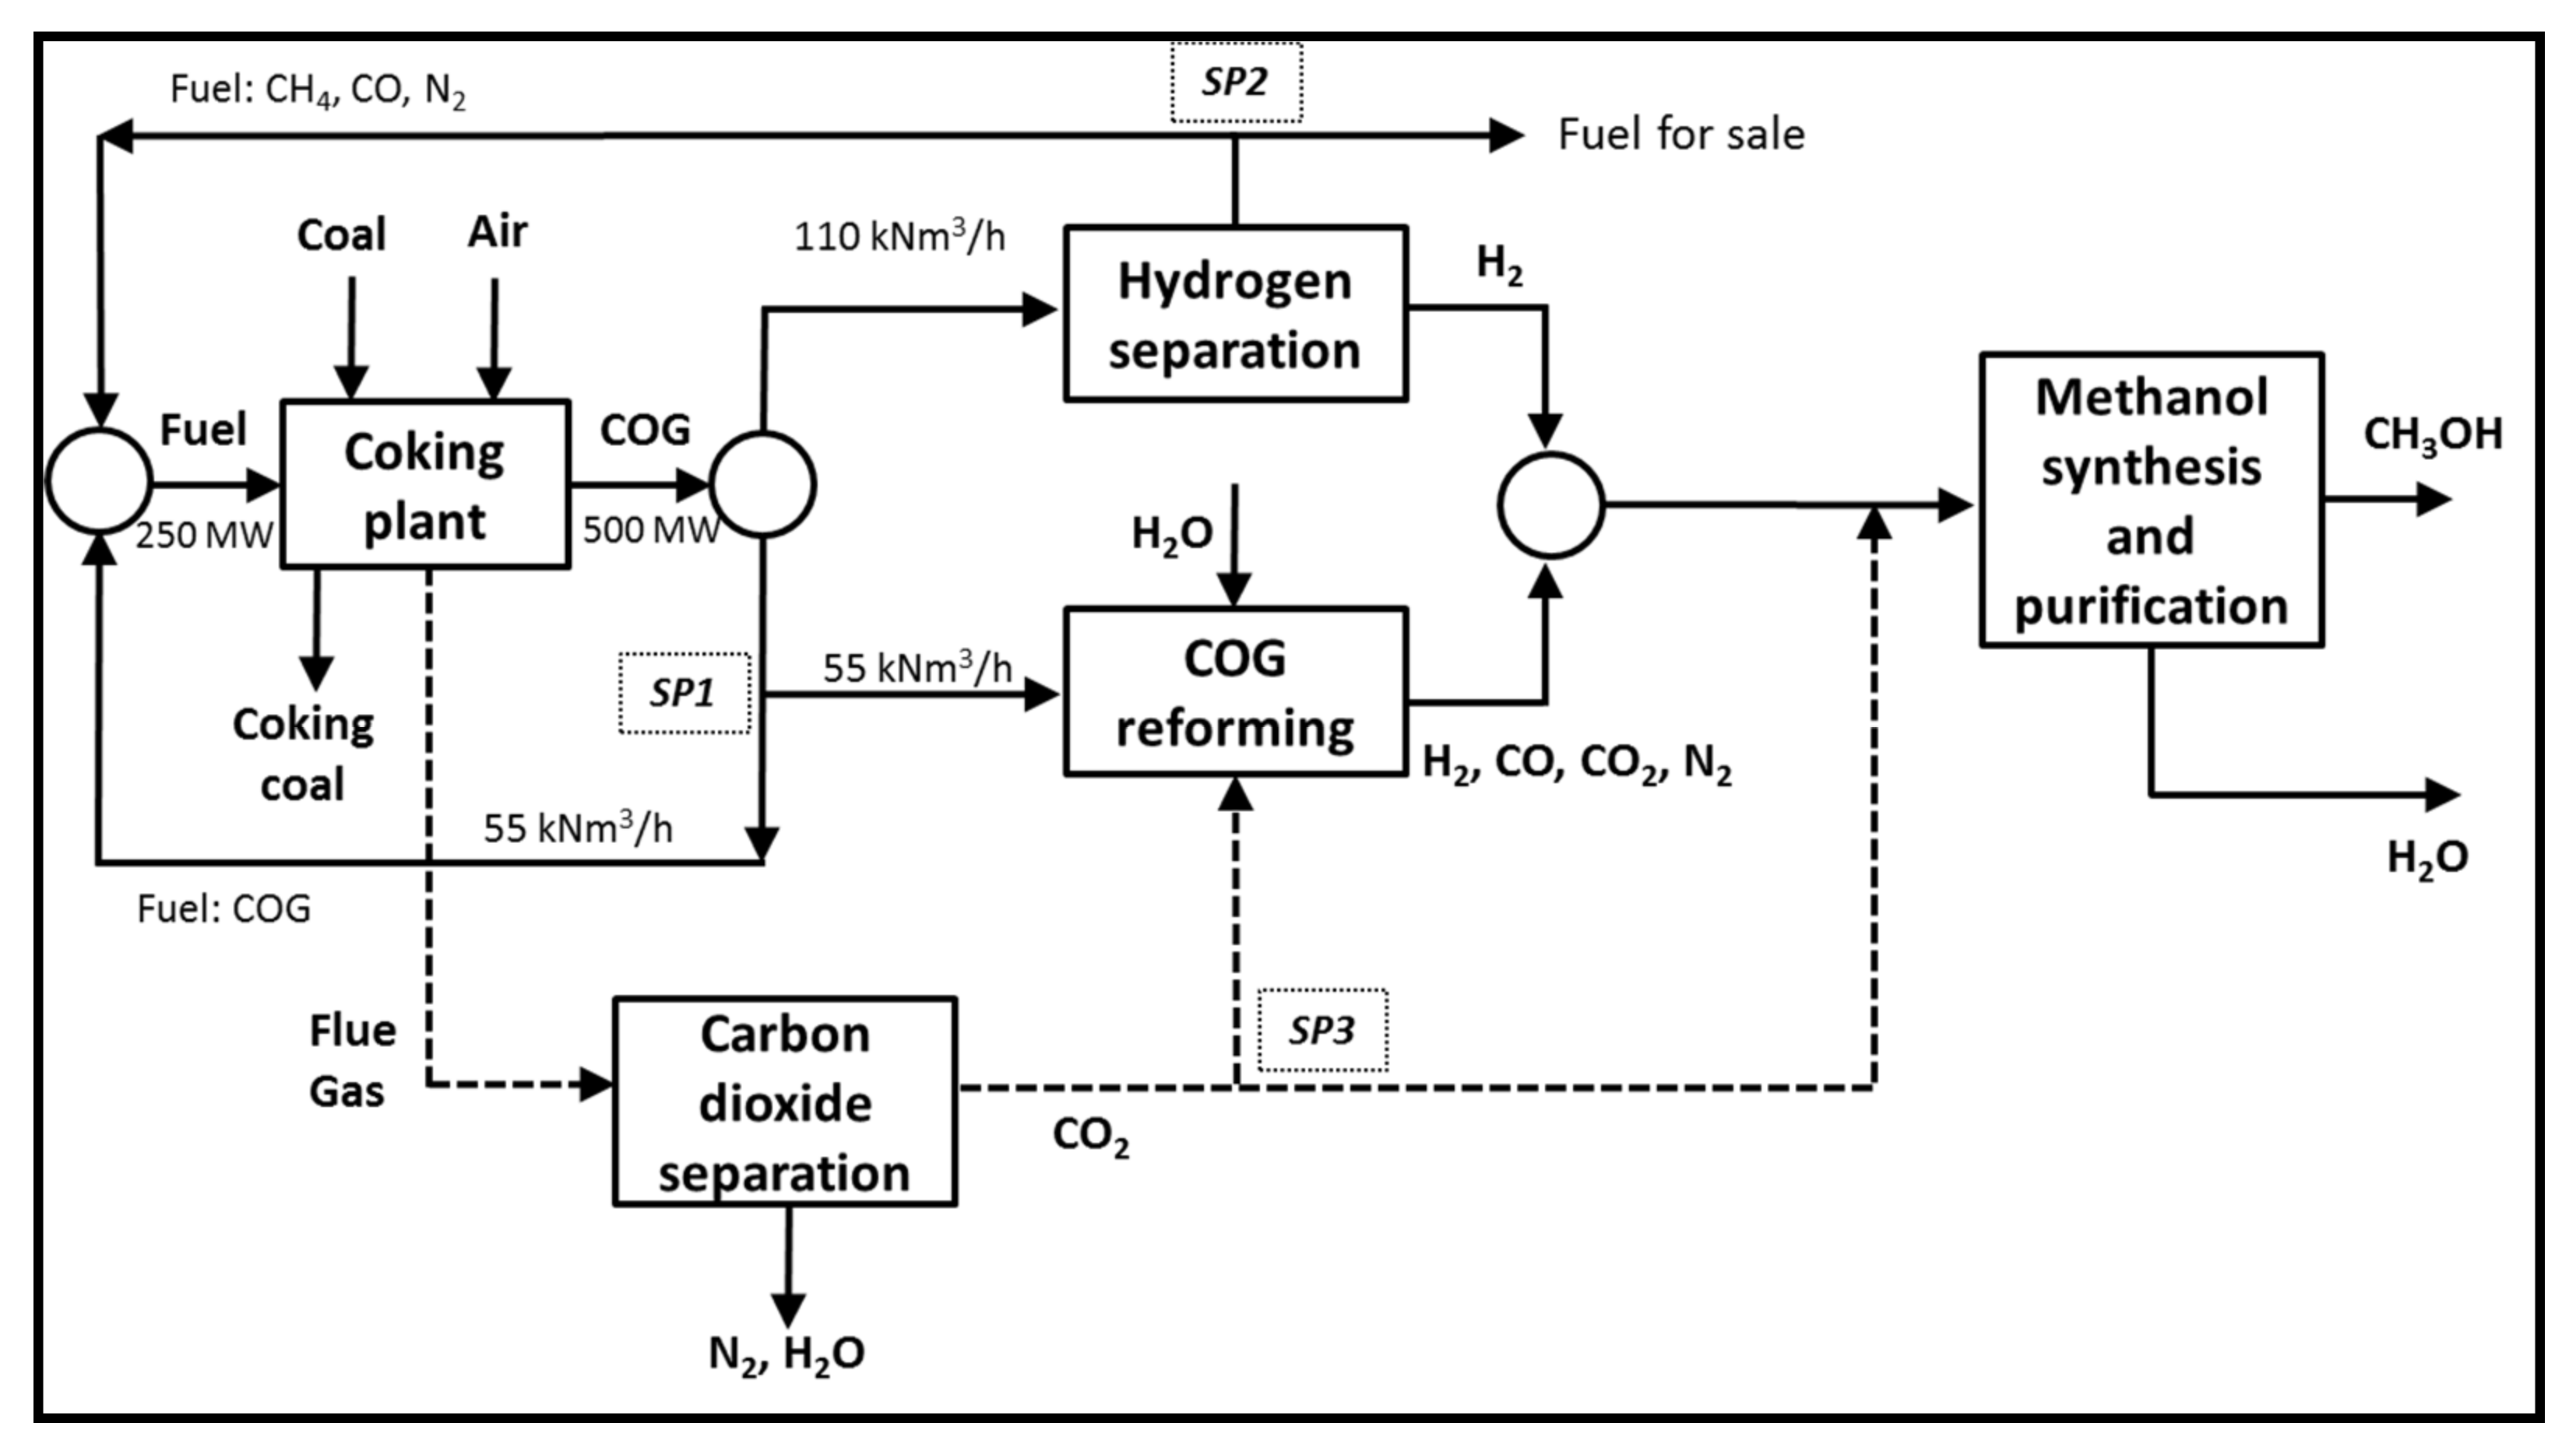
Figure 1 where the main units are represented: COG reforming, methanol synthesis, and the separation processes.
The COG generated by the coking plant (by coal pyrolysis in an oven isolated from air) is equivalent to a thermal power of 500 MWth. COG is obviously generated together with coking coal. The process structure includes two options to produce hydrogen. Logical operators (corresponding to Boolean variables) are represented by three black circles in Figure 1 meaning that either the reforming or the PSA can be considered but not the two options simultaneously. Indeed, since COG is rich in both H2 (more than 60%) and CH4 (more than 20%), the development of two strategies is possible:
  • The combined reforming of methane contained in the COG into hydrogen leading to a methanol production of 270 kt/year at a purity of 99.66 wt.% (case study A1);
  • The direct recovery of hydrogen contained in the COG by a PSA process leading to a methanol production of 221 kt/year at a purity of 99.66 wt.% (case study A2).
The possibility to use simultaneously both previous options is not considered here because the economies of scale are counterbalanced by the investment costs related to the construction of both units.
Besides, to meet the energy needs of the coking plant, a fuel with an equivalent thermal power of 250 MWth is required. This heat duty can be produced two ways according to both hydrogen production options:
  • The half part of the generated COG (55,000 Nm3/h, equivalent to 250 MWth) is directly recycled to be burnt as a fuel within the coking plant; the rest is the available COG that can be converted into methanol; the corresponding split ratio is controlled via the splitter SP1 (case study A1);
  • The gas stream (rich in CH4, CO and N2) separated from H2 in the PSA process is recycled to the coking plant and burnt as a fuel to fulfil the heat requirement; in this case, an excess of fuel is available for sale via the splitter SP2 (case study A2).
The required amount of CO2 is recovered by chemical absorption from the flue gas produced in the coking plant. The CO2 flow rate is controlled via the splitter SP3 in order to supply the COG reforming reactor or to meet the hydrogen-to-carbon ratio specification at the methanol synthesis inlet. The two case studies are considered and are presented in detail below.

4.1.1. Case Study A1

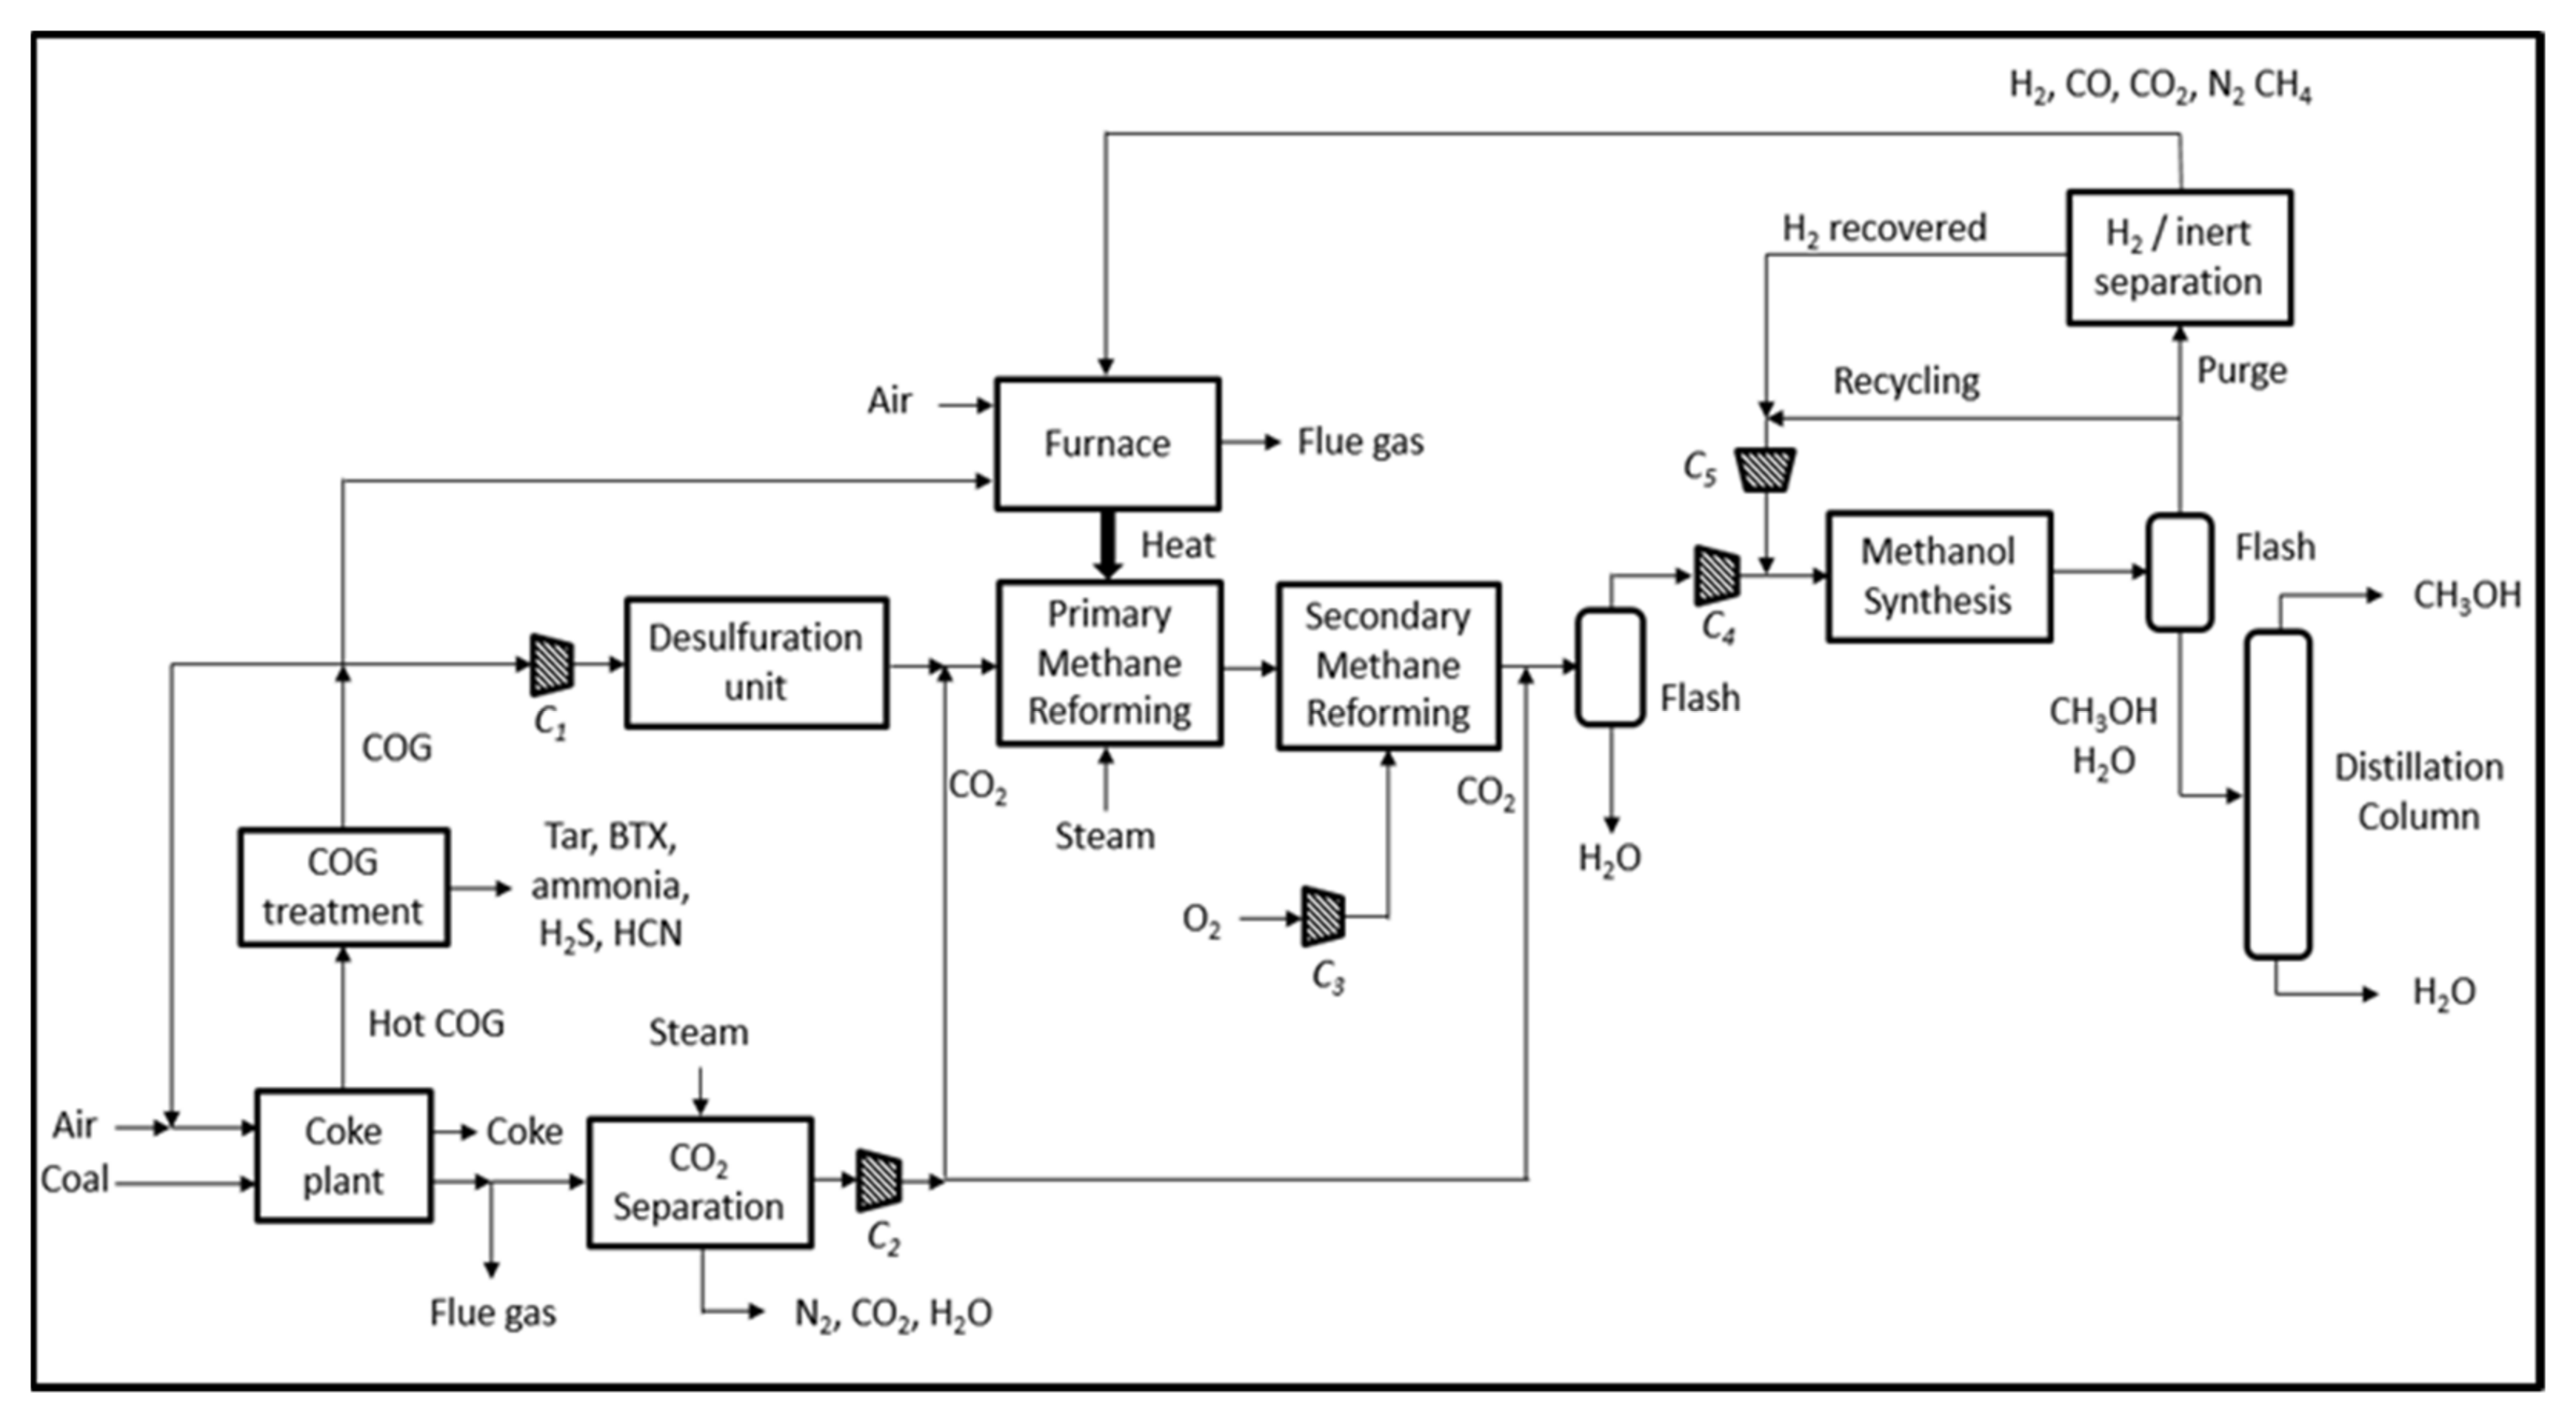
The first case study consists of the conversion of the methane contained in the COG by a CMR process and is described in Figure 2. The interest of the reforming process is twofold: Increasing the amount of H2 and converting CH4 almost entirely (inert compound in the methanol synthesis). At the outlet of the coking plant, hot COG is available, meaning that COG contains tar, BTX, ammonia, hydrogen sulfide, etc., in addition to the molecules described in Table 1. This implies that a treatment unit and a desulfuration unit are required. After the COG treatment unit, a half fraction of COG is recycled to the coking plant. The methane reforming is divided into two steps: A primary step where the CMR reactions are involved and a secondary step where the rest of methane is oxidized. The reforming step being globally endothermic, fuel is supplied in order to provide the necessary heat, by two ways:
  • A fraction of 14.5 wt.% of the treated COG is burnt in the reforming furnace;
  • A residual gas, obtained in a H2/inert separation unit (PSA) placed on the methanol recycling loop, is burnt in the reforming furnace (this separation unit enables to recover the H2 lost in the purge stream).
Figure 2. Simplified process flowsheet for the case study A1 (combined reforming of COG).
Processes 09 01042 g002
Before the methanol synthesis process, a flash separator enables the elimination of the excess water, and the syngas is then compressed to 80 bar in unit C4 and enters in the multi-tubular fixed bed reactor of the methanol synthesis. A flash separator isolates raw methanol from the unreacted gases that are recycled at reactor inlet. Finally, a distillation column purifies the raw methanol.

4.1.2. Case Study A2

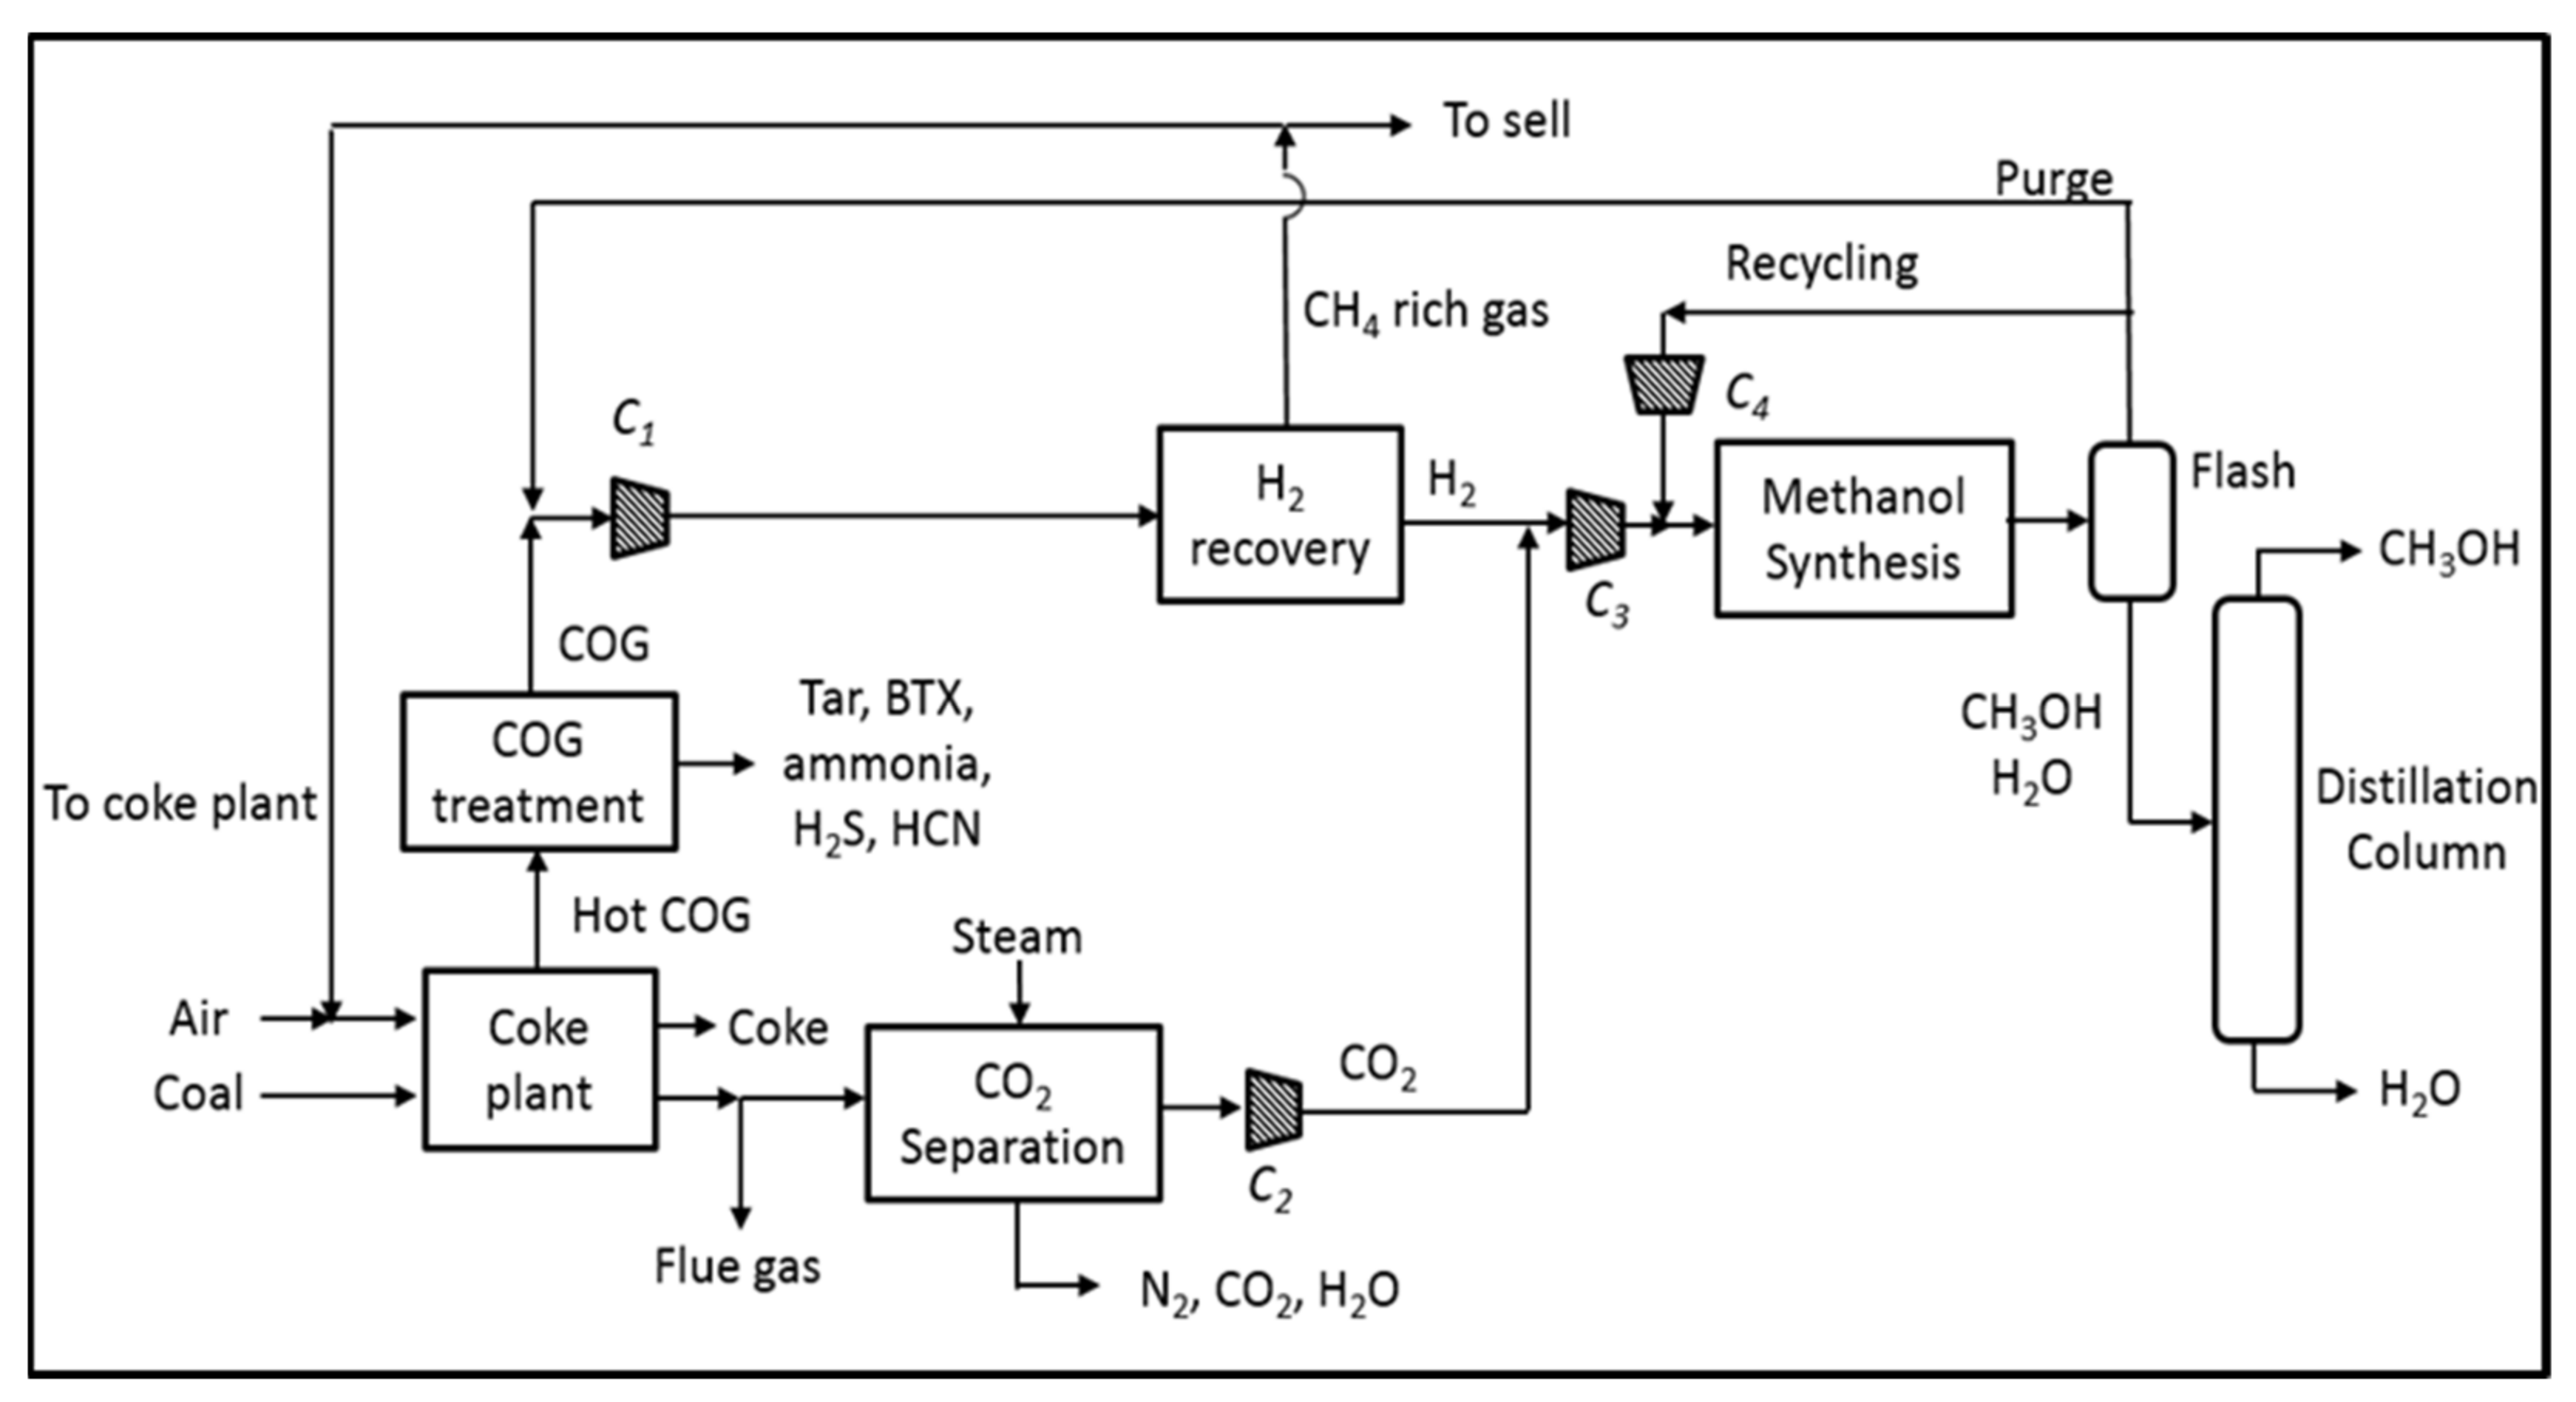
The second case study consists of the recovery of H2 contained in the COG without a reforming step. The corresponding process flowsheet is shown in Figure 3. In this case, the entire COG generated in the site (110,000 Nm3/h corresponding to 500 MWth) is separated in a PSA process so that a hydrogen-rich stream is obtained together with a methane-rich stream. A fraction of this stream is used as a fuel in the coking plant to fulfil the heat requirement. The H2 recovery rate of the PSA process is about 90% corresponding to a nominal pure H2 flow rate of 59,700 Nm3/h (equivalent heat duty of 179 MWth). Therefore, the methane-rich stream has a thermal power of 321 MWth. Since the coking plant needs the equivalent of 250 MWth of combustible, the remaining fraction (71 MWth) is for sale to an external factory. The CO2 contained in the fumes of the coking plant is concentrated with a chemical absorption process. As the coking plant is fed with a methane-rich stream, the flue gases of the coking plant have a higher CO2 content compared to the case study A1. The separation is then easier and less expensive. The purged stream on the recycling loop of the methanol synthesis process is mixed with the COG and sent directly to the hydrogen recovery unit to avoid a loss of hydrogen. This solution also saves the investment cost related to the H2/inert separation unit that is necessary in the case study A1.

4.2. Results of Process Modeling

The reactor of methanol synthesis is operated with controlled feed conditions at 80 bar and 236 °C. It consists of a catalytic multi-tubular fixed bed reactor cooled by water vaporization. The reactor is modelled as a one-dimensional pseudo-homogeneous plug flow neglecting mass and heat transfer limitations. The rate laws determined by Graaf et al. [30,31] on a commercial Cu/ZnO/Al2O3 catalyst are used to account for the kinetic effects. This catalyst is used although it is less efficient with pure CO2 feed than with a CO/CO2 mixture. The thermodynamic equilibrium is reached before the reactor outlet so that the reactor is oversized, which is often realized in industry to counterbalance catalyst degradation. The tubes have an internal diameter of 2.4 cm and a length of 7 m leading to an overall fixed bed volume of 41.2 m3 and of 47.5 m3 for case studies A1 and A2, respectively. The pressure drop, calculated by the Ergun equation, is close to 50 kPa. The Weight Hourly Space Velocity (WHSV) is equal to 4.04 h−1. The Aspen Hysys reactor simulation was validated by a comparison with results obtained previously on a two-dimensional heterogeneous model taking into account mass and heat transfer under the same conditions [13]. A plate heat exchanger enables the hot gases leaving the reactor to heat up the cold gases. Besides, the heat of reaction released by the methanol synthesis is used to vaporize a stream of saturated water at high pressure to generate steam that is used in the reboiler of the distillation column. The reactor characteristics are given in Table 6.
Due to a low CO2 per-pass conversion (about 20%), the unreacted gases are recycled. The methanol synthesis loop comprises the previously described catalytic reactor, a flash unit (to separate unreacted gases and raw methanol), a purge system to avoid accumulation of inert compounds (5% of the recycled stream is purged), and a PSA to recover H2 contained in the purged stream (only for case study A1). The flash separator operates under a pressure of 78.9 bar and at a temperature of 35 °C. The liquid output of the flash separator consists mainly of condensed water, methanol, and solubilized compounds due to the high pressure, while the recycled gas stream mainly contains light compounds (CO, CO2, H2, N2). A second flash separator under a pressure of 2 bar is used to separate these light compounds from the liquid phase. The depressurized liquid stream is then fed to the distillation column working under atmospheric pressure. This unit is modelled with 13 equilibrium stages and is fed at stage 6 (counted from top). A reflux ratio of 1.2 and reboiler duty of 23.1 MWth (case study A1) and 19.9 MWth (case study A2) are required to reach the specifications of methanol purity (a molar fraction of water lower than 0.005 at the top) and methanol recovery (a molar fraction of methanol lower than 0.005 at the bottom). A stream of methanol, at a purity of 99.66 wt.%, is obtained at the top of the column.
As explained previously, the requirement of a high level of CO2 purity, together with the availability of heat sources on site, imply that the chemical absorption is the best option to capture the CO2 contained in the flue gas of the coking plant. The HiCapt+ process, based on a conventional Methyl Ethanol Amine (MEA) solvent, is selected due to interesting performances and to its commercial availability [32]. This process uses high-performance oxidative inhibitors and high amine concentration (40 wt.%). It includes an absorption column working classically (60 °C, 2 bar) and a desorption column to regenerate the solvent. A structured packing Mellapack 250X developed by Sulzer is considered. The levelized cost of the absorbed CO2 is comprised between 59 and 64 €/ton depending on the steam cost, which varies between 12 €/ton and 21 €/ton. Some cheaper CO2 chemical absorption processes may exist but are not yet industrialized.
To model H2 separation by a PSA process, a shortcut method is used. The thermodynamic equilibrium between the adsorbent and the gases is assumed to be reached, which leads to a system of algebraic equations. In this case, H2 is very weakly adsorbed compared to other compounds present in the COG so that H2 is recovered, under pressure, in the permeate stream (which passes through the fixed bed of adsorbent). The following equation can be used to calculate the recovery rate of hydrogen RH2 [33]:
R H 2 = 1 1 1 β P h i g h P l o w y H 2
where β represents the selectivity of H2 towards the adsorbent, y H 2 is the molar fraction of H2 at inlet, P h i g h is the total pressure of the adsorption step, and P l o w is the total pressure of the regeneration step. The adsorbent commonly used for this application is zeolite 5A. The pressures used for the adsorption and regeneration step are 20 and 1 bar, respectively. The recovery rate of H2 is finally equal to 87% with a purity of 99.99%.
The COG reforming section includes three main steps:
  • A preliminary step of advanced desulfuration,
  • A combined methane reforming reactor in order to produce hydrogen,
  • A secondary methane reforming reactor in order to remove the unreacted CH4.
The desulfuration unit contains two hydrogenation reactors (at 350 °C and 22 bar) in order to convert sulfur compounds into H2S and alkanes. These reactors are sized by considering a WHSV of 100 h−1. Then, two fixed beds are used in order to adsorb H2S and are sized based on a WHSV of 400 h−1. Pressure drop is equal to 100 kPa in each bed. The reactive side of the combined reforming reactor is modelled using a Gibbs reactor with an equilibrium temperature difference of 20 K so that the output composition is calculated at the exit temperature (950 °C) minus the temperature difference (20 °C) [34]. The criterion used to size the reactive side is based on a limitation by heat transfer. The number of tubes Nt can therefore be estimated by the following equation:
N t = Q ˙ φ π D 0.8 L
where Q ˙ denotes the heat power exchanged, L is the tube length, D is the tube diameter, and φ is the transferred heat flux. The factor 0.8 enables a slight oversized design. Classical dimensions for a tube are used (D = 0.1 m, L = 10 m) based on the literature data [35]. An intermediate value of heat flux φ that may be reached is chosen (φ = 60,000 W/m2) [36]. The pressure drop is set equal to 250 kPa for an inlet pressure of 21 bar. The furnace (utility side) is oversized to provide 10% more heat than the value required by the reactive side. The secondary methane reforming is modelled using an adiabatic Gibbs reactor and sized by considering a WHSV of 100 h−1. The pressure drop is equal to 100 kPa.

4.3. Techno-Economic Results

The results of the techno-economic study are given in this section regarding both case studies A1 and A2. The available quantity of H2 is lower in case study A2 due to a limited hydrogen recovery rate in the PSA process. Consequently, the produced quantities of methanol are equal to 270 and 221 kton/year for case studies A1 and A2, respectively.
The different contributions to the CAPEX are given in Table 7 for a surrounding factor of 1.8. The overall capital expenditures are in the same order of magnitude in both cases. The slightly higher value of CAPEX for case study A1 (367 M€ vs. 342 M€) is mainly related to the higher quantity of methanol produced implying larger equipment for methanol synthesis and purification. The quantity of COG that is purified in the treatment process is the same in both cases implying an identical investment cost. The chemical absorption process presents a higher capital cost in case study A2: Although the flue gases from coking plant exhibit a higher CO2 content (10 mol.% and 7 mol.% in case studies A1 and A2 respectively) due to the methane-rich stream fed to the coking plant, the required quantity of CO2 needed for the methanol synthesis is larger. Indeed, in case study A2, the only source of carbon is the CO2 recovered from the flue gases of the coking plant whereas in case study A1, CO and CO2 are also available at the hydrogen-rich gas. This gas, directly released by methane reforming of COG, contributes to an important additional source of carbon. The quantity of CO2 recovered by chemical absorption is equal to 173 kt/year and to 302 kt/year for case studies A1 and A2, respectively.
The CAPEX of the COG reforming process in case study A1 includes two main contributions: The reactors themselves (desulfuration, primary and secondary reforming reactors) for approximately 59 M€ and the COG compression train to reach a pressure of 22 bar for approximately 43 M€. The rest corresponds to the contribution of heat exchangers, pumps, and air/fuel compressors to supply the burners of the reforming furnace. The CAPEX of the PSA for the hydrogen recovery in case study A2 is also divided into two main contributions: The PSA itself (fixed beds of adsorbent, valves, etc.) for approximately 27 M€ and the COG compression train to reach a pressure of 21 bar for approximately 75 M€. The investment cost of the COG compression train is significantly higher in case study A2 because the whole quantity of COG is compressed to 21 bar whereas only half of this flow rate is sent and compressed to the reforming process in case study A1, the other part being directly recycled to the coking plant to be burnt. The cost of compression is a major item in capital expenditures and must therefore be considered as an important contribution in the final decision.
The distributions of OPEX, for both case studies, are given as a function of the type of operation units and as a function of the utility type in Table 8 and Table 9, respectively. The overall OPEX is equal to 28.3 M€/year and to 42.3 M€/year in case studies A1 and A2, respectively. The cost of reactants (COG and flue gas) does not appear as they are considered as free wastes. The OPEX related to the COG treatment is the same in both cases as the treated quantity of COG is identical. Concerning the chemical absorption, there is an important difference in the OPEX due to the difference of captured CO2 (173 kt/y vs. 302 kt/y in case studies A1 and A2, respectively). Besides, in case study A1, an excess of heat is available leading to a minimization of the OPEX of the chemical absorption process and of the methanol purification unit. The fixed OPEX are in the same order of magnitude for both solutions and correspond to 3% of the CAPEX.
As illustrated in Table 9, excluding the fixed OPEX, the main utility consumptions are electricity and low pressure steam. Water treatment and catalyst change are weak contributions in both cases. The OPEX related to the consumption of low pressure steam in case study A1 is lower than in case study A2. Indeed, interesting heat integration can be performed in case study A1 as an important quantity of steam can be produced in situ (with the hot effluent flowing out of the reforming fired heater). This avoids consuming steam produced outside. In addition, the OPEX of the chemical absorption is also minimized by using the steam produced in the reboiler of the desorption column. The same argument can be used for the reboiler of distillation column in the methanol purification unit. Concerning the large quantity of cooling water, this consumption can be explained by the cooling requirement. Indeed, the flue gases of the coking plant are available at a temperature of 240 °C and have to be cooled to 35 °C at the inlet of the absorption column to absorb CO2 in the appropriate operating conditions. Moreover, a large quantity of water (24 and 17 mol.% for case studies A1 and A2, respectively) is contained in these flue gases implying additional energy requirements for water condensation. The costs of each used utility, raw materials, and catalysts in the techno-economic analysis are given in Appendix B.

4.4. Carbon Footprint Results

To calculate the CO2 not produced for both case studies, the definitions of a reference and a reuse scenarios are required. To compare properly these scenarios, both of them have to produce the same quantity of methanol and the same quantity of coking coal. As the methanol plant is closely connected to the coking plant, it is not possible to consider them independently. The boundaries of reference scenarios are then obtained by system expansion and do not contain only the methanol synthesis process. The reference systems include:
  • A conventional methanol synthesis plant using natural gas to produce syngas by steam methane reforming, with an emission factor of 0.768 tCO2/tMeOH, a value for a conventional weighted-average methanol plant in Europe [29];
  • A coking plant producing coking coal, flue gases, and COG, which is used as a fuel in a power plant;
  • A power plant producing electricity (with an efficiency of 37%) by the combustion of 250 MWth of COG and emitting flue gases.
In the reference scenario, the COG that is not used to ensure the heating requirements of the coking plant is burnt to produce electricity. In the reuse scenarios, the COG is diverted from its original use to produce methanol. Nevertheless, the quantity of electricity generated in the reference scenario by COG combustion has to be produced as well in the reuse system. This electricity is assumed to be produced by the German electrical mix. In the reuse scenarios, the CO2 emissions of the coking plant are logically decreased thanks to the CO2 capture unit. The reuse systems also include:
  • The new methanol synthesis plant including all processes already presented in cases studies A1 and A2 (COG treatment unit, CO2 capture by chemical absorption, methanol synthesis and purification process, and either methane reforming for case study A1 or hydrogen recovery by PSA for case study A2),
  • The coking plant producing the same quantity of coking coal, flues gases (with reduced CO2 emissions), and COG, which are partially converted into methanol.
  • Electricity generated by the German electrical network with an emission factor of 0.169 kgCO2/MJelec.
The CO2 emissions are calculated (in kt/y) and summarized for both case studies A1 and A2 in Table 10. For each case study, a reference and a reuse scenario have been defined in order to produce the same quantity of coke, electricity, and methanol. Concerning case study A1, the CO2 emissions are similar in both scenarios. Indeed, there is only a slight improvement (2%) in the reuse scenario due to the relatively important CO2 emissions caused by the German electricity network required to produce 92.5 MWelec to counterbalance the electricity production by COG combustion in the reference scenario. Concerning case study A2, the requirement of electricity is lower because an excess of combustible (corresponding to a power of 71 MWth) enables to produce 26.3 MWelec leading to reduced CO2 emissions. In case study A2, the carbon capture unit presents higher emissions because a larger quantity of carbon is required to convert hydrogen into methanol. Concerning the methanol synthesis, the CO2 emissions seem to be very small in the reuse scenarios when compared to the reference ones. This is explained by the fact that emissions calculated in the reference systems includes steam methane reforming of natural gas (including utilities production and compression) whereas emissions related to methanol synthesis in the reuse system only include the reactive and the separation section of the methanol synthesis process itself (and not COG reforming). Finally, in case study A2, the reuse scenario shows interesting results in terms of CO2 not-produced.
The expressions of the main criteria related to CO2 emissions are given by Equations (7) and (8) and are calculated in Table 11. As commented before, they underline a slight positive balance for the case study A1 and a more interesting result for the case study A2. For case study A1, the CO2 not-produced is 0.07 tCO2/tMeOH, which is quite low due to the impact of the German electrical mix and the quite important emissions of the COG reforming process. Besides, the quantity of CO2 extracted from flue gas used as raw material and converted into methanol in the reuse system is quite low (0.57 tCO2/tMeOH) as a non-negligible quantity of methanol is also synthesized by CO and CO2 hydrogenation, molecules coming from the methane contained in the COG. Finally, the CO2 avoided is 0.64 tCO2/tMeOH in case study A1.
For the case study A2, the CO2 not produced is 0.66 tCO2/tMeOH, which is a better value due to a lower requirement of the German electricity mix. The quantity of CO2 as raw material converted into methanol in the reuse system of case study A2 is higher (1.22 tCO2/tMeOH) because almost all the carbon contained in the methanol comes from the CO2 in the flue gas of the coking plant. Finally, the CO2 avoided is 1.87 tCO2/tMeOH.
The results obtained for case study A2 are in good agreement with those obtained in previous study [29], although the boundaries are not the same (no coking plant and no hydrogen recovery unit in the reference).

5. Discussion

The levelized cost of methanol is calculated according to Equation (2), by taking into account the CAPEX, the OPEX, the methanol mass flow rate, and the levelized lifetime of the process. All numerical values are summarized in Table 12. The production cost of methanol is equal to 228 €/ton and to 268 €/ton in case studies A1 and A2, respectively. These numerical values are coherent but present relatively large margins of error (± 30%) since they are calculated by a factorial method. The values are also greatly dependent on the considered surrounding factor.
One important feature, in case study A2, is the production of an excess of fuel (a methane rich-stream). Indeed, this methane-rich stream, obtained together with hydrogen in the PSA process, exceeds the energy needs of the coking plant (equivalent to 250 MWth), which makes it possible to sell the excess part (equivalent to 71 MWth). This sale corresponds to a revenue of 14.0 M€/year leading to a reduction of the OPEX. The net values of OPEX are then identical in both case studies and equal to 28.3 M€/year. As indicated above, the values of CAPEX are in the same order of magnitude. Therefore, the observed difference in the levelized cost of methanol can be mainly explained by the difference in the produced quantity of methanol. Indeed, the methanol mass flow rate produced in case study A1 (270 kt/y) is greater than the one produced in case study A2 (221 kt/y). The quantity of hydrogen, (and consequently the methanol one), is indeed limited by the hydrogen recovery rate in the PSA process in case study A2.
To determine the influence of the surrounding factor, which classically varies between 1.5 and 3.3, a sensitivity study was carried out. Figure 4 illustrates the high influence of this factor on the levelized cost of methanol for both case studies A1 and A2. The assumed hypothesis is a surrounding factor of 1.8 corresponding to an existing industrial area (Brownfield hypothesis) with available access roads, a supply of utilities, pre-existing storages, etc. This hypothesis is justified because the considered CCU unit will be imperatively built next to an existing coking plant. For a hypothetical blank industrial field (Greenfield hypothesis), the value of the surrounding factor would be equal to 2.5 leading to higher levelized costs of methanol of 290 €/ton and 340 €/ton for case studies A1 and A2, respectively.
These economics results can be compared to those obtained in the literature for methanol produced from fossil fuels. The case of methanol synthesis via natural gas reforming is considered. An overall production cost of 204 €/ton was estimated for a 5000 ton per day methanol synthesis plant with a natural gas price of 2.3 €/GJ in April 2013 for a plant located in the U.S. Gulf Stream [37]. Natural gas was the main cost contribution with approximately 47%. The methanol production cost highly depends on the natural gas price on the market. The levelized cost of methanol calculated in case study A1, considering a production of hydrogen by COG reforming, was slightly higher (228 €/ton). This CCU solution could nevertheless become economically viable and comparable to the methanol from fossil fuels pathway for a natural gas price of around 3 €/GJ. The same type of results were obtained in the study of Li et al. [38], who compared the methanol production from COG to coal and natural gas routes. It was observed that the average cost of the coal route was the most intensive, followed by the natural gas route, while the COG one presented the lowest value. The production cost of methanol in the COG route was evaluated and found to be between 161 and 248 $/ton. This CCU solution should also become viable by the introduction of a carbon tax applied to the methanol produced from fossil fuels. A tax range of 25 to 75 €/tonMeOH depending on the case study and the market price could be sufficient to make the reuse process competitive.
Regarding the carbon footprint analysis, the case study A2, although presenting a higher levelized cost, is also the most interesting to minimize the CO2 emissions. Indeed, in that case study, if the quantity of methanol produced is less (explaining the higher cost), the quantity of CO2 recovered from flue gases is greater. In addition, the geographic location has a significant impact on the carbon footprint results due to the considered electricity mix.

6. Conclusions

The techno-economic viability and the potential carbon footprint reduction are assessed for a methanol synthesis process coupled to a coking plant producing COG. Two case studies were determined in order to supply the methanol synthesis unit depending on the strategy of hydrogen production. The first one consists of the production of hydrogen by the combined reforming of methane included in the COG (case study A1) whereas the second one involves a PSA in order to directly recover hydrogen contained in the COG (case study A2). The reuse of 250 MWth of COG is considered to produce 270 and 221 kt/y of methanol in case studies A1 and A2 respectively. The required amount of carbon dioxide is captured from the flue gases of the coking plant.
The process architecture is determined and thermally integrated. The main process units are modelled assuming some hypothesis and simulated with the Aspen Hysys CAD software. The techno-economic analysis, based on a factorial method, led to the calculation of the levelized cost of methanol. The main hypotheses are an actual process life time of 20 years, a discount rate of 7.4% and a surrounding factor of 1.8, a consistent value used for existing industrial fields. The levelized costs of methanol are equal to 228 and to 268 €/ton for case studies A1 and A2 respectively. These methanol production costs are slightly higher than those for methanol produced from fossil fuels. The investment cost due to compression steps represents an important contribution (approximately one-third of the CAPEX) partly caused by the working conditions of the methanol synthesis and of the CO2 absorption. The development of selective catalysts and the production of clean and performant absorbent for carbon capture are interesting ways of improvement. This CCU solution could become economically viable and comparable to the methanol from fossil fuels pathway for a natural gas price of around 3 €/GJ.
The avoided CO2 emissions are equal to 0.64 and to 1.87 tCO2/tMeOH for case studies A1 and A2, respectively. The difference is mainly explained by the fact that, in case study A1, the carbon enters the reuse process as CH4, (and not as CO2) whereas a large quantity of captured CO2 is directly hydrogenated into methanol in case study A2. This environmental evaluation shows the importance of assumptions as localization (the German electricity market has a large influence on case A1 results) and the boundaries selection of system expansion. Besides, a full LCA would make it possible to complete the results in an interesting way by calculating all the environmental impacts. Considering the positive carbon footprint impact of this new route of methanol production, another non-investigated possibility to make the process economically profitable would be to create a sufficiently high carbon tax.

Author Contributions

J.-F.P.: Conceptualization, methodology, software, investigation, writing—original draft preparation, review and editing, project administration. W.U.-S.: Conceptualization, methodology, software, investigation. J.-M.C.: Supervision, resources, formal analysis, writing—review. S.V.: Validation, writing—review. L.F.: Supervision, conceptualization, writing—review, project administration, funding acquisition. All authors have read and agreed to the published version of the manuscript.

Funding

This research was funded by the VALORCO project, grant number: 1382C0240.

Institutional Review Board Statement

Not applicable.

Informed Consent Statement

Not applicable.

Data Availability Statement

The data presented in this study are available on request from the corresponding author. The data are not publicly available due to a partnership with industrial companies.

Acknowledgments

The authors wish to acknowledge the French Agency for the Environment and Energy Management (ADEME) for the financial support as well as Eric De Coninck (Arcelor Mittal) for the interesting exchanges concerning, among other, the techno-economic data.

Conflicts of Interest

The authors declare no conflict of interest. The funders had no role in the design of the study; in the collection, analyses, or interpretation of data; in the writing of the manuscript, or in the decision to publish the results.

Abbreviations

The following abbreviations are used in the manuscript:
ATR:Auto-Thermal Reforming
BF:Blast Furnace
BFG:Blast Furnace Gas
BOFGBasic Oxygen Furnace Gas
BTXBenzene, Toluene, Xylene
CADComputer Aided Design
CAPEXCapital Expenditure
CCUCarbon Capture and UtilizationCEPCI:
CMRCombined Methane Reforming
COGCoke Oven Gas
DMRDry Methane Reforming
LHVLower Heating Value
LCALife Cycle Assessment
LLTLevelized Life Time
MeOHMethanol
MWth“thermal” MegaWatt
MWelec“electrical” MegaWatt
NRTLNon Random Two Liquids
OPEXOperational Expenditure
POXPartial Oxidation
PRPeng Robinson
PSAPressure Swing Adsorption
RWGSReverse Water-Gas Shift
SMRSteam Methane Reforming
SRKSoave Redlich Kwong
SyngasSynthesis Gas
WGSWater Gas Shift
WHSVWeighted Hourly Space Velocity

Appendix A

The Dry Methane Reforming (DMR) process, involving reaction (f), is a technology still under development despite interesting performances having been underlined [39]. It remains marginal because of technical problems with its implementation (catalyst coking and commercial catalysts unavailable); additional research and development are needed to identify more ageing-resistant catalysts to avoid coking [40].
The Partial Oxidation (POX) process, involving reaction (e), is commonly used at industrial scale to produce H2 from heavy feedstocks. Generally, its production is carried out at a temperature between 1300 °C and 1600 °C and under a pressure between 5 and 20 bar [41]. A major advantage is the exothermic nature of the reaction, which makes it possible even in the absence of catalyst. Nevertheless, there is a strong interest in developing new catalytic materials to reduce operating temperatures. The inclusion of such catalysts shifts the operating conditions in the area where coking is thermodynamically possible, which limits its application today. The catalysts are often designed from rhodium whose price limits industrial applications. Another advantage of this technology is the reduced size of reactors (residence time around one millisecond). For a given quantity of CH4, the amount of H2 produced is less than the one produced by other technologies. In POX processes, the addition of air or pure oxygen to the reaction mixture is required. In the first case, the cost of downstream separation increases, whereas in the second, the raw material cost increases significantly. A constraint for the establishment of a POX process is the necessary adaptation of equipment to the presence of an oxidizing agent, which further increases fixed costs [42].
The Auto-Thermal Reforming (ATR) process is the combination of reactions (d), (e) and (g). This technology has the advantage of balancing the endothermic and exothermic reactions, so that the consumption of utilities in the reactor is significantly reduced. Energy efficiency highly depends on quantities of oxygen and water that have to be precisely chosen. At the industrial level, ATR is processed in two different ways: Both steam reforming and POX take place simultaneously in the same vessel or they are conducted separately. Concerning the catalysis, it is designed so that the POX reaction is controlled, and therefore limits the temperature [41]. Despite the real advantages of this technology, it is not sufficiently developed because of the addition of oxygen and the resulting constraints within the process. Indeed, it was reported that the cost of the air separation unit offsets the savings made by using a cheaper reformer for the ATR technology [43].
The tri-reforming process is simply the simultaneous implementation of reactions (d), (e), (f), and (g). It presents advantages over other technologies, including the H2/CO ratio of the produced gas that can be precisely controlled by adjusting the relative amounts of the three components in the feed (H2O, CO2, and O2). The energy required is less than the one required for the SMR or DMR (due to the involvement of exothermal reactions). Tri-reforming is a flexible technology because several types of mixtures can be converted. This method also makes it possible to cope with some disadvantages present in the three reactions separately. For instance, the catalyst coking and the high energy demand are avoided. Nevertheless, the application of tri-reforming at industrial level is marginal, due to a weak process maturity.
The Combined Methane Reforming (CMR) process, involving reactions (d) and (f), a secondary reaction (g), and coke formation reactions, consists of the methane reforming by steam and CO2. This technology enables the industrial implementation of the dry reforming reaction because the presence of water partially prevents carbon deposits on the catalyst. In addition, the H2/CO ratio of the produced gases can be controlled by adjusting the inlet flow rates of H2O and CO2, which is particularly useful for methanol synthesis. The addition of CO2 implies greater energy efficiency as energy consumption decreases by 5 to 10% compared to conventional units. The CMR technology is mostly used for units producing more than 2500 tons per day of methanol and when pure CO2 is available at low cost [44]. A thermodynamic study has demonstrated that when the H2O/CO2 ratio is equal to 2, a synthesis gas with a H2/CO ratio of 2 can be obtained at a temperature of 850 °C [45]. Besides, a (CO2+H2O)/CH4 ratio larger than 1.2 is required to avoid coke formation.
The Steam Methane Reforming (SMR) process is the most widespread technology and is responsible for the production of 95% of hydrogen. The SMR has one of the most attractive yields among all methane reforming technologies, and is currently the most optimized and least expensive method [42]. Reactions (d) and (g), which are involved in SMR, are globally endothermic, which induces the use of an important heat source. In general, the industrial reactors operate at a temperature comprised between 700 and 1100 °C and under a pressure between 3 and 25 bar, with a methane conversion of 98% at 800 °C. Catalysts can be separated into two groups: Catalysts based on precious metals, whose price limits industrial applications (typically platinum or rhodium), and commercially available catalysts (based on copper or nickel) [41]. The TRL of the SMR process is high (TRL = 9).

Appendix B

For the economic evaluation, the sizes of the different equipment are used to calculate the purchased cost functions, which are implemented in the Aspen Hysys software. The cost functions are extracted, unless otherwise stated, from Chauvel et al. [27]. The reactor of methanol synthesis is considered as thermosiphon-type equipment. The primary reactor of CMR is considered as a heat furnace.
Depending on the intended application, the heat exchangers will be either plate-type exchangers or shell-and-tube heat exchangers. Exchangers are oversized by increasing the calculated heat transfer surface by 10%. Shell-and-tube heat exchangers follow the TEMA designation:
  • BEU (integral cover, single pass, U-tube bundle) for water coolers heat exchangers;
  • AKU (removable cover, kettle, U-tube bundle) for boilers.
For each compressor, a spare one is provided, each being sized to alone ensure at least 60% of the power theoretically required. The cost of motors is included in the correlations used. The assumed isentropic efficiency is taken equal to 85%. Two main types of compressors are considered:
  • Stainless-steel centrifugal compressors (reference for a wet gas at inlet of the PSA or the methanol synthesis process);
  • Carbon steel reciprocating compressors (reference for dry gas on recycling loop of the methanol synthesis process).
With regard to the construction materials, all other equipment consists of stainless-steel 316 L due to the corrosive nature of the streams.
For each centrifugal pump, a spare one is provided, each being sized to ensure alone at least 60% of the power theoretically required. The assumed pump efficiency is taken to be equal to 75%.
To estimate the cost of the PSA unit, an affine equation from the literature [46], giving the purchased cost of the unit as a function of the molar flow rate, is used. This correlation, established in 1994 by averaging industrial data, has been revalidated by comparison with recent data. This correlation also includes fixed beds in order to protect the adsorbent from poisoning components (especially H2S and BTX).
To estimate the cost of the COG treatment unit, values of CAPEX and OPEX were estimated with respect to the COG flow rate and validated by our industrial partner, Arcelor Mittal. The numerical values are given in Table A1 and Table A2.
Table A1. Cost of each used utility.
Type of UtilityCost
Electricity0.0122 €/MJ
Low pressure steam17 €/ton
Cooling Water0.13 €/m3
Elimination of residual methanol in water0.4 €/kgMeOH
Methane-rich stream for sale0.006 €/MJ
Table A2. Cost and life time of each used catalyst.
ReactorLife Time (Year)Catalyst Cost (103 €/ton)
COG Treatment512.0
Desulfuration56.7
Primary Methane reforming59.0
Secondary methane reforming512.5
Methanol synthesis320.0

References

  1. Ramírez-Santos, Á.A.; Castel, C.; Favre, E. A review of gas separation technologies within emission reduction programs in the iron and steel sector: Current application and development perspectives. Sep. Purif. Technol. 2018, 194, 425–442. [Google Scholar] [CrossRef]
  2. Bermúdez, J.M.; Arenillas, A.; Luque, R.; Menéndez, J.A. An overview of novel technologies to valorise coke oven gas surplus. Fuel Process. Technol. 2013, 110, 150–159. [Google Scholar] [CrossRef] [Green Version]
  3. Wang, C.; Ryman, C.; Dahl, J. Potential CO2 emission reduction for BF–BOF steelmaking based on optimised use of ferrous burden materials. Int. J. Greenh. Gas Control. 2009, 3, 29–38. [Google Scholar] [CrossRef]
  4. World Steel Association. Sustainable Steel at the Core of a Green Economy; World Steel Association: Brussels, Belgium, 2012. [Google Scholar]
  5. Aresta, M.; Dibenedetto, A.; Angelini, A. The changing paradigm in CO2 utilization. J. CO2 Util. 2013, 3, 65–73. [Google Scholar] [CrossRef]
  6. Olah, G.A.; Goeppert, A.; Surya Prakash, G.K. Chemical Recycling of Carbon Dioxide to Methanol and Dimethyl Ether: From Greenhouse Gas to Renewable, Environmentally Carbon Neutral Fuels and Synthetic Hydrocarbons. J. Org. Chem. 2009, 74, 487–498. [Google Scholar] [CrossRef] [PubMed]
  7. Ghanbari, H.; Helle, M.; Pettersson, F.; Saxén, H. Optimization Study of Steelmaking under Novel Blast Furnace Operation Combined with Methanol Production. Ind. Eng. Chem. Res. 2011, 50, 12103–12112. [Google Scholar] [CrossRef]
  8. Pellegrini, L.A.; Soave, G.; Gamba, S.; Langè, S. Economic analysis of a combined energy–methanol production plant. Appl. Energy 2011, 88, 4891–4897. [Google Scholar] [CrossRef]
  9. Lundgren, J.; Ekbom, T.; Hulteberg, C.; Larsson, M.; Grip, C.-E.; Nilsson, L.; Tunå, P. Methanol production from steel-work off-gases and biomass based synthesis gas. Appl. Energy 2013, 112, 431–439. [Google Scholar] [CrossRef] [Green Version]
  10. Uribe-Soto, W.; Portha, J.-F.; Commenge, J.-M.; Falk, L. A review of thermochemical processes and technologies to use steelworks off-gases. Renew. Sustain. Energy Rev. 2017, 74, 809–823. [Google Scholar] [CrossRef]
  11. Portha, J.-F.; Parkhomenko, K.; Kobl, K.; Roger, A.-C.; Arab, S.; Commenge, J.-M.; Falk, L. Kinetics of Methanol Synthesis from Carbon Dioxide Hydrogenation over Copper–Zinc Oxide Catalysts. Ind. Eng. Chem. Res. 2017, 56, 13133–13145. [Google Scholar] [CrossRef]
  12. Luyben, W.L. Design and Control of Gas-Phase Reactor/Recycle Processes with Reversible Exothermic Reactions. Ind. Eng. Chem. Res. 2000, 39, 1529–1538. [Google Scholar] [CrossRef]
  13. Arab, S. Développement d’un Procédé de Synthèse de Méthanol à Partir de CO2 et H2. Ph.D. Thesis, Lorraine University, Nancy, France, 2014. [Google Scholar]
  14. Pontzen, F.; Liebner, W.; Gronemann, V.; Rothaemel, M.; Ahlers, B. CO2-based methanol and DME—Efficient technologies for industrial scale production. Catal. Today 2011, 171, 242–250. [Google Scholar] [CrossRef]
  15. Joo, O.-S.; Jung, K.-D.; Moon, I.; Rozovskii, A.Y.; Lin, G.I.; Han, S.-H.; Uhm, S.-J. Carbon Dioxide Hydrogenation to Form Methanol via a Reverse-Water-Gas-Shift Reaction (the CAMERE Process). Ind. Eng. Chem. Res. 1999, 38, 1808–1812. [Google Scholar] [CrossRef]
  16. Ushikoshi, K.; Mori, K.; Kubota, T.; Watanabe, T.; Saito, M. Methanol synthesis from CO2 and H2 in a bench-scale test plant. Appl. Organomet. Chem. 2000, 14, 819–825. [Google Scholar] [CrossRef]
  17. Subramani, V.; Basile, A.; Veziroglu, T.N. Compendium of Hydrogen Energy Vol 1: Hydrogen Production and Purification; Elsevier: Cambridge, UK, 2015; ISBN 978-1-78242-361-4. [Google Scholar]
  18. Shen, J.; Wang, Z.-Z.; Yang, H.-W.; Yao, R.-S. A New Technology for Producing Hydrogen and Adjustable Ratio Syngas from Coke Oven Gas. Energy Fuels 2007, 21, 3588–3592. [Google Scholar] [CrossRef]
  19. Kerry, F.G. Industrial Gas Handbook, Gas Separation and Purification; CRC Press: Boca Raton, FL, SA, 2007. [Google Scholar]
  20. Razzaq, R.; Li, C.; Zhang, S. Coke oven gas: Availability, properties, purification, and utilization in China. Fuel 2013, 113, 287–299. [Google Scholar] [CrossRef]
  21. Elseviers, W.; Hassett, P.F.; Navarre, J.L.; Whysall, M. 50 Years of PSA Technology for H2 Purification; UOP LLC, A Honeywall Company: Des Plaines, IL, USA, 2015. [Google Scholar]
  22. Adhikari, S.; Fernando, S. Hydrogen Membrane Separation Techniques. Ind. Eng. Chem. Res. 2006, 45, 875–881. [Google Scholar] [CrossRef]
  23. Ramírez-Santos, Á.A.; Castel, C.; Favre, E. Utilization of blast furnace flue gas: Opportunities and challenges for polymeric membrane gas separation processes. J. Membr. Sci. 2017, 526, 191–204. [Google Scholar] [CrossRef]
  24. White, L.S.; Wei, X.; Pande, S.; Wu, T.; Merkel, T.C. Extended flue gas trials with a membrane-based pilot plant at a one-ton-per-day carbon capture rate. J. Membr. Sci. 2015, 496, 48–57. [Google Scholar] [CrossRef] [Green Version]
  25. Wang, M.; Lawal, A.; Stephenson, P.; Sidders, J.; Ramshaw, C. Post-combustion CO2 capture with chemical absorption: A state-of-the-art review. Chem. Eng. Res. Des. 2011, 89, 1609–1624. [Google Scholar] [CrossRef] [Green Version]
  26. Aspen Technology Inc. Aspen HYSYS Version 8.8. 2015. Available online: https://www.aspentech.com (accessed on 1 December 2015).
  27. Chauvel, A.; Fournier, G.; Raimbault, C. Manual of Process Economic Evaluation; Editions Technip: Paris, France, 2003; ISBN 9782710808367. [Google Scholar]
  28. Towler, G.; Sinnott, R.K. Chemical Engineering Design: Principles, Practice and Economics of Plant and Process Design; Butter-worth-Heinemann Ltd: Waltham, MA, USA, 2008; ISBN 0080966594. [Google Scholar]
  29. Pérez-Fortes, M.; Schöneberger, J.C.; Boulamanti, A.; Tzimas, E. Methanol synthesis using captured CO2 as raw material: Techno-economic and environmental assessment. Appl. Energy 2016, 161, 718–732. [Google Scholar] [CrossRef]
  30. Graaf, G.; Stamhuis, E.; Beenackers, A.A.C.M. Kinetics of low-pressure methanol synthesis. Chem. Eng. Sci. 1988, 43, 3185–3195. [Google Scholar] [CrossRef]
  31. Graaf, G.; Scholtens, H.; Stamhuis, E.; Beenackers, A.A.C.M. Intra-particle diffusion limitations in low-pressure methanol synthesis. Chem. Eng. Sci. 1990, 45, 773–783. [Google Scholar] [CrossRef]
  32. Lemaire, E.; Bouillon, P.A.; Lettat, K. Development of HiCapt+TMProcess for CO2Capture from Lab to Industrial Pilot Plant. Oil Gas Sci. Technol. 2014, 69, 1069–1080. [Google Scholar] [CrossRef] [Green Version]
  33. Ruthven, D.M.; Farooq, S.; Knaebel, K.S. Pressure Swing Adsorption; VCH Publishers: New York, NY, USA, 1994. [Google Scholar]
  34. Baltrusaitis, J.; Luyben, W.L. Methane Conversion to Syngas for Gas-to-Liquids (GTL): Is Sustainable CO2 Reuse via Dry Methane Reforming (DMR) Cost Competitive with SMR and ATR Processes? ACS Sustain. Chem. Eng. 2015, 3, 2100–2111. [Google Scholar] [CrossRef]
  35. Luyben, W.L. Design and Control of the Dry Methane Reforming Process. Ind. Eng. Chem. Res. 2014, 53, 14423–14439. [Google Scholar] [CrossRef]
  36. Rase, H.F. Chemical Reactor Design for Process Plants: Case Studies and Design Data, 2nd ed.; Wiley: New York, NY, USA, 1977; ISBN 9780471018902. [Google Scholar]
  37. Bertau, M.; Offermans, H.; Plass, L.; Schmidt, F.; Wernicke, H.-J. Methanol: The Basic Chemical and Energy Feedstock of the Future; Springer: Berlin, Germany, 2014; ISBN 978-3-642-39709-7. [Google Scholar]
  38. Li, J.; Ma, X.; Liu, H.; Zhang, X. Life cycle assessment and economic analysis of methanol production from coke oven gas compared with coal and natural gas routes. J. Clean. Prod. 2018, 185, 299–308. [Google Scholar] [CrossRef]
  39. Bermudez, J.; Ferrera-Lorenzo, N.; Luque, S.; Arenillas, A.; Menéndez, J.A. New process for producing methanol from coke oven gas by means of CO2 reforming. Comparison with conventional process. Fuel Process. Technol. 2013, 115, 215–221. [Google Scholar] [CrossRef] [Green Version]
  40. Gangadharan, P.; Kanchi, K.C.; Lou, H.H. Evaluation of the economic and environmental impact of combining dry reforming with steam reforming of methane. Chem. Eng. Res. Des. 2012, 90, 1956–1968. [Google Scholar] [CrossRef]
  41. Holladay, J.; Hu, J.; King, D.; Wang, Y. An overview of hydrogen production technologies. Catal. Today 2009, 139, 244–260. [Google Scholar] [CrossRef]
  42. McGlocklin, K. Economic Analysis of Various Reforming Techniques and Fuel Sources for Hydrogen Production. Ph.D. Thesis, Auburn University, Auburn, AL, USA, 2006. [Google Scholar]
  43. Lange, J.-P. Methanol synthesis: A short review of technology improvements. Catal. Today 2001, 64, 3–8. [Google Scholar] [CrossRef]
  44. Thybaud, N.; Lebain, D. Panorama des voies de valorisation du CO2, ADEME (Agence de l’Environnement et de la Maîtrise de l’Energie) et MEEDDM (Ministère de l’Ecologie, de l’Energie, du Développement Durable et de la Mer). Available online: https://www.ademe.fr/sites/default/files/assets/documents/72052_rapport_ademe_version_finale.pdf (accessed on 1 January 2016).
  45. Jang, W.-J.; Jeong, D.-W.; Shim, J.-O.; Kim, H.-M.; Roh, H.-S.; Son, I.H.; Lee, S.J. Combined steam and carbon dioxide reforming of methane and side reactions: Thermodynamic equilibrium analysis and experimental application. Appl. Energy 2016, 173, 80–91. [Google Scholar] [CrossRef]
  46. Towler, G.P.; Mann, R.; Serriere, A.A.J.-L.; Gabaude, C.M.D. Refinery Hydrogen Management: Cost Analysis of Chemically-Integrated Facilities. Ind. Eng. Chem. Res. 1996, 35, 2378–2388. [Google Scholar] [CrossRef]
Figure 1. Simplified process structure to produce methanol from COG and flue gases (SP1, SP2, and SP3 are splitters to adjust flowrates in each process unit, black circles represents logical operators to select a process case study).
Processes 09 01042 g001
Figure 3. Simplified process flowsheet for the case study A2 (Hydrogen recovery by Pressure Swing Adsorption of COG).
Processes 09 01042 g003
Figure 4. Influence of the surrounding factor on the levelized cost of methanol for case studies A1 and A2.
Processes 09 01042 g004
Table 1. Typical characteristics of COG; percentages correspond to molar fractions.
COG on a Dry Basis (%)
CO21.23
CO4.25
H262.99
CH422.50
C2H41.67
C2H60.79
N26.07
Ar0.50
Volumetric flow rate (Nm3/h)110,000
Low calorific value (MJ/Nm3)16.4
Table 2. Chemical reactions involved in the methanol synthesis (enthalpy of reaction at 298 K).
Reactions
Δ r H 0 k J · m o l 1
(a)CO2 hydrogenationCO2 + 3H2 ⇌ CH3OH + H2O−40.9
(b)CO hydrogenationCO + 2H2 ⇌ CH3OH−90.7
(c)Reverse Water Gas ShiftCO2 + H2 ⇌ CO + H2O41
Table 3. Chemical reactions involved in production of syngas (enthalpy of reaction at 298 K).
Reactions
Δ r H 0 k J · m o l 1
(d)Steam reformingCH4 + H2O ⇌ CO + 3H2206.2
(e)Partial oxidationCH4 + 1/2O2 → CO + 2H2−35.7
(f)Dry reformingCH4 + CO2 ⇌ 2CO + 2H2247.3
(g)Water Gas ShiftCO + H2O ⇌ CO2 + H2−41
Table 5. Installation factors for different equipment [27].
Equipment Installation   Factor   f k
Reactor—Column4.05
Reforming Heat Furnace2.41
Compressor2.50
Pump2.97
Storage device (v < 150 m3)1.65
Shell-and-tube heat exchanger3.22
Plate heat exchanger1.70
Table 6. Characteristics of the methanol synthesis reactors for each case study.
A1A2
Length (m)77
Tube diameter (cm)2.42.4
Number of tubes13,00015,000
Reactor volume (m3)41.247.5
Bulk density (kg/m3)11311131
Void fraction0.420.42
Catalyst mass (kg)4656053722
Particle diameter (mm)55
Table 7. Contributions to CAPEX for case studies A1 and A2 (surrounding factor of 1.8).
Case StudyA1A2
COG Treatment (M€)7979
Chemical absorption (M€)6786
COG reforming (M€)130-
PSA (M€)-111
Methanol synthesis—purification (M€)9165
CAPEX (M€)367342
Table 8. Distribution of OPEX by type of operation units for case studies A1 and A2.
Case StudyA1A2
COG Treatment (M€/y)3.83.8
Chemical absorption (M€/y)6.115.3
COG reforming (M€/y)3.8-
PSA (M€/y)-6.6
MeOH synthesis—purification (M€/y)3.66.3
Fixed OPEX (M€/y)1110.3
OPEX (M€/y)28.342.3
Table 9. Distribution of OPEX by type of utility used for case studies A1 and A2.
Case StudyA1A2
COG Treatment (M€/y)3.83.8
Electricity (M€/y)4.610.9
Cooling water (M€/y)3.88.7
Catalyst (M€/y)0.60.4
Water cleaning (M€/y)0.10.5
Low pressure steam (M€/y)4.47.7
Fixed OPEX (M€/y)1110.3
OPEX (M€/y)28.342.3
Table 10. Contributions to carbon dioxide emissions (ktonCO2/year) for both case studies A1 and A2.
Case StudyA1A2
ScenarioReferenceReuseReferenceReuse
Electricity mix (kt/y)-470-324.1
Coking plant (kt/y)305.7105.1305.7113.1
Power Plant (kt/y)305.7-305.7-
COG Treatment (kt/y)-3.5-3.5
CO2 capture (kt/y)-47.2-73.7
COG reforming (kt/y)-165.3--
H2 recovery (kt/y)---84.8
MeOH synthesis (kt/y)205.26.5168.035
E ˙ C O 2 (kt/y)816.6797.7779.4634.2
Table 11. Main metrics related to carbon dioxide emissions (tonCO2/tonMeOH).
Case StudyA1A2
E ˙ C O 2 ,   r e f (tCO2/tMeOH)3.023.53
E ˙ C O 2 ,   r e u s e (tCO2/tMeOH)2.952.87
E ˙ C O 2 ,   n o t p r o d u c e d (tCO2/tMeOH)0.070.66
E ˙ C O 2 ,   i n (tCO2/tMeOH)0.571.22
E ˙ C O 2 ,   a v o i d e d (tCO2/tMeOH)0.641.87
Table 12. Economic data for case studies A1 and A2 (surrounding factor: fe = 1.8).
Case StudyA1A2
CAPEX (106 €)367.0342.0
OPEX (106 €/year)28.342.3
Sale of CH4 (106 €/year)0.0−14.0
m ˙ M e O H (kton/year)270.0221.0
L C M e O H (€/ton)228.0268.0
Publisher’s Note: MDPI stays neutral with regard to jurisdictional claims in published maps and institutional affiliations.

