
Numerical Study of Electrostatic Desalting Process Based on Droplet Collision Time


1
School of Chemistry, National Autonomous University of Mexico (UNAM), Av. Universidad #3000, Cd. Universitaria, Mexico City 04510, Mexico
2
Department of Chemical Engineering, Izmir Institute of Technology, Gülbahçe Campus, Urla, Izmir 35430, Turkey
*
Author to whom correspondence should be addressed.
Processes 2021, 9(7), 1226; https://0-doi-org.brum.beds.ac.uk/10.3390/pr9071226
Submission received: 10 June 2021
/
Revised: 11 July 2021
/
Accepted: 13 July 2021
/
Published: 15 July 2021
(This article belongs to the Special Issue Process Design and Sustainable Development)
Abstract
:The desalting process of an electrostatic desalting unit was studied using the collision time of two droplets in a water-in-oil (W/O) emulsion based on force balance. Initially, the model was solved numerically to perform a process analysis and to indicate the effect of the main process parameters, such as electric field strength, water content, temperature (through oil viscosity) and droplet size on the collision time or frequency of collision between a pair of droplets. In decreasing order of importance on the reduction of collision time and consequently on the efficiency of desalting separation, the following variables can be classified such as moisture content, electrostatic field strength, oil viscosity and droplet size. After this analysis, a computational fluid dynamics (CFD) model of a biphasic water–oil flow was developed in steady state using a Eulerian multiphase framework, in which collision frequency and probability of coalescence of droplets were assumed. This study provides some insights into the heterogeneity of a desalination plant which highlights aspects of design performance. This study further emphasizes the importance of two variables as moisture content and intensity of electrostatic field for dehydrated desalination by comparing the simulation with the electrostatic field against the same simulation without its presence. The overall objective of this study is therefore to show the necessity of including complex phenomena such as the frequency of collisions and coalescence in a CFD model for better understanding and optimization of the desalting process from both process safety and improvement.
1. Introduction
Crude oil is a non-renewable and a naturally occurring unrefined petroleum product that consists mainly of hydrocarbons and other inorganic substances [1]. These hydrocarbons have to be separated before they can be used as a fuel. Crude oil is extracted mostly from underground oil fields and also from under the sea bed. It is extracted from wells containing gases, water and a small amount of inorganic salts. The presence of saline water in oil causes numerous problems in an oil refining plant such as corrosion, fouling and formation of scales on the walls of equipment and reduction in activity of refinery catalyst [2,3,4] and thus needs to be removed. The process of removal of saline water from raw crude oil is called desalting. There are several methods for desalting, the most efficient and common being the electrostatic desalting [2]. The main objective of such a unit is to minimize the salt and water content in the oil stream and also to reduce the requirement of energy for pumping and transportation of oil [5,6]. The unit is a complex system involving many phenomena during the operation of the desalting process, which includes fluid flow with droplet–droplet and liquid–droplet interactions, heat transfer and electromagnetic phenomena. Additionally, the geometry of such electrostatic desalting unit is extremely complex. Desalting of crude oil involves two steps, the first is to mix the oil stream with a stream of freshwater intensively, which results in reducing the stability of the water-in-oil emulsion and the second is to separate the saline water present in the emulsion [7,8]. Depending on the amount of gas, salt and water present in the extracted crude oil, two different separation techniques are used. If salt water content is much less, then two-phase separators are used to separate gas from the raw oil stream. If a significant amount of salt water is produced in the process of extraction of raw crude oil, then three-phase separators are used to separate gas from the liquid phase and also water from the oil stream. The oil that leaves the separator contains finely divided water droplets of average diameter ranging from 10 to 20 µm [9]. These finely divided water droplets get emulsified and form water-in-oil (W/O) emulsions. These emulsions consist of water droplets dispersed in oil and the third component being the emulsifying agent to stabilize the system. The volume of water that is present in the W/O emulsion is usually 7% of the extracted hot crude oil [7]. Therefore, electrostatic desalting is one of the most popular methods to remove saline water from crude oil by applying an external electrostatic field. This increases the rate of collision of water droplets thereby improving the coalescence.
Treatment of saline water present in emulsified form (desalting) is a sophisticated process as it depends on various factors such as the concentration of demulsifying agents, wash water, concentration of salt in water, rate of mixing with wash water [2], temperature and rate of dilution [10]. Several researchers [5,7,10,11] have studied the effect of these factors on desalting efficiency. Aryafard et al. [12] simulated the process using a single stage desalting process in which a demulsifier is added to the raw crude oil stream at the beginning. They used population balance equations to account for the interactions between the dispersed phase (water droplets) and the continuous phase (oil) and also for breaking and coalescence of water droplets. Results from their simulation showed that an increase in the inlet flow rate of fresh water from 3% to 6% increases the water separation efficiency from 96.5% to 98.5% which they validated with industrial data. Aryafard et al. [13] further developed a mathematical model in order to determine the efficiency of removal of salt and water from raw crude oil stream in an industrial two-staged desalting process. Their study provided a trend, based on the effect of inlet flow rate of fresh water, pressure drop and magnitude of applied electric field on water and salt removal efficiencies which matched their previous study [12]. A similar model was developed by Kakhki et al. [14] consisting of a mixing valve and an electrostatic drum using the same operating conditions as in [12]. They noted that an increase in the rate of collision between water droplets promotes coalescence. The effect on the inlet flow rate of fresh water showed similar results to that of Aryafard et al. [13]. Bresciani et al. [7] proposed a mechanism for droplet–droplet collision and coalescence in the presence of an external electric field. A model was developed to determine the time between collision and displacement speed of water droplets considering the forces acting on the droplets. Their study focused on the effect of operational variables such as temperature of the emulsion, strength or magnitude of electric field and the inlet rate of fresh water on desalting efficiency. Mahdi et al. [5] demonstrated the effect of process variables, namely chemical dosage of demulsifier, temperature of oil stream, wash water dilution ratio, settling time and mixing time with water stream on desalting efficiency. The efficiency of the desalting process was determined in terms of water cut and degree of salt removal. Vafajoo et al. [15] investigated the influence of concentration of chemical demulsifier, temperature and pH of the oil stream on the performance of desalting process. The two performance variables studied were salt removal efficiency and bottom sediments and water (BSW). Bansal and Ameensayal [16] designed a horizontal electrostatic desalting unit using computational fluid dynamics (CFD) to investigate the flow profile (velocity distribution) of crude oil in the system. They studied the impact of geometry on transitions of flow regime of the crude oil stream based on Reynolds number. The results explained the position of the obstruction plate with respect to the inlet header at which separation of crude oil and water is uniform and separation efficiency is optimum. Shariff and Oshinowo [17] modeled the flow of water-in-oil emulsion using a multiphase approach and showed that the presence of vortices formed by the inlet distributor reduces the separation efficiency to a large extent. The increase in desalting with a reduction in wash water consumption through an enhanced turbulent mixing of wash water with the raw crude oil stream was investigated by Ilkhaani [18]. Xu et al. [19] investigated the desalting efficiency of an external electric field using four different electrodes: plate, folded plate, grid and copper mesh electrodes. They showed that the desalting efficiency of a flat plate electrode is lower than the other configurations, owing to the non-uniformity of electric field distribution.
This study is divided into two main parts. First, a simplified collision model between two droplets in water-in-oil (W/O) emulsions was developed, based on the pioneering work of Bresciani et al. [7]. Then, this model was employed to perform a complete process analysis determining the effect of the main process variables on the collision frequency. The objective of this part is to provide an empirical correlation of the collision frequency to be used in CFD simulations shown in the second part of the study. The ultimate objective is to predict the separation process in a complex desalting unit with realistic assumptions by coupling an analytical analysis of collision between droplets into a CFD simulation in order to include physical phenomena that otherwise would be neglected if only the CFD tool is used which would be scientifically incorrect.
Table 1 summarizes the highlights from research on modeling of the desalting process of crude oil, along with those briefly discussed above. It can be seen from the table that no CFD model has been published so far about this complex phenomenon of collision between droplets, so the effect of the electrostatic field is not yet accounted in the simulation of desalting. This research will lead to understanding of and ultimately optimizing the desalting of crude oil reducing risks of corrosion in the refinery, improving process safety, and in general providing a more environmentally friendly process.
2. Materials and Methods
For a basic understanding of the effect on the main process variables on the desalting efficiency, the analysis was done in a simplification of the real geometry of the system as shown in Figure 1a [9]. The analysis takes place in a space bounded by the inlet of emulsion and by the position of upper and lower electrodes. The separation process involving the coalescence of droplets to increase their size and facilitate the separation from the oil by gravity is oversimplified in this study to understand the time to obtain first collision that eventually determines the real frequency of collisions, which in turn indirectly determines the separation process rate and efficiency. Besides, instead of analyzing the actual process where a population of many droplets of different sizes is present in a water in oil emulsion entering into the electric field zone of the desalting unit, only two droplets are analyzed to set up a model that predicts, from fundamental principles, the rate at which the droplets collide. Figure 1b shows the schematic representation of the two droplets analyzed in this study which experience several forces that determine the time for them to collide.
2.1. Force Balance
The forces acting on both the droplets are indicated in Figure 1b and are, namely, gravitational, buoyant, drag and electrostatic attraction forces. Several simplifying assumptions besides the consideration of a simplified geometry and considering only two droplets one on the top of the other, are stated in this formulation, which is based on the work by Bresciani et al. [7]. These assumptions are as follows: (i) the study does not intend to define the physics of coalescence, but only the process leading to the collision of two droplets; (ii) breakup of droplets is neglected; (iii) system is isothermal so the physical properties are constant; (iv) drag due to the main fluid flow in the desalting unit is neglected and only the movement of the droplets due to the other forces is considered; (v) interfacial tension forces are neglected; (vi) spherical droplets of constant size and evenly distributed at the beginning of the process are considered; (vii) some other forces like the added mass, lift and electrophoresis forces are also neglected; (vii) water-in-oil (W/O) emulsions are only considered in this work. The sum of forces for ith drop, is:
where , , and are the drag, gravity plus buoyant and electrostatic forces of the i-th droplet. Newton’s second law of movement is the mass of a droplet of size times its acceleration and it can be expressed as:
where and are the density and acceleration of the droplet represented as the time derivative of the droplet velocity, . The drag force, , is represented by:
where is the viscosity of the continuous phase (oil). The gravitational and buoyant forces of the droplet are represented as:
where and are the oil density and gravitational constant, respectively. Finally, the electrical forces for droplet 1 and droplet 2 can be estimated as:
where , and are the dielectric constant of oil, the electric field and the distance between droplets, respectively. Subscripts 1 and 2 stand for droplet 1 (lower) and 2 (upper) as represented in Figure 2.
By substituting Equations (2)–(6) into Equation (1) for droplets 1 and 2, the following system of three ordinary differential equations arises:
Equations (7) and (8) come out by applying Newton’s second law of motion for droplet 1 Equation (7) and for droplet 2 Equation (8), while the third equation comes out by updating the distance between the droplets. Initial conditions for the velocities of both droplets assume static conditions i.e., , while the initial distance of the droplets takes into account the amount of water expressed in volume fraction and the size of the two droplets and in a cubic volume according to:
A system of 3 differential equations was numerically and simultaneously solved by employing the iterative Runge–Kutta 4th order method that provides a very low total error if a small step is employed [22]. In this case, an optimal time step was used for each case between and s. A Python® code version 3.6 was written to solve the problem for , , i.e., the velocities of the droplets 1 and 2 and the distance between droplets at time step . The simulation ends when the distance between the droplets approaches zero. The code is simulated in a PC with 32 Gb RAM, process Intel Xeon Silver 4110 CPU 2.1 GHz. Cases with smallest droplet size took until iterations to converge and computational time was about 55 h each one.
Table 2 lists the physical properties of the droplets (water) and of the continuous phase (oil) as well as typical operating variables including electric field, droplet sizes, temperature (through the oil viscosity) and water volume fraction of the emulsion as standard conditions in the present study.
The model was used to perform a process analysis to elucidate the effect of the main process analysis such as the water content in the emulsion, the strength of the electric field, the oil viscosity and the size of the two droplets for the case where both are the same size or they are not. Table 3 shows the values employed for each variable.
2.2. Mathematical Modeling
The previous process analysis provides a theoretical collision frequency correlation between droplet lets coming out from first principles and including the main process parameters. This correlation may be used to develop a robust 3D mathematical model on the multiphase fluid flow of the emulsion in a real geometry of a desalting unit through a computational fluid dynamics (CFD) simulation. The fact that the model includes the collision frequency correlation developed through the model presented in the previous section, is necessary to predict and understand the effect of the presence or absence of the electric field in the separation kinetics in an industrial desalting unit. The mathematical model, including simplifying assumptions, governing equations and boundary conditions, is presented below.
2.2.1. Assumptions
The assumptions to model the separation of water-in-oil emulsions are listed below:
- Isothermal system, i.e., there are no gradients of temperature.
- Constant physical properties, each fluid phase is Newtonian and incompressible.
- Non-slip and impermeable conditions were applied for all the internal walls and standard wall functions were used.
- Oil liquid phase is considered as a continuous primary phase and water is considered as the dispersed secondary phase.
- The multiphase system is modeled with a mixture approach which solves a single set of equations: the continuity, the turbulent Navier–Stokes equations and the realizable turbulence model, which showed the best convergence behavior and that is being used recently in many complex flow systems.
- A conservation equation for interfacial area concentration is used as an approximation to take into account the coalescence and break up of droplets due to the electrostatic and turbulence effects to compute a droplet t diameter distribution.
- Coalescence terms depend on the frequency of collision, which is taken as the inverse of the time between collisions, which in turn is obtained from the previous droplet collision study.
2.2.2. Governing Equations
The mixture model uses the volume fraction composition of the mixture contained in every cell to compute the density, the viscosity, and the velocity of the mixture. These properties are calculated for phases according to:
where , , and are the density, viscosity, and velocity for the mixture; , , and are the same properties for each phase. is the volume phase fraction, and subscript denotes the i-th phase. For this case, subscripts and are used to denote water (secondary, dispersed phase) and oil (primary, continuous phase), respectively.
The continuity and momentum conservation equations are formulated for mixture of phases and taking properties of the mixture in a regular way [23], including in the convective terms the drift velocity , which specifies the slip velocity between the dispersed phase (water) with respect to the continuous phase (oil) as:
where is the slip velocity modeled by an algebraic slip formulation according to Manninen et al. [23], the water droplet diameter (defined later), is the acceleration given by gravity and centrifugal forces. The second term in the right side of (15) contains the dispersion due to the turbulence, where is the turbulent diffusivity calculated from a continuous-dispersed fluctuation velocity correlation, is the Prandtl turbulent number fixed to a value of 0.75, and is the drag coefficient, calculated by the Schiller–Nauman correlation as:
where is the relative Reynolds number. The volume fraction conservation equation is derived from the continuity equation of the secondary dispersed phase:
2.2.3. Interfacial Area Concentration Model
To include the emulsion breakup, a single transport equation is added to solve the interfacial area concentration which is defined as the interfacial area formed between the dispersed phase (water) and the continuous (oil) phase per unit volume of mixture. This equation represents a population balance which considers the droplets volume fraction as a function of droplet size distribution resulting when it breaks up or two or more droplets coalesce.
where is the interfacial area concentration (), and the right-hand side terms in Equation (18) account for the coalescence and breakup of the dispersed phase. is the coalescence source term due to random collisions, and is the breakup source term due to turbulence. In this study, the coalescence term was considered as a modified Hibiki–Ishii model [24] as follows:
where is a total coalescence probability after a collision, is the number of droplets per volume of mixture, and is the frequency of collisions, which is proposed in the first part of this study Equation (28). The breakup source term by turbulent impacts is calculated by the Hibiki–Ishii model:
where is the number of eddies per volume of the two-phase mixture according to Azbel and Athanasios [25], is the frequency of collision due turbulence, and is the breakup efficiency.
Additionally, the water droplet diameter is calculated as:
2.2.4. Realizable Turbulence Model
As the mixture approach is used, a single set of equations were used to compute the turbulent kinetic energy and its dissipation rate ( and ) using the mixture shared properties. Conservation equations of and are solved using realizable turbulence model that can be found elsewhere (Shih et al. [26]). This turbulence model mainly gives a superior ability to capture the mean flow of complex structures and for flows involving rotation in closed domain as in the case of crude oil electrostatic desalting unit. Dutta et al. [27] used realizable model to account for the effect of turbulence in a closed domain flow similar to the desalter and Chen et al. [28] adopted realized and Eulerian models to evaluate the separation efficiency in an oil/water separator validating their numerical results with experiments. Furthermore, Mouketou and Kolesnikov [29] compared multiphase flow simulations with experimental data applying the same modeling approach and included a Lagrangian model for solid particles applicable to their oil–water process. Using the above reasoning, the flow conditions found in the device are found to be compatible with realizable model and with non-equilibrium wall function.
2.2.5. Boundary Conditions and Solution
The boundary conditions include non-slip and impermeability at all the walls of the system while standard wall functions accounted for non-equilibrium conditions are used to connect the turbulent core with the laminar flow field near the static walls. At the inlet, a fixed uniform mixture velocity is set and at the outlets, the gauge pressure is set to zero. Finally, the model was implemented in the CFD code Fluent Ansys version 19.0. It ran in a PC with 32 Gb RAM and processor Intel Xeon Silver 4110 CPU 2.10 GHz and a clock speed of 2095 Mhz and it took around 6 h of simulation in steady state to get convergence simulating with 10,000 iterations for a mesh with around 1,500,000 elements, resulting after performing a grid sensitivity study, where this mesh is the optimum in reducing the computational time with good enough accuracy. For the grid sensitivity study, three more grids were simulated with around 0.5, 1 and 3 million mesh elements. The average (mixture) velocity was then calculated for each of these mesh elements and compared. Increasing from around 1,500,000 to around 3,000,000 elements brought only 0.51% (that is less than 1%) change in the average mixture velocity which was considered a marginal improvement compared to the increase in computational time (6 h of simulation to 13 h to obtain convergence). As such, it was decided to continue further simulation with around 1,500,000 elements.
In Table 4, the geometry of the desalting unit together with operating parameters are shown, while Figure 2 shows a detail of the unit including the position of inlets, outlets and electrodes. After a sensitivity study of the grid, a mesh of 1,500,000 elements was carefully designed to warrant results independent of the grid and convergence, including finer elements next to inlets, outlet and internal walls than in the zones where there are no such elements, was obtained as can be seen in Figure 2a–c.
3. Results and Discussion
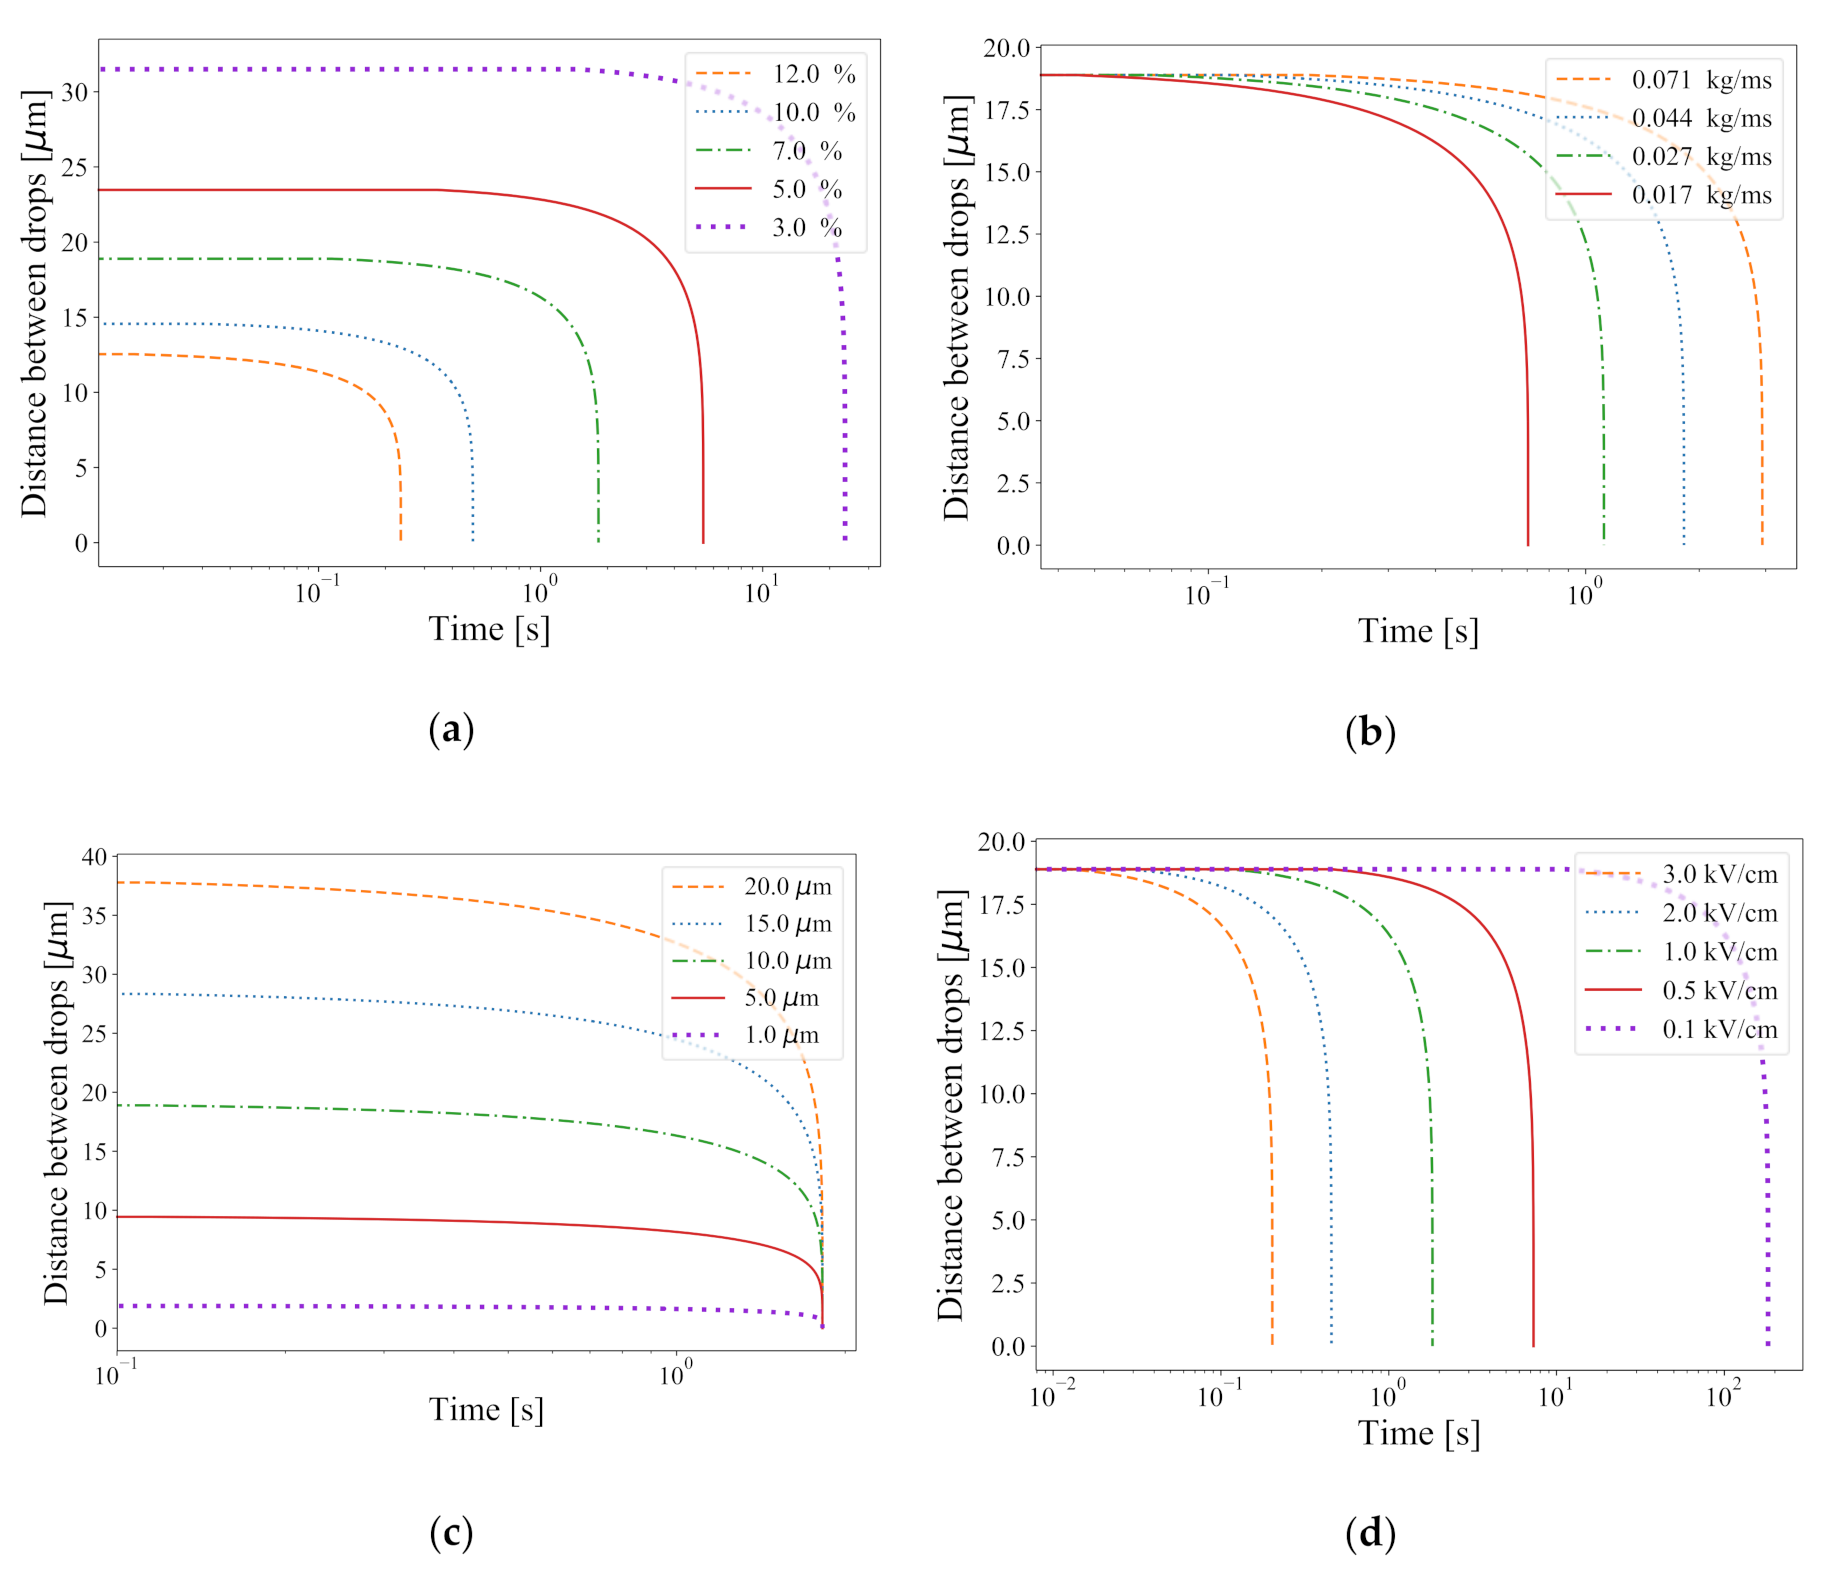
Figure 3 shows the plots of the time-evolution (in logarithmic scale) of the distance between droplets, which represents the process analysis performed in this study to reveal the effects of water content (Figure 3a), oil viscosity (Figure 3b), size of the droplets assuming same size (Figure 3c), electric field (Figure 3d), on the time to get a collision between the two droplets. The initial distance between droplets depends only on the water content and droplet size as expressed by Equation (10), so this is why the distances between droplets are different at initial time for Figure 3a,c (effect of water content and droplet size), while for the rest of variables the initial distances are the same in all cases (the simulations used constant droplet size of 10 µm and constant water volume fraction of 0.07). The levels of each variable analyzed are depicted in the legend of each plot and they correspond to those shown in Table 3. The rest of the operating conditions in each simulation correspond to the so-called standard conditions presented in Table 2. Figure 3a shows that as the volume fraction of water increases, both the initial distance between droplets and the time for collision decrease. When more water is present in the emulsion of evenly distributed droplets of constant size, these droplets get closer to each other and the electric field forces act inversely proportional to the distance between droplets to get the collision at shorter times (<1 s). On the contrary, when the water content is the lowest, the initial distance between droplets is three times larger than the largest water content and consequently, the electric field forces are delayed (>20 s) to bring both droplets into contact. The other forces, such as the gravitational forces (weight and buoyant) have the same significance at constant droplet size. Figure 3b shows the effect of oil viscosity on the collision time, where it can be noted that when the viscosity of the oil increases four times (temperature decreases) the time for the first collision increases as well from 0.7 to 3 s (i.e., more than four times). The oil viscosity increment increases the drag force that prevents in a certain way the motion of the droplets delaying the collision between droplets. Figure 3c shows that there is no effect of the droplet size on the time for the first collision. Actually, the only effect of reducing the droplet size is reducing the initial size between droplets for constant water content, i.e., as the size of droplet increases, they are more separated from each other. All forces acting on the droplets depend on the size of droplets, but apparently, their opposite effects in the different forces cancel out for determining the time for the first collision keeping constant the electric field, oil viscosity and water content in the emulsion. This conclusion is important but must be taken cautiously since in real emulsion the size of droplets is not constant but it presents a population of sizes that makes it complex to analyze this variable. Furthermore, in this study, the effect of the size with different droplet sizes will be analyzed. Figure 3d presents the effect of the electric field strength on the time for the first collision between two droplets of the same size. The effect of this variable is significant, since reducing the electric field from 3 to 0.1 kV/m increases the collision time from less than 1 s to approximately 175 s (keeping the other variables fixed). The electrostatic attractive force created by the dipolar effect on the droplets, attract two near droplets and dominate the force balance if the field is big enough to overcome the drag and gravitational forces. Then the desalting unit needs the electric field to achieve the separation.
These results of collision time were correlated with the four variables explored to obtain the following equation that shows a correlation applicable only for the case when the two neighboring droplets have the same size:
The sign and the magnitude of the exponent of each variable indicate the dependence between the time for the first collision and that variable. The more significant variables in order of decreasing importance are water content, electric field, oil viscosity, and droplet size and the sign indicates that an increment in both the water content and electric field will increase the probability of fast collisions causing eventually coalescence of droplets and therefore efficient water and salt separation from oil. On the contrary, the increment in oil viscosity (decrement in temperature) will increase the collision time, decreasing the collision frequency and reducing the rate of separation and the efficiency of the process. The size of the droplets has practically no effect on the collision time since the exponent is nearly zero. Figure 4 shows the performance of the correlation in predicting the values obtained by the model. The agreement is excellent, so the correlation represents a good quantitative summary of the effect of the variables explored on the collision time and indirectly in the efficiency of the desalting process.
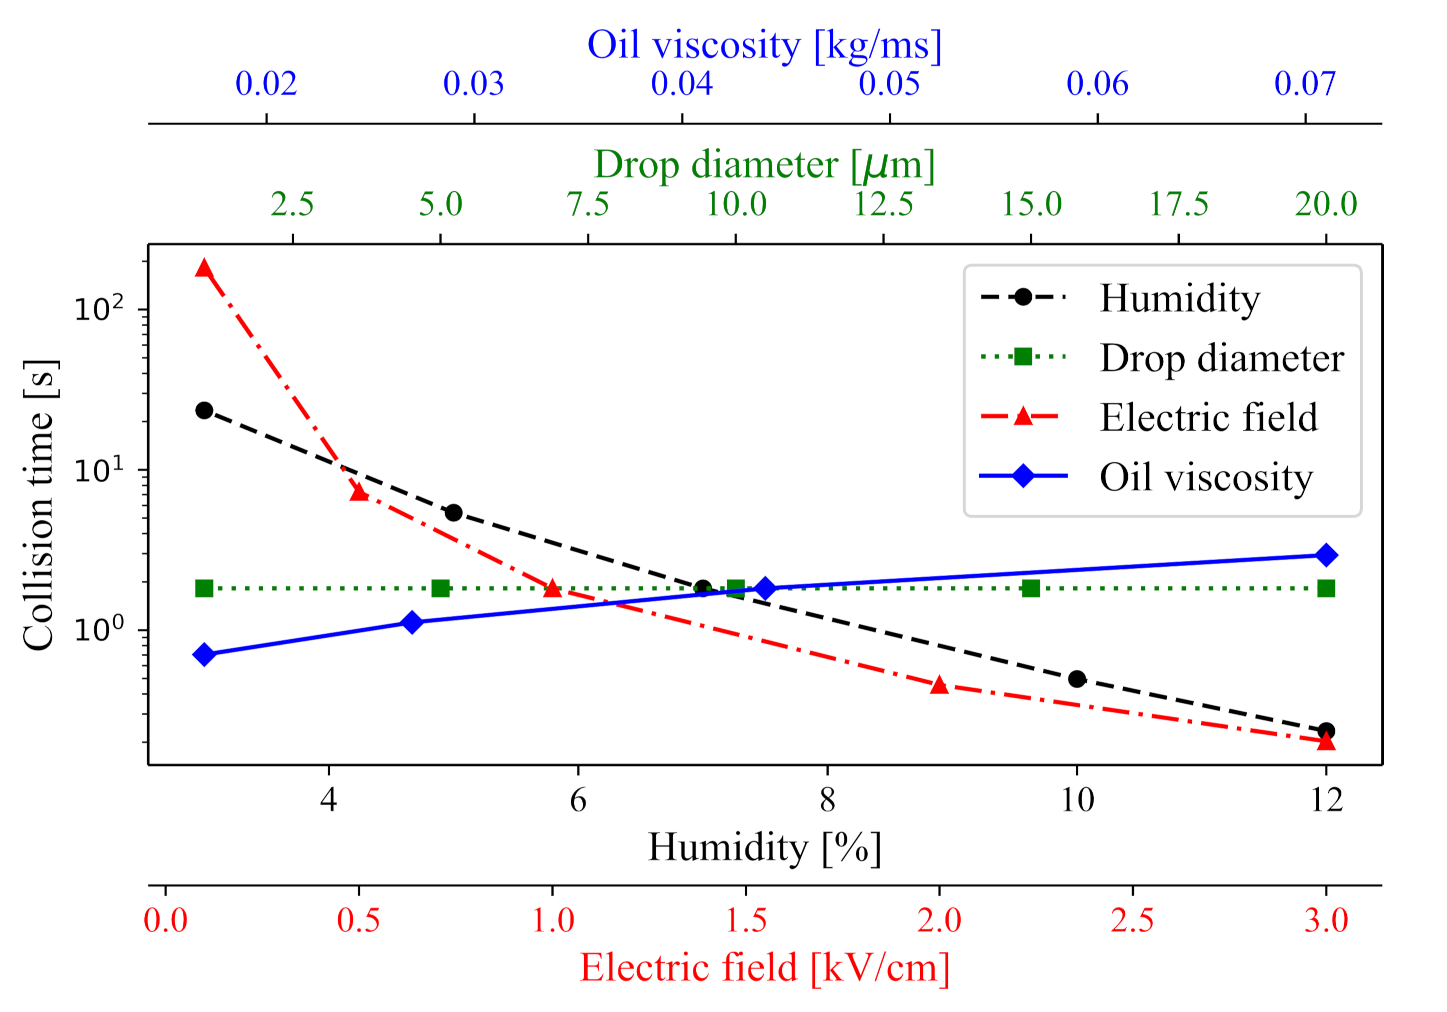
In Figure 5, the time for the first collision between two droplets is plotted as a function of each variable explored in this study, such as the water content, droplet size, oil viscosity (temperature) and intensity of electric field. It can be noted that the most significant variables in order of descending importance are the electric field, water content of the emulsion, oil viscosity and the droplet size; the final variable not having a visible effect on the time for the first collision between the two droplets. The droplet Reynolds number ranges from 0.002 to 0.82 considering velocity ranges between 0.1 and 2 m/s and with a range of sizes of 1–20 µm. All cases studied fall under the Stokes regime and maybe this is why the droplet size does not influence the collision time. The effect of electric field and water content is inverse with collision time, i.e., the higher the electric field and water content, the lower the collision time, while the oil viscosity has a moderate proportional relationship with the collision time. It is necessary to note that this result was not shown by Bresciani et al. [7]. Additionally, the study of the effect of water content and oil viscosity on collision time was also not carried out by them. These results have economic and environmental implications, and these are subjected to an optimization analysis to minimize the operational costs and reduce corrosion in the refinery. In this regard, an increase in both the water content and electric field will signify increase in the freshwater consumption and the use of a bigger electric field with an associated investment and operational cost as well as environmental issues, so there must be a compromise between separation efficiency and operational (more electric energy) and investment cost (more robust equipment) in the electrostatic desalting unit. Additionally, in the case of the water content, an excessive increase in this variable may result in reverse of the emulsion from water-in-oil (W/O) to an oil-in-water (O/W) more difficult to separate and the waste of fresh water is negative to the environment and to the population. Besides, the results are just indirectly related to the separation process since the collision is not sufficient for coalescence as the presence of emulsifying substances at the oil–water interface may prevent coalescence [4].
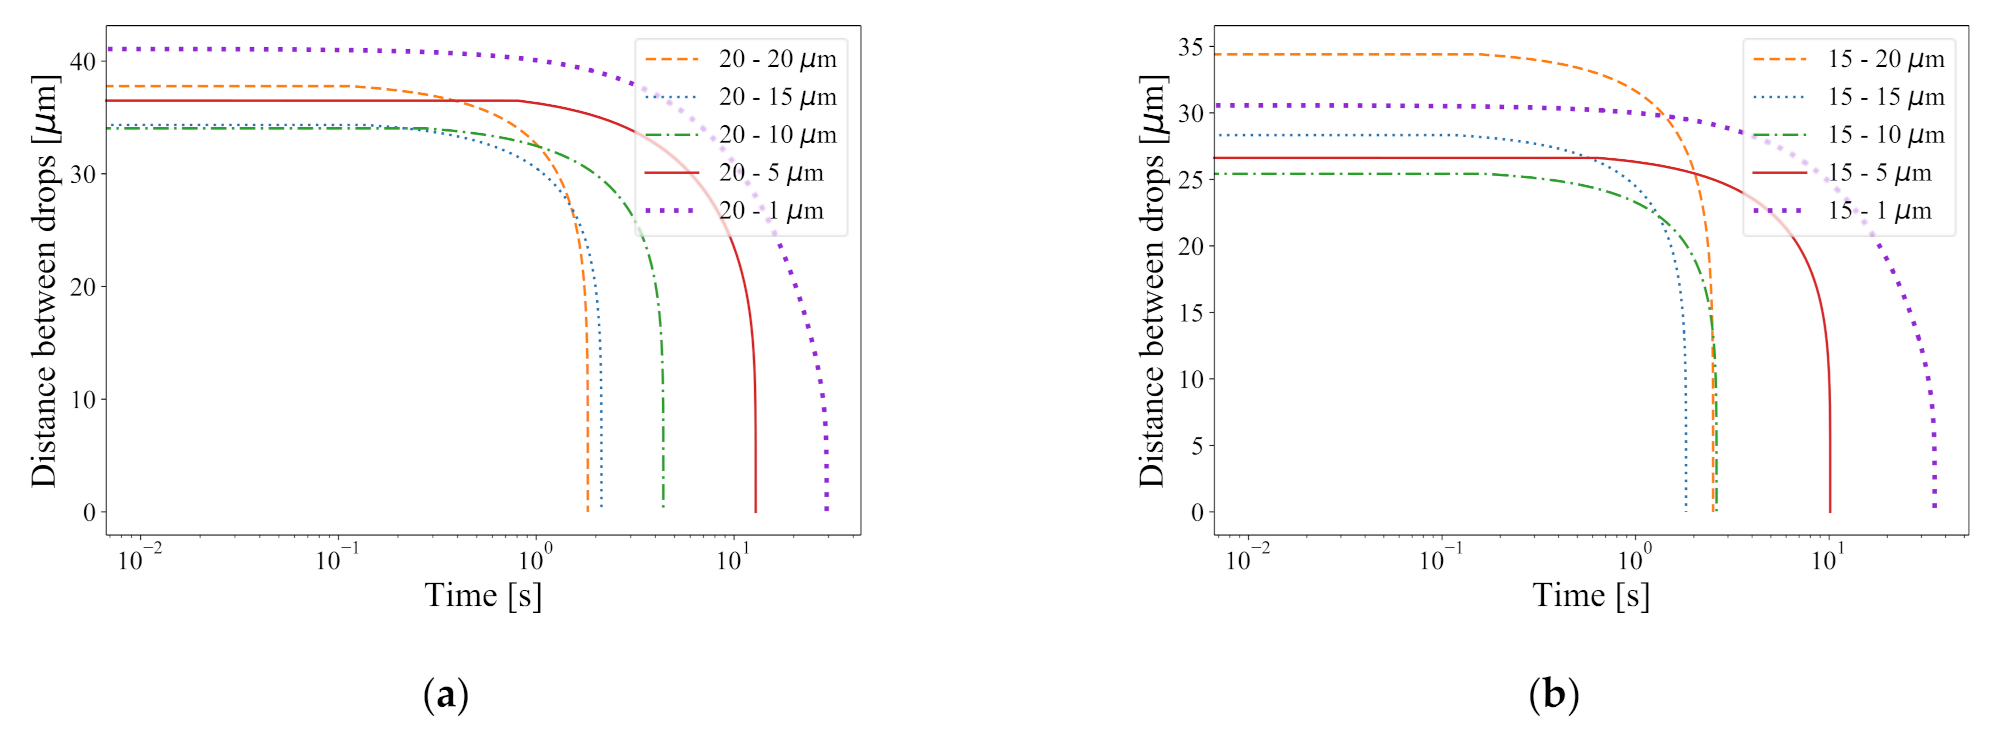
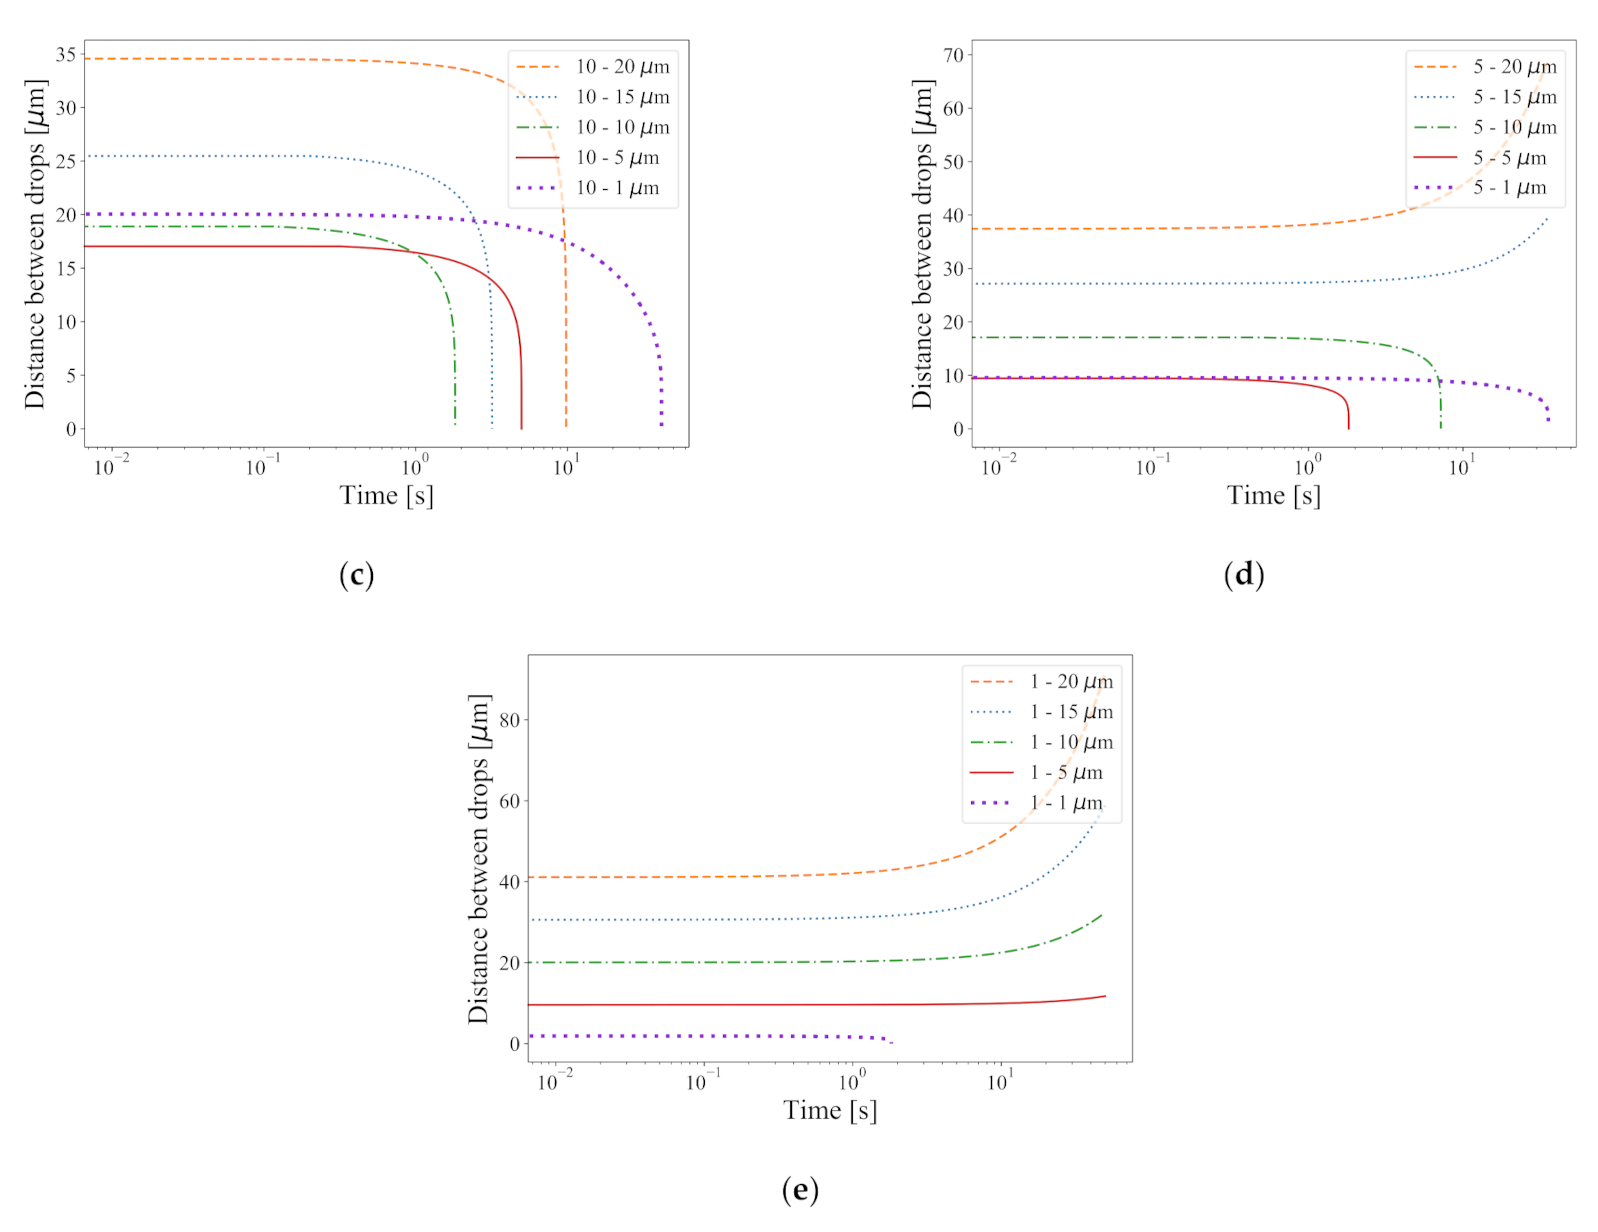
Finally, if the two droplets have different sizes, the analysis gets more complex. Figure 6 presents this effect when the upper droplet is 20 µm (Figure 6a), 15 µm (Figure 6b), 10 µm (Figure 6c), 5 µm (Figure 6d) and 1 µm (Figure 6e), and the lower droplet sizes vary from 5 to 20 µm while keeping the rest of variables with values mentioned in Table 2 (standard conditions). For big upper droplets of 20, 15 and 10 µm (Figure 6a–c, respectively), the time for the first collision is around 2 s when the lower droplet is 20 µm and around 10 s when the lower droplet is 5 µm. However, when the upper droplet is 5 µm (Figure 6d) and the lower droplet is also small (5 or 10 µm), the droplets do not collide but rather they separate more as time increases. This effect is even more evident when the upper droplet is 1 µm (Figure 6e) where only the lower droplet of the same size (1 µm) will eventually collide, while with the rest of lower droplet sizes no collision occurs. Then, if the lower droplet is bigger than the upper droplet, the former will sink by gravity at a higher rate than the upper small droplet, so the distance between droplets will increase. In the actual process with much more than two droplets, this effect of no collision would not likely happen since the upper droplet will sooner or later meet another droplet. However, these results indicate that neighboring droplets of similar size would enhance more the separation process than a droplet population with a broader distribution of size. It is well known that inducing a high shear stabilizes the emulsion and also adding fresh water with a big pressure drop at the mixer valve reduces the size of the droplets with a narrow distribution of sizes. Besides, the reader should take into account that the drag force included in the previous analysis is valid for droplets moving in a static fluid but in the real desalter unit there is a fluid flow that promotes a different drag regime, so caution is advised in using these results and extrapolating them into the industrial unit. Additionally, in the current model, the DLVO theory was not taken into account, which is an oversimplification, and consequently, the electric double layer and Van der Waals forces are not considered, which would include a repulsion force between the droplets as they approach closer one to the other before collision takes place and would increase in some extent the estimated collision times slowing down the coalescence process. Additionally, the application of the electric field and the presence of impurities in the crude oil affects the stability and size distribution of droplets.
For the sake of gaining quantitative knowledge on the significance of each parameter, a full factorial design at two levels was performed, and the statistical analysis outcome is presented in Figure 7 and Table 5, which present a variance analysis to determine which variable or interaction between the variables are the most significant on the collision time. Figure 7 presents a Pareto chart with the mean effects of the parameters and Table 5 has more detailed information on the same effects. It is worth noting that the interaction E*x has a positive significant effect on the collision time, which suggests that increasing both variables at the same time may be detrimental in the separation process.
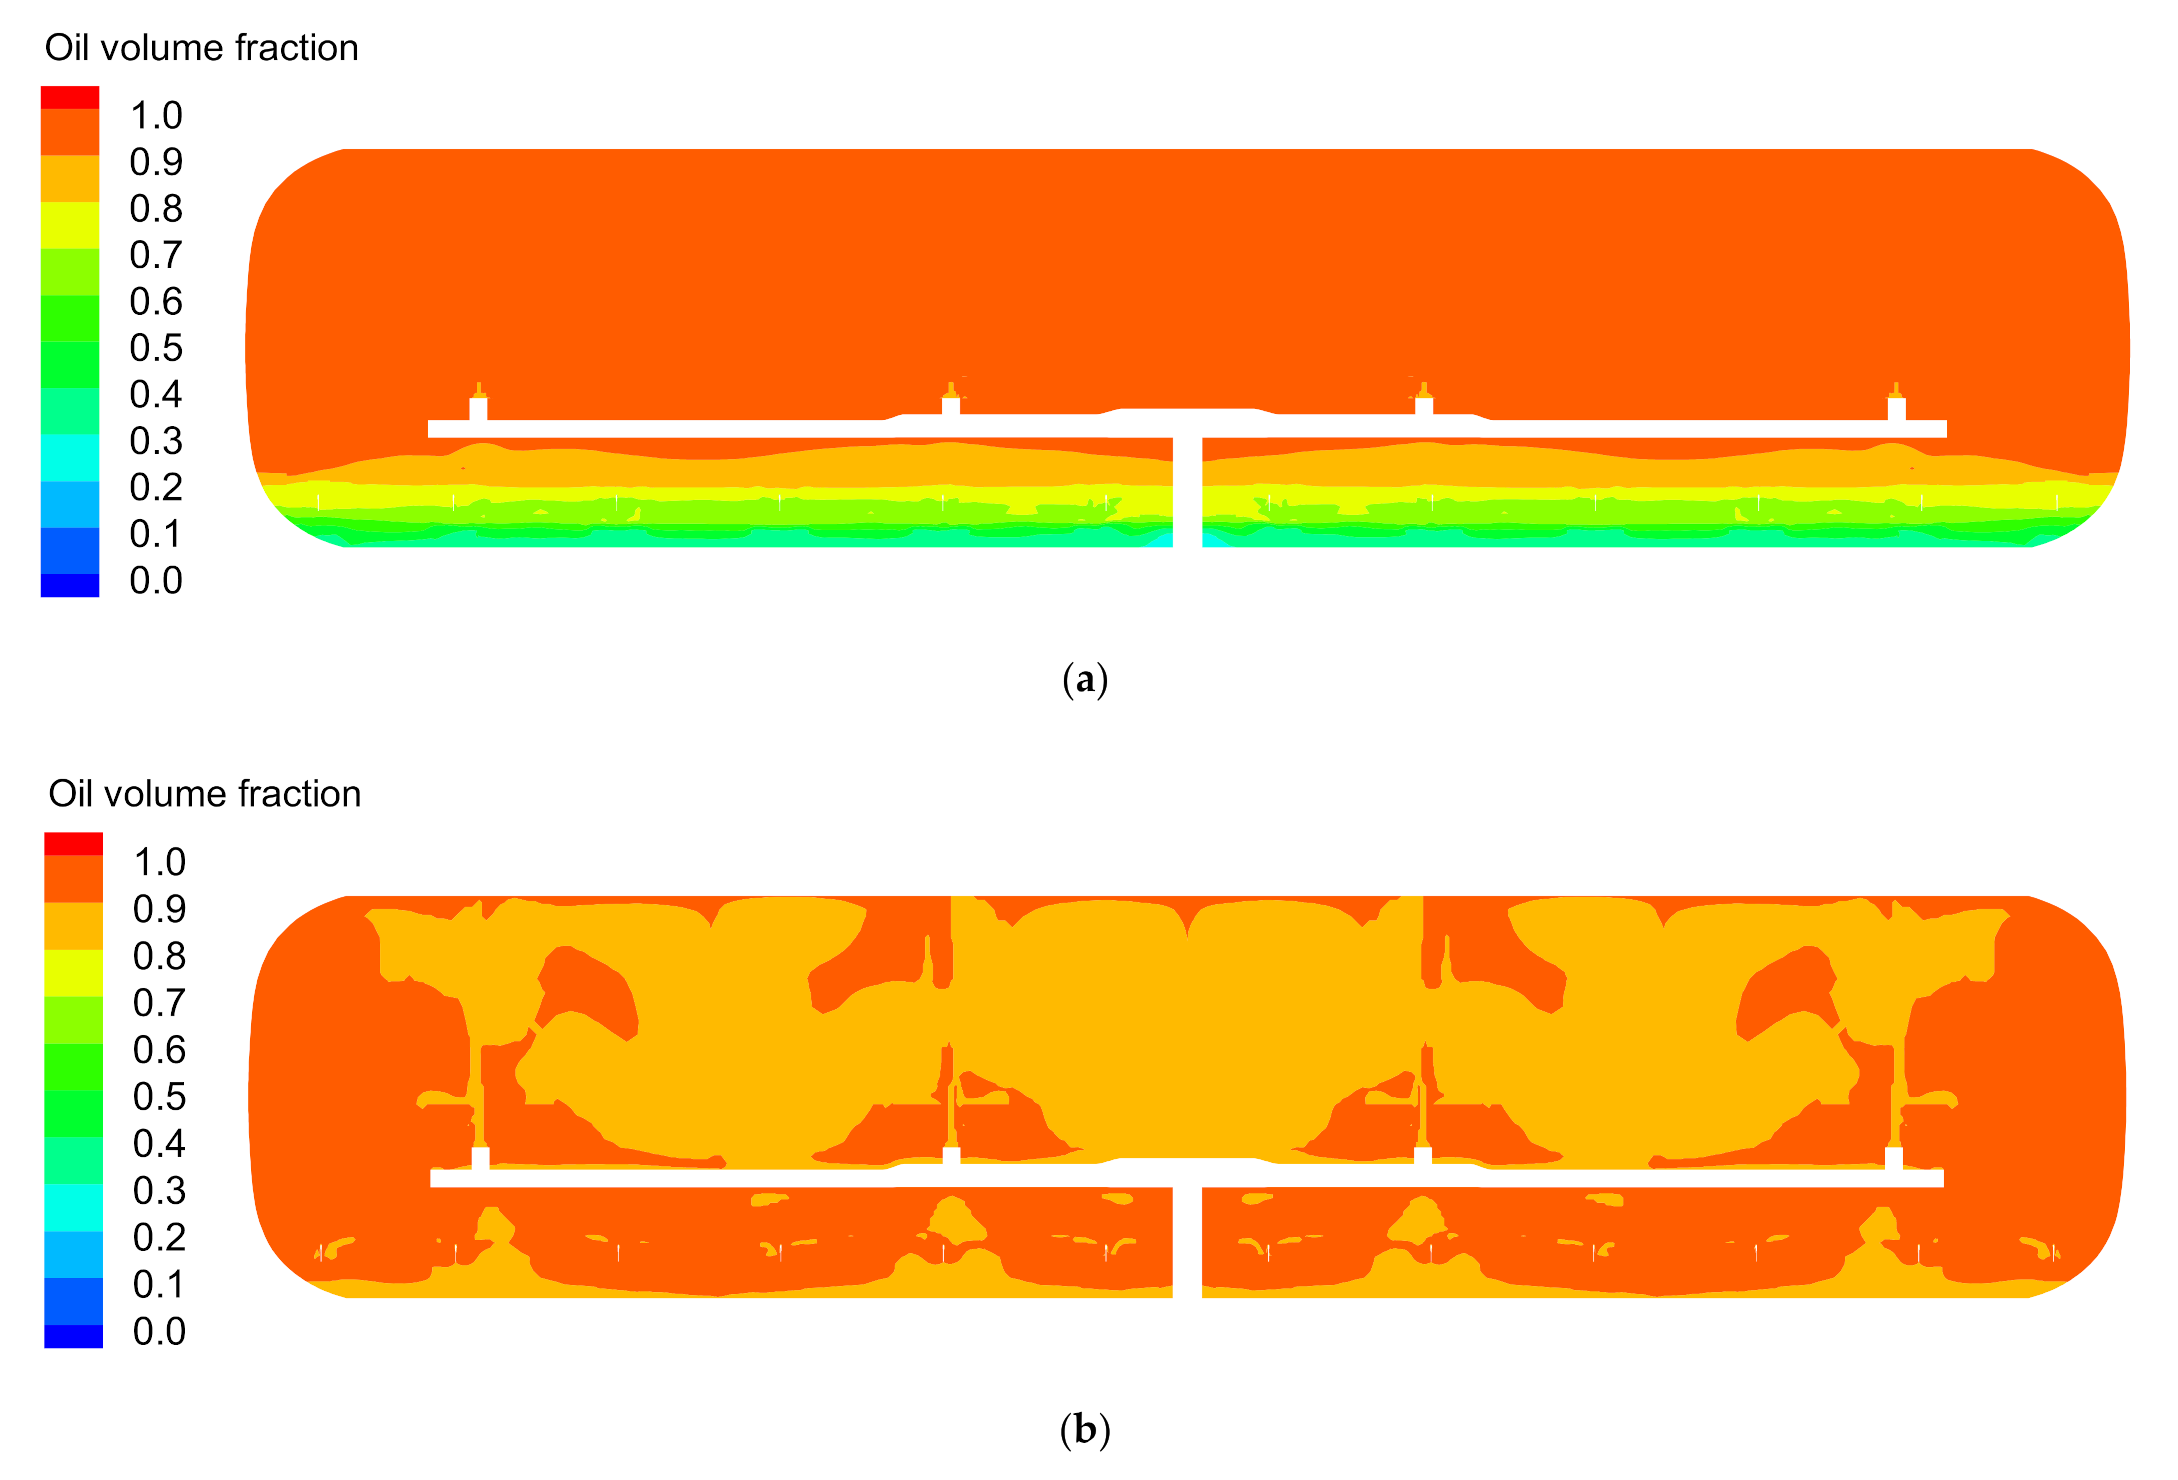
Some basic understanding is gained with the use of such a simplified model. However, it is the intention of this study to provide a less simplified description of the desalting unit operation through a computational fluid dynamics (CFD) model. Such a model has to be considered to be a new approach with new tools in its first stages of development, which is prepared to predict breakage emulsion for 3D complex geometry with actual operating conditions of an industrial electrostatic desalting unit to see the effect of the electric field in the water–oil separation. A detailed process analysis with this CFD model is beyond the scope of the current study, and in this study only the effect of the presence of the magnetic field is explored as a closure of the methodology proposed which included the frequency of collisions correlation cast into the CFD model. Figure 7 presents the oil volume fraction contours at the middle plane in an industrial desalting unit with a presence of an electric field of 1 kV/cm (Figure 8a) and without electric field (Figure 8b). The rest of the variables are, namely, 0.044 Pa s of oil viscosity, variable droplet size from 1 to 20 μm (due to coalescence), and 10% water content. The model includes the frequency correlation as a function of the process variables, and it can clearly be seen that the electric field allows separation of water and that the absence of such a field preserves the emulsion. It has been confirmed with these results, that the development of a collision model from the present study, to predict coalescence, is a key feature of any subsequent study allowing a proper prediction of the industrial electrostatic desalting unit.
4. Conclusions
Time for collision between two droplets is related to the rate of coalescence which influences the rate separation between water and oil in an electrostatic desalting unit. A process analysis was performed to determine the effect of the electrostatic field, water content, oil viscosity (temperature) and droplet size on the collision time. The analysis gave the following outcomes:
- The time of collision varies with an inverse relationship to the third power of the water content, which indicated to be the most significant variable, valid in the range of water content of 3–12%.
- The time of collision varies inversely to the square of the electrostatic field (0.1 < E < 3 kV/cm), while it has a proportional nearly linear relationship to the oil viscosity (0.017 < µo < 0.071 Pa s).
- The droplet size has no influence on the time of collision within the range of droplet sizes analyzed in this work (1 µm up to 20 µm).
If the upper droplet is smaller than the lower droplet in the unit, for emulsions with a wide distribution of sizes, collision may be delayed or even not occur since gravitational force dominates over the electrostatic force on the bottom heavier droplet. The time between collision (frequency of collision) is useful to simulate coalescence phenomena in complex multiphase fluid flow simulations in industrial desalting units performed using numerical modeling, which represents a new tool and hence a new approach (balance of forces model to get a correlation for the time between collisions of a couple of droplets cast into a CFD multiphase fluid flow model) to explore the performance and optimization of electrostatic desalting units. In this study, the effect of the electric field was shown to be a key parameter that has to be included in the description of the separation phenomenon, if the quantitative prediction of the separation kinetics is the goal of any future CFD analysis. This would help to ultimately optimize the desalting of crude oil reducing risks of corrosion in the refinery, improving process safety, and in general providing a more environmentally friendly process.
Author Contributions
Conceptualization, M.A.R.-A., J.G.-F. and A.D.; methodology D.A.-L.; software, D.A.-L. and A.D.; validation, D.A.-L. and J.G.-F.; formal analysis, M.A.R.-A.; investigation, J.G.-F. and A.D.; resources, J.G.-F. and M.A.R.-A.; writing—original draft preparation, A.D.; writing—review and editing, M.A.R.-A. and A.D.; supervision, A.D.; funding acquisition, J.G.-F. and M.A.R.-A. All authors have read and agreed to the published version of the manuscript.
Funding
This research was funded by SENER—CONACYT 144156, Alternativas tecnológicas para mejorar el sistema de desalado de crudo pesado en las refinerías.
Institutional Review Board Statement
Not applicable.
Informed Consent Statement
Not applicable.
Data Availability Statement
Data collected belongs to the property of PEMEX.
Conflicts of Interest
The authors declare no conflict of interest.
References
- Abdel-Aal, H.K.; Aggour, M.; Fahim, M. Petroleum and Gas Field Processing, 1st ed.; Marcel Dekker, Inc.: New York, NY, USA, 2003. [Google Scholar]
- Al-Otaibi, M.B.; Elkamel, A.; Nassehi, V.; Abdul-Wahab, S.A. A Computational Intelligence Based Approach for the Analysis and Optimization of a Crude Oil Desalting and Dehydration Process. Energy Fuels 2005, 19, 2526–2534. [Google Scholar] [CrossRef]
- Check, G.R.; Mowla, D. Theoretical and experimental investigation of desalting and dehydration of crude oil by assistance of ultrasonic irradiation. Ultrason. Sonochem. 2013, 20, 378–385. [Google Scholar] [CrossRef] [PubMed]
- Daniel-David, D.; Pezron, I.; Dalmazzone, C.; Noïk, C.; Clausse, D.; Komunjer, L. Elastic properties of crude oil/water interface in presence of polymeric emulsion breakers. Colloids Surf. A Physicochem. Eng. Asp. 2005, 270–271, 257–262. [Google Scholar] [CrossRef]
- Mahdi, K.; Gheshlaghi, R.; Zahedi, G.; Lohi, A. Characterization and modeling of a crude oil desalting plant by a statistically designed approach. J. Pet. Sci. Eng. 2008, 61, 116–123. [Google Scholar] [CrossRef]
- Lake, L.W.; Fanchi, J.R.; Society of Petroleum Engineers (U.S.). Petroleum Engineering Handbook; Society of Petroleum Engineers: Richardson, TX, USA, 2006. [Google Scholar]
- Bresciani, A.E.; Alves, R.M.B.; Nascimento, C.A.O. Coalescence of Water Droplets in Crude Oil Emulsions: Analytical Solution. Chem. Eng. Technol. 2010, 33, 237–243. [Google Scholar] [CrossRef]
- Sams, G.; Zaouk, M. Emulsion Resolution in Electrostatic Processes. Energy Fuels 2000, 14, 31–37. [Google Scholar] [CrossRef]
- Bresciani, A.E.; Mendonça, C.F.X.; Alves, R.M.B.; Nascimento, C.A.O. Modeling the kinetics of the coalescence of water droplets in crude oil emulsions subject to an electric field, with the cellular automata technique. Comput. Chem. Eng. 2010, 34, 1962–1968. [Google Scholar] [CrossRef]
- Abdul-Wahab, S.; Elkamel, A.; Madhuranthakam, C.R.; Al-Otaibi, M.B. Building inferential estimators for modeling product quality in a crude oil desalting and dehydration process. Chem. Eng. Process. Process Intensif. 2006, 45, 568–577. [Google Scholar] [CrossRef]
- Abdel-Aal, H.K.; Zohdy, K.; Abdelkreem, M. Waste Management in Crude Oil Processing: Crude Oil Dehydration and Desalting. Int. J. Waste Resour. 2018, 8, 326. [Google Scholar] [CrossRef]
- Aryafard, E.; Farsi, M.; Rahimpour, M.R. Modeling and simulation of crude oil desalting in an industrial plant considering mixing valve and electrostatic drum. Chem. Eng. Process. Process Intensif. 2015, 95, 383–389. [Google Scholar] [CrossRef]
- Aryafard, E.; Farsi, M.; Rahimpour, M.R.; Raeissi, S. Modeling electrostatic separation for dehydration and desalination of crude oil in an industrial two-stage desalting plant. J. Taiwan Inst. Chem. Eng. 2016, 58, 141–147. [Google Scholar] [CrossRef]
- Kakhki, N.A.; Farsi, M.; Rahimpour, M.R. Effect of current frequency on crude oil dehydration in an industrial electrostatic coalesce. J. Taiwan Inst. Chem. Eng. 2016, 67, 1–10. [Google Scholar] [CrossRef]
- Vafajoo, L.; Ganjian, K.; Fattahi, M. Influence of key parameters on crude oil desalting: An experimental and theoretical study. J. Pet. Sci. Eng. 2012, 90–91, 107–111. [Google Scholar] [CrossRef]
- Bansal, H.; Ameensayal. CFD analysis of horizontal electrostatic desalter influence of header obstruction plate design on crude-water separation. In Proceedings of the International Conference on Research in Electrical, Electronics & Mechanical Engineering, Dehradun, India, 26 April 2014. [Google Scholar]
- Shariff, M.M.; Oshinowo, L.M. Debottlenecking water-oil separation with increasing water flow rates in mature oil fields. In Proceedings of the 5th Water Arabia 2017 Conference and Exhibition, Al-Khobar, Saudi, 17–19 October 2017. [Google Scholar]
- Ilkhaani, S. Modeling and Optimization of Crude Oil Desalting. Master’s Thesis, University of Waterloo, Waterloo, ON, Canada, 2009. [Google Scholar]
- Xu, X.; Yang, J.; Gao, J. Effects of Demulsifier Structure on Desalting Efficiency of Crude Oils. Pet. Sci. Technol. 2006, 24, 673–688. [Google Scholar] [CrossRef]
- Mohammadi, M. Numerical and experimental study on electric field driven coalescence of binary falling droplets in oil. Sep. Purif. Technol. 2017, 176, 262–276. [Google Scholar] [CrossRef]
- Alnaimat, F.; Alhseinat, E.; Banat, F.; Mittal, V. Electromagnetic–mechanical desalination: Mathematical modeling. Desalination 2016, 380, 75–84. [Google Scholar] [CrossRef]
- Ascher, U.M.; Petzold, L.R. Computer Methods for Ordinary Differential Equations and Differential-Algebraic Equations, 1st ed.; SIAM: Philadelphia, PA, USA, 1 August 1998; ISBN 0898714125. [Google Scholar]
- Manninen, M.; Taivassalo, V.; Kallio, S. On the mixture model for multiphase flow. Tech. Res. Cent. Finl. 1996, 288, 67. [Google Scholar]
- Hibiki, T.; Ishii, M. One-group Interfacial Area Transport of Bubbly Flows in Vertical Round Tubes. Int. J. Heat Mass Transf. 2000, 43, 2711–2726. [Google Scholar] [CrossRef]
- Azbel, D.; Athanasios, I.L. A mechanism of liquid entrainment. In Handbook of Fluids in Motion, 1st ed.; Cheremisino, N., Ed.; Ann Arbor Science Publishers: Ann Arbor, MI, USA, 1983. [Google Scholar]
- Shih, T.H.; Liou, W.W.; Shabbir, A.; Yang, Z.; Zhu, J. A New K-epsilon Eddy-Viscosity Model for High Reynolds Number Turbulent Flows—Model Development and Validation. Comput. Fluids 1995, 24, 227–238. [Google Scholar] [CrossRef]
- Dutta, A.; Ekatpure, R.; Heynderickx, G.; de Broqueville, A.; Marin, G. Rotating fluidized bed with a static geometry: Guidelines for design and operating conditions. Chem. Eng. Sci. 2010, 65, 1678–1693. [Google Scholar] [CrossRef]
- Chen, L.; Wu, S.; Lu, H.; Huang, K.; Zhao, L. Numerical Simulation and Structural Optimization of the Inclined Oil/Water Separator. PLoS ONE 2015, 10, e0124095. [Google Scholar] [CrossRef] [PubMed] [Green Version]
- Mouketou, F.; Kolesnikov, A. Modelling and Simulation of Multiphase Flow Applicable to Processes in Oil and Gas Industry. Chem. Prod. Process Model. 2018, 14, 1–16. [Google Scholar] [CrossRef]
Figure 1.
(a) Schematic representation of the desalting system, including the inlet of the emulsion, the electric field set up by the upper and lower electrodes and the flow of the continuous and droplets. (b) Schematic representation of all forces acting on two droplets of water, one on top of the other and both being in between the two electrodes. Forces include the electrostatic attraction (
), drag (), gravity and buoyancy forces (indicated as together).

Figure 2.
Schematic of the whole desalter unit indicating (a) general grid of the whole desalter without showing the electrodes, (b) inlet of emulsion and water outlet and (c) oil outlet.
Figure 2.
Schematic of the whole desalter unit indicating (a) general grid of the whole desalter without showing the electrodes, (b) inlet of emulsion and water outlet and (c) oil outlet.


Figure 3.
Effect of the (a) water content , (b) oil viscosity (temperature), (c) size of the droplets (assuming two droplets of the same size), (d) electric field strength . In all cases, the rest of the operating conditions correspond to the standard conditions mentioned in Table 2.
Figure 3.
Effect of the (a) water content , (b) oil viscosity (temperature), (c) size of the droplets (assuming two droplets of the same size), (d) electric field strength . In all cases, the rest of the operating conditions correspond to the standard conditions mentioned in Table 2.

Figure 4.
Predicted collision time by the correlation Equation (11) versus collision time in logarithmic scale.
Figure 4.
Predicted collision time by the correlation Equation (11) versus collision time in logarithmic scale.

Figure 5.
Collision time as a function of the main process variables explored in this study: water content, droplet diameter, electric field intensity, oil viscosity.
Figure 5.
Collision time as a function of the main process variables explored in this study: water content, droplet diameter, electric field intensity, oil viscosity.

Figure 6.
Effect of different droplet sizes of 5, 10, 15 and 20 µm for (a) upper droplet of 20 µm, (b) upper droplet of 15 µm, (c) upper droplet of 10 µm and (d) upper droplet of 5 µm. (e) upper droplet of 1 µm.
Figure 6.
Effect of different droplet sizes of 5, 10, 15 and 20 µm for (a) upper droplet of 20 µm, (b) upper droplet of 15 µm, (c) upper droplet of 10 µm and (d) upper droplet of 5 µm. (e) upper droplet of 1 µm.


Figure 7.
Pareto chart of the single, double, triple and quadruple interaction effects on the collision time, t (s), the significance level is α = 0.05.
Figure 7.
Pareto chart of the single, double, triple and quadruple interaction effects on the collision time, t (s), the significance level is α = 0.05.

Figure 8.
Oil volume fraction for (a) with a constant electric field of 1 kV/cm and (b) without an electric field. The remaining variables and properties correspond to the standard conditions (see Table 1).
Figure 8.
Oil volume fraction for (a) with a constant electric field of 1 kV/cm and (b) without an electric field. The remaining variables and properties correspond to the standard conditions (see Table 1).


Table 1.
Summary of proposed models for desalting of crude oil.
| Reference | Correlation/Ranges | Notable Results |
|---|---|---|
| Bresciani et al. [7] Bresciani et al. [9] | tc = 3:57 lµo−2a−5 l0 = (1.613x−1/3 − 2) a E[0 0.1−3 kV/cm], x[0.02−0.08], a[1−100 µm] | Increase in operational variables promotes desalting |
| Abdul-Wahab et al. [10] | η1 = β0 + β1X1 + β2X2 + β3X3 + β4X4 + β5X5 + β12X1X2 + β13X1X3 + β14X1X4 + β15X1X5 + β23X2X3 + β24X2X4 + β25X2X5 + β34X3X4 + β35X3X5 + β45X4X5 + β1212X1X2(X1 − X2) + β1313X1X3(X1 − X3) + β1414X1X4(X1 − X4) + β1515X1X5(X1 − X5) + β2323X2X3(X2 − X3) + β2424X2X4(X2 − X4) + β2525X2X5(X2 − X5) + β3434X3X4(X3 − X4) + β3535X3X5(X3 − X5) + β123X1X2X3 η1 = 50.277 + 8.040X2 + 1.863X3 + 0.679X5 (R2 = 0.7) µo[0.017–0.048 Pa s], X1[55–70 °C], X2[1–3 min], X3[1–9 min], X4[1–15 mg/kg ], X5[1–10%] | Depends on settling time, mixing time and rate of dilution |
| Al-Otaibi et al. [2] | N/A | Increase in operational variables promotes desalting |
| Aryafard et al. [12] | No correlation Δp[137.895–206.843 Pa] E[1–2 kV/cm] x[0.03–0.06] | Decrease in pressure drop, increase in electric field and inlet rate of fresh water promote desalting |
| Mohammadi [20] | E[1.4–2.8 kV/cm], a[600 µm], µo[0.015 Pa s] | Strong electric field Small distance of separation of droplets |
| Kakhki et al. [14] | No correlation T[50 °C], x[0.03−0.05], f[50−400 Hz] | Increase in frequency promotes desalting |
| Alnaimat et al. [21] | No correlation, no ranges given | Low flow and charged particle velocities High electric and magnetic fields |
Operational variables: temperature, T; oil viscosity, µo; strength of electric field, E; volume fraction of water, x; collision time, tc; initial separation between droplets, l0; droplet size, a; temperature, X1, T; settling time, X2; mixing time, X3; chemical dosage, X4; dilution rate, X5; efficiency of salt separation, η1; pressure drop, Δp; current frequency, f; parameters used for calculating of salt separation, β0–β5, β12–β15, β23–β25, β34–β35, β45, β1212–β1515, β2323–β2525, β3434–β3535, β123.
Table 2.
Operating conditions of a case with standard conditions.
| Process Variable | Quantity |
|---|---|
| Electric field | 1 kV/cm |
| Lower droplet radius | 10 |
| Upper droplet radius | 10 |
| Water density | 943 kg/m3 |
| Oil density | 892 kg/m3 |
| Gravitational constant | 9.81 m/s2 |
| Oil viscosity | 0.044 Pa s |
| Water volume fraction | 0.07 |
| Oil dielectric constant | 2.2 ε0 |
Table 3.
Levels of the variables considered in this work to perform the process analysis.
| Process Variable | Quantity | Units |
|---|---|---|
| Water volume fraction | 0.03, 0.05, 0.07, 0.10, 0.12 | - |
| Electric field | 0.1, 0.5, 1, 2, 3 | kV/cm |
| Oil viscosity | 0.017, 0.027, 0.044, 0.071 | Pa s |
| Lower droplet and upper droplet let radii | 1, 5, 10, 15, 20 |
Table 4.
Operating parameters of an industrial desalting unit.
| Process Variable | Quantity |
|---|---|
| Length | 15.24 m |
| Internal diameter | 3.66 m |
| Water volume fraction | 0.10 |
| Emulsion flow at inlet | 0.126 m3/s |
| Electric field | 1 kV/cm |
| Oil viscosity | 0.044 Pa s |
| Interfacial tension | 4 mN/m |
Table 5.
Mean effect of the variables and their interactions.
| Term | |
|---|---|
| Droplet size, a | −29.250 ± 733.2 |
| Viscosity of oil, µo | 878.900 ± 733.2 |
| Electric field, E | −1463.200 ± 733.2 |
| Water content, x | −1436.200 ± 733.2 |
| Double interaction, aµo | −17.528 ± 733.2 |
| Double interaction, aE | 29.180 ± 733.2 |
| Double interaction, ax | 28.640 ± 733.2 |
| Double interaction, µoE | −877.000 ± 733.2 |
| Double interaction, µox | −860.800 ± 733.2 |
| Double interaction, Ex | 1433.100 ± 733.2 |
| Triple interaction, aµoE | 17.490 ± 733.2 |
| Triple interaction, aµox | 17.168 ± 733.2 |
| Triple interaction, aEx | −28.580 ± 733.2 |
| Triple interaction, µoEx | 858.9 ± 733.2 |
| Quadruple interaction, aµoEx | −17.130 ± 733.2 |
Correlation Equation (28) was cast into Matlab® to minimize the collision time using the optimization genetic algorithm. Bound values for each variables are x[7–12%], µo[0.017–0.071 Pa s], E [0.1–3 kV/cm], a[1–20 µm], and the optimal point obtained is x = 11.998%, E = 3 kV/cm, µo = 0.017 Pa s and 5 ≤ a ≤ 16, giving an optima with a value of tc around 0.013 s.
Publisher’s Note: MDPI stays neutral with regard to jurisdictional claims in published maps and institutional affiliations. |
© 2021 by the authors. Licensee MDPI, Basel, Switzerland. This article is an open access article distributed under the terms and conditions of the Creative Commons Attribution (CC BY) license (https://creativecommons.org/licenses/by/4.0/).
Share and Cite
MDPI and ACS Style
Ramirez-Argaez, M.A.; Abreú-López, D.; Gracia-Fadrique, J.; Dutta, A. Numerical Study of Electrostatic Desalting Process Based on Droplet Collision Time. Processes 2021, 9, 1226. https://0-doi-org.brum.beds.ac.uk/10.3390/pr9071226
AMA Style
Ramirez-Argaez MA, Abreú-López D, Gracia-Fadrique J, Dutta A. Numerical Study of Electrostatic Desalting Process Based on Droplet Collision Time. Processes. 2021; 9(7):1226. https://0-doi-org.brum.beds.ac.uk/10.3390/pr9071226
Chicago/Turabian StyleRamirez-Argaez, Marco A., Diego Abreú-López, Jesús Gracia-Fadrique, and Abhishek Dutta. 2021. "Numerical Study of Electrostatic Desalting Process Based on Droplet Collision Time" Processes 9, no. 7: 1226. https://0-doi-org.brum.beds.ac.uk/10.3390/pr9071226
Note that from the first issue of 2016, this journal uses article numbers instead of page numbers. See further details here.