Article

Analysis of the Energy Flow in a Municipal Wastewater Treatment Plant Based on a Supercritical Water Oxidation Reactor Coupled to a Gas Turbine

by
Fidel A. Mato
1,2,
Mar Peña
1,3,
Yoana García-Rodríguez
1,2,
María-Dolores Bermejo
1,2 and
Ángel Martín
1,2,*
1
Department of Chemical Engineering and Environmental Technology, University of Valladolid, 47002 Valladolid, Spain
2
BioEcoUva, Research Institute on Bioeconomy, University of Valladolid, 47002 Valladolid, Spain
3
Instituto de Procesos Sostenibles, University of Valladolid, 47002 Valladolid, Spain
*
Author to whom correspondence should be addressed.
Submission received: 8 June 2021 / Revised: 6 July 2021 / Accepted: 13 July 2021 / Published: 17 July 2021
(This article belongs to the Section Energy Systems)

Abstract

:
Biological municipal wastewater treatments lead to high sludge generation and long retention times, and the possibilities for recovery of the energy content of the input waste stream are very limited due to the low operating temperature. As an alternative, we propose a sequence of exclusively physicochemical, non-biological stages that avoid sludge production, while producing high-grade energy outflows favoring recovery, all in shorter times. Ultrafiltration and evaporation units provide a front-end concentration block, while a supercritical water oxidation reactor serves as the main treatment unit. A new approach for energy recovery from the effluent of the reactor is proposed, based on its injection in a gas turbine, which presents advantages over simpler direct utilization methods from operational and efficiency points of view. A process layout and a numerical simulation to assess this proposal have been developed. Results show that the model process, characterized with proven operating parameters, found a range of feasible solutions to the treatment problem with similar energy costs, at a fast speed, without sludge production, while co-generating the municipality’s average electricity consumption.

1. Introduction

1.1. Conventional Activated Sludge Process

The municipal wastewater treatment plants (WWTP) in prevailing use are composed of a set of physicochemical and biological processes that have been evolved over a long period of time, with the Conventional Activated Sludge (CAS) process at its core [1,2,3]. These technologies allow degrading organic matter in sewage, working at nearly ambient pressure and temperature. The main challenges nowadays include high energy consumption (1–3% of the total electrical energy consumption in developed countries [4]), generation of waste activated sludge [5], as well as large pieces of equipment and long retention times associated with huge treatment flows and slow kinetics [6].
The biological processes at the core of CAS perform the feat of carrying out highly complex biochemical transformations on an inflow of very diluted organic matter while working at close to ambient conditions. Operating in this way has significant advantages in terms of equipment simplicity and cost, and, especially for small and remote plants, can be considered a necessity. However, as gradients with respect to the environment are narrow, the material and energy outputs of these processes are also near environmental conditions (i.e., its exergy content approaches zero, with the exception of biogas, an anaerobic digestion product containing a remarkable chemical exergy), thus being of little value for energy recovery or production, even though the content of the influent wastewater is much higher than the energy requirements of the WWTP [7,8,9,10]. If the aim is to emphasize energy efficiency, biological processes operating close to ambient pressure and temperature offer few opportunities. A more appropriate route would be to concentrate pollutants as much as possible by using physicochemical methods and oxidize both the biodegradable and non-biodegradable compounds as fully as possible, since this would use their chemical energy to produce higher grade energy content effluents, thus facilitating energy recovery from this source.

1.2. Supercritical Water Oxidation

In SCWO, the reaction between an oxidant and pollutants is carried out in a medium of water at supercritical conditions. When going from ambient conditions towards the critical region, water significantly reduces its dielectric constant, density, thermal conductivity and ionic product, thus being characterized as a solvent that has been modified from polar (at ambient conditions) to non-polar [11], and therefore is able to dissolve hydrocarbons and other organic compounds, while inorganic salts become less soluble and tend to precipitate. In the supercritical region, water is also miscible with oxygen, thus eliminating the interfacial limitations of biphasic oxidation processes. As a whole, water under supercritical conditions offers a very favorable reaction medium for the oxidation of organic compounds [12,13,14]. Above all, the single phase reaction between the dissolved organic compounds and the oxidant promotes high conversion and very short reaction/residence times, allowing for a reduction in equipment size, which is critical in such severe conditions.

1.2.1. Implementation Challenges

Consequently, multiple attempts have been made so far to bring this process into practice at full commercial scale, especially for hazardous industrial wastes [15,16], but also for less dangerous residual wastes, such as those from the food industry and municipal wastewaters or sewage sludge, which are currently treated by conventional, biological processes [17,18]. The widespread use of SCWO faces some challenges: (1) severe pressure and temperature conditions—over 220 bar and between 400 and 700 °C—which in themselves make these processes costly in equipment and difficult to operate; (2) the corrosion caused by the severity of the environment in the aforesaid operating conditions, together with the presence of oxygen in the medium, poses serious problems [18] which make it compulsory to use special alloys, which are costly and not yet completely satisfactory; and (3) the plugging and clogging caused by inorganic salt deposition [19]. Plugging can also appear in the reactor’s upstream preheating and downstream recovery heat exchangers (HXs), which is the reason why some commercial facilities had to interrupt their activity [15,16].
The optimization of operating conditions, previous separation of insoluble salts and the design of specific reactors, such as the Transpiring Wall Reactor [20,21], Modar Reactor [22], Cooled Wall Reactor [12], Plug-Flow Inclined Reactor [23], and Tubular Reactors [24] are being used to address these practical issues. Another important challenge is the high energy flows in the SCWO process. The overall energy balance is favorable as the degradation reactions are exothermic, but the need to achieve high pressure and temperature conditions in order for the reactions to take place implies that important energy flows, both mechanical and thermal, must be implemented in order to bring medium and reactants to reaction conditions. Once these conditions have been reached, degradation reactions can proceed with fast kinetics and high conversions [25], releasing reaction enthalpy and frequently reaching autothermal (flame) operation [26].

1.2.2. Heat and Power Recovery

The challenge therefore lies in recovering energy from the products and the reaction medium. The most commonly used route for recovery in commercial plants is heat transfer, in order to heat the feed or other process streams. This practice is accompanied by the severe corrosion and plugging problems previously mentioned, aside from the customary problems found in high temperature and high pressure HXs.
As both mechanical and thermal flows are used, the operation’s self-consumption would be better served if the recovery method produced both power and heat. Some authors propose steam generation to feed a steam turbine [25,26,27], but shaft work recovery would be hindered by the loss of efficiency linked to the thermal gradient in steam generation, the high operating pressure in HXs and other drawbacks, as corrosion [28]. Process operability would also suffer from equipment thermal inertia. Another option is to directly use the reactor effluent to feed a turbine, but unfortunately supercritical conditions make direct shaft work recovery from the outflow difficult. In particular, high pressure, which in principle could be considered a high-grade energy source, is, in practice, a hindrance, because the large pressure changes required for high thermodynamic efficiency are linked to significant temperature changes, thus inherently and rapidly cooling the medium. If the water content is high, as in SCWO operations, condensation or even freezing can occur. Additionally, the development costs of dedicated expanders can be very high.
As an alternative to these problematic energy recovery schemes, a theoretical proposal for the simultaneous heat and power recovery from clean SCWO outflows suggests that it can be directly injected into the hot gas path of a commercial gas turbine (GT) [29]. This GT injection operation is a field-proven technology that is widely used with the aim of reducing NOx emissions and augmenting power production by increased exhaust flue gases (FG) mass flowrate, commonly known as Steam Injected Gas Turbine (STIG). Concerning energy recovery from SCWO reactors, this operational proposal seeks to avoid excessive cooling of the outflow through expansion while increasing the expanded mass flowrate and power produced, and taking advantage of high pressure for injecting without having to pass through the compression stage of the GT. This will be the shaftwork recovery approach adopted in this work.

1.3. Aims and Objectives

Based on these considerations, this work proposes a combination of individually well-tested, purely physicochemical operations that jointly form a non-biological treatment process for a specific, representative medium-size municipal sewage plant. The process is powered by a GT-based Combined Heat and Power (CHP) system. The aims are to assess the process feasibility and the synergies derived from process integration, in particular concerning energy efficiency issues. The specific objectives are (1) to find sets of operating conditions that enable the process to treat the influent to specifications at a similar energy cost as those of the CAS processes, while not generating residual sludge, and in shorter residence times, and (2) to perform an exploration of the influence of equipment parameters on process behavior. A process description follows, while a specific description of the calculation methods used is given below in Section 3, “modeling methodology”.

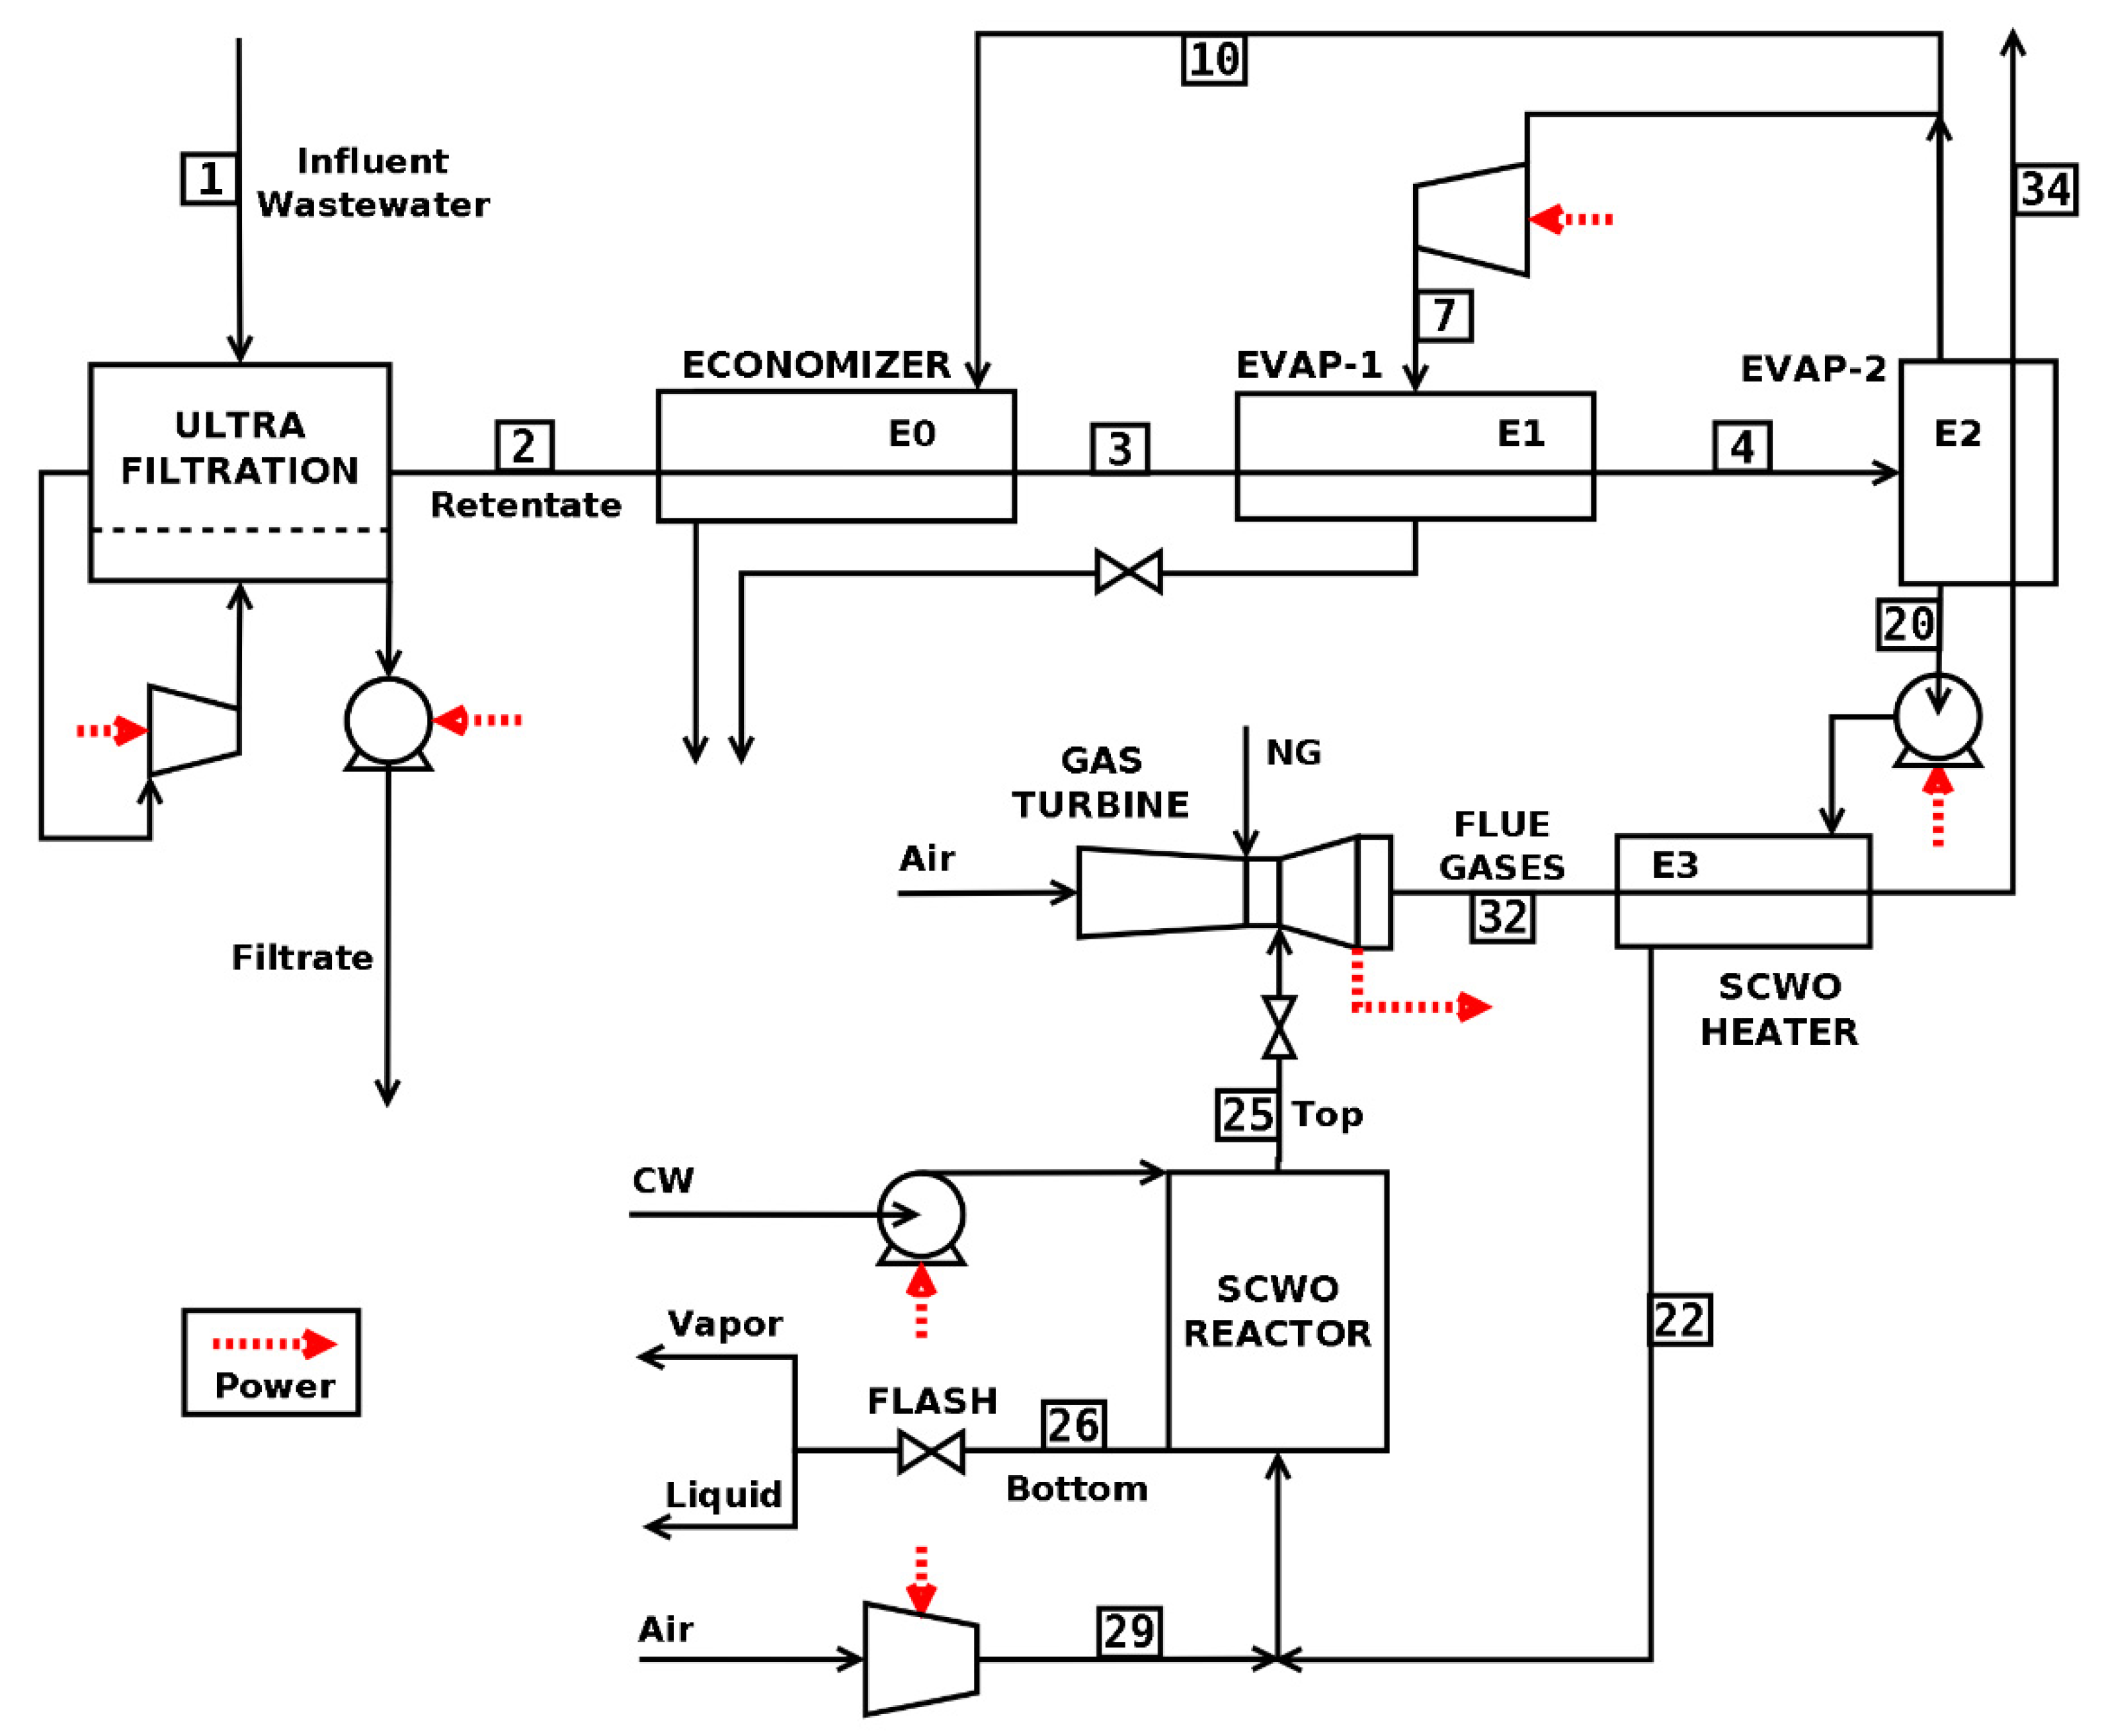
2. Process Description

A concentration block and a reaction block, both closely coupled to a GT-based CHP system, make up the proposed process (Figure 1). Two physical separation operations, ultrafiltration (UF) and evaporation, constitute the concentration part of the plant, while a SCWO reactor is the main treatment unit. All these operations are developed nowadays at a commercial or semi-commercial level, with numerous installations working in the field.
After ultrafiltration concentration, and with the particulate COD in the retentate in addition to the soluble COD from the liquid retentate, preheating and evaporation is carried out in order to reach at least the minimum concentration needed to sustain the autothermal regime in the downstream SCWO reactor. This operation is sequentially carried out in a recuperative preheater, or economizer (E0), a recuperative partial evaporator (E1) and a final evaporator (E2) working with FG from GT. Heat recovery takes place in E0 due to the heat content in the part of the steam produced at ambient pressure, and in E1 of the rest of this steam, which is compressed to increase its condensation temperature. Depending on the conditions and the compressed steam fraction, up to 90% of the total preheating and evaporation duties can be recovered in E0 and E1. Besides, the evaporation process can induce a thermal pretreatment effect in the COD, as well as significantly reduce its viscosity [24], therefore reducing power requirements, and problems when pumping to high pressure afterwards.
Concentrated wastewater is then compressed to 230 bar, pre-heated with FG (in E3), mixed with compressed air and fed to a SCWO Cooled Wall reactor [12]. This unit also receives a clean, ambient temperature water stream (CW) intended to protect the inner reactor walls, as well as to dissolve and carry away precipitated salts and ashes in a liquid aqueous solution stream that leaves the reactor at the bottom. Inside the reactor, the flame oxidation reaction takes place, producing a clean top outflow stream at a high temperature, composed of reaction products (CO2, H2O), nitrogen, excess oxygen, and water. The SCWO bottom outflow must be brought to ambient atmospheric pressure, and this is done in a back pressure flash valve that produces clean steam, and concentrates salts and ashes in the final liquid stream. The SCWO top outflow stream passes through a backpressure valve and is immediately injected into the combustion chamber of a commercial GT, where heat and power are recovered from it.
Once injected in the turbine at high pressure, the reactor’s top outflow and the POCs from NG mix and expand until they are exhausted around ambient pressure, producing power along the way and leaving a high temperature FG stream of around 500 °C, suitable for subsequent heat recovery at ambient pressure. Although the injected stream temperature is high (around 700 °C before a backpressure valve expansion to GT pressure), POCs, which reach temperatures of around 1100–1700 °C after combustion, will cool down with this mixing, thus reducing the power production efficiency but increasing the expanded mass flowrate. A side benefit of this cooling is the reduced production of NOx and other combustion-induced pollutants. A duct burner at the GT exhaust outlet allows for the use of supplemental firing, if required [30], limited by the oxygen content in the turbine exhaust, and heating up to 900 °C. Supplemental firing was not necessary in any of the cases presented below in the Results section.
This model process configuration has been intentionally chosen to be flexible because the aim of this work is not optimization, but a wide range exploration of operating conditions in order to show possibilities and synergies. Unit operation choices can be considered conservative, and could certainly be improved by other, more efficient processes, but they are thoroughly field-proven. This approach allows a direct assessment of energy consumption options, which lie around the heat-to-power ratio (HPR) usually found in commercial CHP systems. As a thermally driven operation, evaporation offers a way to use energy recovered as heat from the CHP system. The split steam compression heat recovery system allows energy consumption to be modulated between power and heat: as the split fraction to be compressed (fSPT) increases, more heat can be recovered in E1, reducing process heat needs (in E2) while the power has to be increased.

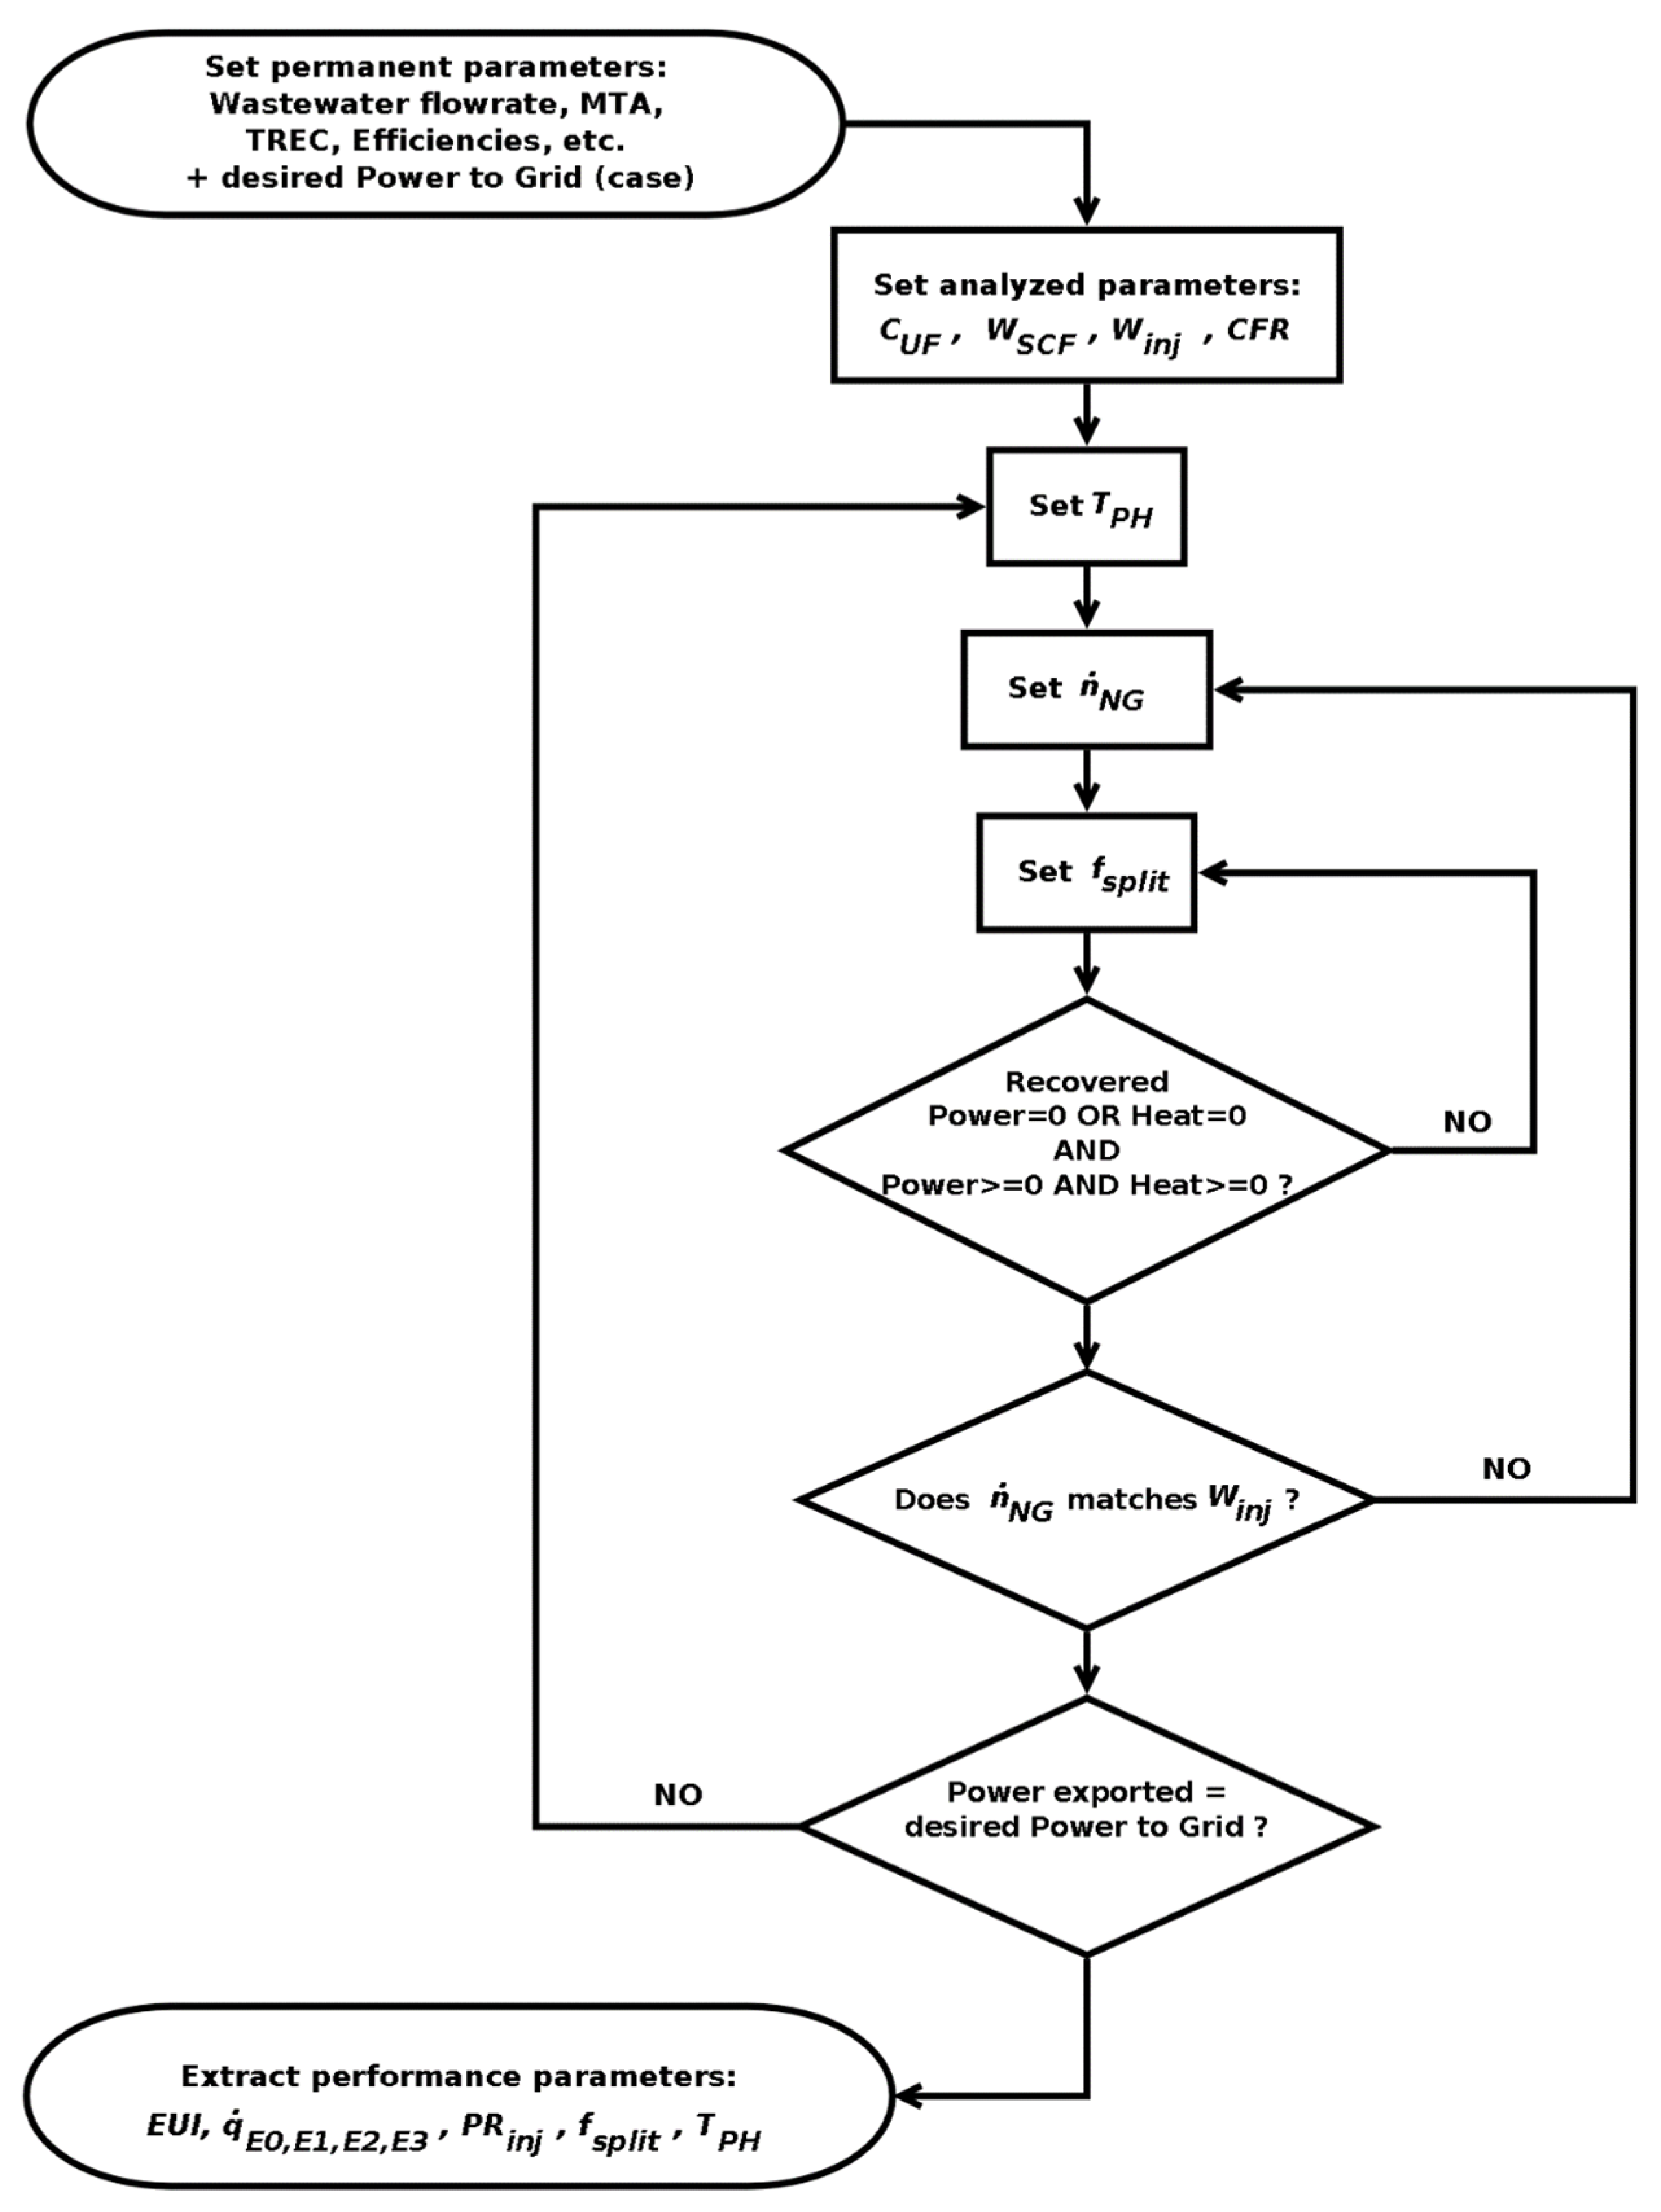
3. Modeling Methodology

A model was developed to calculate steady state process behavior from sets of given operating conditions, with Figure 2 describing the calculation sequence as it was implemented in custom code in MatLab/Octave/Python. This custom-developed code was used due to flowsheeting software convergence issues in tightly integrated cyclical processes (see Figure 1 for a visualization of backward dependences), but Aspen® was used to check some code results and to dimension the resulting HXs. The use of custom code also facilitated thorough local and global checks of the mass and energy conservation principles.
The steps in the problem resolution sequence were:
  • Establish permanent, design basis parameters: wastewater inlet flowrate and conditions, equipment efficiencies, minimum temperature approach (MTA) for HXs final FG recovery temperature (TREC), NG energy to electricity efficiencies (εNG, εw) and other equipment characteristics.
  • Establish a set of specific values for the analyzed equipment parameters: final UF COD concentration (CUF), SCWO Feed COD mass fraction (WSCF), injection mass percentage over GT admission air (WINJ) and SCWO Cooling Water (CW) to SCWO feed mass flowrates ratio (CFR).
  • Converge solution values for final E3 pre-heating temperature (TPH), NG consumption molar flowrate (nNG) and fraction of evaporate to compressor (fSPT) that solve steady state mass and energy balances for the analyzed parameters set while meeting constraints.
  • For the resulting solution calculate process heat and power needs and performance assessment parameters: % power needs recovered by injection (PRINJ), NG consumption (nNG), Electrical energy Use Intensity after power export to grid (EUIPEG), residual thermal flows (qRES), etc.

3.1. Base Wastewater Treatment Plant (WWTP)

The specific WWTP that has served as a base problem is The Camino Viejo de Simancas WWTP, located at Valladolid (Spain). This facility was built in 1999, designed for 570,000 eq-hab, and currently treats a flow of around 45,000,000 m3/year, corresponding to a polluting load of more than 635,000 eq-hab in terms of BOD5. Thus, it can be considered as a representative example of a medium-size plant (compared, for example, with the biggest sewage treatment plant of Spain, EDAR Sur of Madrid, which serves 3,000,000 eq-hab [31]). It is an A2O process used for removal of biological phosphorus and nitrate. In the A2O process, the return activated sludge recirculation, which contains nitrate, is directed to the anaerobic zone and the internal recirculation is carried out from the aerobic zone to the anoxic zone. On average (in 2019), this facility treats a 123,193 m3/d wastewater inflow from the city of Valladolid and its surrounding population, with a 950 mg/L Total Solid concentration and 547 mgO2 COD/L mean value of COD, 69% particulate and 31% soluble. Inert (salts and ashes) concentration is 15 mg/L particulate and 5 mg/L soluble. Table 1 shows the detailed characteristics of the municipal wastewater.
With regard to the energy content of the pollutants, an equivalence can be established between wastewater energy content and its COD, a parameter that is easy to measure and follow during wastewater treatment [8]. In this work we adopt the value of 13.88 kJ/gO2 COD for raw wastewater [8], derived from stoichiometry and the heat of combustion of methane, which is in good agreement with the experimental values from [7,32,33], and could be qualified as conservative. The WWTP average total annual energy consumption (in 2018–2019) was 15,119,164 kWh, of which 3,447,077 kWh was used in pumping, and 3,664,328 kWh in the aeration zone. The average total electrical energy use intensity (EUI) accounted for 0.3362 kWh/m3, which lies low in the typical energy demand of a CAS system, i.e., 0.33–0.60 kWh/m3 [4,8]. This consumption is a substantial part of the total of the Valladolid municipality, whose average total for other uses (non WWTP) was 4073 kW.

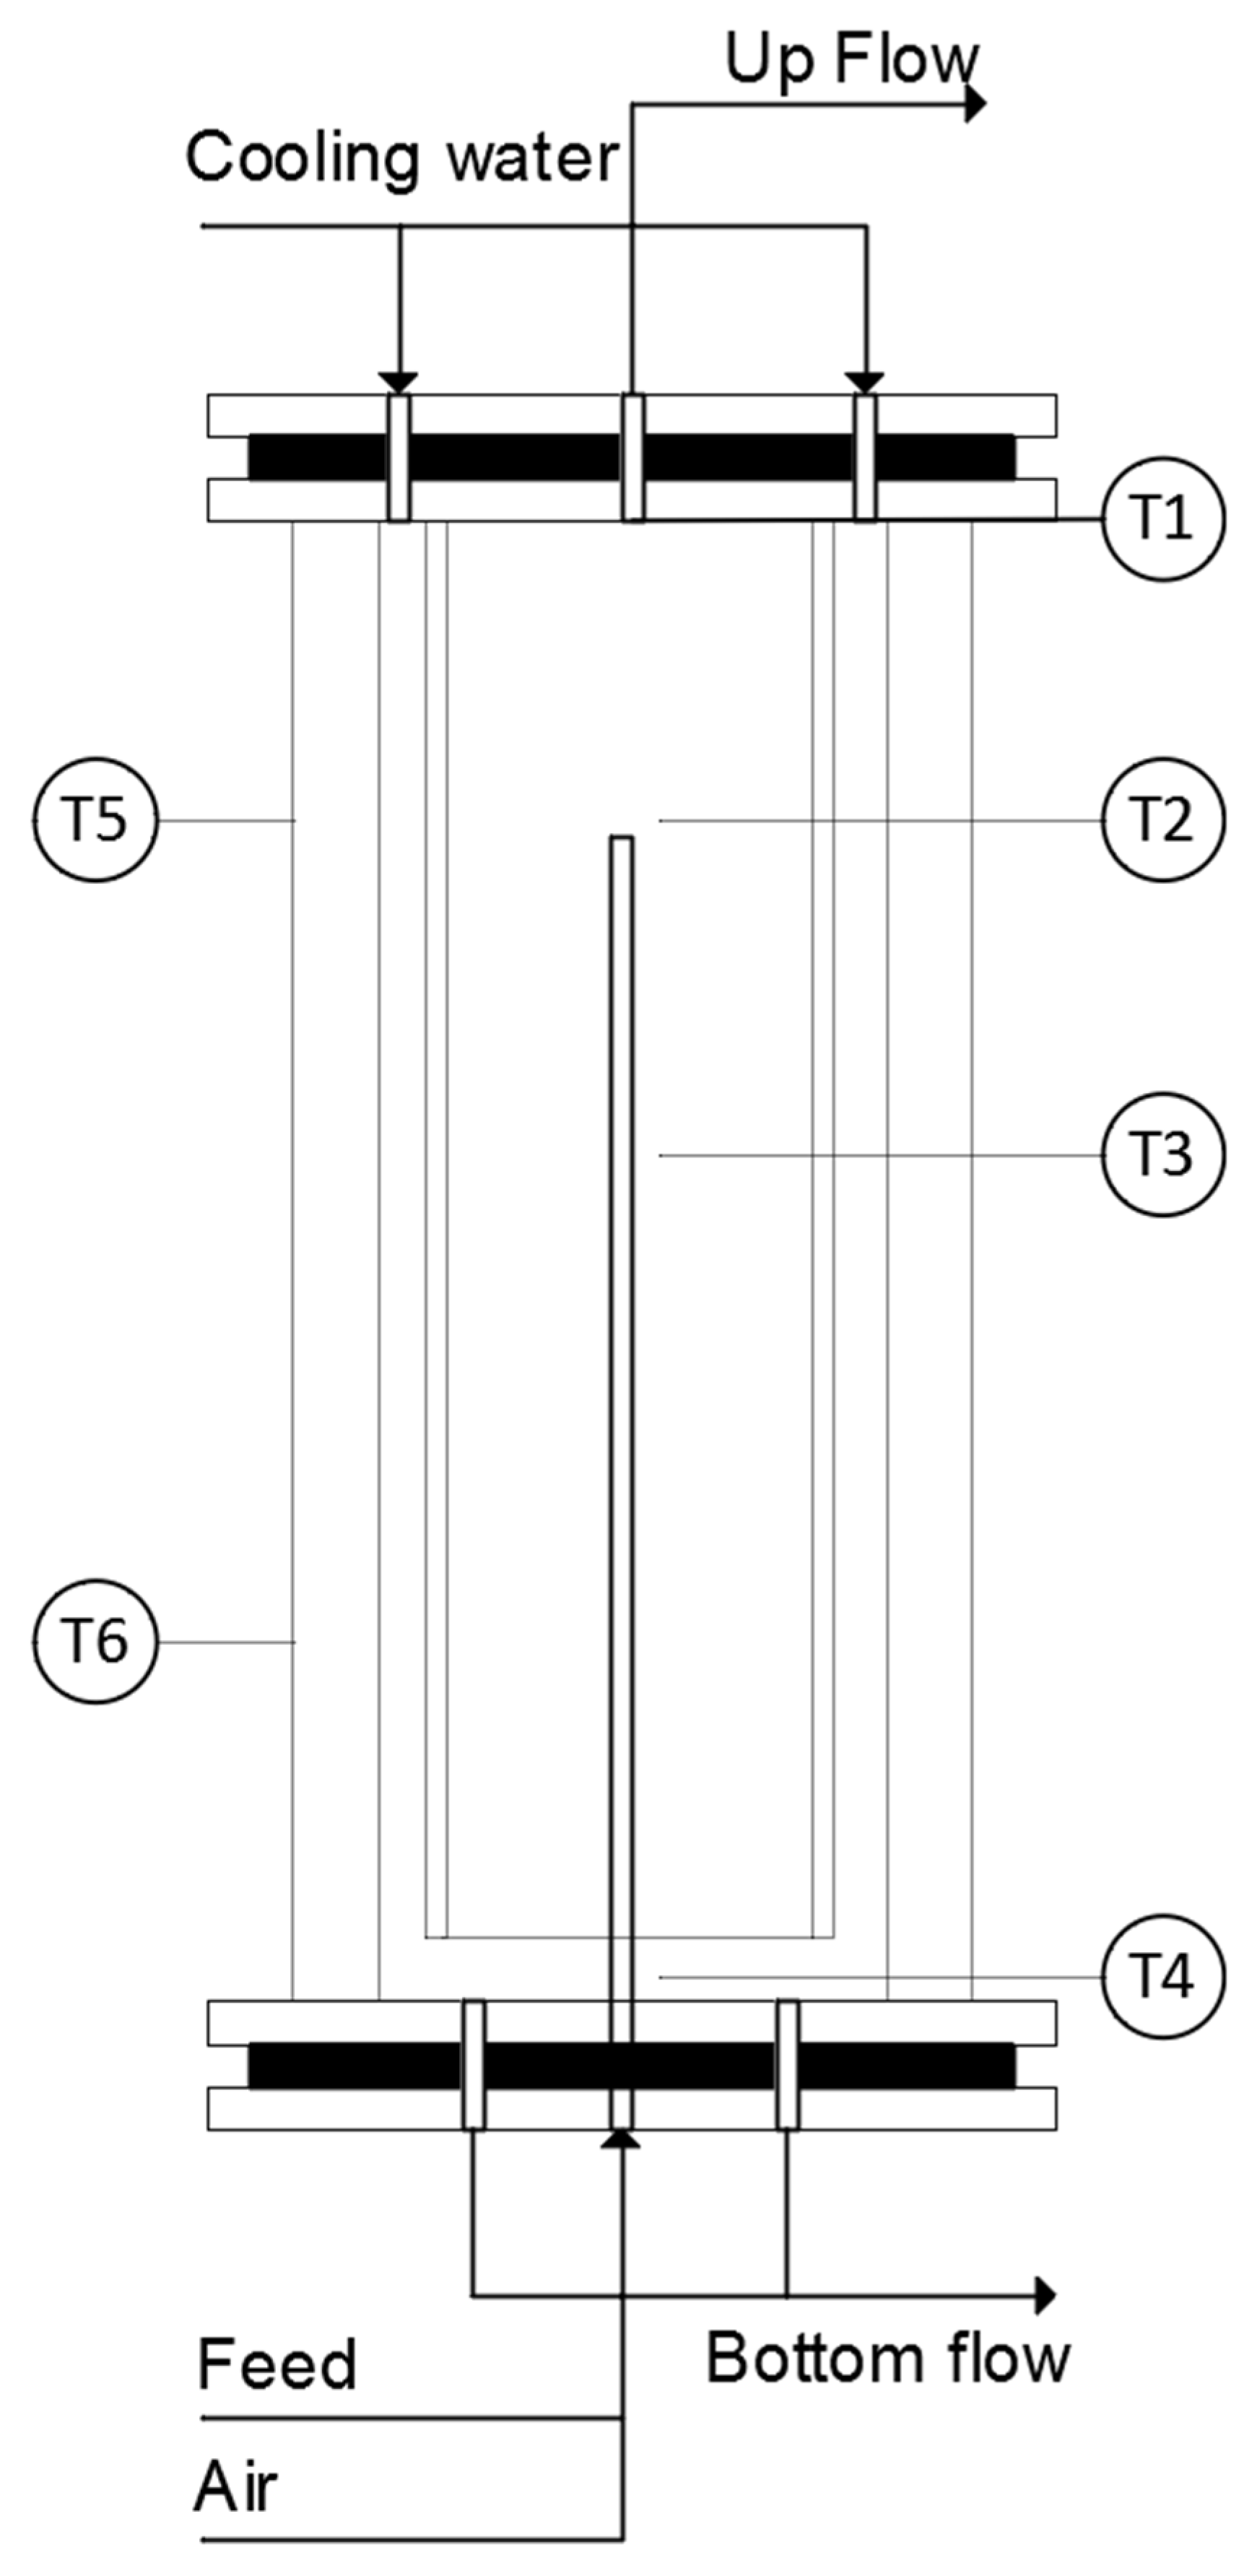
3.2. Supercritical Water Oxidation Reactor

Detailed modeling of SCWO reactors requires a major effort [34], so we have considered a lumped parameter model, restricted to experimental results suited to our purposes, based on experiments carried out at the SCWO facility installed at the University of Valladolid [14,25]. This is an installation that works with a feed flowrate of 22.5 L/h and air supplied by a four-stage compressor delivering a maximum flowrate of 36 kg/h as an oxidant. The reactor is an AISI 316 stainless steel pressure vessel that can withstand a maximum pressure of 300 bar and a maximum wall temperature of 400 °C, containing a reaction chamber made of Ni-alloy 625 where the temperature can be as high as 700 °C. A schematic representation of this Cooled Wall Reactor is shown in Figure 3.
In this reactor, a clean, high temperature reaction product stream leaves upwards from the hydrothermal flame region at the top of the vessel, while a wall protector CW stream leaves from the bottom at colder, subcritical conditions, carrying dissolved salts and ashes. According to previous research, SCWO reactors need a minimum combustion heat content equivalent to 930 kJ/kg in their feed in order to proceed in an autothermal, sustained regime [35]. The wastewater energy content assumed in the present work was 13.88 kJ/gO2 COD, which implies that a minimum COD of 67 gO2 COD/kg, or the equivalent 11.66% W/W (weight percent) pollutants concentration was needed in the SCWO reactor feed to sustain an autothermal process, but higher contents, in the order of 3000 kJ/kg, were explored in different case studies, as part of the behavior dependence of the process on different concentration (up to 25% W/W) and reactor parameters. As raw wastewater COD is heavily diluted (0.55 gO2 COD/L in the base WWTP), concentration is needed, and is carried out by UF and evaporation.
Numerical modeling was constrained to experimental results concerning temperatures, conversion, CW/Feed mass flowrates ratio (CFR), residence time and outflow compositions: the pressure was set at a constant of 230 bar(a) in all cases, top and bottom outflow temperatures were set at 700 and 300 °C, total conversion at 5% excess air oxygen over the stoichiometric value, and CFR at 5.2/13.5 kg CW/kg Feed. In accordance with the experimental results, a non-appreciable presence of light gases in the bottom stream and of inerts (<30 ppm salts and ashes) in the top stream was also assumed. Only CO2, N2, O2 and H2O were considered as significant in the top outflow, as in the cited [14] statement of a ppm order presence of other N2 derived compounds in reaction products. For the same reasons, no reaction apart from COD combustion was taken into account when calculating product composition and the heat of the reaction, considering other reaction paths of much lesser influence in the energy balances.
The wastewater from the city of Valladolid is a medium-load water, with average COD values of around 0.55 gO2 COD/L. The elemental composition, [C, H, N, O, S] of this wastewater, whether primary, secondary, or even anaerobic sludge is involved can vary, depending on authors, between 35% and 41% C, between 4.9% and 6% H, between 3.6% and 6.8% N, between 14.5% and 31.7% O2, and between 0% and 0.7% S, respectively. In this sense, and in order to be able to use a stoichiometric equation that represents the composition of the organic matter of the wastewater, the most characteristic and common one used in this type of process, i.e., the one corresponding to the secondary sludge, C5/H7/O2/N, has been used to perform stoichiometric calculations in the SCWO reactor and determine clean effluent composition.
A major issue regarding the modeling of reactor energy exchanges was the lack, to the best of our knowledge, of experimental values for output flowrates, both in the reference research literature and in other research work on similar reactors. Although flow compositions and flowrate ratios are precisely determined, flowrates had not been measured or made explicit. Therefore, the top/bottom stream split in the SCWO reactor had to be calculated using an energy balance constrained to the experimental results related to temperatures, CFR, and outflow compositions. Given the inlet stream’s conditions and flowrate, constraining outflows to satisfy experimental conditions as well as the energy balance, and assuming that light gases came out in the top stream and inerts came out in the bottom stream, the water flowrate distribution between the top and bottom could be derived, mass balances completed, and outlet streams completely determined. This approach is only strictly correct for thermodynamic equilibrium, and transfer dynamics or spatial distribution issues [36] may have detracted from its correctness, but considering the experimental residence times (20–30 s) and with steady-state operation energy analysis purposes, it can be considered acceptable.

3.3. Ultrafiltration
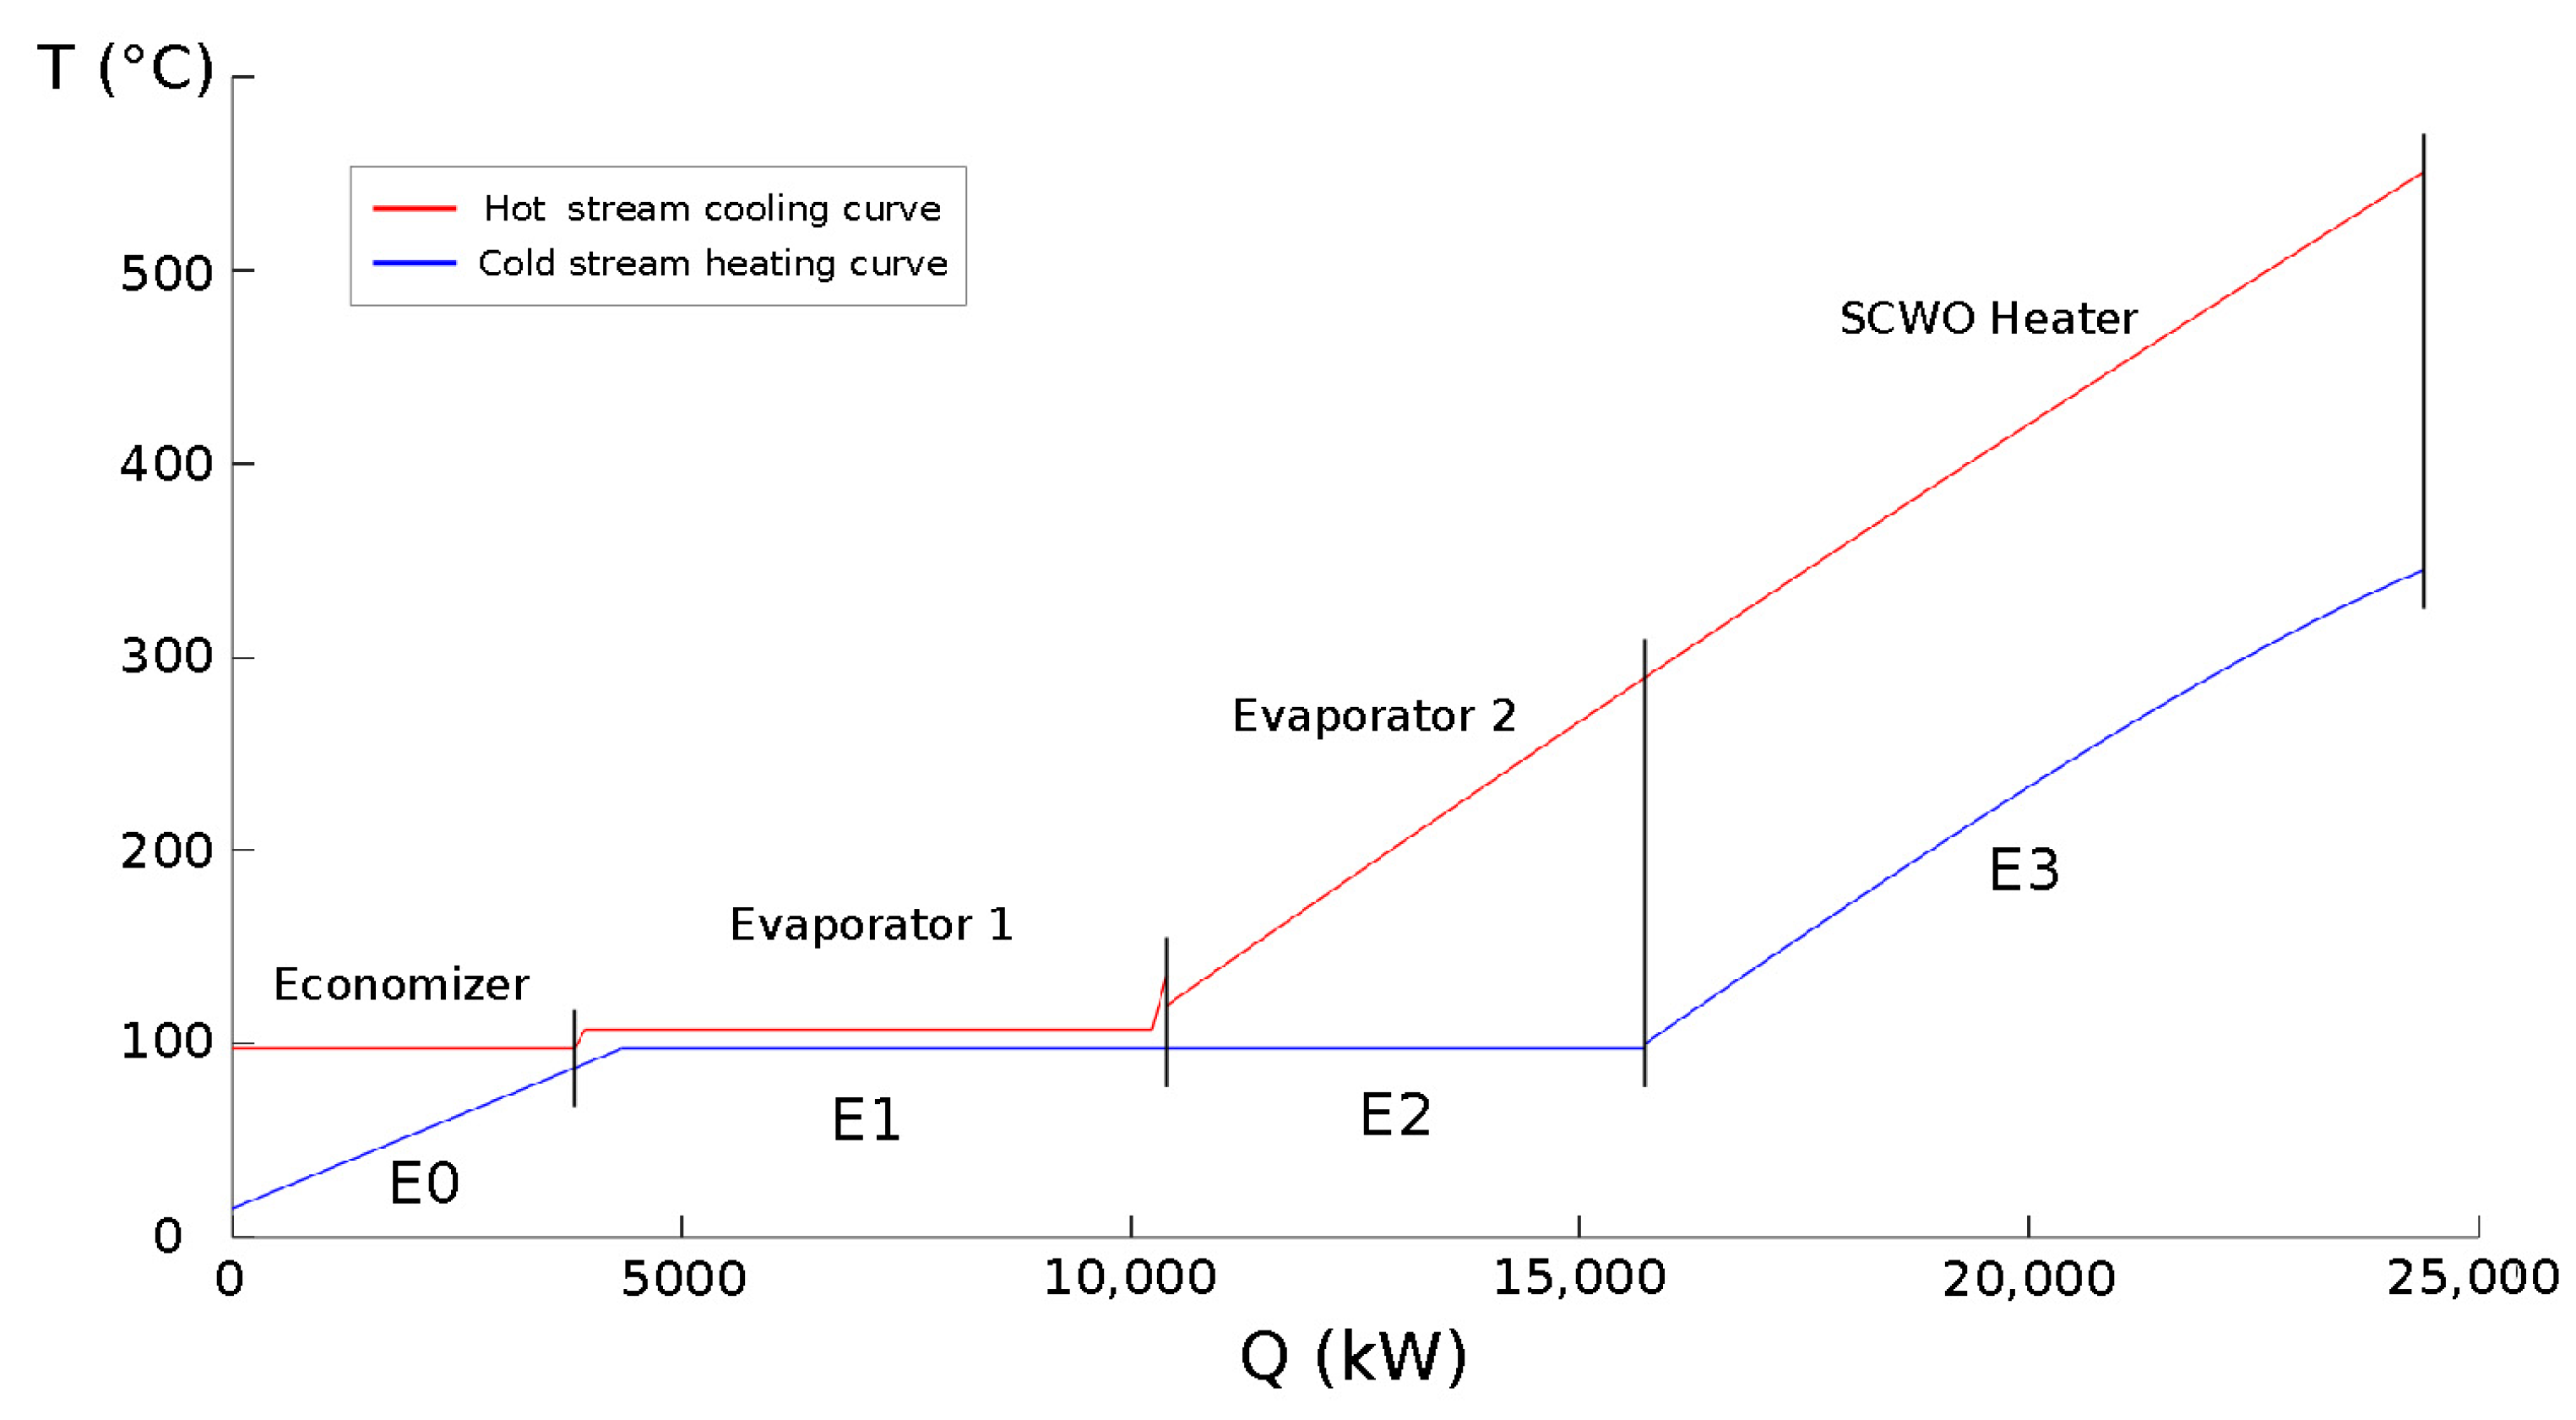
Current, state-of-the-art UF membranes can take the COD of raw wastewater to 20–55 gO2 COD/L (2–5.5%) in the retentate [37]. Specific values of 46,882 gO2 COD/L [38] and between 19,000 and 54,000 gO2 COD/L [39] have been reported recently by using a hollow fiber membrane module with a nominal pore size of 0.04 microns, including all particulate COD. Some drawbacks of this technology include the high cost of equipment, and the aeration required to clean the membrane surface in order to avoid clogging problems. This operation was used as front-end concentration as it could remove most of the water (99.65% for 40 and 99.82%W/W for 50 gO2 COD/L) that needed to be separated in order to achieve the concentration of the SCWO inlet specification, resulting in a significant saving of downstream thermal energy expenditure at the price of the power required for pumping through membranes for cleaning by aeration compression and reducing fouling by means of short filtering and counter-filtering cycles and air injection. Based on the usual commercial specifications and field installations data, filtration power needs were calculated with a 0.35 bar membrane head loss and ηs = 0.85 isentropic efficiency in filtration pumps, and aeration head loss was taken at 3 m of water depth plus 0.250 bar diffusor loss, which accounted for 9.55 kW/(m3/s air flowrate), assuming ηs = 0.85 in aeration blowers.

3.4. Evaporation

Evaporation is one of the most frequently used up-concentration methods, with multiple device and equipment design options and well-known operational issues. An MTA was set for each HX and allowable duties were calculated for a given fSPT and stream conditions by applying the Pinch Analysis problem table algorithm [40] in an iterative resolution until the MTA constraint met convergence. Sets of sub-streams (number of H-T points) large enough to assure an accurate enthalpy-temperature relation were fed to the algorithm.
One major issue concerning the accuracy of this calculation was the lack of experimental data, as far as we know, on the boiling-point elevation of concentrated pollutant solutions. To prevent the effects of this uncertainty on process feasibility assessment an MTA of 10 °C in the recuperative Economizer (E0) and first Evaporator (E1) was used, which is larger than usual in HX used for evaporating and condensing clean water. This temperature difference is wide enough taking into account the fact that the latter part of the operation takes place in thermal contact with a compressed, hotter steam and that the final more concentrated solution part of the total evaporation is performed in thermal contact with FG in E2, with a much larger temperature gradient. Plots showing hot and cold T vs. duty curves for E0, E1, and E2 plus E3 HXs are presented below in Figure 5. It should be noted that these are not strictly global Composite Curves but juxtapositions of individual HX curves.
Although a reduced proportion of the WWTP inflow has to be evaporated after UF (0.36% for 40, 0.18% for 50 gO2 COD/L UF concentration) the water mass flowrate required for evaporation remained significant and thermal duties were high, as were heat transfer areas (HTAs) of HXs. It is worth noting that, although the temperature of the heat source (FG) at the final part of the evaporation can be high (200–300 °C), the organic matter in solution/suspension is not subjected to it but to much lower values: those of boiling water plus the boiling-point rise, responding to the thermodynamic behavior of a concentrated liquid phase and to the temperature gradient that drives the heat transfer. Due to these reasons and to the short retention times (in the order of 1.5 min), only a minor part of the organic matter would be present in the evaporate that is subsequently condensed and greatly diluted when rejoining with the UF filtrate/permeate, although this behavior should be experimentally verified prior to a specific design.

3.5. Gas Turbine (GT) and Combined Heat and Power (CHP)

GT operating parameters were taken from the lowest range of CHP setups (3–7 MWe) in the U.S, EPA (Environmental Protection Agency) Catalogue of CHP Technology [36]. The specific values were: compression ratio = 30, air to fuel ratio (AFR) = 3.5, ηs = 0.85 for the compressor and ηs = 0.90 for the expander. Fuel was assumed to be pure methane for stoichiometric calculations, but a representative real value of 829.10 kJ/mol was used as its Lower Heating Value (LHVNG, ISO). The maximum temperature after combustion was taken as the adiabatic flame temperature, which is not accurate in terms of temperature due to decomposition and radical formation reactions, but provides correct energy changes. Upper SCWO injection was set at 20%W/W over GT admission air, based on reports of up to 23%W/W as the allowed limit [41,42,43]. Injection stream conditions were calculated after isenthalpic expansion in the back pressure valve, and late isenthalpic mixing with POCs was used at the entrance to the GT expander conditions. GT outlet pressure was set at 0.9 bar(g) (relative) to allow for a gradient across HXs. The maximum allowable duties for a given MTA in CHP HXs (E2, E3) were calculated using the Problem Table algorithm [40]. MTA was assumed to be 20 °C in E2 and 30 °C in E3, with FG being cooled down to a final temperature of 120 °C. The entire GT calculation was performed twice, with and without injection, to quantify recovery.
In order to fairly compare consumption with other WWTPs, a common performance indicator in the field, the Electrical energy Use Intensity (EUI, kWh/m3) after power export to grid (EUIPEG), was calculated to represent the electricity that could be generated from the total NG consumption molar flowrate (nNG) (with εNG = 35% efficiency, final to consumer efficiency, defined as the electricity produced per unit thermal contribution of NG, from its LHVNG), and is taken as an U.S. EIA 2019 average of electricity production facilities using NG as a fuel, minus the electricity that could be generated (with εGEN = 0.90% efficiency, final to consumer, generation, and distribution) from excess, exported to grid power:
E U I P E G   =   ( n ˙ N G L H V N G ε N G + w ˙ n e t ε G E N ) V ˙ W W I N ,
where V ˙ W W I N   is the wastewater volumetric flowrate and w ˙ n e t = w ˙ p r o c + w ˙ W W T P + w ˙ G T i n j   is the net balance of all power process needs (>0, pumps, compressors, etc.) plus the current WWTP pretreatments (except height pumping) electricity consumption (>0) and the power recovered by GT injection (<0); this net balance can be positive or negative. This indicator assumes the same cost of electricity consumed and exported.

3.6. Thermodynamic Properties and Characterization of Processes
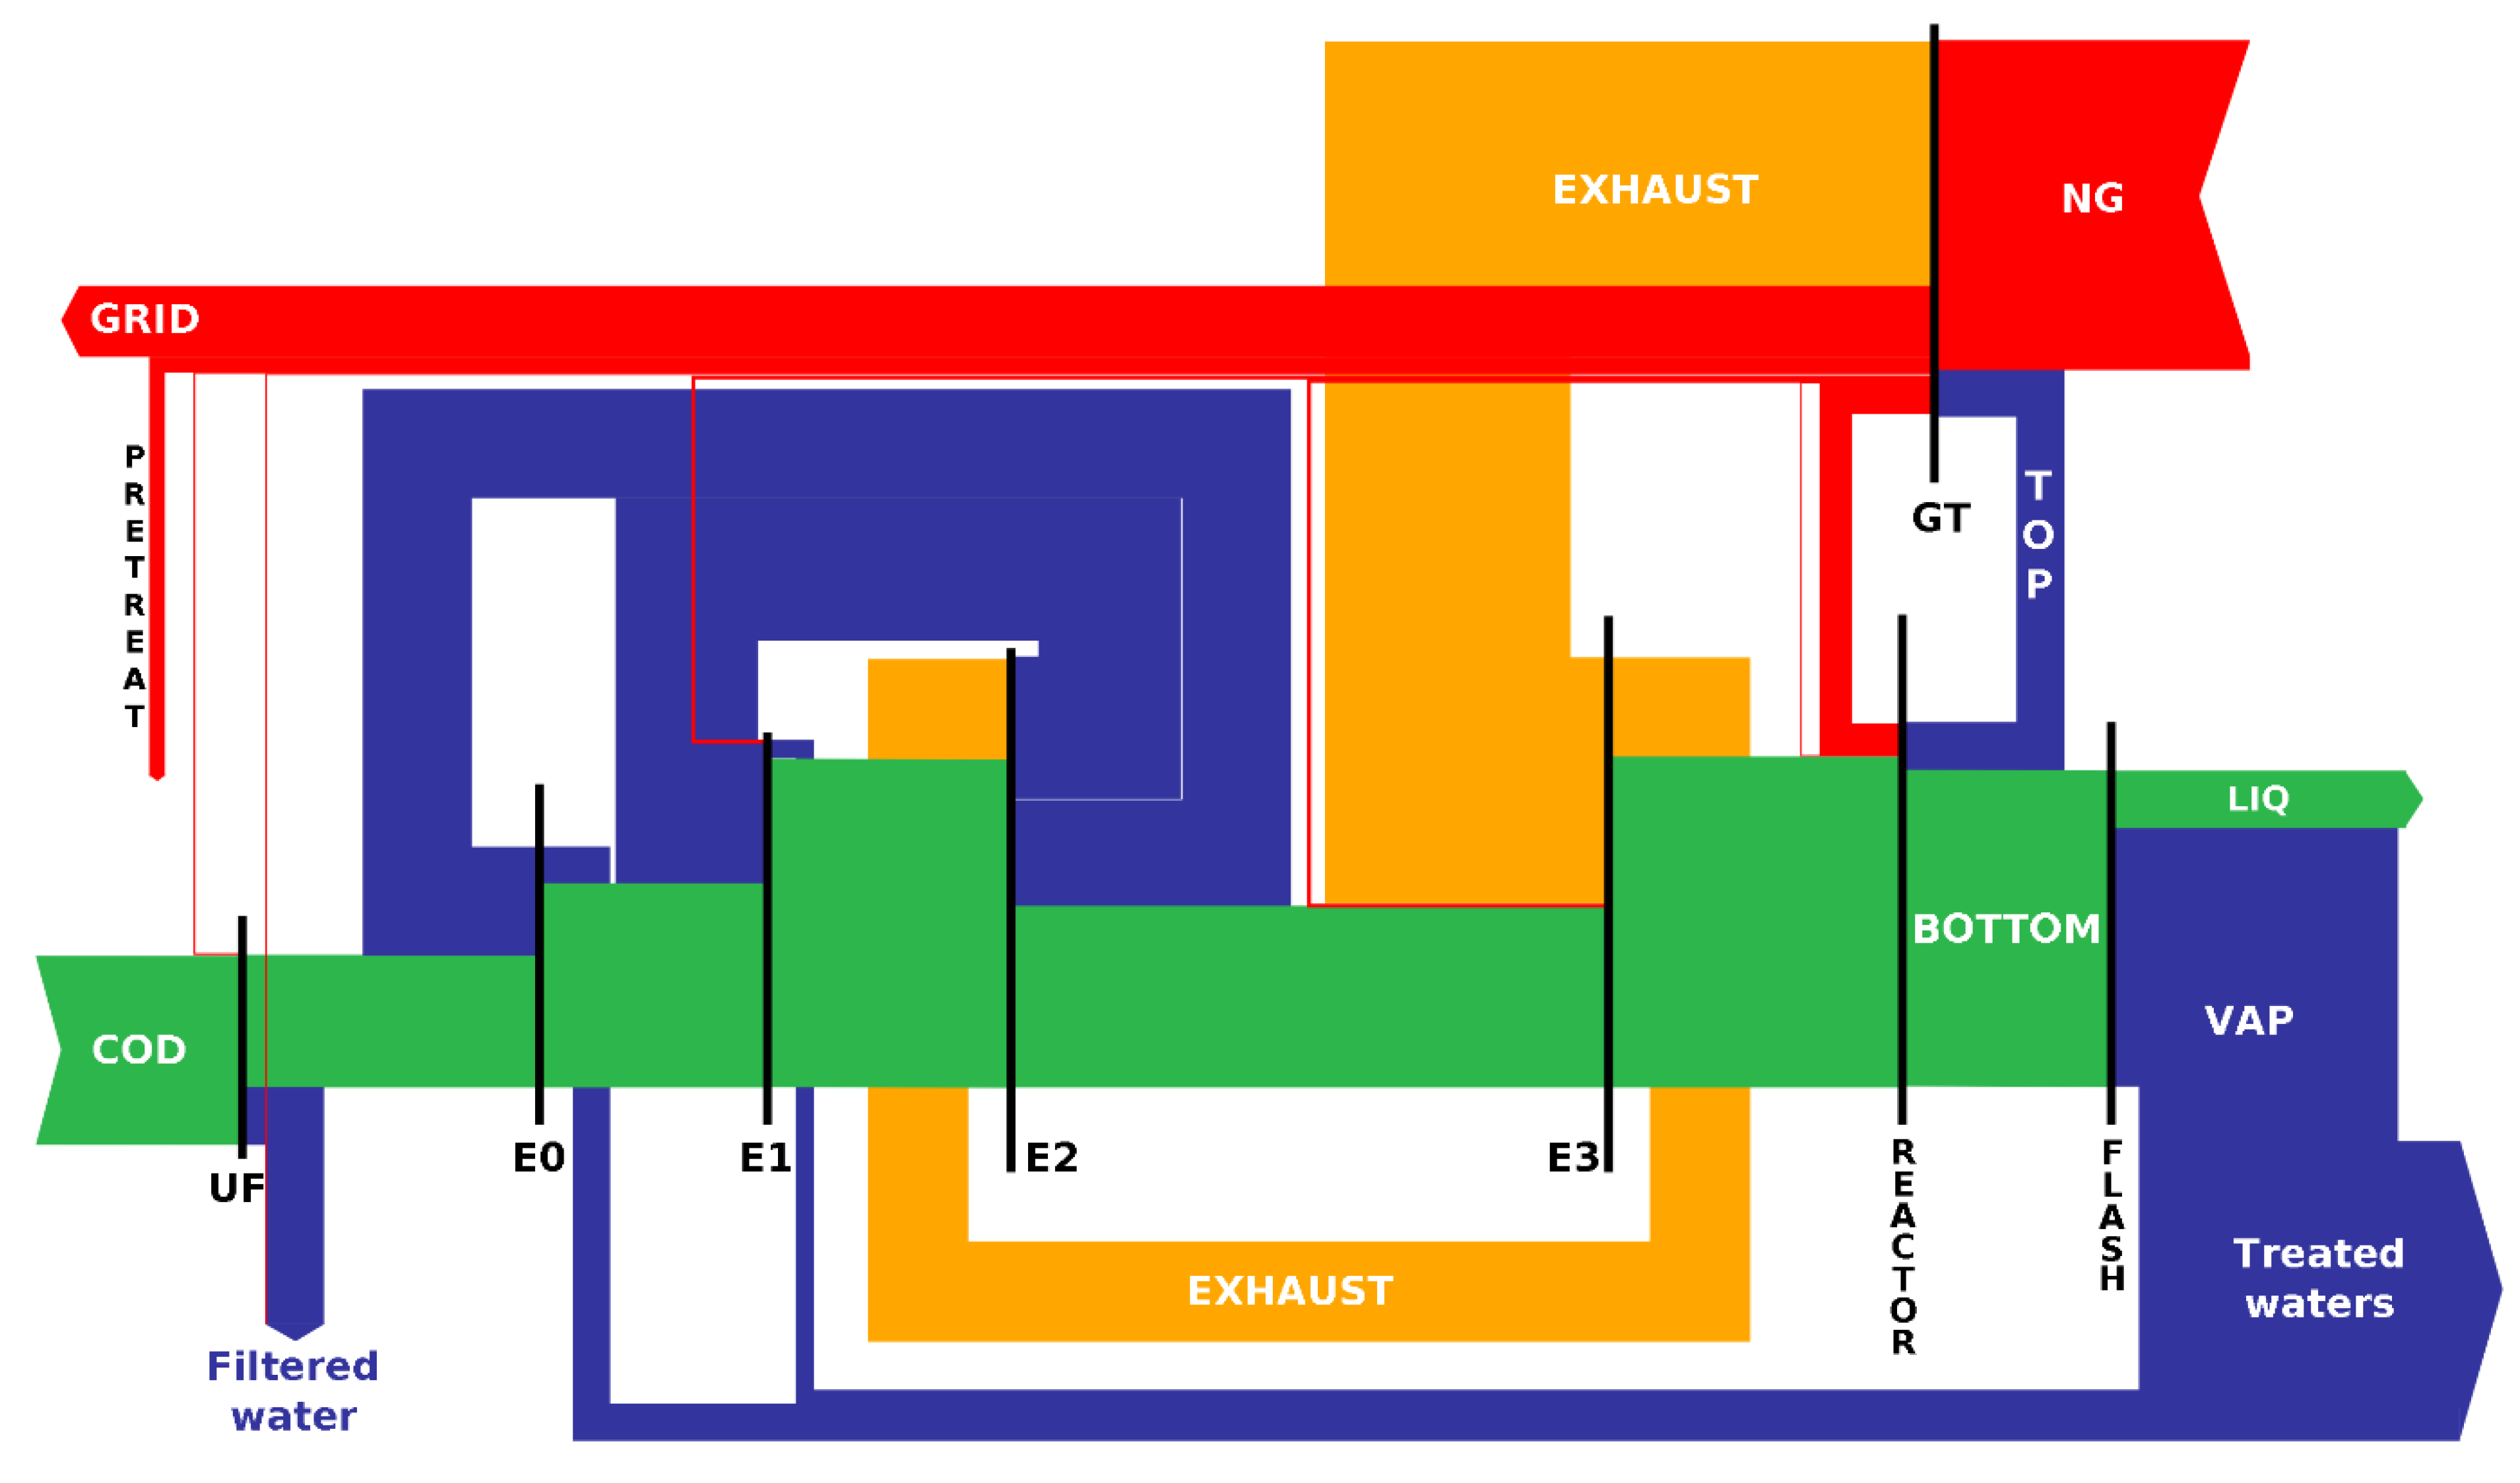
For clean water and wastewater streams from/to battery limits and in between, thermodynamic properties of pure water were assumed, and the IAPWS-IF97 industrial formulation [44] was used in both liquid, vapor, and supercritical states. This can be justified by the high dilution of some streams and the lack of detailed experimental data on sewage evaporation and concentration. Although the relationship between pressure and temperature of the concentrated sewage will differ from this simplification in concentrated sludge, values of enthalpy and other extensive properties will be similar, leading to reliable energy balances. The thermodynamic properties of the mixture in the SCWO air compressor, GT admission air, reaction medium, FG, and injected streams were calculated through the Soave-Redlich-Kwong (SRK) EoS [45] using the Soave original alpha function to avoid unrealistic inflection points and breakpoints, which can be of special concern in transitions to and from super and near-critical regions [46]. SRK binary interaction coefficients were used for all compounds, and NASA polynomials [47] for ideal gas heat capacities were employed. An absolute humidity of 0.00715 kg/m3 for air containing only oxygen and nitrogen was considered in all cases. Compression and expansion operations involving shaft work were corrected using isentropic efficiencies (ηs = 0.85 in UF filtration pump, UF aeration blower, steam compressor, SCWO feed, CW pump, and GT turbo-compressor and ηs = 0.90 in GT turbo-expander and SCWO air compressor), while valve expansions were considered isenthalpic.
Since the model was based on, and limited to, experimental results, it could only be validated checking general results, behavior and trends against common industrial GT data from vendors, the CHP EPA Catalogue [48], and other field information [49,50]. Checks were carried out on the mass and energy conservation principles of local sub-systems and on the overall process throughout the code, with convergence tolerances generally set at 10−8 kg, kg/s for mass and mass flowrates, and 10−6 kJ, kW for energy balances. Basic resolution algorithms were employed and, although they were sometimes nested at multiple levels, no resolution convergence problems were found.

4. Results

The numerical model was used in three different ways; firstly, to find operating conditions that produce specific values of power exported to the grid (0, 1000, 2000, 3000 and 4073 kW) for a constant process configuration, i.e., a set of process design parameters of interest: CUF = 40 gO2 COD/L, WSCF = 9.80%W/W, WINJ = 20% and CFR = 0.385 kg CW/kg Feed, all inside the experimentally proven confidence intervals. For the sake of comparison, the TPH, fSPT pair were adjusted to enable the process to export the desired power to the grid, while the GT FG were cooled to the same set value (120 °C). The operating conditions and assessment parameters obtained are presented Table 2.
The results in Table 2 show that the proposed setup is flexible enough to obtain feasible, stable solutions for a range of power outputs, and is able to adapt to different operational requirements: the cases range from a standalone (0 kW exported) mode of operation, through increasing exported power figures, to a last case (4073 kW) which corresponds to the electricity needs of the municipality of Valladolid averaged over the year (VA Agencia Energética Municipal, 2019).
By increasing power-to-grid values, the nominal GT power increases (from 3.5 to 7.6 MW), as well as HX duties and TPH, which varies from low T values up to around the critical region (355 °C), where heat transfer problems linked to supercritical conditions can appear, aggravated by the substantial increase in E3 duty. Additionally, a marked increase in the percentage of process power needs recovered from injection is shown—including WWTP pretreatments—which almost reach complete recovery (87.5%). Inert concentration in the flash liquid outlet stream also increased, while the residual thermal flow that could be recovered from the water streams (that have been calculated as the heat flow that could be transferred to a stream of liquid water that is heated from 20 to 80 °C) decreased slightly. The main energy cost assessment parameter, EUIPEG, showed a significant 15.7% decrease along the range, in accordance with the fact that the greater the NG flowrate and GT size, the smaller the influence of the SCWO effluent injection, and the closer we came to the non-injected GT specific generation cost. It is worth noting that the best value in the series, 0.573 kWh/m3 is 70% greater than the current 0.3362 kWh/m3, but well into the common 0.33–0.60 kWh/m3 conventional WWTPs costing interval [4]. For this last case (Base Process Setup, see below), enthalpy flows and heat transfer are shown at scale in Figure 4 and Figure 5, respectively, to facilitate visualization. In Table 3, conditions of the most significant streams are shown for a specific base process setup (BPS), in order to illustrate the typical values.
Additionally, an individual parameter tendency analysis was performed around the previously greater configuration, i.e., the process exporting the yearly average of the municipality’s power needs (4073 kW) while the GT flue gases were cooled to the minimum value established (120 °C). This case is considered to be of economic and operational interest, because adopting the co-generator role could bring substantial advantages in both aspects, and was taken as the Base Process Setup (BPS) or starting point for this piece of equipment’s parameter tendency analysis. Following the variation of just one equipment parameter (among CUF [35–50 gO2 COD/L], WINJ [18–26%W/W], WSCF [11.66–28%W/W] and CFR [0.02–0.4 kg/kg]), the TPH nNG and fSPT variables were adjusted to meet BPS conditions. The main magnitudes of interest (TPH, fSPT, PRINJ, HX duties and EUI) were calculated in every case, and appear plotted in Figure 6.
In order to understand the close process inter-relations, a qualitative mechanism was devised to explain the calculated results when CUF increased (Figure 6, first column of diagrams): namely, there was (1) a decrease in water evaporation, which implied (2) a decrease in heat demand (E0, E1, E2), requiring (3) a reduction in fSPT and steam compression power, which had to be matched by (4) a decrease in power (apart from the set 4073 kW), which forced (5) a mass flowrate reduction throughout the GT, which in turn required (6) a reduction in nNG, that had to be matched (set WINJ) by (7) a reduction in SCWO top flowrate, which led to (8) a decrease in TPH and (9) in E3 duty. This hypothetical, pseudo-sequential mechanism, which is merely explanatory and deconstructive, is in fact carried out via complex, interdependent changes in duties, fSPT, TPH... dictated by simultaneous heat and power consumption and production adjusting, while meeting exported power and final FG temperature specifications. Results were an increase in PRINJ (up to more than complete recovery), a slight decrease in heat demand, E2 and E3 duties and TPH and large decreases in fSPT and E1 duty, finally leading to a substantial reduction in nNG and EUIPEG. Practical consequences were reduced operating expenses and HTAs, while lowering TPH, thus reducing near-critical condition difficulties. Similar mechanisms could be devised for the other assessed parameters, as explained in the following paragraphs.
Increasing the WINJ (second column of diagrams in Figure 6) permitted caused substantial increases in PRINJ, TPH, fSPT, E1 and E3 duties, as well as significant decreases in E2 duty and in nNG and EUIPEG. Above 23.3%, a disruption of fSPT, E2 and E3 duty patterns can be appreciated. The reason for this was a decrease in steam mass flowrate through E0 due to an inability to raise the temperature of the wastewater to meet the established MTA, which had to be compensated by an increased rise in fSPT, also causing disruption in the process power needs. The increase in E3 duty was forced by the necessary increase in TPH in order to augment the top flowrate and thus meet the increasing WINJ. The accompanying growing power production forces an upward adjustment in fSPT to be made in order to meet the specified exported power value. The practical consequences of this included substantially reduced operating expenses and HTAs, but an increase in TPH (372 °C for 25% injection), and the possibility of near-critical condition problems for the E3 duty.
Increases in WSCF above the minimum (third column of diagrams in Figure 6) incremented the water evaporation, E1 and E2 duties, while decreasing the TPH and E3 duty and maintaining the heat demand remarkably constant. As this reduction in TPH resulted in almost no variation of the top flowrate, the power production remained constant (whereas the bottom flowrate decreased substantially, augmenting the final concentration of inerts up to 1.9%W/W after flash). The practical consequences included essentially constant operating expenses and total HTAs, but a significant duty switch from E3 to E2, which along with a marked TPH reduction (down to 272 °C for 25%W/W) could reduce problems in E3. The reduced SCWO feed flowrate should also reduce reactor volume.
The implications of the CFR variation were analyzed at below the BPS value, 5.2/13.5 kg CW/kg reactor feed, considering this reduction (or equivalent) to be a foreseeable technological improvement, e.g., through more resistant alloys. As the relative CW flowrate was reduced (fourth column of diagrams in Figure 6), the energy balance in the reactor was modified, leading to an increase of up to 25% in the top to bottom flow ratio. However, since the absolute variation in the top flowrate was so small, so was the reduction in GT produced power (−2.6%). The adjustment of HPRs forced a significant decrease in both TPH and fSPT and produced an increase in the recovered shaft work and a shift of duties from E3 and E1 to E2, although the total heat demand was only slightly reduced. The practical consequences for the process comprised a reduction in operating expenses while substantially lowering the TPH, thus reducing problems in E3. A decrease in the bottom flowrate augmented the final concentration of inerts after flashing up to 0.65%W/W.
To summarize the process energy flow behavior, in order for a balanced, steady state condition to be established, all non-exported power produced by the GT must be consumed by the process and it must also take over all the heat needed to cool the FG to its final set temperature (in E2 and E3). Therefore, production HPR in GT must be matched by consumption HPR derived from the process needs, and therefore shifts between heat and power are required, on the sides of both consumption and production. As all energy loads in the process are substantially non-variable except for steam compression, fSPT can serve as a shifting mechanism between the power and heat consumed (in E2) and as a way to adjust the consumption HPR. TPH (or E3 duty) can perform a similar adjusting role for production HPR by modifying the reactor top/bottom outflows ratio— through a different unit energy balance—resulting in a different outflow split; while a change in injection flowrate causes changes in nNG and a different production HPR from GT. Both HPR adjusting mechanisms are interlinked by the fact that the sum of E2 and E3 duties must remain constant for a specific SCWO feed WSCF and flowrate. GT heat and power absolute figures are established from the nNG being burned and are restricted to meet the set WINJ.
Finally, insights from this individual trend analysis were applied in a single modification step to assess the scope for improvement. The guiding objectives throughout this work were to reduce operating costs (EUIPEG), HTAs (in particular the E3 duty), TPH and the size of the SCWO reactor. A setup where CUF was increased to 55 gO2 COD/L, WSCF to 15%W/W and WINJ to 25%, while CFR was decreased to 2.5/13.5 kg/kg feed was calculated. Those values were considered to be within foreseeable but sensible operational and technological limits. After calculation and comparison with BPS characteristics, TPH decreased to 291.7 °C, and GT nominal power to 7280 kW, the process heat demand (E2 and E3) was lowered by 9.6% and the E3 duty by 35.9% to 5334 kW, while the PRINJ increased to 113%, i.e., the injection produced 13% more power than the process required (2292 kW), including WWTP pretreatments, and the inert concentration measured 0.72%W/W in the flash liquid outlet. Overall, EUIPEG was lowered to 0.422 kWh/m3, a reduction of 26% in the BPS and 25.6% over the current WWTP, while staying within the low range of the typical energy demand (0.33–0.60 kWh/m3), and the HTA was reduced by 35.9% for E3, and 24.3% in total.
As far as retention times are concerned, experimental residence times in the reactor were in the 20–30 s range, and scaling up will most likely not change these values to a large extent. For the HXs, the calculations yield times ranging from 82 to 97 s, i.e., around 5 min in total. Therefore, the largest contribution will undoubtedly come from the UF pool. Considering the process flows and through field experience with existing commercial installations, the retention time is expected to be a few hours, which can therefore be assumed for the whole process as well. This is much shorter than cell retention times in the order of 5–10 days, depending on the operating temperature, and 20–25 days for sludge digestion, which are not uncommon in usual CAS processes, due to slow kinetics. Consequently, the proposed approach allows reducing equipment size and plant floor area. The problem of sludge generation resulting from the growth of microbial matter would also be avoided, being replaced by the production of a concentrated aqueous solution of salts and ashes, which on principle entails reduced treatment and disposal problems. Further concentration of this solution could be considered as one of the possible applications for the residual heat in the still hot FG from GT leaving the evaporators. No energy is recovered from reactor bottoms after flashing for salts and ashes concentration, or from the evaporate/condensate streams in evaporation, and this is a deliberate option. Recovery possibilities can be very diverse and depend on the specific opportunities offered by the installation’s environment. For example, a district heating use for the large condensate stream at a very suitable temperature (around 90–98 °C), and of the vapor and liquid streams after bottoms’ flash (95–98 °C) would greatly improve overall efficiency. This would also be consistent with a revamping of the municipal wastewater treatment process in cities with cold climates, where CAS treatments can present serious problems.

5. Conclusions

The proposed model process layout was able to find a range of steady state solutions for the (635,000 population equivalent) base WWTP treatment. These solutions worked with EUIs of between 0.573 and 0.680 kWh/m3, i.e., around the same order as conventional WWTPs (0.33–0.60 kWh/m3), while eliminating the sludge generation (which is replaced by a concentrated saline solution) and long retention time issues, which are reduced to the order of a few hours. The process was constrained to generate and export a minimum electrical energy (of up to 4 MW) to the grid, so that the GT could recover heat and work from the SCWO reactor effluents, with operating costs decreasing as the exported electricity increased. Depending on the operational circumstances, this requirement may be a disadvantage, but it was considered that, for instance, the co-generation of 4 MW that the municipality spends all year round on other uses could bring significant advantages. However, even the stand-alone arrangement (without electricity exports) has an EUI (0.680 kWh/ m3) only slightly higher than the conventional range. In particular, it is considered that CHP coupling entailed, in most cases, a significant—up to complete or even in excess—recovery of the heat and power invested in the concentration and SCWO reaction units.
It was also concluded that process and CHP Heat to Power Ratios (both production and consumption) adjustment is a crucial design task for the coupling, and that selecting a CHP system within the right intrinsic HPR values would have a great influence on the process thermodynamic or exergetic efficiency. Sensitive operational issues could come from the GT and flash back-pressure valves at the SCWO reactor outlets, which should work at high pressure and temperature conditions. Following the insights from individual trend analysis, it has been concluded that even modest upgrades in UF, GT injection or SCWO reactor performance would substantially reduce operating costs, such as the single improvement step that lowered operating costs to 0.422 kWh/m3, and that a process involving more efficient operations (such as multiple-effect evaporation) and fully optimized design could leave much room for improvement, especially when aiming to improve heat recovery or reduce residual enthalpy flows

Author Contributions

Conceptualization, F.A.M., M.P., M.-D.B. and Á.M.; methodology, F.A.M. and Y.G.-R.; software, F.A.M. and Y.G.-R.; validation, F.A.M., M.P., M.-D.B. and Á.M.; writing—original draft preparation, F.A.M.; writing—review and editing, Á.M.; visualization, F.A.M.; supervision, F.A.M. and Á.M.; project administration, M.-D.B. and Á.M.; funding acquisition, M.-D.B. and Á.M. All authors have read and agreed to the published version of the manuscript.

Funding

This research was funded by the Spanish Ministry of Science, grant number RTI2018-097456-B-100.

Acknowledgments

The authors acknowledge the valuable collaboration of Aquavall and the technical staff at the Camino Viejo de Simancas treatment plant, L.M. Olmedo from the Agencia Energética Municipal at Valladolid Municipality, CheEng master student María Hernando and João Paulo Silva Queiroz Departamento de Engenharia Química, Universidade Federal de São Carlos, Brasil.

Conflicts of Interest

The authors declare no conflict of interest.

Abbreviations

AFRGas turbine air to fuel ratio
BPSBase Process Setup
CHPCombined heat and power
CODChemical Oxygen Demand [gO2 COD/L]
CWCooling Water (salt solution water) in SCWO reactor
E0, E1, E2, E3HXs Economizer, Evaporators 1 and 2, SCWO pre-heater
FGFlue gas from gas turbine
GTGas turbine
HXsHeat exchangers
MTAMinimum Temperature Approach [°C]
NGNatural gas
SCWOSupercritical water oxidation
POCsProducts of combustion
UFUltrafiltration
WWTPWastewater treatment plant
Variables and parameters
εNGNG Energy to electricity efficiency [dimensionless]
εGENPower to electricity gen and distrib. efficiency [dimensionless]
ηsIsentropic efficiency [dimensionless]
CFR(SCWO CW)/(SCWO Feed) mass flowrates ratio [dimensionless]
CUFFinal ultrafiltration COD concentration [gO2 COD/L]
EUIElectrical energy use intensity [kWh/m3]
EUIPEGEUI after power export to grid [kWh/m3]
fSPTfraction of evaporate to compressor [dimensionless]
HTAHeat Transfer Area [m2]
HPRHeat to power ratio [dimensionless], [kW/kW]
LHVNGNatural gas Lower Heating Value [kJ/mol]
MTAMinimum temperature approach or minimum gradient [°C]
nNGNatural gas consumption molar flowrate [mol/s]
PRINJ% power needs recovered by injection [%]
qRESSum of residual thermal flows [kW]
TPHFinal E3 pre-heating temperature [°C]
TRECFinal FG recovery temperature [°C]
WSCFSCWO Feed COD mass fraction [%W/W, weight percent]
WINJInjection mass percentage over Gas turbine air [%]

References

  1. Van Loosdrecth, M.C.M.; Brdjanovic, D. Anticipating the next century of wastewater treatment. Science 2014, 344, 1452–1453. [Google Scholar] [CrossRef]
  2. Raheem, A.; Sikarwar, V.S.; He, J.; Dastyar, W.; Dionysiou, D.D.; Wang, W.; Zhao, M. Opportunities and challenges in sustainable treatment and resource reuse of sewage sludge: A review. Chem. Eng. J. 2018, 337, 616–641. [Google Scholar] [CrossRef]
  3. Ahmed, M.B.; Zhou, J.L.; Ngo, H.H.; Guo, W.; Thomaidis, N.S.; Xu, J. Progress in the biological and chemical treatment technologies for emerging contaminant removal from wastewater: A critical review. J. Hazard. Mater. 2017, 323, 274–298. [Google Scholar] [CrossRef]
  4. Guven, H.; Dereli, R.K.; Ozgun, H.; Ersahin, M.E.; Ozturk, I. Towards sustainable and energy efficient municipal wastewater treatment by up-concentration of organics. Prog. Energy Combust. Sci. 2019, 70, 145–168. [Google Scholar] [CrossRef]
  5. Zhang, Q.; Hu, J.; Lee, D.-J.; Chang, Y.; Lee, Y.J. Sludge treatment: Current research trends. Bioresour. Technol. 2017, 243, 1159–1172. [Google Scholar] [CrossRef]
  6. Liu, Y.J.; Gu, J.; Liu, Y. Energy self-sufficient biological municipal wastewater reclamation: Present status, challenges and solutions forward. Bioresour. Technol. 2018, 269, 513–519. [Google Scholar] [CrossRef] [PubMed]
  7. Shizas, I.; Bagley, D.M. Experimental Determination of Energy Content of Unknown Organics in Municipal Wastewater Streams. J. Energy Eng. 2004, 130, 45–53. [Google Scholar] [CrossRef]
  8. Garrido, J.M.; Fdz-Polanco, M.; Fdz-Polanco, F. Working with energy and mass balances: A conceptual framework to understand the limits of municipal wastewater treatment. Water Sci. Technol. 2013, 67, 2294–2301. [Google Scholar] [CrossRef] [PubMed]
  9. Gude, V.G. Energy and water autarky of wastewater treatment and power generation systems. Renew. Sustain. Energy Rev. 2015, 45, 52–68. [Google Scholar] [CrossRef]
  10. Gu, Y.; Li, Y.; Li, X.; Luo, P.; Wang, H.; Wang, X.; Wu, J.; Li, F. Energy Self-sufficient Wastewater Treatment Plants: Feasibilities and Challenges. Energy Procedia 2017, 105, 3741–3751. [Google Scholar] [CrossRef]
  11. Kruse, A.; Dinjus, E. Hot compressed water as reaction medium and reactant: Properties and synthesis reactions. J. Supercrit. Fluids 2007, 39, 362–380. [Google Scholar] [CrossRef]
  12. Bermejo, M.; Cocero, M.J. Supercritical water oxidation: A technical review. AIChE J. 2006, 52, 3933–3951. [Google Scholar] [CrossRef]
  13. Kruse, A.; Dinjus, E. Hot compressed water as reaction medium and reactant: 2. Degradation reactions. J. Supercrit. Fluids 2007, 41, 361–379. [Google Scholar] [CrossRef]
  14. Cabeza, P.; Queiroz, J.; Arca, S.; Jiménez, C.; Gutiérrez, A.; Bermejo, M.; Cocero, M.J. Sludge destruction by means of a hydrothermal flame. Optimization of ammonia destruction conditions. Chem. Eng. J. 2013, 232, 1–9. [Google Scholar] [CrossRef]
  15. Marrone, P.A. Supercritical water oxidation—Current status of full-scale commercial activity for waste destruction. J. Supercrit. Fluids 2013, 79, 283–288. [Google Scholar] [CrossRef]
  16. Vadillo, V.; Sánchez-Oneto, J.; Portela, J.R.; de la Ossa, E.J.M. Chapter 10-Supercritical Water Oxidation. In Advanced Oxidation Processes for Waste Water Treatment; Academic Press: London, UK, 2018; pp. 333–358. [Google Scholar]
  17. Qian, L.; Wang, S.; Xu, D.; Guo, Y.; Tang, X.; Wang, L. Treatment of municipal sewage sludge in supercritical water: A review. Water Res. 2016, 89, 118–131. [Google Scholar] [CrossRef] [PubMed]
  18. Zhang, S.; Zhang, Z.; Zhao, R.; Gu, J.; Liu, J.; Örmeci, B.; Zhang, J.A. Review of Challenges and Recent Progress in Supercritical Water Oxidation of Wastewater. Chem. Eng. Commun. 2017, 204, 265–282. [Google Scholar] [CrossRef]
  19. Xu, D.; Huang, C.; Wang, S.; Lin, G.; Guo, Y. Salt deposition problems in supercritical water oxidation. Chem. Eng. J. 2015, 279, 1010–1022. [Google Scholar] [CrossRef]
  20. Fauvel, E.; Joussot-Dubien, C.; Guichardon, P.; Charbit, G.; Charbit, F.; Sarrade, S. A double-wall reactor for hydrothermal oxidation with supercritical water flow across the inner porous tube. J. Supercrit. Fluids 2004, 28, 47–56. [Google Scholar] [CrossRef]
  21. Lee, H.-C.; In, J.-H.; Lee, S.-Y.; Kim, J.-H.; Lee, C.-H. An anti-corrosive reactor for the decomposition of halogenated hydrocarbons with supercritical water oxidation. J. Supercrit. Fluids 2005, 36, 59–69. [Google Scholar] [CrossRef]
  22. Chen, Z.; Wang, G.; Yin, F.; Chen, H.; Xu, Y. A new system design for supercritical water oxidation. Chem. Eng. J. 2015, 269, 343–351. [Google Scholar] [CrossRef]
  23. Chen, Z.; Chen, H.; Liu, X.; He, C.; Yue, D.; Xu, Y. An inclined plug-flow reactor design for supercritical water oxidation. Chem. Eng. J. 2018, 343, 351–361. [Google Scholar] [CrossRef]
  24. Yang, J.; Wang, S.; Li, Y.; Zhang, Y.; Xu, D. Novel design concept for a commercial-scale plant for supercritical water oxidation of industrial and sewage sludge. J. Environ. Manag. 2019, 233, 131–140. [Google Scholar] [CrossRef] [PubMed]
  25. Cabeza, P.; Queiroz, J.P.S.; Criado, M.; Jiménez, C.; Bermejo, M.D.; Mato, F.A.; Cocero, M.J. Supercritical water oxidation for energy production by hydrothermal flame as internal heat source. Experimental results and energetic study. Energy 2015, 90, 1584–1594. [Google Scholar] [CrossRef] [Green Version]
  26. Queiroz, J.; Bermejo, M.; Mato, F.A.; Cocero, M.J. Supercritical water oxidation with hydrothermal flame as internal heat source: Efficient and clean energy production from waste. J. Supercrit. Fluids 2015, 96, 103–113. [Google Scholar] [CrossRef]
  27. Xu, D.; Wang, S.; Tang, X.; Gong, Y.; Guo, Y.; Wang, Y.; Zhang, J. Design of the first pilot scale plant of China for supercritical water oxidation of sewage sludge. Chem. Eng. Res. Des. 2012, 90, 288–297. [Google Scholar] [CrossRef]
  28. Marias, F.; Mancini, F.; Cansell, F.; Mercadier, J. Energy recovery in supercritical water oxydation process. Environ. Eng. Sci. 2008, 25, 123–130. [Google Scholar] [CrossRef]
  29. García-Rodríguez, Y.; Mato, F.A.; Martín, A.; Bermejo, M.D.; Cocero, M.J. Energy recovery from effluents of supercritical water oxidation reactors. J. Supercrit. Fluids 2015, 104, 1–9. [Google Scholar] [CrossRef] [Green Version]
  30. Barry, P.F.; Somers, S.L.; Londerville, S.B.; Ahn, K.; Anderson, K. Chap. 7-Duct Burn. In Heat Recovery. Steam Generator Technology; Eriksen, V., Ed.; Woodhead Publishing: Cambridge, UK, 2017; pp. 115–144. [Google Scholar]
  31. iAgua Data. Available online: https://www.iagua.es/data/infraestructuras/edar/sur (accessed on 1 July 2021).
  32. Heidrich, E.S.; Curtis, T.P.; Dolfing, J. Determination of the Internal Chemical Energy of Wastewater. Environ. Sci. Technol. 2011, 45, 827–832. [Google Scholar] [CrossRef]
  33. Gyobu, T.; Inoue, M.; Soda, S.; Ike, M. Energy Content of Organics in Municipal Wastewater Treatment Streams at Tsumori Wastewater Treatment Plant. J. Water Environ. Technol. 2015, 13, 89–97. [Google Scholar] [CrossRef] [Green Version]
  34. Gutiérrez Ortiz, F.J.; Kruse, A. The use of process simulation in supercritical fluids applications. React. Chem. Eng. 2020, 5, 424–451. [Google Scholar] [CrossRef]
  35. Cocero, M.J.; Alonso, E.; Sanz, M.T.; Fdz-Polanco, F. Supercritical water oxidation process under energetically self-sufficient operation. J. Supercrit. Fluids 2001, 24, 37–46. [Google Scholar] [CrossRef]
  36. Zhang, F.; Su, C.; Chen, Z.; Chen, J. Experimental study on the mixing characteristics inside an inner preheating transpiring-wall reactor for supercritical water oxidation. J. Supercrit. Fluids 2020, 156, 104682. [Google Scholar] [CrossRef]
  37. Nascimento, T.A.; Fdz-Polanco, F.; Peña, M. Membrane-Based Technologies for the Up-Concentration of Municipal Wastewater: A Review of Pretreatment Intensification. Sep. Purif. Rev. 2020, 49, 1–19. [Google Scholar] [CrossRef]
  38. Nascimento, T.A.; Peña, M. Control strategies for the long-term operation of direct membrane filtration of municipal wastewater. J. Environ. Chem. Eng. 2021, 9, 105335. [Google Scholar] [CrossRef]
  39. Nascimento, T.A.; Peña, M. Continuous municipal wastewater up-concentration by direct membrane filtration, considering the effect of intermittent gas scouring and threshold flux determination. J. Water Process. Eng. 2021, 39, 101733. [Google Scholar] [CrossRef]
  40. Linnhoff, B. Pinch Analysis and Process Integration, 2nd ed.; Kemp, I.C., Ed.; Butterworth-Heinemann: Woburn, MA, USA, 2007. [Google Scholar]
  41. Rice, I. Steam-Injected Gas Turbine Analysis: Steam Rates. ASME. J. Eng. Gas Turbines Power 1995, 117, 347–353. [Google Scholar] [CrossRef]
  42. Rad, E.A.; Kazemiani-Najafabadi, P. Thermo-environmental and economic analyses of an integrated heat recovery steam-injected gas turbine. Energy 2017, 141, 1940–1954. [Google Scholar]
  43. Kayadelen, H.K.; Ust, Y. Thermodynamic, environmental and economic performance optimization of simple, regenerative, STIG and RSTIG gas turbine cycles. Energy 2017, 121, 751–771. [Google Scholar] [CrossRef]
  44. Wagner, W.; Cooper, J.R.; Dittmann, A.; Kijima, J.; Kretzschmar, H.-J.; Kruse, A.; Mareš, R.; Oguchi, K.; Sato, H.; Stöcker, I.; et al. The IAPWS Industrial Formulation 1997 for the Thermodynamic Properties of Water and Steam. J. Eng. Gas Turbines Power 2000, 122, 150–184. [Google Scholar] [CrossRef]
  45. Soave, G. Equilibrium constants from a modified Redlich-Kwong equation of state. Chem. Eng. Sci. 1972, 27, 1197–1203. [Google Scholar] [CrossRef]
  46. Neau, E.; Raspo, I.; Escandell, J.; Nicolas, C.; Hernández-Garduza, O. The Soave, Twu and Boston–Mathias alpha functions in cubic equations of state. Part II. Modeling of thermodynamic properties of pure compounds. Fluid Phase Equilibria 2009, 276, 156–164. [Google Scholar] [CrossRef]
  47. McBride, B.J.; Gordon, S.; Reno, M.A. Coefficients for Calculating Thermodynamic and Transport Properties of Individual Species; NASA: Moffett Field, CA, USA, 1993.
  48. Darrow, K.; Tidball, R.; Wang, J.; Hampson, A. Catalog of CHP Technology; Environmental Protection Agency: New York, NY, USA, 2017.
  49. Kehlhofer, R. Combined-Cycle Gas & Steam Turbine Power Plants, 3rd ed.; PennWell: Tulsa, OK, USA, 2009. [Google Scholar]
  50. Fernández-Polanco, D.; Tatsumi, H. Optimum energy integration of thermal hydrolysis through pinch analysis. Renew. Energy 2016, 96, 1093–1102. [Google Scholar] [CrossRef]
Figure 1. Process block diagram.
Processes 09 01237 g001
Figure 2. Calculation flowchart.
Processes 09 01237 g002
Figure 3. Schematic diagram of a Cooled Wall SCWO Reactor.
Processes 09 01237 g003
Figure 4. Shaft work, convective and thermal enthalpy transfer Sankey diagram (width at scale, kW), Base Process Setup (red: natural gas and power, orange: exhaust gasses, green: wastewater, blue: water).
Processes 09 01237 g004
Figure 5. Temperature profile of hot and cold streams vs. transferred heat along HXs (Base Process Setup).
Processes 09 01237 g005
Figure 6. Tendencies on individual equipment parameter variations: {TPH, fSPT, PRINJ, HXs duties, EUI} vs. {CUF, WINJ, WSCF, CFR}; HXs duties: [–o–E0], [–*–E1], [–x–E2], [–□–E3].
Processes 09 01237 g006
Table 1. Municipal wastewater characterization (average values).
Total Solids (TS)950 mg/L
Total Suspended Solids (TSS)400 mg/L
Volatile Suspended Solids (VSS)310 mg/L
COD (Total)547 mg/L
COD (Soluble)170 mg/L
COD (Particulate)377 mg/L
Total Kjeldahl Nitrogen (N-TKN)60 mg/L
Ammonia Nitrogen (N-NH4+)23 mg/L
Phosphorus (Total)9 mg/L
Table 2. Process conditions for different exported power cases.
Power Exported to Grid01000200030004073kW
TPH186.0222.5258.3292.1324.9°C
fSPT0.6810.6500.6200.5910.560[dimensionless]
nNG12.0314.6217.2619.9122.77mol/s
Total GT power35484535552365127573kW
Power needs of the process26342621260925982586kW
PRINJ (% power recov. injection)28.243.057.571.987.5%
Heat to power ratio (HPR)2.713.374.404.715.79[dimensionless]
EUIPEG0.6800.6510.6250.6000.573kWh/m3
Thermal needs of the process7143884110,54312,24614,075kW
HTA total788.6902.91018.31134.21258.9m2
E0 duty41084108410841084108kW
E1 duty86418240786174937104kW
E2 duty42134613499253615750kW
E3 duty29304428555168858325kW
E0 HTA52.552.552.552.552.5m2
E1 HTA239.7228.6218.1207.9197.1m2
E2 HTA271.7297.5321.9345.73708m2
E3 HTA224.8324.3425.8528.1638.6m2
% heat recovered in E0, E175.272.870.668.466.1%
Water streams residual thermal flow15,29415,07114,81614,54614,248kW
Vapor flash mass flowrate4.5974.3944.1873.9793.754kg/s
Liquid flash mass flowrate6.6736.3786.0785.7765.450kg/s
Inerts%W/W in liquid flash0.320.340.350.370.39%W/W
Table 3. Conditions for some significant streams (Base Process Setup) as labeled in Figure 1. Organic matter (COD) as total solids equivalent mass flowrate; salts and ashes as inert equivalent mass flowrate; composition in mass fraction (W/W).
TPfmSCODmInertO2 N2 CO2 H2O
Stream(°C) (bar)(kg/s) (kg/s) (kg/s)(W/W)(W/W)(W/W)(W/W)
1Wastewater inlet15.00.9331424.61.32600.0285---0.9990
2E0 liquid inlet15.00.93313.6890.93180.0215---0.9304
3E1 liquid inlet87.70.93313.6890.93180.0215---0.9304
4E2 inlet97.70.93313.6890.93180.0215---0.9304
7E1 vapor inlet135.31.3263.0895-----1.0000
10E0 vapor inlet97.70.9332.4199-----1.0000
20E2 bottom outlet97.70.9338.17950.93180.0215---0.8835
22E3 supercritical outlet344.92308.17950.93180.0215---0.8835
25Reactor top outlet700.02304.8384--0.00570.40610.22650.3617
26Reactor bottom outlet300.02308.9624-0.0215---0.9974
29Reactor air inlet296.12302.4706------
32E2 Flue gas inlet535.41.83327.929--0.1260.64690.10800.1190
34E2 Flu gas outlet120.10.93327.929--0.1260.64690.10800.1190
Publisher’s Note: MDPI stays neutral with regard to jurisdictional claims in published maps and institutional affiliations.

